1. Introduction
Free-space optical communication has seen a surge in interest, both for terrestrial first and last mile solutions, as well as optical satellite communication [
1,
2]. Current efforts have focused on utilizing the short-wave infrared (SWIR) atmospheric transmission window, containing the 1530–1565 nm C-band used in telecommunications. Successful demonstrations utilizing these wavelengths include the SOLISS terminal bidirectional link between the International Space Station (ISS) and an optical ground station at the National Institute of Information and Communications Technology (NICT) in 2019, as well as an inter-satellite demonstration between the CubeSOTA and ETS9-HICALI satellites in 2019 [
3,
4]. However, SWIR communication suffers significantly from scintillation, scattering, and weather effects. The 3–5
mid-infrared (MWIR) atmospheric transmission window should offer improved signal-to-noise ratio and resistance to these adverse effects and could lead to higher link availability and reliability [
5,
6]. A previous review from our research group expanded on the benefits of the MWIR band and identified cascade lasers, as well as difference frequency generation (DFG) using nonlinear optical crystals, as the most promising lasers for use in MWIR transmitters [
7,
8,
9]. Cascade lasers offer large modulation bandwidths and can cover the entire MWIR spectrum, but typically operate between 77 and 250 K, which is inconvenient for many applications [
10,
11]. DFG offers room temperature operation and large modulation bandwidths, with the potential to achieve up to watt-level continuous-wave output power [
12]. Typically, OPOs are used due to their resonant structure offering high output powers and tunable output wavelengths. However, the use of DFG allows us to inject a C-band signal beam, offering multi-gigabit per second modulation speeds, which can be faster than directly modulating the OPO pump beam [
8]. In this paper, we aim to address the lack of high-efficiency intracavity MWIR lasers by presenting a novel DFG laser that uses a simplified linear cavity to reduce the size and sensitivity to alignment and to achieve high efficiency. The laser is stable while free running with no need for external cavity stabilization or locking. In the cavity, only the pump is resonant, as the signal is coupled into the cavity and the idler is coupled out of the cavity in a single pass. We see this as the first step to demonstrating a viable high-power mid-infrared source capable of high-speed modulation.
A common metric used to evaluate DFG frequency converters is DFG efficiency, presented according to the formula in Equation (1):
Efficiency is expressed in units of
. Here,
is the output DFG power,
is the input pump power directly before the nonlinear crystal, and
is the input signal power directly before the nonlinear crystal. However, this approach does not consider the efficiencies and coupling losses of the pump and signal sources, which can be important in power-limited scenarios where maximizing efficiency is key. So, from a practical application point of view, an interesting metric to compare the efficiency of various DFG structures is the black-box efficiency with units of
, presented here as Equation (2):
where
is the diode pumping efficiency for the fiber pump source and
is the diode pumping efficiency of the fiber signal source, assuming fiber lasers are used as pump and signal sources. We mention fiber pump and signal sources specifically as these are commonly used for pumping both DFG and OPO structures. Many of the presented structures in the following section make use of 1064 nm Yb-doped fiber lasers (pumped by 9xx nm diode laser) as pump sources. These have optical-to-optical efficiencies of ~60%, so a value of
was assumed for these fiber lasers [
13]. For devices using direct 1064 nm diode pumping, there is no additional optical conversion step, and so a value of
can be used. To summarize, the pump value should be the input optical pump power when treating the system as a black box: For direct diode pumping, no modification is needed, while pumping via an added amplification stage requires one to account for the amplifier efficiency. For the signal fiber, erbium-doped fiber amplifiers (EDFAs) are often used. Unfortunately, it is harder to find a standard operating efficiency for the pump diodes in EDFAs, and most authors only include the output power from the EDFA (
). Thus, we have assumed
for all EDFAs so that they can be easily compared. This does increase the overall efficiency reported in this paper, so we mention this to avoid claims of inflating the efficiency values intentionally. While we do not claim that our device has the highest DFG efficiency reported, we do claim that it has the highest black-box efficiency among the bulk crystal, free-running DFG devices we have reviewed.
We performed a literature review of state-of-the-art single pass and intracavity mid-infrared bulk DFG devices. In 2020, Guha et al. reported a single-pass DFG configuration, emitting 3.55 W at 3400 nm with 43.3 W 1064 nm via fiber laser pump and 31 W 1550 nm signal via EDFA, corresponding to a DFG efficiency of 0.264
and a black-box efficiency of 0.
[
14]. In 2019, Huang et al. demonstrated 60 mW of DFG power at 3393 nm for 1 W of 1064 nm fiber laser pump and 1 W of 1550 nm, corresponding to a DFG efficiency of 5.8
and a black-box efficiency of 2.43
, which accounts for the additional loss of the wavelength division multiplexer used [
15]. Huang et al.’s cavity is also actively stabilized via dither-locking. These devices represent the highest efficiency single-pass and intracavity efficiencies we found, respectively, but other devices were reviewed with efficiencies in the same order of magnitude [
16,
17,
18,
19,
20]. These works serve as a representative sample of the state-of-the-art for bulk crystals. Additionally, waveguides allow for tight confinement of the pump and signal beams over the entire length of the nonlinear medium, which boosts efficiency versus bulk crystals. For example, the highest efficiency mid-infrared waveguide nonlinear frequency converter we found has an internal DFG efficiency of 100
and a black-box efficiency of 60
[
21]. However, the reported coupling losses are ~−17 dB for both the pump and signal, which would lower the black-box efficiency to less than 1%/W. Hu et al. demonstrated a high-efficiency coupler that could reduce losses for similar thin-film lithium niobate devices to −0.5 dB [
22]. Should this low insertion loss be coupled with a high-efficiency waveguide device, it would have much higher efficiency than the bulk crystal devices reviewed above [
23,
24]. For now, the main niche for bulk devices is relative cost, ease of manufacturing, and ease of use. Nonlinear waveguide properties are critically dependent on their fabrication quality, as even small imperfections can degrade the final performance [
25]. So, in the short term, bulk crystals remain easy to source off the shelf with a high level of quality, and linear cavities like the one presented in this manuscript are easy to set up and align. However, as manufacturing continues to improve, waveguide-based mid-infrared sources will be preferable to bulk crystals for many applications. As such, we want to make it clear we limit the novelty claim for our device to bulk crystal devices.
In this work, we implement a hemispherical cavity using Nd:YVO4 as a gain medium to produce a 1064 nm pump. The resonator contains a periodically poled lithium niobate (PPLN) nonlinear crystal, as well as a dichroic mirror that couples an amplified tunable C-band laser into the cavity. We obtained a black-box efficiency of 2.20, emitting at 3499 nm with 4.5 W 808 nm pump and 310 mW of 1529 nm signal. This device offers the highest black-box efficiency for bulk nonlinear crystal frequency converters in a linear cavity without the use of active cavity stabilization. Additionally, our modeling work shows good agreement with experimental results.
The manuscript is structured as follows. In
Section 2, a schematic of the experimental setup is provided alongside manufacturer part numbers for all equipment used. This section also includes a summary of the theoretical modeling that was used to predict the experimental results, showing good agreement. In
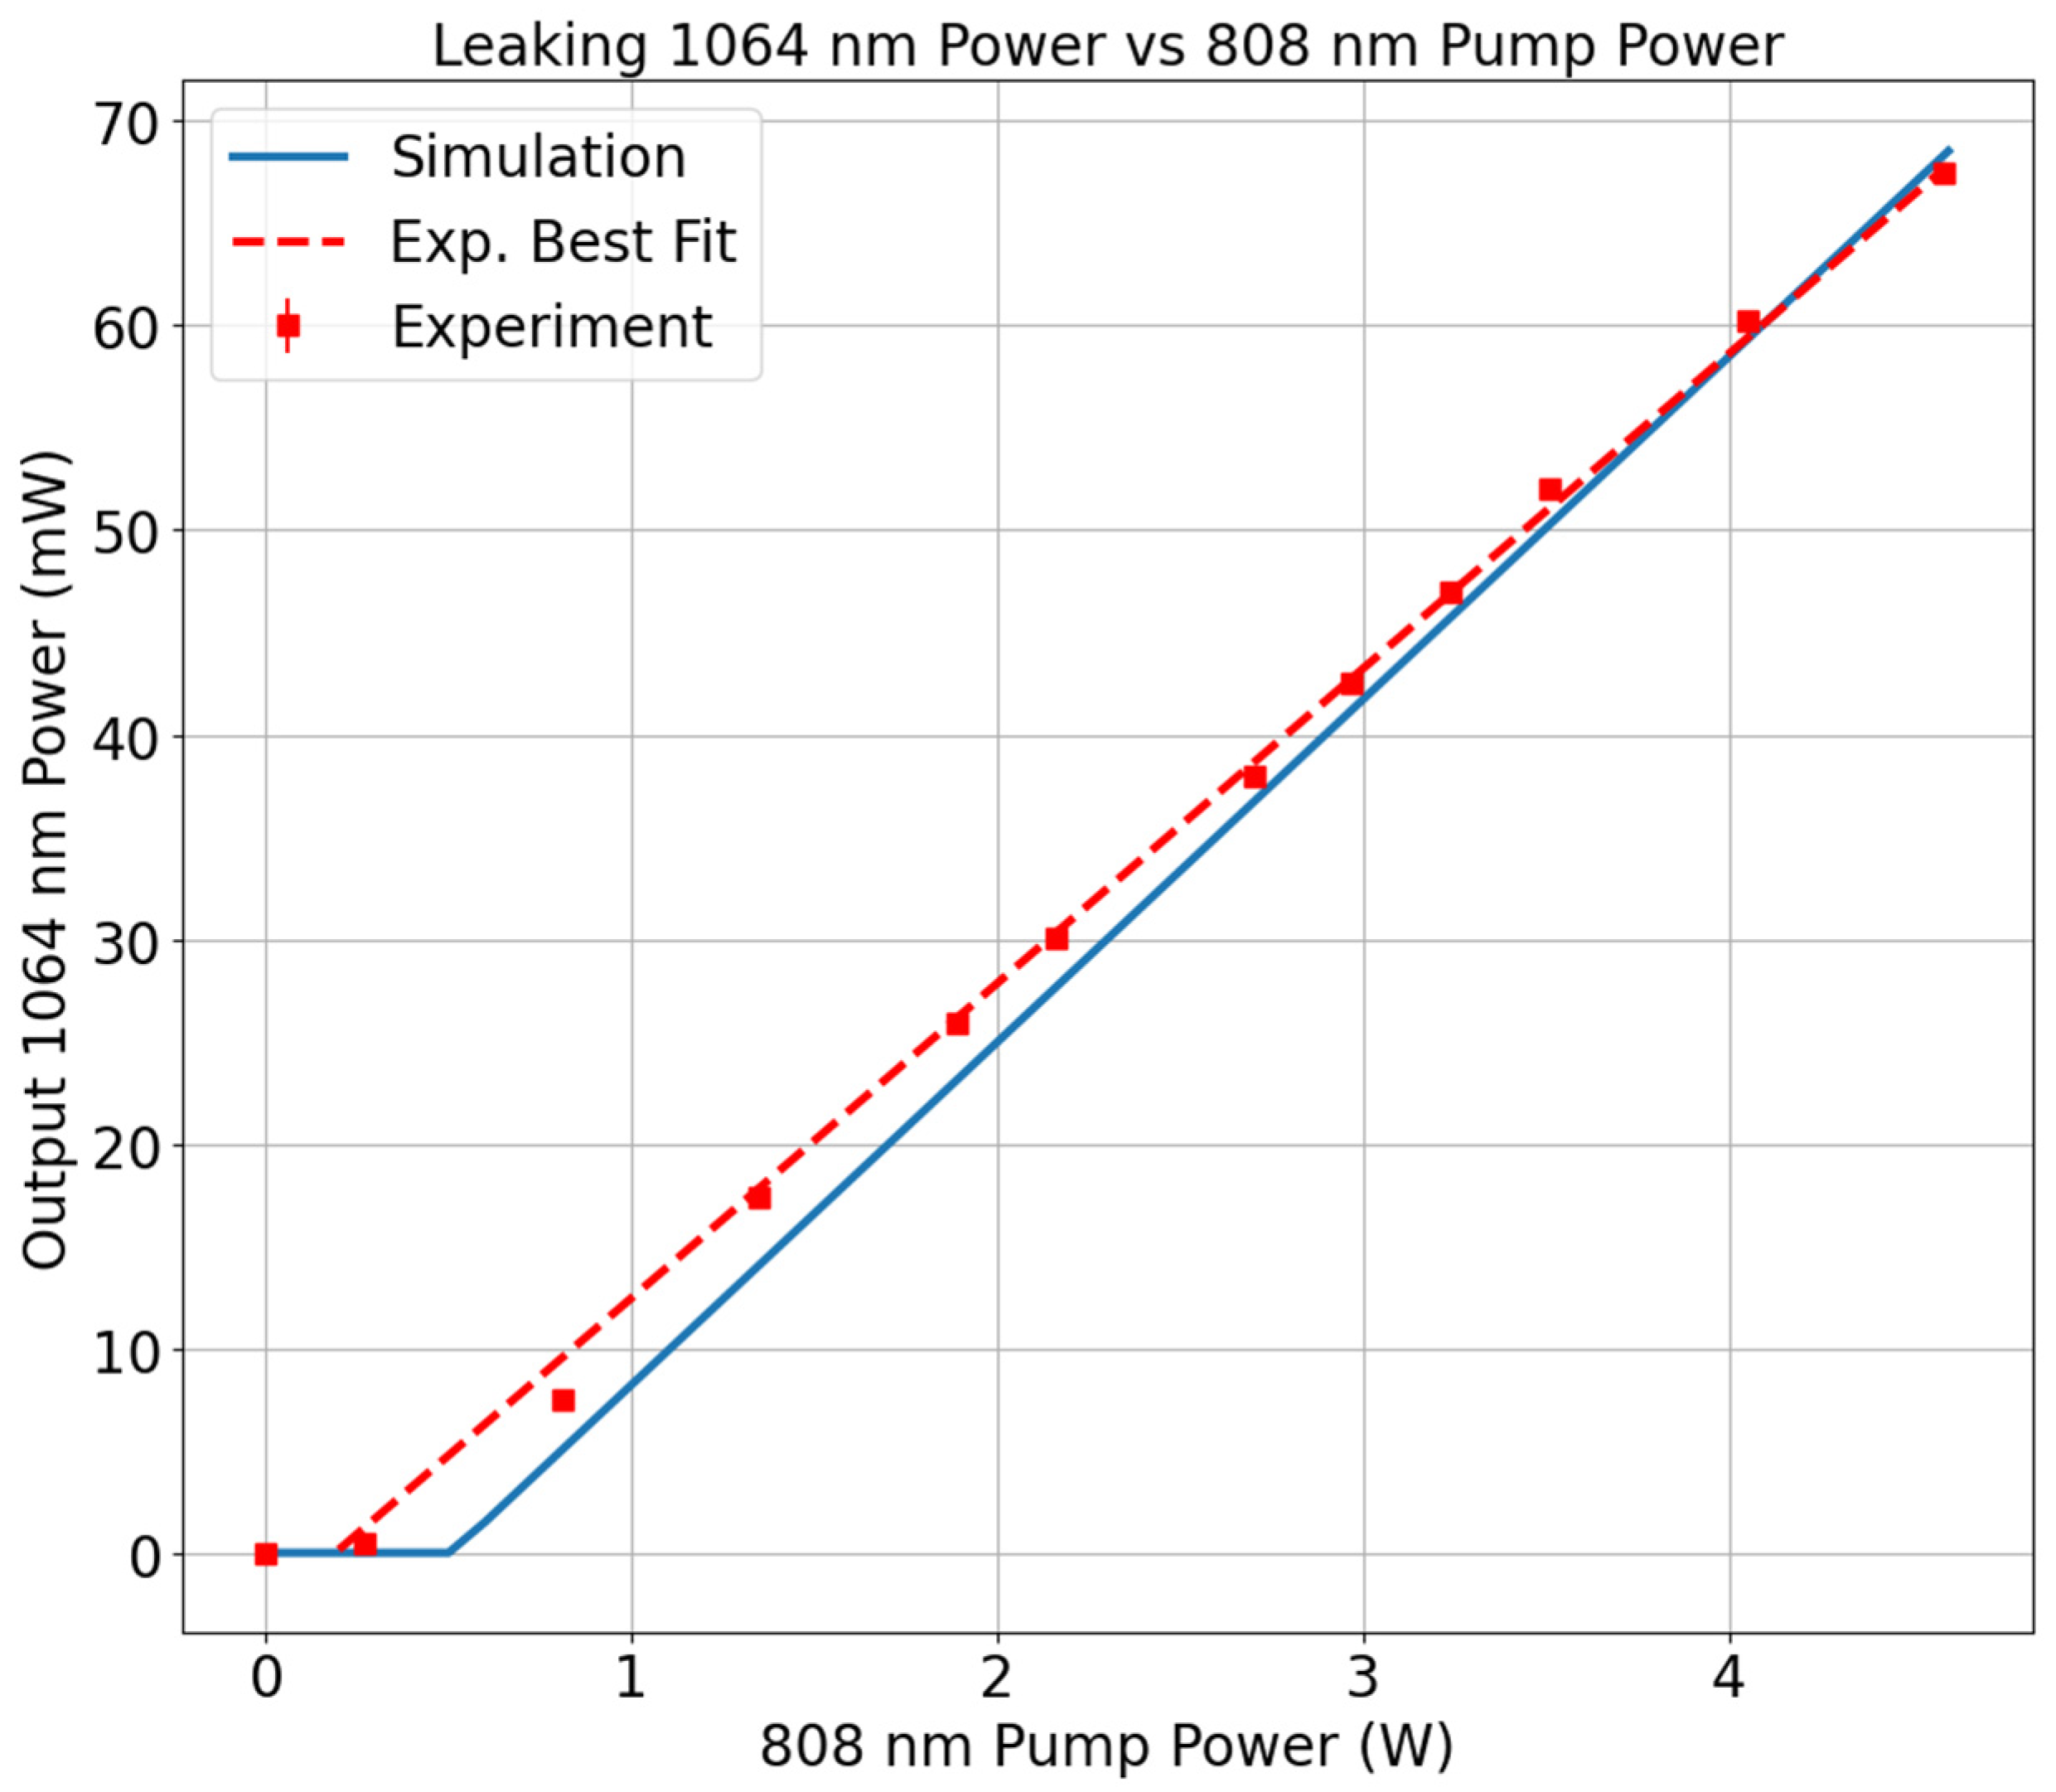
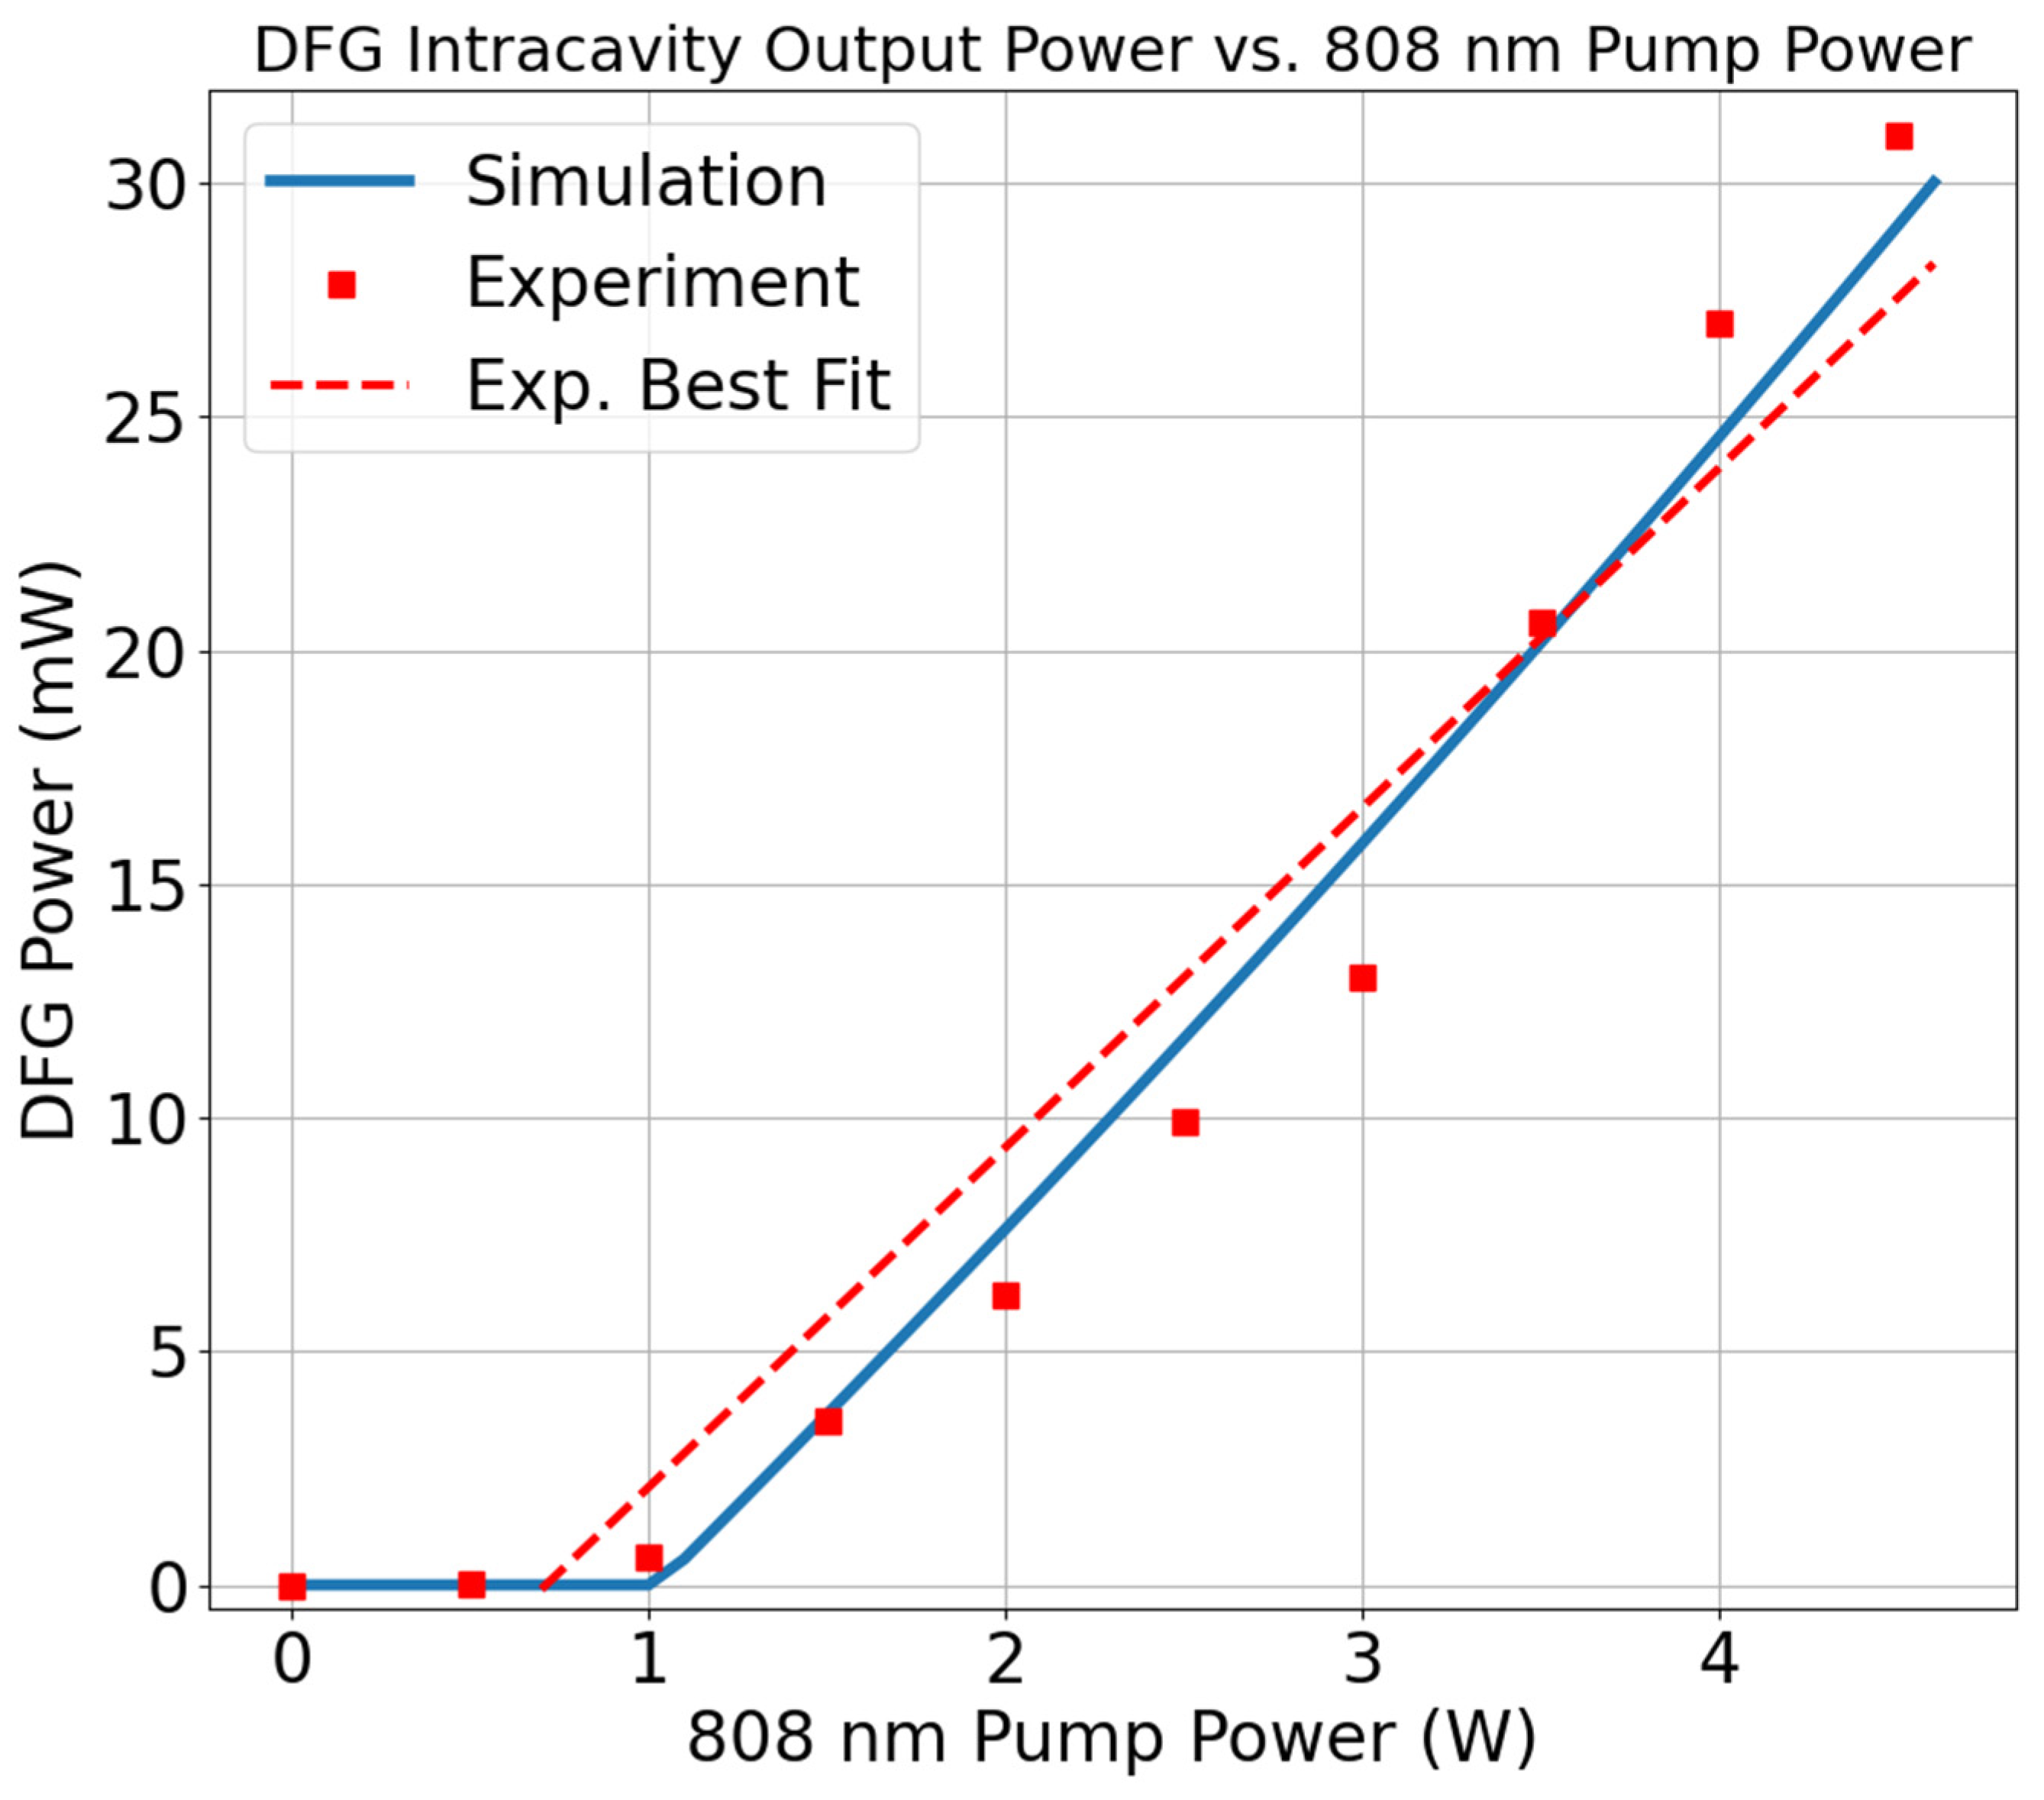
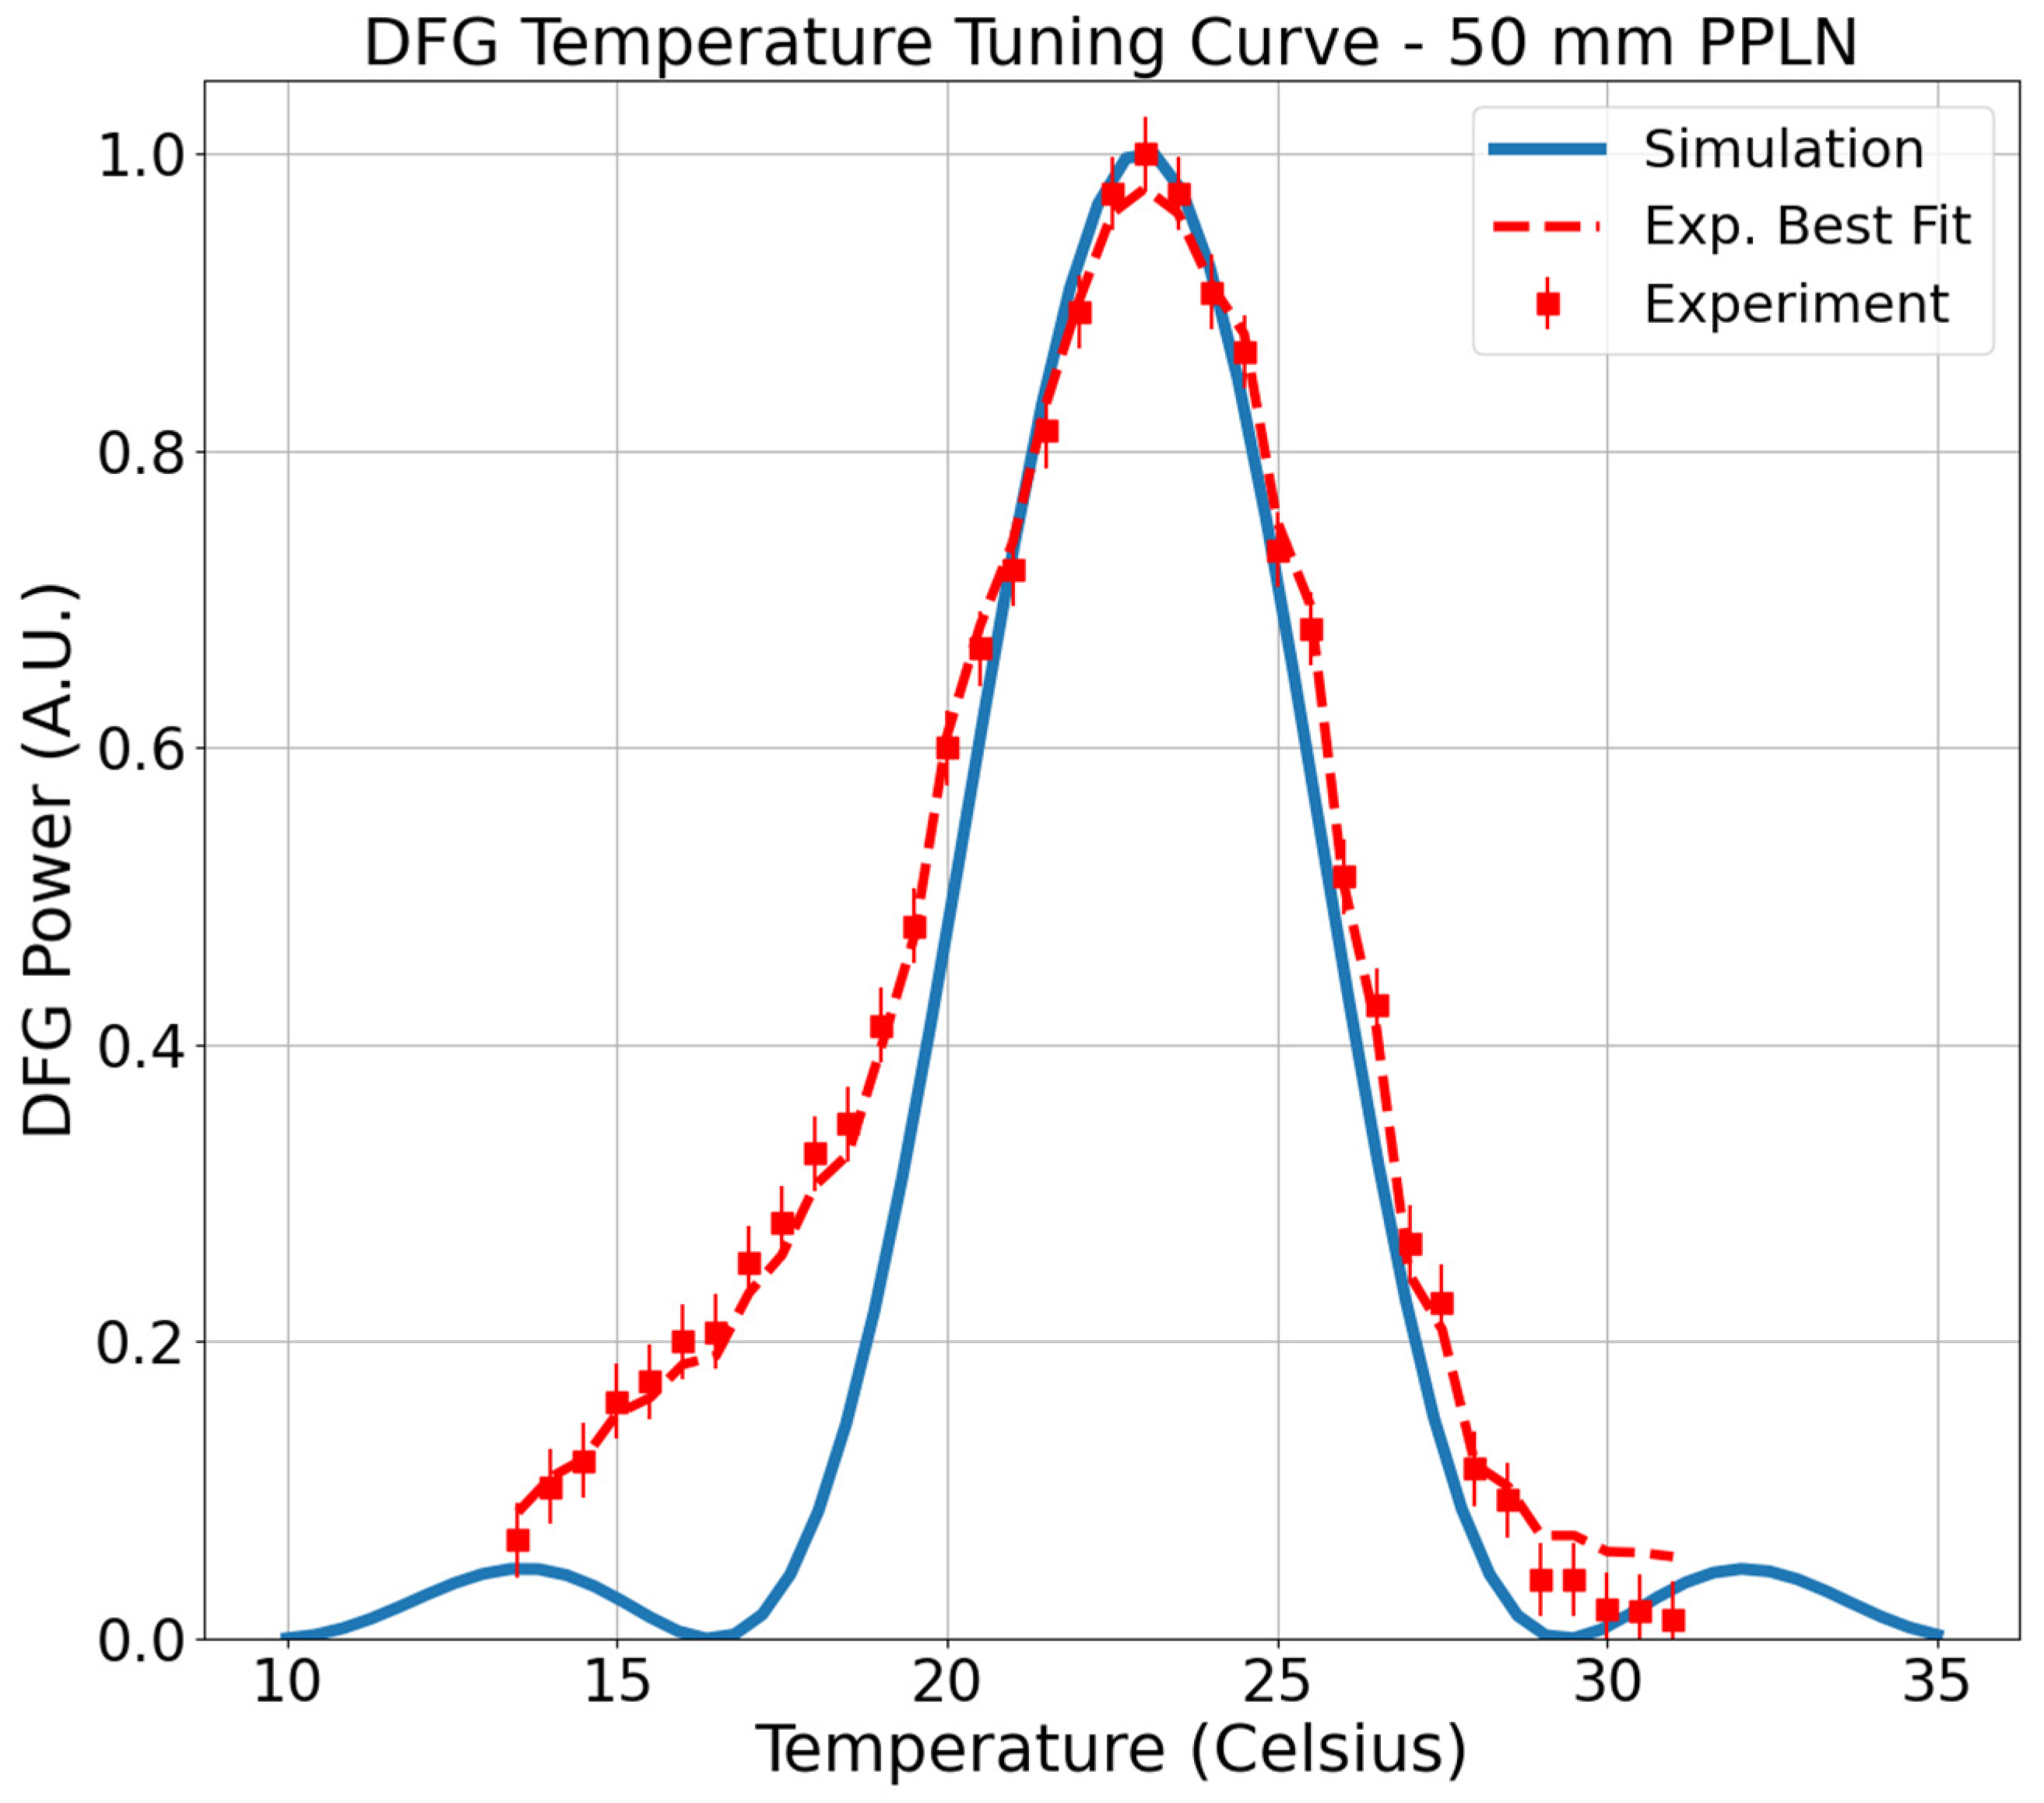
Section 3, experimental results for the output 1064 nm and DFG power at 3.5 microns are presented, as well as the output DFG power as a function of temperature. Experimental results are presented with best-fit lines alongside the simulation curves. In
Section 4, we discuss the experimental results, as well as potential future work and gaps in the analysis performed. Finally,
Section 5 concludes the paper by summarizing the results and important takeaways from the work presented here.
2. Materials and Methods
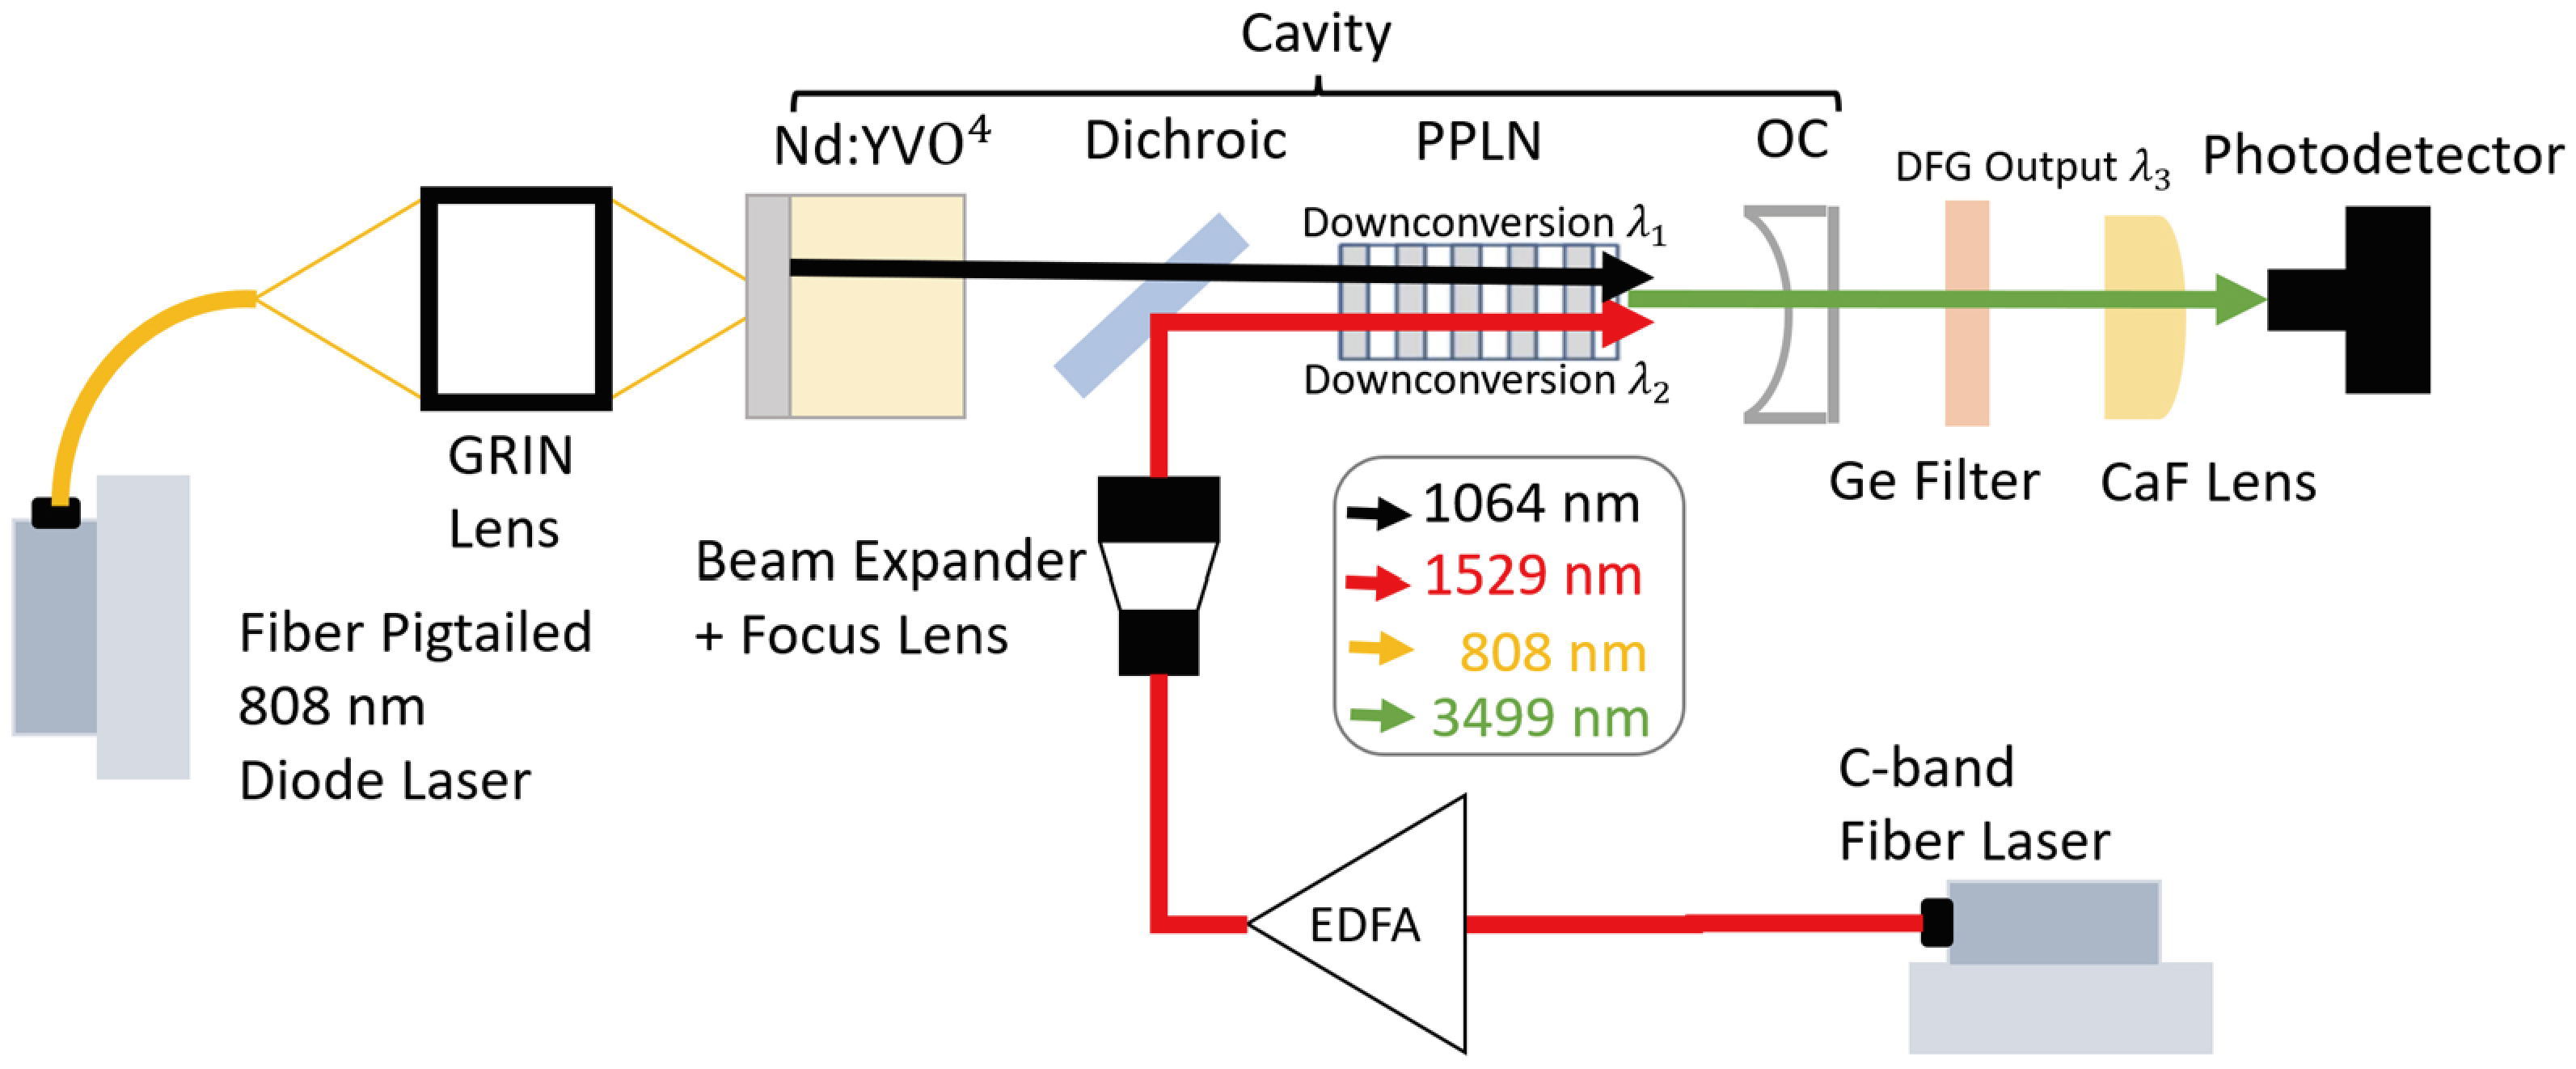
A schematic diagram of the experimental cavity setup is depicted in
Figure 1. It consists of a diode-pumped solid-state (DPSS) laser resonator (Nd:YVO
4, Dientech, Chengdu, China) with a PPLN nonlinear crystal inserted into the cavity. The hemispherical resonator was intentionally selected as it allows for a compact cavity setup and is easy to align. Additionally, this linear cavity requires no active stabilization as we have demonstrated experimentally. This reduces complexity and costs without the need for piezoelectric transducers or lock-in amplifiers to facilitate long-term cavity stability. The following cavity parameters were designed with the help of reZonator, an open-source cavity modeling software capable of modeling arbitrary optical systems [
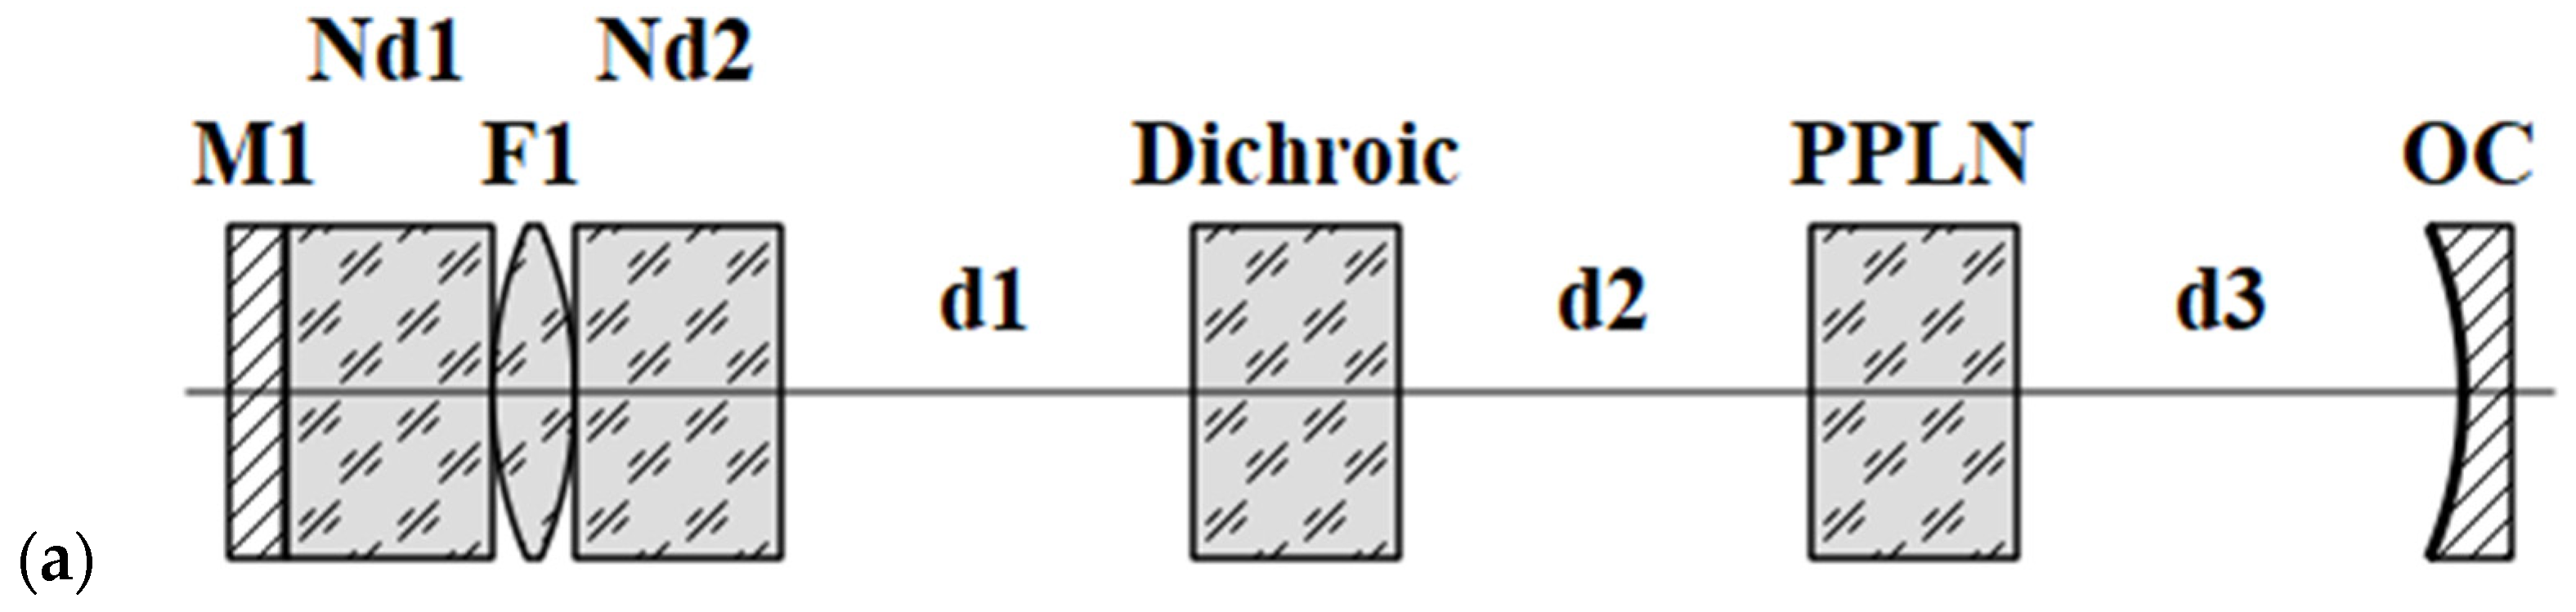
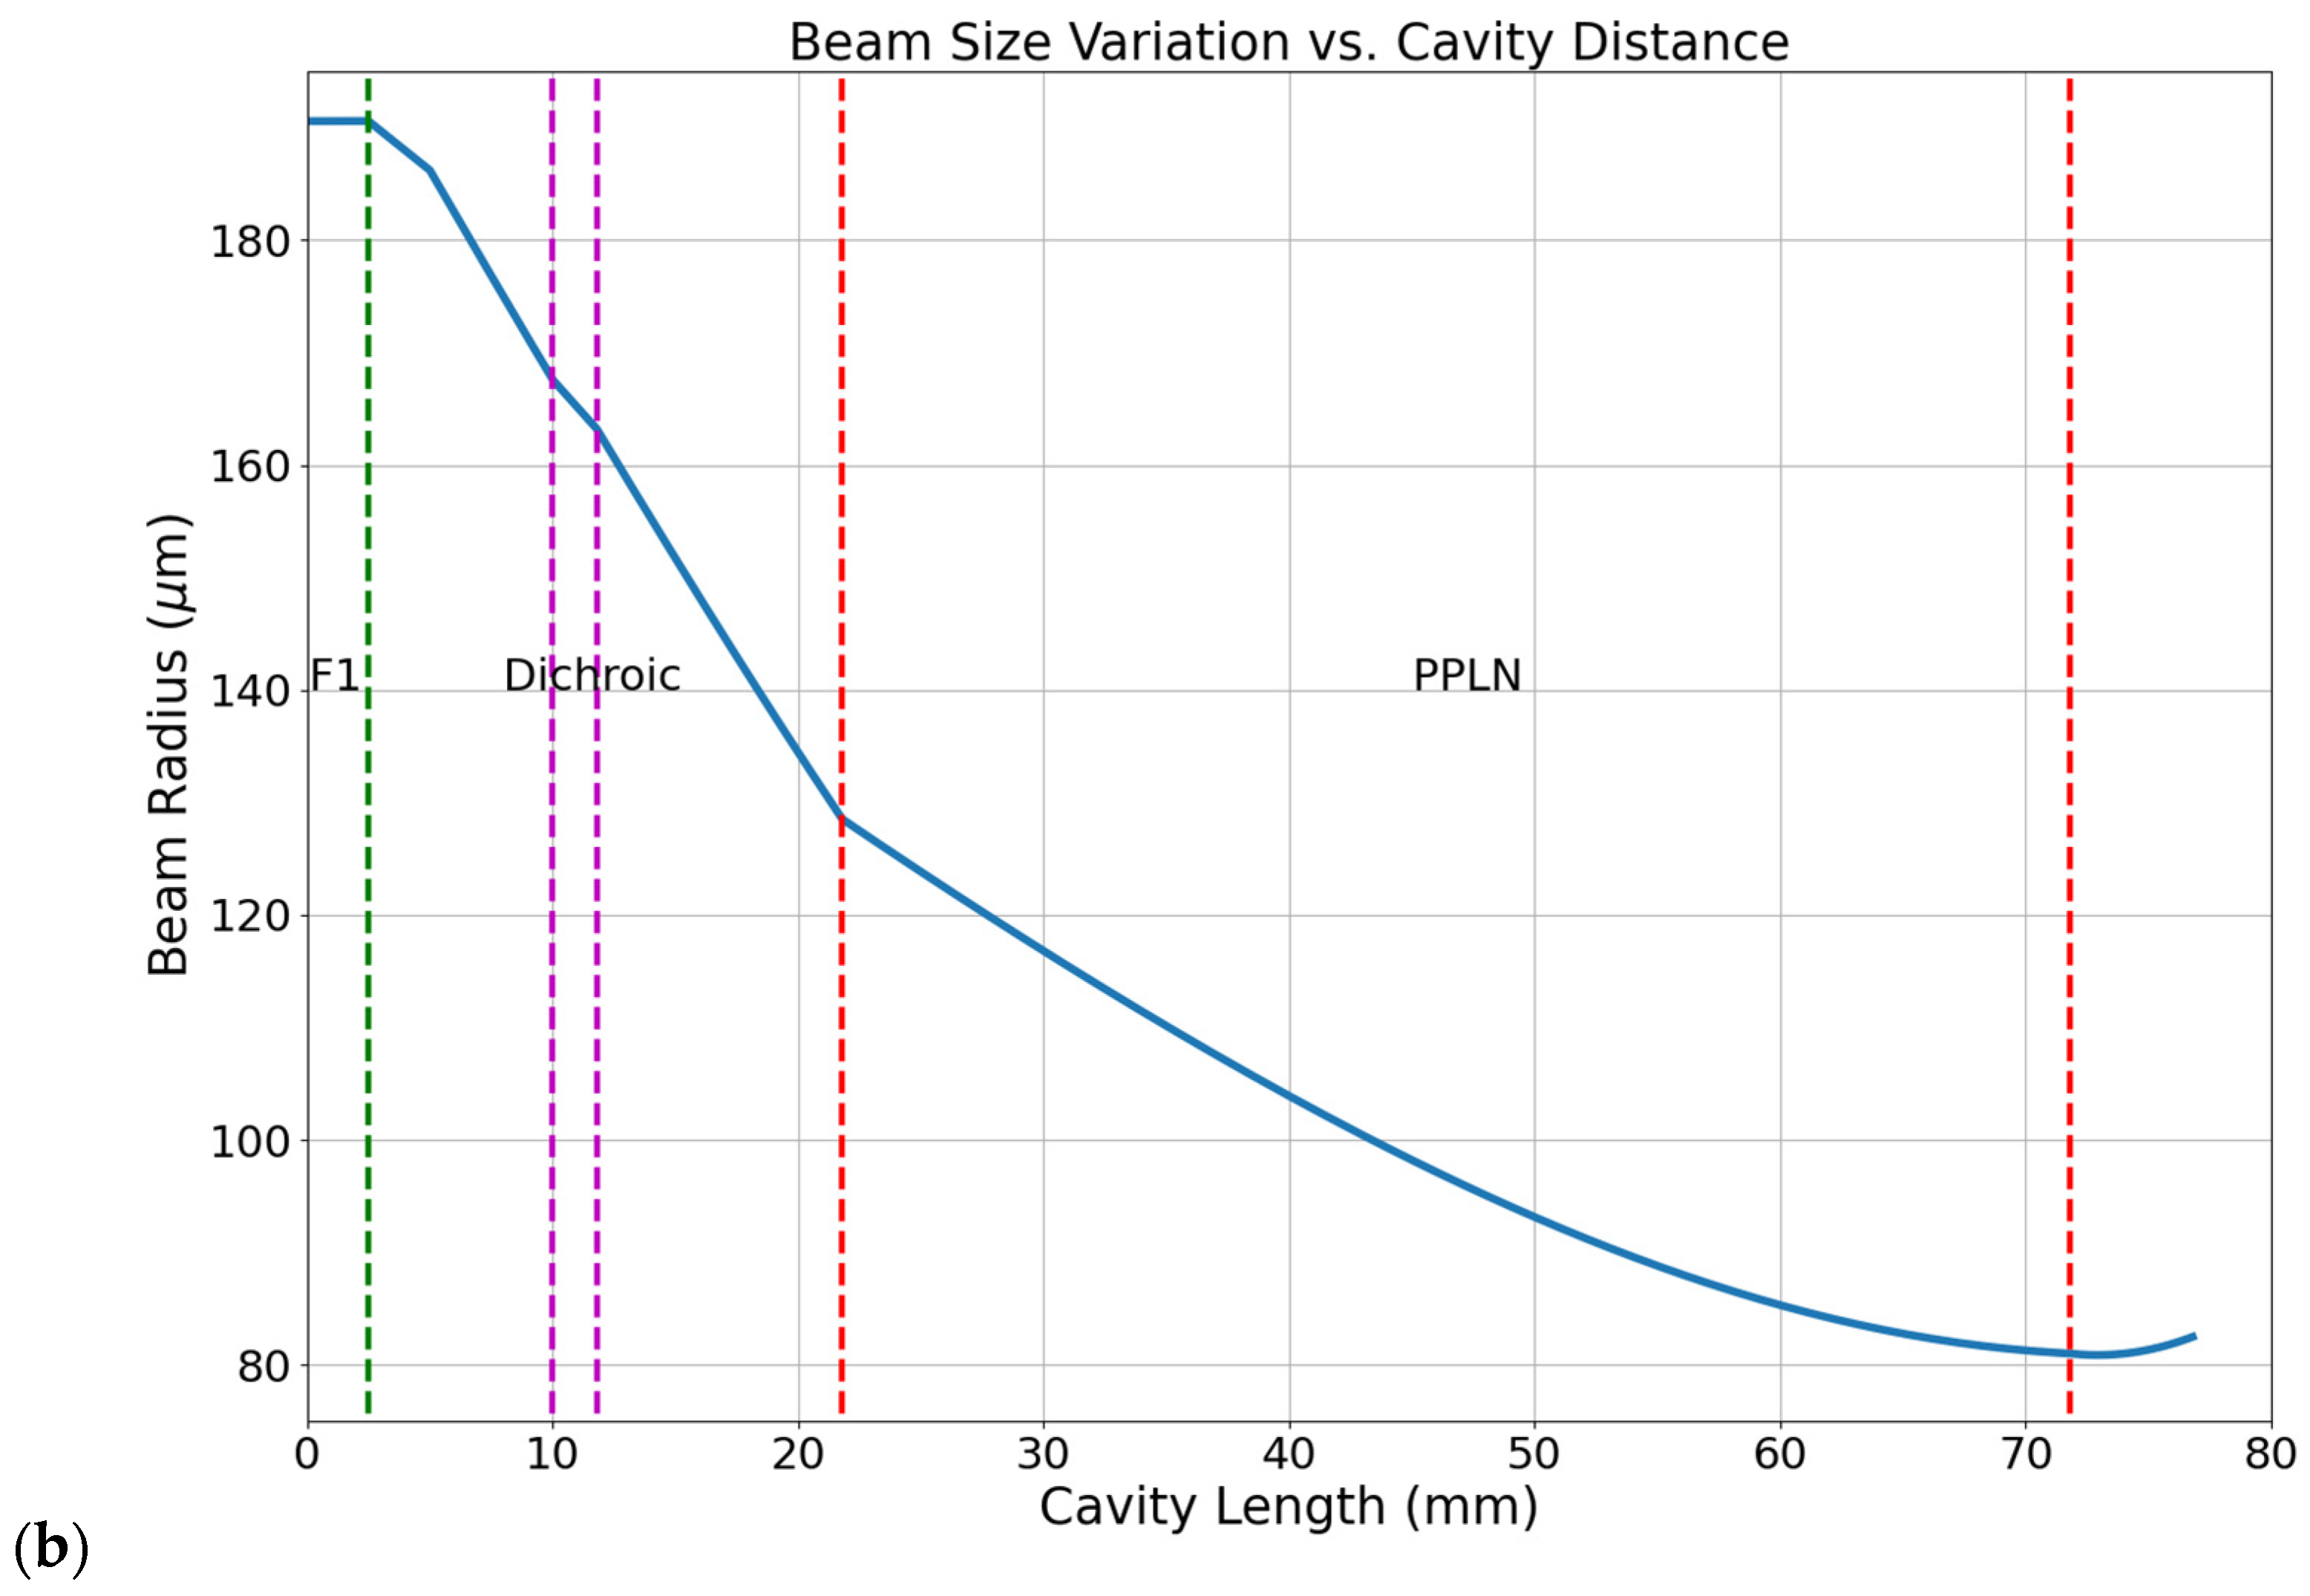
26]. The reZonator model and the beam radius evolution inside of the cavity are summarized in
Figure 1:
In this model, M1 represents the HR coating at 1064 on the Nd:YVO
4. The 5 mm gain medium has been split into two 2.5 mm slabs with refractive index
n = 2.16 and a thin lens in the middle, in order to approximate the thermal lens as well. The thermal lens focal length was determined to be ~50 mm, which matched the output beam parameters and output power well, and lines up with similar experimental data [
27]. Distances d1, d2, and d3 are 5 mm, 10 mm, and 5 mm, respectively. The dichroic is a 1.8 mm slab with a refractive index of
n = 1.5, while the PPLN is 50 mm with a refractive index of
n = 2.2. The OC has a radius of curvature of 100 mm. This results in a 1064 nm pump beam radius in the middle of the PPLN of ~100
, which will be used as an input to the nonlinear simulation later. These parameters were selected to achieve a 1064 nm beam waist in the center of the PPLN crystal as close to a confocal parameter of 1 as possible. This value is typically used as a starting point for a good wavelength conversion efficiency [
28,
29,
30]. For a 50 mm PPLN, this would require a beam waist around 93 μm. Our value of 100 μm was as close as we could obtain while maintaining cavity stability. The 55 μm signal beam waist was selected due to a combination of the space limitations on the optical bench as well as the selection of focusing lenses that were available in the laboratory. As such, the confocal parameter of the signal as well as the beam overlap between the pump and signal is not as high as it could be. In future work, we hope to incorporate a variable beam expander to the signal setup to more easily modify the signal beam waist and, thus, determine the output power and efficiency as a function of beam overlap, as this has been shown to be an important optimization parameter [
31].
An 808 nm 125
core diameter multimode fiber pigtailed diode laser (AeroDIODE 808LD-2-0-0) emitting up to 4.5 W optical power was imaged onto the Nd:YVO
4 gain medium using a GRIN lens (Edmund Optics #64-544). The Nd:YVO
4 gain medium was HR coated at 1064 nm (R > 99.9%) and high transmission (HT) coated at 808 nm (T > 95%) at the input facet, and anti-reflection (AR) coated at 1064 nm (T > 99.8%) at the output facet. This was followed by a dichroic mirror (Custom unit fabricated at the National Research Council) with a transmission of 99.3% at 1064 nm and a reflectivity of 70% at 1529 nm, both at an angle of incidence of 45°, for s-polarized light. A 50 mm-long 5 mol% MgO doped PPLN crystal (Custom from HCPhotonics, Taiwan, China) with a period of 30.3
m was mounted to a copper heat sink with a thermoelectric cooler that can be controlled to within 0.05
C. The input facet of the PPLN was AR-coated for 1064 nm and 1529 nm (T > 99.7%) and the output facet was AR-coated for 1064 nm (T > 99.7%) and 3.5
m (T > 95%). The output coupler (OC) was a CaF
2 plano-concave mirror (Custom from Fuzhou Witoptics. Fuzhou, China) with a radius of curvature of 100 mm, HR-coated for 1064 nm (R = 99.85%) and AR-coated for ~3.5
m (T = 92%). A 50 mm focal length AR-coated CaF plano-convex lens (Thorlabs LA5183-E, Newton, NJ, USA) was placed after the OC to collimate the divergent 3499 nm light. A thermal power sensor (Thorlabs S401C) was used to measure the DFG power after filtering out the pump and signal with a Germanium (Ge) filter (Thorlabs WH91050-C9). The dichroic mirror was used to couple in a tunable C-band laser (Agilent 8164B, Santa Clara, CA, USA) at 1529 nm, which was amplified via a polarization-maintained EDFA (CiviLaser EDFA-C-BA-26-PM). To increase the working distance of the C-band laser, the collimated EDFA output was passed through a 5x beam expander (Thorlabs GBE05-C) followed by a 100 mm focal length plano-convex lens (Thorlabs LA1050-C) to focus the laser into the center of the PPLN. This design was simulated in Zemax which predicted a beam waist radius of 55
m in the center of the PPLN, ensuring that the confocal focusing criterion was met. This was required due to space limitations on the optical bench. A schematic diagram detailing the layout of the above components is presented in
Figure 2.
A scanning slit beam profiler (Thorlabs BP209IR1) was used to verify the beam diameters. For the C-band laser, the beam profiler was placed at the focus after the beam expander assembly. The distance from the beam profiler and the beam waist matched a Zemax simulation well, with a waist diameter of 110 at 10.5 cm from the assembly output. The cavity waist was confirmed by taking several measurements of the Gaussian beam diameter outside of the cavity and then deriving the Gaussian waist using the experimental data. The measured waist diameter of 200 was close to the predicted value of 190 m.
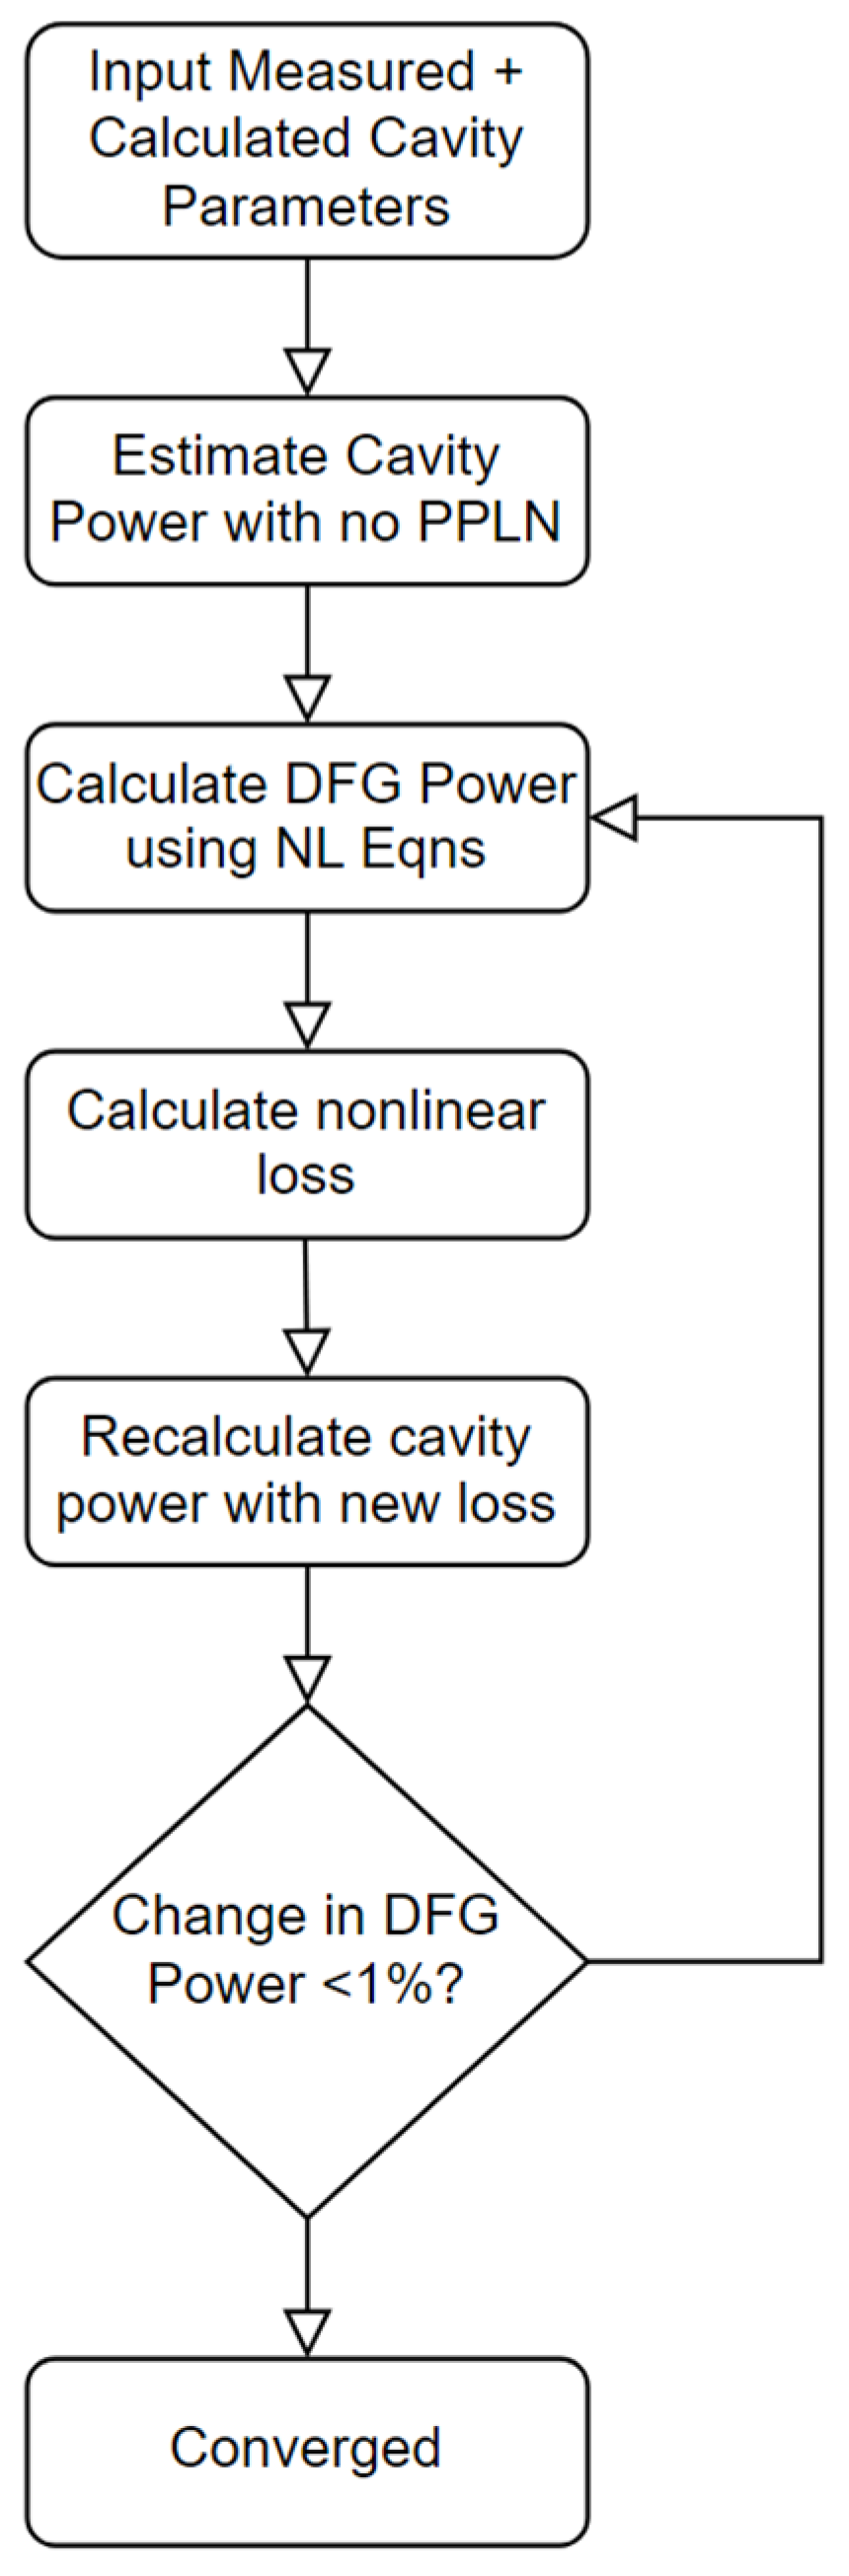
We also describe the simulation work presented in the Results section. This is a significantly modified version of work our group has presented previously, although adapted for DFG as opposed to SHG [
32]. A flowchart summarizing the flow of the simulation step by step is presented in
Figure 3.
Initially, we must estimate the incident pump and signal power on the nonlinear medium. The signal power is measured experimentally before it is coupled into the cavity, while estimating the intracavity 1064 nm pump power is more involved. A spatially dependent rate equation model was used to derive the intracavity 1064 nm power as detailed by Risk and summarized below in Equation (3) [
33]:
where
is the ratio of the 808 nm pump and 1064 nm laser beam waists, f is the total Boltzmann factor of the gain medium,
is the ratio of reabsorption loss to fixed cavity loss with L being the total cavity loss, T is the transmission loss from the output coupler,
is the emission cross-section of the gain medium,
is the length of the gain medium, and
is the doping concentration of the Nd in the gain medium. F is a normalized variable proportional to pump power, and S is a normalized variable proportional to internal laser power. Then, by solving for dS/dF, we can derive the pump threshold and slope efficiency in terms of S and F and convert them to real pump power and output laser power as follows.
Once dS/dF has been found numerically, the external slope efficiency of the laser can be found using Equation (4):
where
is the ratio of frequencies of the lasing and pump light, also known as the quantum defect.
is the absorption efficiency of the incident pump photons in the gain medium, and
is the ratio of laser photons exiting the cavity via the output coupling mirror. We can then solve for the pump threshold of the laser to fully define the expected output power vs. pump power curve, as shown in Equations (5) and (6) below:
where
is the upper manifold lifetime of the gain medium and h is the Planck’s constant. Finally, we convert F to
by
, and we use the derived slope efficiency to determine the expected output power from the laser from the threshold onwards. Then, since the output coupler reflectivity is well known, this allows us to estimate the circulating power within the cavity as well. This determines the input power to the nonlinear medium for the next step in the modeling work.
After determining the input pump and signal power, we use the nonlinear wave equations for DFG to estimate the output idler power as shown in Equations (7) and (8) [
34]:
where
represents the signal wave,
represents the idler wave, and
represents the pump wave. In this form, we have assumed that the cavity pump power is strong and effectively constant, as the conversion efficiency of the DFG process is low enough that nonlinear losses from the conversion are negligible in the device’s current form (<1% difference). However, it is important to note that as the signal power is increased, the overall conversion of the pump to signal will increase, and so the pump depletion will be non-negligible. Our model can account for this, which is why we still include the nonlinear loss step in
Figure 3. This increased conversion efficiency acts as an additional source of loss within the cavity, so it must be accounted for to accurately model intracavity frequency conversion at high powers. If depletion is significant, we would then take the output DFG power and intracavity 1064 power and estimate a nonlinear conversion loss. This loss is added to the total cavity loss, and then, the 1064 nm cavity power is calculated again. This new lower 1064 nm power will produce a lower estimate of the DFG and, thus, a lower nonlinear conversion loss. This process is repeated until the nonlinear loss converges on the correct value. A similar approach that considers the depletion alongside intracavity DFG is presented by Liu et al. [
35].
We swept the operating temperature of the PPLN using the attached TEC until the optimal output power (and thus phase matching) was achieved at ~23
, and the temperature dependence of the PPLN is modeled using the Sellmeier equation for MgO-doped PPLN [
36]. By using this model, we can accurately predict the output DFG power as a function of input pump power, as well as the temperature dependence of the DFG power via the Sellmeier equation. These results are presented in the Results section alongside our experimental results, and the two are in good agreement. Future simulation expansion is covered in the Discussion section. Finally, we present our simulation inputs used to generate our results in
Table 1.
4. Discussion
The results are promising, showing that we can easily achieve state-of-the-art black-box efficiency with a compact, linear cavity without stabilization. According to our modeling, this represents close to the best-case black-box efficiency we can reasonably expect for this design. While it is theoretically possible to improve our efficiency to up to ~2.40–2.50%/W, this was only achieved by further improving the optical coatings, which are already close to the upper limit of performance. A larger efficiency gain may be possible if the pump and signal beam overlap can be improved at the center of the PPLN, as there is a noticeable mismatch with the ~100 um pump derived from the cavity simulation. However, this may require a significant cavity redesign and a change in the focusing setup used for the C-band laser. We will have to investigate in future work whether decreasing the pump beam size is possible, or if increasing the signal beam size is worth the loss in intensity versus the increase in overlap between the pump and signal.
As for why our device efficiency is higher than the reported efficiencies presented in the Introduction section, our preliminary analysis suggests the following. First, all of the presented devices in the introduction make use of a fiber amplification stage before pumping the nonlinear crystal. Since we are not making use of an amplification stage and instead rely on high-efficiency direct-diode pumping, our efficiency is ~60% higher than it would be when using a Yb-based amplifier. Second, the cavity enhancement factor is a good deal higher than the other devices presented, which we attribute to the high-quality optical coatings and high OC reflectivity. For example, the device presented by Witinski et al. has a Finesse of 65, corresponding to a pump enhancement factor of around 10 [
19]. Our cavity has a Finesse of ~200, and so our pump enhancement factor is ~30 [
41]. The main reason we suspect our device is not 3× more efficient than Witinski et al.’s is that the beam overlap is not as optimized as in their device, and so we have room for improvement. Finally, we are using a large 50 mm PPLN which greatly increases the nonlinear interaction length and thus, the efficiency. However, in future work, we plan to better characterize what parameters affect the efficiency most strongly, including beam overlap, temperature, spectral linewidth, PPLN size, etc.
While our model agrees well with the current experimental results, there are several areas where it could be improved to facilitate future work. First, the model does not consider thermal effects outside of the thermal lensing approximated in the cavity simulation. A future test would involve increasing both the pump’s 808 nm power and the signal C-band power to see if higher output power and black-box efficiency can be achieved. However, this will increase the prevalence of thermal lensing in the Nd:YVO4 such that it may affect cavity stability. Additionally, the higher thermal load of a multi-watt level signal coupled with the tens of watts of pump present in the cavity may change the beam properties inside of the nonlinear crystal. Another important factor is the increased nonlinear losses within the cavity at higher efficiencies and pump powers. Currently, the DFG conversion efficiency is low enough that the nonlinear losses are not significant relative to the linear losses within the cavity (scattering, absorption, non-ideal coatings, etc.). Any attempts to increase efficiency will also increase the prevalence of intracavity nonlinear loss. We have previously demonstrated that in a simple nonlinear process like SHG, the nonlinear loss can significantly affect the expected output power and thermal properties of intracavity frequency conversion at higher efficiencies [
32]. We have no reason to believe there will not be similar phenomena to observe at higher device powers and higher efficiencies with intracavity DFG as well. These are important points to consider and investigate in future work, as the efficiency we have reported may not be maintained at higher pump and signal powers as a result.
Future work will focus on adapting the device presented here for free-space optical communications. Experiments will include using a 10 W EDFA and 10 W 808 nm pump to push for watt-level DFG power. This is a vital milestone for satellite-to-ground optical communication in low earth orbit, as previous work has identified that 1–2 W CW power is recommended for high link availability and low bit error rates [
42]. We will also pursue modulating the C-band source at gigabit speeds, as this opens the door to high-speed weather-resistant free-space optical links for both last mile applications and longer distance links, due to the combination of high-speed and high transmitter power. To the best of our knowledge, a gigabit-speed mid-infrared link has not been demonstrated over distances greater than a few kilometers, so we hope to perform a practical demonstration using drones and high-altitude platforms in the coming months as further proof of principle.


