Article

Numerical Analysis of Solid-Core Photonic Crystal Fiber Based on Plasmonic Materials for Analyte Refractive Index Sensing

by
Muhammad Musavir Bilal
1,
Servando Lopez-Aguayo
1,* and
Ajmal Thottoli
2
1
Tecnologico de Monterrey, Escuela de Ingeniería y Ciencias, Ave. Eugenio Garza Sada 2501, Monterrey 64849, Mexico
2
Department of Electrical and Information Engineering, Politecnico di Bari, Bari, Via G. Amendola 126/B, 70126 Bari, Italy
*
Author to whom correspondence should be addressed.
Photonics 2023, 10(10), 1070; https://doi.org/10.3390/photonics10101070
Submission received: 17 August 2023 / Revised: 6 September 2023 / Accepted: 12 September 2023 / Published: 22 September 2023
(This article belongs to the Section Lasers, Light Sources and Sensors)

Abstract

:
In this study, we presented a simple highly sensitive sensor based on commercially available solid-core photonic crystal fiber (PCF) and surface plasmon resonance (SPR) for measuring the refractive index (RI) of analytes. The numerical simulation based on the finite element method (FEM) has been examined to compute the optical properties such as confinement loss, power spectrum, and transmission intensity of the sensor. The most sensitive and inert plasmonic materials (gold and silver) have been assumed to be coated inside the fiber with the range of analyte RI from 1.32 to 1.40. The performance of the proposed sensor has been evaluated by tracing the several optical features like wavelength sensitivity, amplitude sensitivity, resolution of the sensor, and figure of merit. As a result, the comparative study between silver and gold elements has been carried out in which the maximum sensitivity received was 1.15 μm/RIU and 1.10 μm/RIU, respectively. Whereas, on the base of power spectrum, the obtained sensitivity was 513 μm/RIU for the gold layer. Moreover, the effect of other structural parameters (air holes and plasmonic layer thickness) on the sensing performance has been taken into an account. According to the simulation analysis and results, this sensor would have a great potential in various sensing applications of biomedical and liquid refractive index.

1. Introduction

In the past few decades, the development of surface plasmon-based sensing (SPR) techniques has been emphasized as an effective optical detection phenomenon owing to high sensitivity, label free, and real-time monitoring [1]. Particularly, SPR is highly attractive to refractive index (RI) deviations, which performs as a suitable sensor for measuring the chemical, biological, and physical parameters [2,3]. The working principle of the SPR sensing method can be well explained among the interface of metal and dielectric materials when the light signals and the free electrons jointly overlap at the same frequency [4]. The most commonly functional SPR-sensing platform relies on prism structure and optical fiber technology. However, prism structure demands mechanical and optical modules. These devices have massive arrangements that cause high cost and are not valuable for the integration of practical applications [5,6].
On the other hand, conventional optical fiber-based SPR sensors have progressed a lot due to their high resolution, a miniaturized structure, and reliability in remote sensing applications [7,8]. But these types of fibers are single mode or multimode fibers which consist of a core and cladding section; therefore, the external part of the fiber is chemically or physically isolated to reveal the core region to enhance the linking among the surface plasmon polariton (SPP) mode and the core mode [9,10].
The invention of photonic crystal fiber (PCF) was a prominent breakthrough in optical fiber technology which is utilized in various fields such as spectroscopy, biomedical, and industrial machinery [11]. PCF has fascinated attraction over the conventional optical fiber due to its remarkable performance such as large effective area, nonlinearity, low loss, multi-parameter sensors, endlessly single mode, tunable dispersion, high index contrast and extensive range of environmental monitoring [12,13]. Therefore, the combination of PCF-based SPR sensing mechanisms pay much attention to many researchers due to their flexibility structures and controllable light [14,15]. The air holes in the core and cladding region moderate the effective refractive index of the core, which enhances the phase matching between the SPP and core modes [16]. The selection of plasmonic elements is also an important factor for the PCF-SPR sensor. Commonly, there are gold, graphene, silver, copper, aluminum, and titanium nitride [17,18]. Among these materials, mostly silver and gold have created extreme and developing concern in the research study of PCF-SPR sensors to develop the precious optical features [19]. Silver approaches a high sensitivity but it becomes oxidized in the presence of a humid environment that can be improved by coating a layer of other elements like graphene, gold, or titanium oxide. Contrary, gold is chemically stable, biocompatible, and more appropriate for microfluidic liquids sensing [20,21].
Recently, many groups of researchers have proposed microstructure fibers-based SPR sensors with various configurations of PCF, where analytes or layers of plasmonic materials are placed inside or outside the fiber to measure the different parameters [22]. In 2017, Weng et al. introduced the D-shape hole with dual cladding photonic crystal fiber based on surface plasmon resonance for sensing the temperature parameters [23]. In 2018, Ahmed et al. proposed the plasmon resonance PCF biosensor based on titanium nitride (TiN) to achieve the RI sensitivity as 7700 nm/RIU [24]. Furthermore, a dual channel photonic crystal fiber based on gold plasmonic material has been numerically investigated with the sensitivity of 3750 nm/RIU for RI measurement [25]. In 2020, a multi-channel PCF sensor based on surface plasmon resonance with a multi-analytes channel has been studied with the sensitivity of 3083 nm/RIU [26]. Additionally, for the detection and quantification of coronavirus, a photonic crystal fiber based on the plasmonic material was theoretically examined in 2022. The obtained sensitivity was 2009 nm/RIU, 2745 nm/RIU, and 1984 nm/RIU for the analytes’ RBD, RNA, and IgG, respectively [27].
From the above literature review, it has been seen that, mostly, researchers work with the complex structure of PCFs which are not available commercially and need specific arrangements to fabricate, which could be lengthy and costly. Further, the single or multiple plasmonic materials are utilized at the same structure of PCF to measure the sensitivity, whereas the comparative study still is missing among the two materials at the same structure of PCF.
In this study, we introduced a broad analysis of commercially available solid-core photonic crystal fiber based on plasmonic materials for liquid refractive index sensing. The finite element method (FEM) has been applied to compute the sensing performance and the guiding properties of light spectrum. The most highly sensitive plasmonic materials silver and gold are utilized with the analyte refractive index range of 1.32–1.40. The proposed sensor is explored by finding the different optical properties of confinement loss, wavelength sensitivity, amplitude sensitivity, power spectrum, and transmission intensity, which creates the shift of peaks wavelength. The maximum sensitivities achieved were 1.15 μm/RIU and 1.10 μm/RIU for gold and silver materials, respectively. On the other hand, by analyzing the power spectrum, the obtained sensitivity was 513 μm/RIU. Moreover, the comparative study of plasmonic particles and the effect of the size of air holes and metal layers has also been investigated.

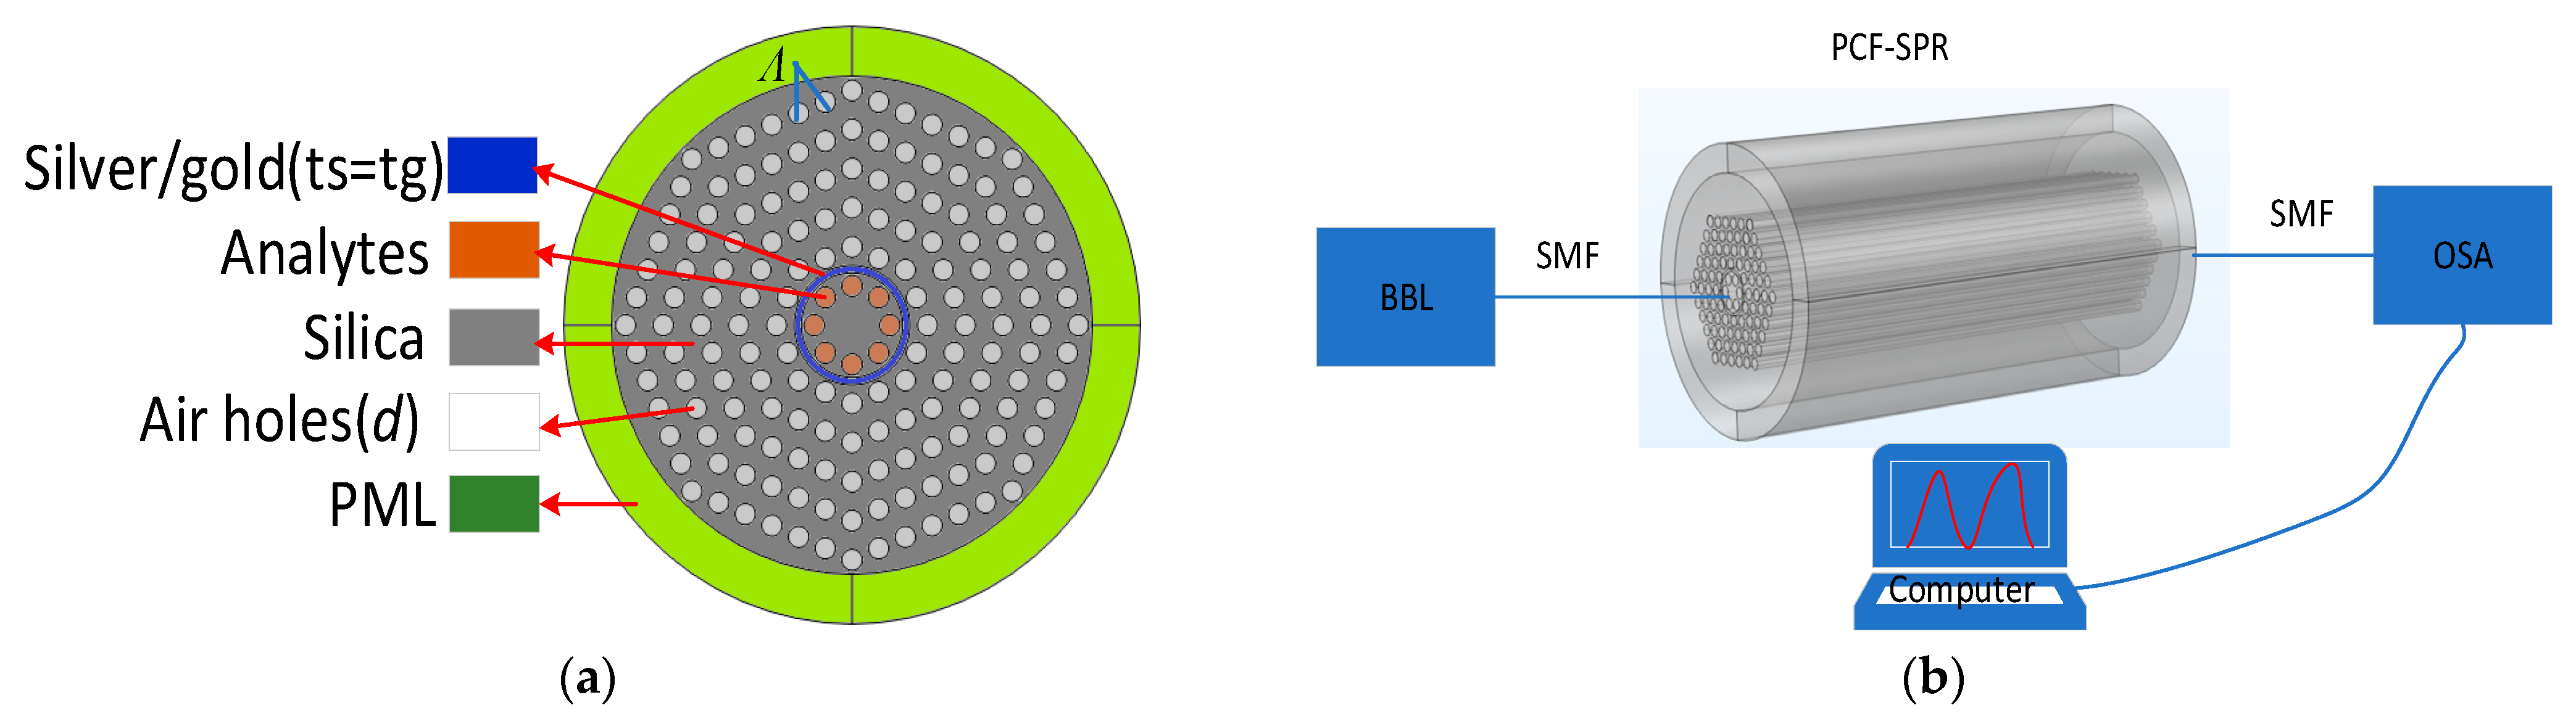
2. Geometrical Structure and Design

The cross-section view of the two-dimension proposed PCF-SPR design with the hexagonal arrangements of five layers of cladding air holes has been depicted in Figure 1a. The central part consists of the core region and the holes filled with analytes which are covered by a layer of plasmonic material (silver/gold). Silver and gold are the most active materials for plasmonic applications because of the favorable bulk dielectric properties in optical fiber sensors. Silver has the lowest optical losses in the visible and near infrared spectral ranges, and gold is chemically stable and a very functional element under ambient conditions [28]. The size of the cladding air holes and the silver/gold layer are denoted by d (1.0 μm) and tg, ts (26 nm), respectively. The distance between two adjacent air holes is expressed as pitch Λ (2.2 μm). Silica is used as background material. The outer part of the fiber contains the perfectly matched layer (PML), which is applied to absorb the light spectrum occurring at various points. Moreover, the schematic diagram of the 3-D PCF-SPR structure has been shown in Figure 1b, which involves the sensing setup. The broadband light source (BBL) transmits the light signal with a lead in single-mode fiber (SMF) to the PCF-SPR sensor, which leads out by SMF at the optical spectrum analyzer (OSA). Finally, the effected or interfered signals with different analytes or materials are displayed on the screen. All the parameters are optimized to achieve the maximum sensitivity of the proposed model.
The benefit of this kind of fiber is a commercially available and a simple structure for a manufacturing process. The air holes surrounding the core region act to minimize the loss of light spectrum. The proposed structure can be fabricated by employing a high-temperature furnace in a standard fiber drawing tower. After preparing the fiber preform, silica rods and capillaries are compiled with the stack and draw procedure [29].
After the fabrication process, the coating of silver or gold layer inside the fiber is the most important subject that demands a high temperature in some deposition methods such as thermal evaporation, sputtering, and radio frequency. Since this PCF-SPR structure is assumed to be coated or filled internally with metal and analytes, it creates a little complexity in the fabrication process, but it also enhances the sensor to be stable and produces resistance against external influences. Therefore, the most common and valuable technique of chemical vapor deposition (CVD) can be exploited to integrate the metal layer and analytes efficiently [30].

3. Materials and Methodology

The PCF-SPR design sensor involves cladding air holes with a refractive index of 1, and the background material is silica, whose refractive index can be analyzed by the sellimeier equation. The light dispersion of the sellimeier method can be calculated by the following equation [31].
s i l i c a n = 1 + A 1 λ 2 λ 2 B 1 + A 2 λ 2 λ 2 B 2 + A 3 λ 2 λ 2 B 3
where n is the effective refractive index of the pure silica glass and the values for the constant variables are A1 = 0.6961663, A2 = 0.4079426, A3 = 0.8974794, B1 = 0.0684043, B2 = 0.1162414, and B3 = 98.96161. λ is the operating wavelength in (μm).
Moreover, silver/gold has been selected as one of the promising candidates for the plasmonic material, which improves the detection capacity of the sensor. The advantages of these materials are no interband shift at visible wavelength, narrow resonance peak, and low optical damping. The material dispersion of plasmonic materials to realize the metal–dielectric behavior is illustrated by the Drude–Lorentz model [32].
E A u = E ω D 2 ω ω + j γ D ε . Ω L 2 ω 2 Ω L 2 + j Γ L ω
where E A u is the permittivity of gold, E = 5.9673 is the permittivity of gold at high frequency, ω = 2πc/λ is known as the angular frequency where c is the velocity of light, ωD = 2113.6 THz × 2π is known as plasma frequency, γD = 15.92 THz is known as damping frequency, and Δε = 1.09 is denoted by the weighting factor. ΩL= 650.07 × 2π THz and ΓL= 104.86 × 2π THz are known as Lorentz oscillator strength and spectral width, respectively.
Moreover, the change of direction of light coupling shifts between the core and SPP mode happens at the resonance wavelength. Basically, the computation and examinations of the proposed PCF-SPR sensor have been explored by CL, one of the most important aspects in evaluating the function of the sensor. The CL of the fundamental mode can be calculated by the following equation [33].
C L d B c m = 8.686 × 2 π λ × I m n e f f × 10 4 ,
where k 0 = 2 π λ is the free space of wave number, λ is the operating wavelength (μm), and I m n e f f is the imaginary part of effective refractive index.
In the simulation study, the finite element method (FEM) based on the COMSOL Multiphysics Software is applied to investigate and evaluate the light transmission of the proposed PCF-SPR sensor. In computation, the physics-controlled way of fine mesh analysis is studied, which consists of 499,097 solved elements for both domain and boundary elements. The distribution of electric fields in the core mode for X and Y polarization has been shown in Figure 2a and Figure 2b respectively which illustrates the maximum light confining into the core region. On the other hand, Figure 2c,d shows the light spectrum for the SPP modes. The arrows indicate the direction of light in X and Y polarization respectively.
Figure 3a,b illustrate the core-guided mode of the real and imaginary part of the effective refractive index of different analytes. As it seems that by increasing the analytes’ refractive index, the real part is also going to increase. Similarly, the maximum imaginary part is achieved at the higher refractive index of the analytes.
A broadband wavelength ranging from 1.30 μm to 1.70 μm is carried out for the whole simulation analysis. By using the silver material, Figure 4a demonstrates the distribution of the light transmission among the SPP and fundamental core modes in which the RI of analytes, size of air holes, and the thickness has been fixed at RI = 1.33, d = 1.0 μm, and ts = 26 nm, respectively. In this graph, the confinement loss (CL) and the real part of the effective refractive index (neff) are taken from the right and left side, respectively. The red line exhibits the loss peak for the core mode whereas the black and blue solid lines represent the effective refractive index of the fundamental modes and SPP modes, respectively. It has been noticed that at the wavelength of 1.44 μm, the same refractive index of SPP and core mode intersect with each other, which creates the resonance wavelength. At the resonance wavelength, the maximum light is transferred from the fundamental mode to SPP mode, where the sharp loss peak is monitored, which is called a phase matching condition. The unidentified samples can be detected by varying this peak to a longer or a shorter wavelength with the refractive index of different analytes. As the wavelength is going to increase, the effective refractive index for the core and SPP mode is steadily decreased. Therefore, the maximum refractive index is achieved at the minimum wavelength. Likewise, the short dash line in Figure 4b illustrates the loss spectra with respect to the wavelength for the gold material. Here, the same parameters have been fixed like the silver analysis but the resonance peak shifts towards the higher wavelength with higher refractive index and minimum loss. Usually, the core and SPP modes work at visible and infrared radiation, respectively. The propagation of light has been evaluated for a core-X and core-Y polarization spectrum. Both polarization spectrums have the same mechanism of light transmission. Therefore, the core-X-polarized mode is considered to explore the sensor schemes for further study.

4. Results and Discussions

To realize the sensing mechanism of the proposed PCF-SPR structure, the properties of the analytes’ RI have been examined. The effective refractive index of the SPP mode is highly responsive to the surrounding environment. The small variation of RI of analytes makes a significant shift of the real part of core mode. The comparatively confinement loss of silver and gold as a function of wavelength due to the alteration of analyte RI from 1.32 to 1.40 is shown in Figure 5. This graph depicts the solid lines to indicate the silver resonance wavelength. At the minimum RI (1.32) with sliver material, the small loss peak (162 dB/cm) is observed. By increasing the RI of analytes, the loss peak is going to increase at the higher RI (1.40), the maximum loss peak (340 dB/cm) is obtained. The resonance wavelength shifts move towards the shorter wavelength with the increment of the analytes’ RI. Similarly, the same phenomena of loss spectra with short dash lines of gold material have been shown in Figure 4. The resonance wavelength shift attained at the higher wavelength as compared to silver analysis also the higher loss peak (386 dB/cm) is achieved at the RI of 1.40. During the analysis of loss spectrum with the variation of the analytes’ RI, the rest of the parameters, like metal layer thickness (tg = 26 nm) and air holes (d = 1.0 μm), were kept constant.
Furthermore, the effect of air holes and the thickness of plasmonic layers has been evaluated. Figure 6a describes the solid and short dash lines of the variation of the silver and gold layer (22 nm to 34 nm) with the change of each step of 4 nm, respectively. It seems that by increasing the thickness of the silver and gold layer the resonance wavelength is moving towards the shorter wavelength and comparatively both have higher resonance wavelength. In both cases (silver and gold), at the minimum thickness (ts,tg = 26 nm), the highest loss peak (269 dB/cm) appears, and at the maximum thickness (ts,tg = 34 nm), the minimum loss (119 dB/cm and 135 dB/cm) is achieved, respectively. As a result, the alteration of plasmonic layers has a great impact on the sensing phenomena.
Correspondingly, in Figure 6b, different sizes of air holes (0.96 μm to 1.0 μm) with the interval step of 0.02 μm have been considered for both silver and gold material. Here, the maximum loss peak (252 dB/cm) is attained at the size of 1.0 μm for gold metal.
Sensitivity is the most important factor to validate the actual performance of the sensor that depends on the peak wavelength shift and the variation of the analytes’ RI. The following equation can be employed to determine the sensitivity (S) of analytes [34].
S λ μ m R I U = λ p e a k n a
where λ p e a k is the resonance wavelength shift, and n a is the variation of the analytes’ RI.
Another meaningful feature is the resolution (R) of the sensor, which is applied to identify the minor variation of analyte RI. The resolution of a sensor can be determined by the following equation [35].
R = Δ n a × λ m i n λ p e a k ,
where λ m i n represents the difference between two resonance peak wavelength, Δ n a is the alteration of the analytes’ RI, and λ p e a k is the maximum peak of resonance wavelength.
Furthermore, for practical execution of sensors, the inquiry of amplitude approach is modest and efficient. Amplitude sensitivity can be estimated by operating the following equation [36].
S A = 1 α λ , n a λ , n a n a ,
where α λ , n a is the confinement loss as a function of the wavelength and RI of analytes. λ , n a is the difference between two loss peaks under two different refractive indexes at the same wavelength. The values of amplitude sensitivity have been calculated by tracing Figure 4.
Figure 7a implies the amplitude sensitivity of the refractive index of different analytes for the silver layer. At the refractive index of 1.36, the maximum amplitude sensitivity (−46 RIU−1) is achieved. On the other hand, Figure 7b indicates the amplitude sensitivity for the gold layer. Here, the maximum amplitude sensitivity (−32 RIU−1) is obtained at the resonance wavelength (1.46 μm) with the RI of 1.38.
Figure of merit (FOM) is the significant attribute to value the function of any type of sensor. The following equation is employed to find the FOM [37].
F O M = S λ F W H M
where S λ is the wavelength sensitivity measured in μm/RIU, and FWHM is the full width at half-maximum calculated in nanometers from the resonance wavelength. Figure 8a shows the function of FOM with the variation of the analytes’ RI for the silver layer. The maximum FOM is attained as 25 RIU−1 at the analyte RI of 1.34. Next, in Figure 8b, the variation of analyte RI for the gold layer has been depicted. Here, the maximum FOM 31 RIU−1 is obtained at the RI of 1.32, which is comparatively higher than the silver analysis.
On the basis of the above Equations (4)–(7), the wavelength sensitivity, amplitude sensitivity, resolution, and FOM of the proposed PCF-SPR sensor has been calculated. Table 1 explains the comparative results among the silver and gold in which the performance of the gold metal secured higher sensitivity than the silver layer.
Additionally, the birefringence, coupling length, power spectrum, and transmission intensity also has a great influence to validate the working function of the sensors. Therefore, these parameters have been calculated based on the difference of effective refractive index of the X and Y polarization mode. Here, the explanation of the most important aspects such as power and transmission intensity have been considered.
The optical power variations operate from one mode to another, along with the proposed sensor. The expression of birefringence and coupling length define the power spectrum. The power spectrum ensures the sensor ability, which is measured by using the following equation [38].
P o u t = s i n 2 B × π × L λ ,
where B is the birefringence, L is the coupling length, and λ is the operating wavelength.
Figure 9a shows the power spectrum as a function of the wavelength with the variation of analyte RI (1.32 to 1.40). By increasing the RI of the analytes, the power peak spectrum moves towards the shorter wavelength. The maximum sensitivity obtained is 1.13 μm/RIU at the refractive index of 1.32.
The transmission intensity plays a significant role in calculating the sensitivity of the proposed PCF-SPR sensor. The change of intensity propagation has been manipulated. The whole plasmonic impression extensively fluctuates on the transmittance. However, the wavelength sensitivity of the designed sensor can be figured out through the alteration of the sharp peak of the transmittance curve with the change of the refractive index. The transmittance spectrum can be evaluated by using the following equation [39].
T r ( d B ) = 10 × l o g 10 P o u t P i n ,
where Tr is the transmission of light, and Pin is the maximum power as a fraction of Pout.
The transmission spectrum with respect to wavelength by varying the analyte RI has been depicted in Figure 9b. This graph explains the variation of resonance wavelength to shorter wavelength as the refractive index increases. With the increases of analyte refractive index, the transmission is going to a higher wavelength. For the transmission spectrum, the attained sensitivity is 1.21 μm/RIU.
A linear reaction is a valuable mechanism for sensor execution as it allocates to resolve the unidentified quantities by regular data extrapolation. Therefore, by considering the good results of Figure 5 and Figure 9a (power spectrum) with gold material has been explored for linear regressions. Figure 10a illustrates the linear fitting curve of loss function with respect to the resonance wavelength and the variation of analyte RI. In this graph, the slope values consider the sensitivity of the sensor, which is obtained as 513 μm/RIU with the adjacent R2 of 0.997. Similarly, Figure 10b exhibits the linear regression of the power spectrum as a function of wavelength shift and the variation of analyte RI. The achieved sensitivity was 0.706 μm/RIU with an R-square value of 0.979.
A comparison study of the proposed structure and the previous work done based on RI sensing has been drawn in Table 2, which consists of the sensitivity results. In the overall analysis, the PCF-SPR sensor has a remarkable impact in refractive index sensing; particularly, gold has a higher sensitivity than the silver layer. Moreover, this designed structure enhances solidity and stability for sensing applications. By tuning the structural parameters and sensing materials, the results can be further improved.

5. Conclusions

In conclusion, we proposed and numerically computed the PCF-SPR sensor based on plasmonic material to examine analyte RI sensing. To investigate the sensing mechanism of optical guiding properties such as confinement loss, power spectrum, and transmission intensity, the finite element method (FEM) based on mode solver is employed. The comparative study has been carried out by utilizing the properties of gold and silver in which the range of analyte RI is taken from 1.32 to 1.40. For the gold analysis, the maximum achieved wavelength sensitivity, amplitude sensitivity, and resolution are 1.15 μm/RIU, −32 RIU−1, and 0.0145 RIU−1, respectively. Additionally, power spectrum analysis has been examined with a higher sensitivity of 513 μm/RIU. Moreover, the impact of several fundamental parameters like air holes and thickness of the plasmonic layer on this sensor have been analyzed. The numerical analysis and the exploration of this proposed sensor illustrate a suitable candidate for several applications for liquid and biological sensing.

Author Contributions

Conceptualization, S.L.-A.; Methodology M.M.B.; Validation, S.L.-A.; Formal analysis, M.M.B.; Data curation, A.T.; Writing—original draft, M.M.B.; Writing—review & editing, A.T.; Supervision, S.L.-A. All authors have read and agreed to the published version of the manuscript.

Funding

This research has no external funding. The APC was funded by Instituto Tecnologico y de Estudios Superiores de Monterrey, Ave. Eugenio Garza Sada 2501, Monterrey 64700, Mexico.

Data Availability Statement

The simulation data are available from the corresponding and first author upon request.

Acknowledgments

This research was supported by the Tecnologico de Monterrey, Monterrey, N.L. 64700, México. We are also thankful by the support and help of CONAHCYT Organization, Mexico.

Conflicts of Interest

The authors declare that there are no conflict of interest.

References

  1. Al Mahfuz, M.; Hossain, M.A.; Haque, E.; Hai, N.H.; Namihira, Y.; Ahmed, F. A Bimetallic-Coated, Low Propagation Loss, Photonic Crystal Fiber Based Plasmonic Refractive Index Sensor. Sensors 2019, 19, 3794. [Google Scholar] [CrossRef] [PubMed]
  2. Gomez-Cardona, N.; Reyes-Vera, E.; Torres, P. High Sensitivity Refractive Index Sensor Based on the Excitation of Long-Range Surface Plasmon Polaritons in H-Shaped Optical Fiber. Sensors 2020, 20, 2111. [Google Scholar] [CrossRef]
  3. Liu, C.; Yang, L.; Su, W.; Wang, F.; Sun, T.; Liu, Q.; Mu, H.; Chu, P.K. Numerical analysis of a photonic crystal fiber based on a surface plasmon resonance sensor with an annular analyte channel. Opt. Commun. 2017, 382, 162–166. [Google Scholar] [CrossRef]
  4. Kamrunnahar, Q.M.; Mou, J.R.; Momtaj, M. Dual-core gold coated photonic crystal fiber plasmonic sensor: Design and analysis. Results Phys. 2020, 18, 103319. [Google Scholar] [CrossRef]
  5. Yu, H.; Peng, Y.; Yang, Y.; Li, Z.Y. Plasmon-enhanced light–matter interactions and applications. Comput. Mater. 2019, 5, 45. [Google Scholar] [CrossRef]
  6. Yan, X.; Li, B.; Cheng, T.; Li, S. Analysis of High Sensitivity Photonic Crystal Fiber Sensor Based on Surface Plasmon Resonance of Refractive Indexes of Liquids. Sensors 2018, 18, 2922. [Google Scholar] [CrossRef]
  7. Sharma, A.K.; Jha, R.; Gupta, B.D. Fiber-optic sensors based on surface plasmon resonance: A comprehensive review. IEEE Sens. J. 2007, 7, 1118–1129. [Google Scholar] [CrossRef]
  8. Sharma, A.K.; Pandey, A.K.; Kaur, B. A Review of advancements (2007–2017) in plasmonics-based optical fiber sensors. Opt. Fiber Technol. 2018, 43, 20–34. [Google Scholar] [CrossRef]
  9. Lv, W.; Yao, J.; Wang, R.; Luan, N. Surface plasmon resonance sensor based on D-shaped microstructured optical fiber with hollow core. Opt. Express 2015, 23, 8576–8582. [Google Scholar]
  10. Jin, W.; Li, X.; Wu, S.; Fu, X.; Fu, G.; Bilal, M.M.; Bi, W. Highly sensitive temperature sensing probes based on liquid cladding elliptical micro/nanofibers. Opt. Express 2020, 28, 20062–20073. [Google Scholar] [CrossRef]
  11. Bilal, M.M.; Bi, W.; Jaleel, F.; Luwen, Y.; Sohail, M.N.; Irshad, M.; Madni, H.A. Magnetic fluid-based photonic crystal fiber for temperature sensing. Opt. Eng. 2019, 58, 072008. [Google Scholar] [CrossRef]
  12. Taghizadeh, M.; Bozorgzadeh, F.; Ghorbani, M. Designing magnetic field sensor based on tapered photonic crystal fibre assisted by a ferrofluid. Sci. Rep. 2021, 11, 14325. [Google Scholar] [CrossRef]
  13. Bilal, M.M.; Bi, W.; Liu, X.; Yang, L.; Wa, J.; Madni, H.A. Magnetic field sensor based on the magnetic fluid infiltration into the cladding air holes of the solid-core photonic crystal fiber. Opt. Eng. 2019, 58, 096107. [Google Scholar] [CrossRef]
  14. Gamal, Y.; Younis, B.M.; Hegazy, S.F.; Badr, Y.; Hameed, M.F.O.; Obayya, S.S.A. Highly Sensitive Multi-Functional Plasmonic Biosensor Based on Dual Core Photonic Crystal Fiber. IEEE Sens. J. 2022, 22, 6731–6738. [Google Scholar] [CrossRef]
  15. Mehta, S.; Vankalkunti, S.; Kachhap, P.K.; Gautam, P.R.; Singh, M. Sensitivity improvement of photonic crystal refractive index sensor using porous silicon nano rods. Mater. Sci. Semicond. Process. 2023, 165, 107687. [Google Scholar] [CrossRef]
  16. Abdelghaffar, M.; Gamal, Y.; El-Khoribi, R.A.; Soliman, W.; Badr, Y.; Hameed, M.F.O.; Obayya, S.S.A. Highly sensitive V-shaped SPR PCF biosensor for cancer detection. Opt. Quantum Electron. 2023, 55, 472. [Google Scholar] [CrossRef]
  17. Han, Y.; Gao, J.; Lu, J.; Li, Y.; Liu, Y. D-shaped photonic crystal fiber plasmonic refractive index sensor based on gold grating. Appl. Opt. 2018, 57, 5268–5272. [Google Scholar]
  18. Momota, M.R.; Hasan, M.R. Hollow-core silver coated photonic crystal fiber plasmonic sensor. Opt. Mater. 2018, 76, 7–294. [Google Scholar] [CrossRef]
  19. Liu, Q.; Lv, J.; Yi, Z.; Liu, C.; Liu, W.; Fu, H.; Hu, C.; Lv, Y.; Wu, X.; Yang, L.; et al. HE1,1 mode excited surface plasmon resonance for high-sensitivity sensing by photonic crystal fibers. JOSA A 2023, 40, 35–44. [Google Scholar]
  20. Shafkat, A. Analysis of a gold coated plasmonic sensor based on a duplex core photonic crystal fiber. Sens. Biosensing Res. 2020, 28, 100324. [Google Scholar] [CrossRef]
  21. Parandin, F.; Heidari, F.; Aslinezhad, M.; Parandin, M.M.; Roshani, S.; Roshani, S. Design of 2D photonic crystal biosensor to detect blood components. Opt. Quantum Electron. 2022, 54, 618. [Google Scholar] [CrossRef]
  22. Mittal, S.; Sharma, T.; Tiwari, M. Surface plasmon resonance based photonic crystal fiber biosensors: A review. Mater. Today Proc. 2021, 43, 3071–3074. [Google Scholar] [CrossRef]
  23. Weng, S.; Pei, L.I.; Wang, J.; Ning, T.; Li, J. High sensitivity D-shaped hole fiber temperature sensor based on surface plasmon resonance with liquid filling. Photonics Res. 2017, 5, 103–107. [Google Scholar] [CrossRef]
  24. Khalil, A.E.; El-Saeed, A.H.; Ibrahim, M.A.; Hashish, M.E.; Abdelmonem, M.R.; Hameed, M.F.O.; Azab, M.Y.; Obayya, S.S.A. Highly sensitive photonic crystal fiber biosensor based on titanium nitride. Opt. Quantum Electron. 2018, 50, 158. [Google Scholar] [CrossRef]
  25. Kaur, V.; Singh, S. A dual-channel surface plasmon resonance biosensor based on a photonic crystal fiber for multianalyte sensing. J. Comput. Electron. 2019, 18, 319–328. [Google Scholar] [CrossRef]
  26. Yasli, A.; Ademgil, H.; Haxha, S.; Aggoun, A. Multi-Channel Photonic Crystal Fiber Based Surface Plasmon Resonance Sensor for Multi-Analyte Sensing. IEEE Photonics J. 2020, 12, 6800515. [Google Scholar] [CrossRef]
  27. Islam, A.; Haider, F.; Ahmed, R.; Aoni, R.A. Plasmonic photonic biosensor: In situ detection and quantification of SARS-CoV-2 particles. Opt. Express 2022, 30, 40277–40291. [Google Scholar] [CrossRef]
  28. Verbruggen, S.W.; Keulemans, M.; Martens, J.A.; Lenaerts, S. Predicting the surface plasmon resonance wavelength of gold-silver alloy nanoparticles. J. Phys. Chem. C 2013, 117, 19142–19145. [Google Scholar] [CrossRef]
  29. Rahman, M.M.; Rana, M.M.; Anower, M.S.; Rahman, M.S.; Paul, A.K. Design and analysis of photonic crystal fiber-based plasmonic microbiosensor: An external sensing scheme. SN Appl. Sci. 2020, 2, 1194. [Google Scholar] [CrossRef]
  30. Hasan, M.R.; Akter, S.; Rifat, A.A.; Rana, S.; Ali, S. A Highly Sensitive Gold-Coated Photonic Crystal Fiber Biosensor Based on Surface Plasmon Resonance. Photonics 2017, 4, 18. [Google Scholar] [CrossRef]
  31. Al Mahfuz, M.; Hossain, M.A.; Haque, E.; Hai, N.H.; Namihira, Y.; Ahmed, F. Dual-Core Photonic Crystal Fiber-Based Plasmonic RI Sensor in the Visible to Near-IR Operating Band. IEEE Sens. J. 2020, 20, 7692–7700. [Google Scholar] [CrossRef]
  32. Bilal, M.M.; López-Aguayo, S.; Szczerska, M.; Madni, H.A. Multi-functional sensor based on photonic crystal fiber using plasmonic material and magnetic fluid. Appl. Opt. 2022, 61, 10400–10407. [Google Scholar] [CrossRef] [PubMed]
  33. Ramola, A.; Van, V.; Singh, S.; Shakya, A.K. Design of an ultra-sensitive bimetallic anisotropic PCF SPR biosensor for liquid analytes sensing. Opt. Express 2022, 30, 9233–9255. [Google Scholar]
  34. Zha, F.; Li, J.; Sun, P.; Ma, H. Highly sensitive selectively coated D-shape photonic crystal fibers for surface plasmon resonance sensing. Phys. Lett. A 2019, 383, 1825–1830. [Google Scholar] [CrossRef]
  35. Sharif, V.; Pakarzadeh, H. High-performance surface plasmon resonance fiber sensor based on cylindrical vector modes. Sci. Rep. 2023, 13, 4563. [Google Scholar] [CrossRef]
  36. Sharif, V.; Pakarzadeh, H. Terahertz Hollow-Core Optical Fibers for Efficient Transmission of Orbital Angular Momentum Modes. J. Light. Technol. 2021, 39, 4462–4468. [Google Scholar] [CrossRef]
  37. Ayyanar, N.; Thavasi Raja, G.; Sharma, M.; Sriram Kumar, D. Photonic Crystal Fiber-Based Refractive Index Sensor for Early Detection of Cancer. IEEE Sens. J. 2018, 18, 7093–7099. [Google Scholar] [CrossRef]
  38. Ahmed, K.; Jabin, M.A.; Paul, B.K. Surface plasmon resonance-based gold-coated biosensor for the detection of fuel adulteration. J. Comput. Electron 2020, 19, 321–332. [Google Scholar] [CrossRef]
  39. Ahmed, K.; Haque, M.J.; Jabin, M.A.; Paul, B.K.; Amiri, I.S.; Yupapin, P. Tetra-core surface plasmon resonance based biosensor for alcohol sensing. Phys. B Condens. Matter 2019, 570, 48–52. [Google Scholar] [CrossRef]
  40. Hasan, M.R.; Akter, S.; Rifat, A.A.; Rana, S.; Ahmed, K.; Ahmed, R.; Subbaraman, H.; Abbott, D. Spiral photonic crystal fiber-based dual-polarized surface plasmon resonance biosensor. IEEE Sens. J. 2018, 18, 133–140. [Google Scholar] [CrossRef]
  41. Akter, S.; Abdur Razzak, S.M. Highly sensitive open-channels based plasmonic biosensor in visible to near-infrared wavelength. Results Phys. 2019, 13, 102328. [Google Scholar] [CrossRef]
  42. Zuhayer, A.; Shafkat, A. Design and analysis of a gold-coated dual-core photonic crystal fiber bio-sensor using surface plasmon resonance. Sens. Biosensing Res. 2021, 33, 100432. [Google Scholar] [CrossRef]
  43. Sakib, M.N.; Hossain, M.B.; Al-tabatabaie, K.F.; Mehedi, I.M.; Hasan, M.T.; Hossain, M.A.; Amiri, I.S. High performance dual core D-shape PCF-SPR sensor modeling employing gold coat. Results Phys. 2019, 15, 102788. [Google Scholar] [CrossRef]
Figure 1. (a) The cross-section view of the proposed 2-D PCF structure and (b) the 3-D schematic diagram of the sensing mechanism of the PCF-SPR sensor.
Photonics 10 01070 g001
Figure 2. Electric field distribution of the fundamental mode with (a) X and (b) Y polarization. SPP mode light spectrum (c) X and (d) Y polarization.
Photonics 10 01070 g002
Figure 3. (a) The analysis of the real part of different analytes with respect to wavelength and (b) as well as the imaginary part of effective refractive indexes.
Photonics 10 01070 g003
Figure 4. The phase matching point of SPP and core mode as a function of wavelength with (a) silver and (b) gold materials.
Photonics 10 01070 g004
Figure 5. Confinement loss spectra of silver and gold with the variation of the analytes’ RI at d = 0.98 μm, and layer = 26 nm.
Photonics 10 01070 g005
Figure 6. (a) The variation of silver and gold layers with respect to loss at RI = 1.33, d = 0.98. (b) The influence of air holes of silver and gold at RI = 1.33, layer = 26 nm.
Photonics 10 01070 g006
Figure 7. (a) Amplitude sensitivity as a function of RI for silver element and (b) amplitude sensitivity for gold element.
Photonics 10 01070 g007
Figure 8. The function of FOM with the respect to variation of the analytes’ RI for (a) silver and (b) gold.
Photonics 10 01070 g008
Figure 9. The variation of the analytes’ RI as a function of wavelength with respect to (a) power spectrum and (b) transmission intensity.
Photonics 10 01070 g009
Figure 10. The function of linear fitting regression with respect to resonance wavelength and variation of refractive index for (a) loss peaks and (b) power spectrum.
Photonics 10 01070 g010
Table 1. The performance of PCF-SPR sensor with WS, resolution, AS, and FOM among gold and silver.
RIλpeak
[μm]
Sλ
[μm/RIU]
R
[RIU]
AS
[RIU−1]
FOM
[RIU−1]
silvergoldsilvergoldsilvergoldsilvergoldsilvergold
1.321.4511.5191.1001.1510.0100.0145−36−231631
1.341.4391.5021.0741.1210.0070.0106−27−242524
1.361.4301.4901.0521.0960.0100.0087−46−2712−0.2
1.381.4201.4811.0291.0730.0100.0111−35−321120
1.401.4091.4691.0061.049----------------2315
Table 2. The comparison study between the proposed sensor and the previous work done.
RI RangeWSAS [RIU−1]R [RIU]FOM [RIU−1]Ref
1.33–1.374200 nm/RIU300 3.33 × 10⁻⁵----[18]
1.33–1.384600 nm/RIU420 2.17 × 10⁻⁵----[40]
1.33–1.405000 nm/RIU3962.0 × 10−547[41]
1.35–1.408000 nm/RIU1443 12.2 × 10⁻⁶----[42]
1.45–1.488000 nm/RIU700 1.78 × 10−5138[43]
1.32–1.40513 μm/RIU−460.014531Proposed work
Disclaimer/Publisher’s Note: The statements, opinions and data contained in all publications are solely those of the individual author(s) and contributor(s) and not of MDPI and/or the editor(s). MDPI and/or the editor(s) disclaim responsibility for any injury to people or property resulting from any ideas, methods, instructions or products referred to in the content.

