Article

Graphene-Assisted Electromagnetically Induced Transparency-like Terahertz Metabiosensor for Ultra-Sensitive Detection of Ovalbumin

1
School of Electric Power, North China University of Water Resources and Electric Power, Zhengzhou 450045, China
2
School of Information Science and Engineering, Zaozhuang University, Zaozhuang 277160, China
3
School of Opto-Electronic Engineering, Zaozhuang University, Zaozhuang 277160, China
4
The Key Laboratory of Opto-Electronics Information and Technology, Institute of Laser and Opto-Electronics, College of Precision Instruments and Opto-Electronics Engineering, Tianjin University, Tianjin 300072, China
*
Authors to whom correspondence should be addressed.
Photonics 2023, 10(1), 67; https://doi.org/10.3390/photonics10010067
Submission received: 24 November 2022 / Revised: 29 December 2022 / Accepted: 4 January 2023 / Published: 7 January 2023

Abstract

:
Terahertz (THz) metamaterial (MM) biosensors are a potential method of biomolecule detection. However, there have been few reports on the detection of trace proteins. In this study, we designed a novel THz biosensor consisting of graphene, polyimide (PI), and electromagnetically induced transparency-like (EIT-like) MMs for the ultra-sensitive detection of ovalbumin (OVA). The doping analyte can influence the Fermi level and electrical conductivity of graphene, as well as the coupling of resonators in MMs. These changes are reflected in the magnitude, phase, and frequency changes in the transmission spectra. The biosensor achieved a high sensitivity function for OVA and reached a limit of detection (LoD) of 8.63 pg/mL. The results showed that by regulating the Fermi level of graphene between the valence band, Dirac point, and conduction band, the sensitivity and LoD of MM-based THz biosensors can be enhanced. Such biosensors have the potential to be used in the high-sensitivity detection of trace proteins in biomedical fields.

1. Introduction

Metamaterials (MMs) have become a research hotspot in the field of electromagnetic fields, particularly in the terahertz (THz) band, because of their ability to affect electromagnetic waves, and their applications include absorbers, modulators, and sensors [1,2,3,4,5,6,7,8,9,10,11,12,13,14]. The coupling mechanism of an MM to electromagnetic waves passing through it produces a unique resonant response based on its periodic structure [15,16,17,18]. In particular, the linewidths of spectra produced by electromagnetically induced transparency-like (EIT-like) methods are limited only by Drude damping, making them ideal for sensors [19,20,21,22,23,24]. Furthermore, because the vibrational modes of many biological macromolecules, such as proteins, DNA, and viruses, are in the THz spectrum [25,26,27,28], the design of EIT-like THz biosensors has also become an attractive option.
Although the research of biosensors based on MMs has yielded excellent results, there are still limitations in the limit of detection (LoD) and detection sensitivity for biosensors with only metallic metamaterials. Combining them with other materials to improve biosensor performance has become a worthwhile research direction as a result of this demand. Graphene is composed of pure carbon atoms arranged in a two-dimensional honeycomb lattice structure, and its carrier concentration and Fermi level can be altered using methods such as voltage, optical, and biological substances [29,30,31,32,33,34,35]. In previous studies, it was observed that combining MMs with graphene was a viable method of overcoming these disadvantages. Biosensors with graphene demonstrate excellent electrochemical responses due to the conductive nature of graphene [36,37]. Xu et al. integrated monolayer graphene into a THz MM absorber cavity, achieving an LoD of 0.2 ng for chlorpyrifos–methyl [33]. Lee et al., using graphene-combined nanoslot resonator arrays, realized a few nanomoles per milliliter when detecting DNA [38]. Zhou et al. proposed a THz graphene metasurface microfluidic platform that can detect 100 nM DNA short sequences [35]. Yao et al. detected whey protein down to 6.25 ng/mL with a novel THz biosensor that consisted of metasurfaces and a metal oxide semiconductor-like structure and was based on patterned graphene–polyimide–perovskite [39].
In this study, a novel THz biosensor was designed by combining trilayer graphene with EIT-like MMs (GELMs). Ovalbumin (OVA) content is used as the reference index for the evaluation of egg quality and freshness in the food industry [40]. As an analyte, OVA on the surface of the GELM can cause drastic changes in the dielectric environment, causing the Fermi level of graphene to move and resulting in multidimensional changes in the THz spectrum. According to this principle, highly sensitive, label-free sensing of OVA can be achieved. By conducting controlled experiments on the same MM structure without graphene, it was confirmed that graphene does have an important role in GELM. The LoD of GELM reached 8.63 pg/mL in the experiment and realized the multidimensional sensing of amplitude and phase, while the optimal biosensor’s LoD of 100 pg/mL was achieved in the previous study by combining MMs with other materials. The theoretical results obtained through the simulation were consistent with the experimental results. This study optimizes the LoD based on the previous study.

2. Materials and Methods

2.1. Simulation of GELM Biosensor

Using CST Microwave Studio software, we obtained full-wave numerical simulations using the frequency-domain solver. On the plane perpendicular to the z-direction of the incident THz wave, the directions of the electric and magnetic fields were along the x-and y-directions, respectively, as shown in Figure 1b. In this simulation model, the dielectric constant of the polyimide substrate was 3.1 and the tangent loss was 0.05. According to the Kubo formula, the conductivity of graphene can be estimated as follows [41]:
σ = σ i n t r a + σ i n t e r
where σ i n t r a represents the intraband conductivity and σ i n t e r represents the interband conductivity. According to the Pauli exclusion principle, on the condition that the incident photon energy ℏω is much smaller than its Fermi level E f (i.e., ω E f ), the σ i n t e r can be neglected because of the weak photon energy of the incident THz pulse. We can then obtain σ σ i n t r a , and the surface conductivity of graphene can be obtained from the Drude model as follows [42,43,44]:
σ g = i e 2 E f π 2 ( ω + i τ )
where τ denotes the relaxation time. The complex dielectric constant of graphene can be obtained using Equation (2) as follows:
ε g = 1 + i σ g ε 0 ω t g
where E f and t g represent the Fermi level and thickness of graphene, respectively. After setting the relaxation time to 1.0 ps, we calculated the conductivity of graphene with different Fermi levels and imported it to the material in the simulation.

2.2. Design of the GELM Biosensor

A schematic of the GELM is shown in Figure 1a. The polarization of the THz wave and the geometric parameters are shown in Figure 1b. Figure 1c shows the fabrication process of the GELM: a polyimide (PI) film with a thickness of 15 μm and a relative dielectric constant of 3.8 was spin-coated on a quartz substrate with a thickness of 300 μm (Figure 1c①), and an MM layer was fabricated on the PI film using a standard photolithography process (Figure 1c②). In the photolithography process, first, two layers of photoresist were spin-coated on the substrate, and structured lithography was performed using a lithography machine with the help of a mask. Then, the photoresist of the part irradiated by the photolithography device was washed off with the developing solution, and the groove of the designed structure was obtained. Second, a layer of aluminum with a thickness of 200 nm was deposited using magnetron sputtering technology, and the remaining photoresist and its upper metal layer were peeled off in acetone solution using an ultrasonic vibration machine, and the rest was the metal MM structure. A photomicrograph of part of the fabricated sample is shown in Figure 1d. To separate graphene from the MMs, a 3 μm thick PI layer was spin-coated onto the prepared MMs (Figure 1c③). To enhance the action of graphene, we used square trilayer graphene with a side length of 1.0 cm which was grown via copper-catalyzed chemical vapor deposition (CVD), and transferred it onto the surface of this 3 μm thick PI film via the wet transfer method using poly (methyl methacrylate) (PMMA) (Figure 1c④). It was then placed in acetone to remove the PMMA and dried. To confirm the quality of the trilayer graphene, the Raman spectrum was measured using a 514 nm excitation laser, as shown in Figure 1e. It can be observed that the 2D peak (approximately 1579 cm−1) is lower than the G peak (approximately 1579 cm−1). This information indicates that trilayer graphene is of high quality [39,45]. The concentrations of the OVA solutions tested in this study were C1 = 8.63 pg/mL, C2 = 4.42 ng/mL, C3 = 105.49 μg/mL, and C4 = 249.86 μg/mL. To exclude sample-to-sample variation leading to influence on the accuracy of the experimental results, the transmission spectra of all concentrations in the experiment were obtained on the same GELM. The test data were obtained using the terahertz time-domain spectrometer (THz-TDS) (Figure 1f,g) after evaporation of the water from the analyte dropped on the surface of the GELM. After testing the transmission spectra at low concentrations, we dropped higher concentrations of analyte on the surface of this GELM and evaporated the water for testing. The concentration for each test was calculated by taking into account all the previous test concentrations.

3. Result and Discussion

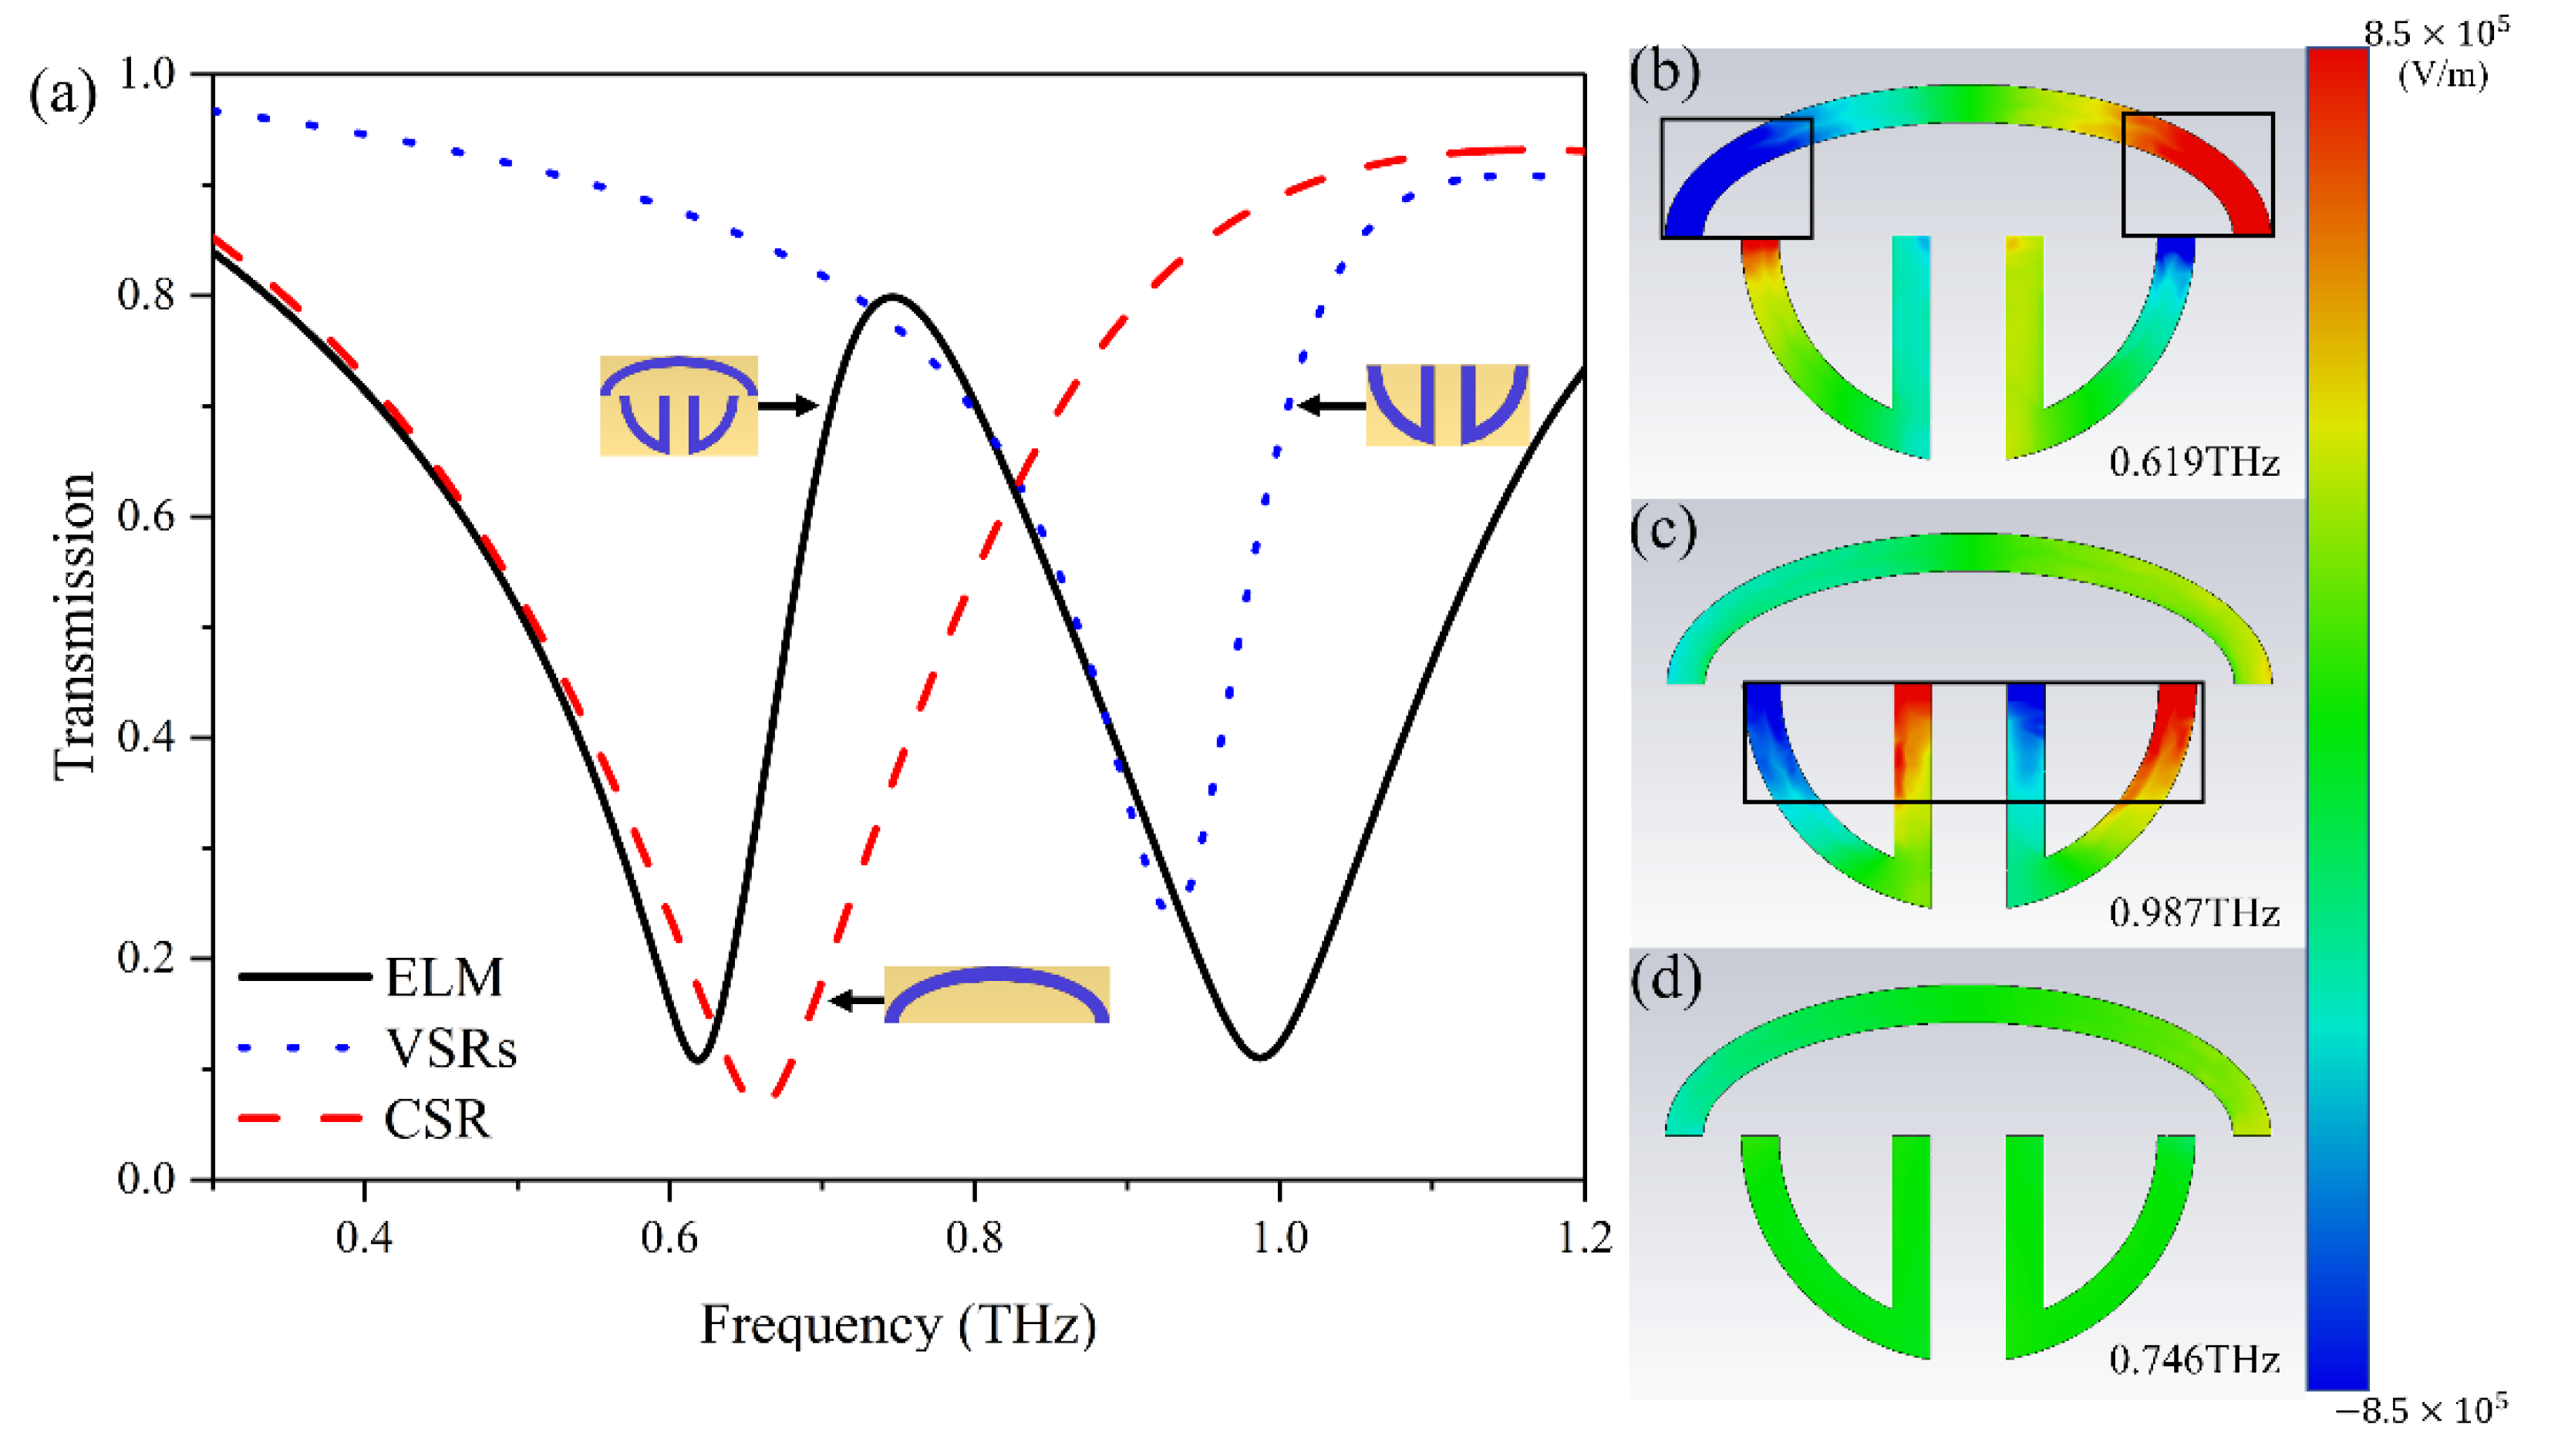
To verify that the MMs we designed were EIT-like, the transmission spectra were obtained through simulation, as shown in Figure 2a. To study the physical mechanism of EIT-like MMs (ELM), the transmission spectra of the upper C-shaped resonators (CSRs) and the lower double V-shaped resonators (VSRs) were simulated on PI substrates. For the single transmission spectrum of CSRs, the absorption peak excited by the incident wave appeared at 0.659 THz; for the single transmission spectrum of VSRs, the absorption peak appeared at 0.929 THz; and for the transmission spectrum after the interaction of CSRs and VSRs, the transparent window appeared at 0.746 THz. To further explain the mechanism of this EIT-like phenomenon, the electric field distributions were simulated at frequencies of 0.619 THz, 0.746 THz, and 0.987 THz, as shown in Figure 2b–d. It can be observed that a strong electric field appeared at both ends of the CSR at 0.619 THz while a stronger electric field appeared on the VSRs at 0.987 THz, as shown in the black box in Figure 2b,c. At 0.746 THz, the electric field on the entire ELM was suppressed (Figure 2d) owing to the coherent diffraction of the two resonators, and a transparent window was generated at this frequency. Therefore, it can be concluded that the ELM forms an EIT-like structure in the THz frequency band under the excitation of the incident wave.
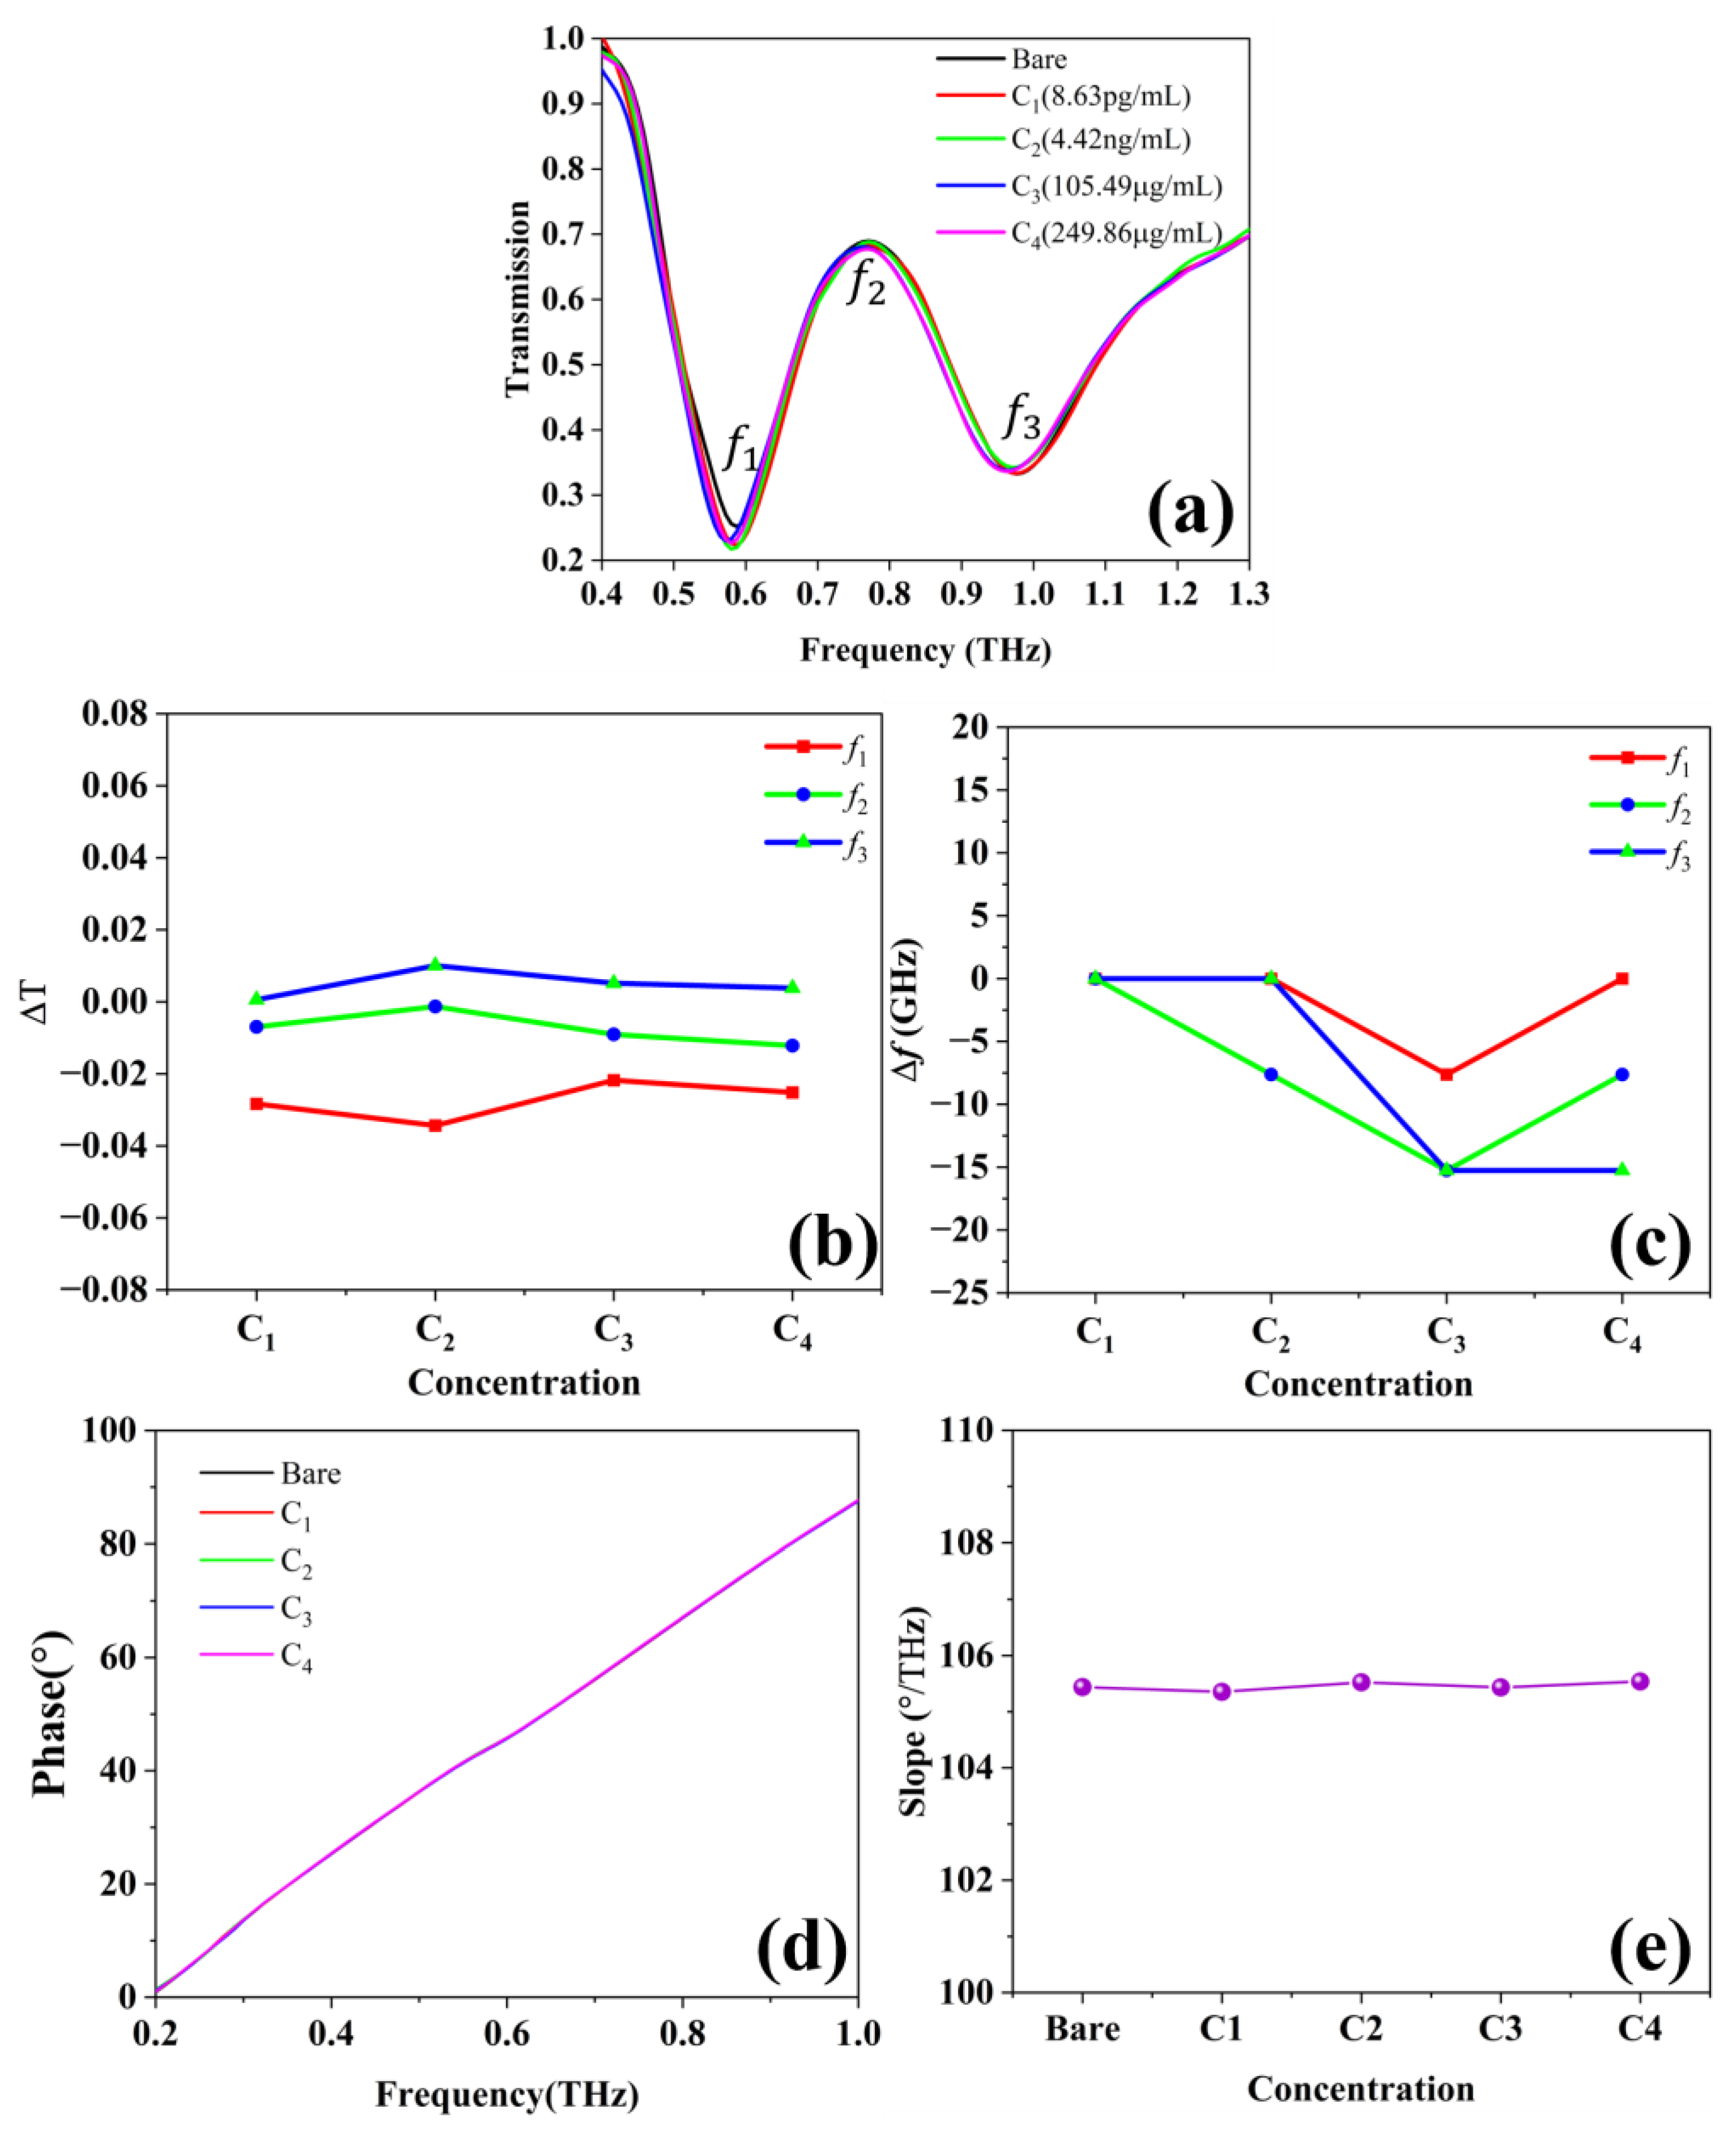
To investigate the role of graphene in biosensors, firstly, biosensing tests were conducted in this study using the same ELM without graphene as a control group, and the results are shown in Figure 3. There was a very slight difference in the transmission spectra of the five different concentrations of OVA on ELM, as shown in Figure 3a. To quantify the sensing properties of the ELM at different concentrations of ovalbumin protein (COP), we used ΔT and Δf to describe the value of the frequency change and amplitude change in f 1 , f 2 , and f 3 as follows:
Δ T = T O T B
Δ f = f O f B
where T O and f O are the transmissions at a certain COP on the GELM, and T B and f B are the transmission of the bare GELM. Figure 3b,c show the amount of variation in the amplitude and frequency of the different COP transmission spectra compared to bare at positions f1, f2, and f3. We can see that the change in COP had a minimal effect on the amplitude change and a weak effect on the phase. Figure 3d,e show the phase spectra for different COP concentrations, as well as the slope of the fitted primary function of this curve. It can be seen that the change in COP was essentially unchanged in phase and cannot be used as an indicator of biosensing.
After the analyte was dropped on the surface of the GELM and evaporated the water, the corresponding time-domain spectra were obtained using THz-TDS, and the amplitude information was obtained using fast Fourier transform (FFT), on which the experimental results are shown in Figure 4a. We observed that the transmission spectra moved toward lower frequencies with OVA compared with bare; however, a change in concentration did not shift the spectrum in frequency. In addition, the value of the amplitude changed with the change in COP; with the increase in OVA concentration, the transmittance gradually increased compared with the case of no analyte, but it decreased from C3 to C4. Graphene is a semimetal whose conduction and valence bands meet at Dirac points, which are six locations in momentum space: the vertices of its hexagonal Brillouin zone [34,46,47]. Figure 4b shows the simulation results for different Fermi levels of graphene. By comparing Figure 2a and Figure 4b, it was found that graphene causes a red shift in the spectral curve and a decrease in transmittance. However, the P-type doped graphene used in the experiments is different from the intrinsic semiconductor graphene calculated by the Drude model in the simulations. The effect of graphene in the experiments was not as good as the simulation results, which causes the differences in Figure 4a,b. In perfect graphene, the Fermi level is located at the Dirac point. However, owing to the manufacturing technique of CVD, the graphene in this study is p-type doped, and the initial Fermi level is located in the valence band, as shown in Figure 4c. When the negatively charged OVA is covered by GELM, resulting in graphene electron doping, and the Fermi level moves toward the conduction band, as shown by EF0 to EF1 in Figure 4c, the conductivity of graphene decreases and transmission increases. Although there are some differences between the experiment and simulation owing to the limitations, including the CVD process and THz-TDS accuracy, the overall consistency of the transmission spectra is shown by the change in the Fermi level of graphene.
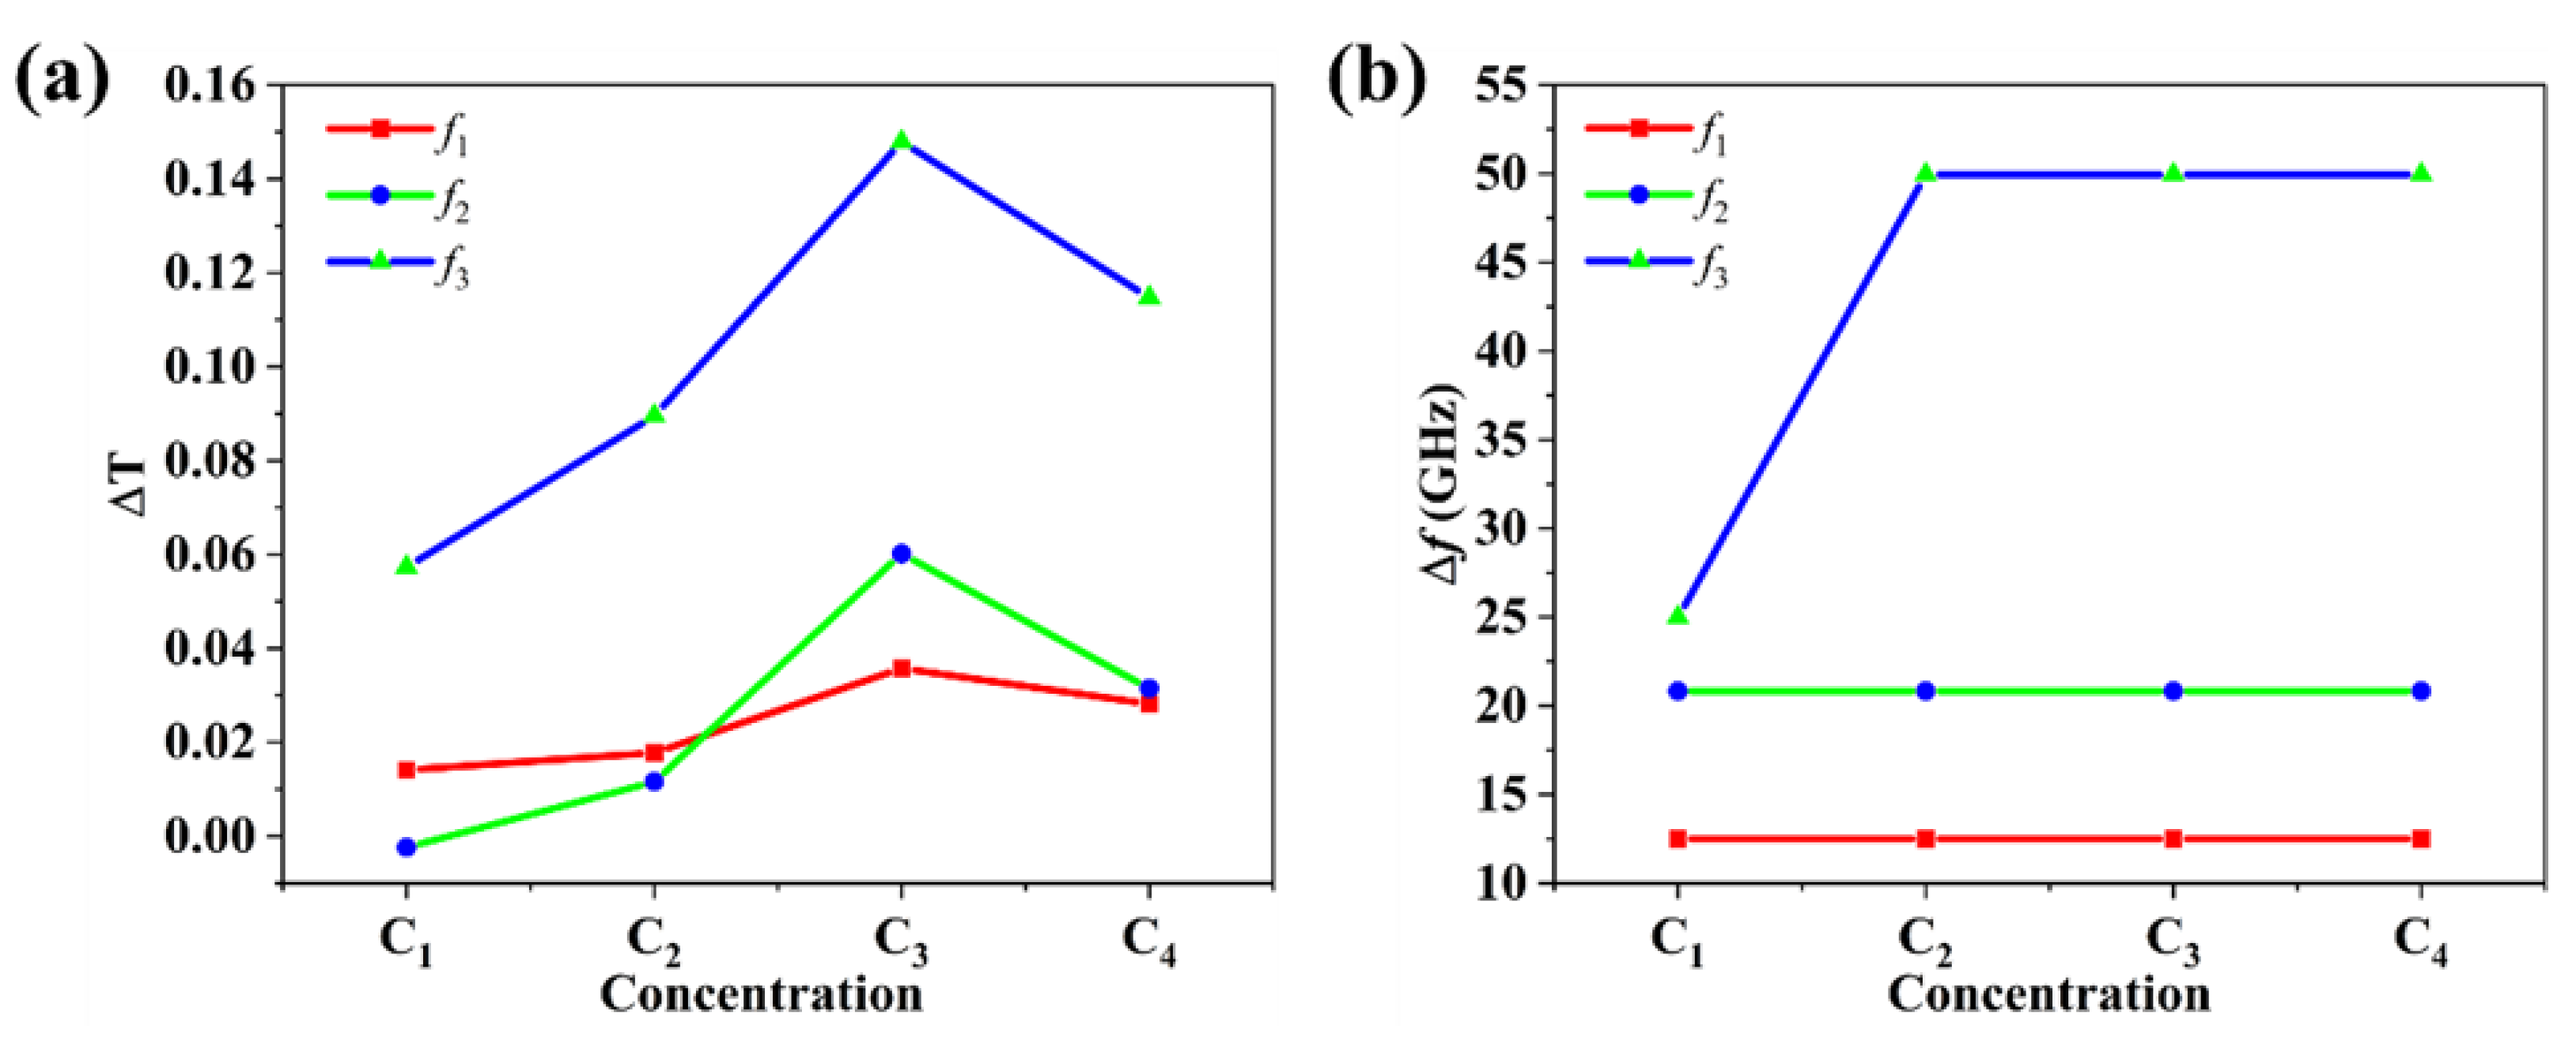
The ΔT and Δf of GELM were calculated using Equations (1) and (2), and the results are shown in Figure 5a,b. The change from bare to C1 on the sensor shifted the frequency of the transmission curve, but the change in COP did not shift the frequency. When the control group without graphene was used, the change in COP altered the microenvironment on the MMs, which can cause a change in the dielectric constant in the microenvironment. The change in the dielectric constant causes a change in the coupling frequency between light and matter. In the experimental group with graphene, the change in COP mainly affected the conductivity of the graphene and had relatively little effect on the dielectric constant on the MMs. Therefore, there were slight shifts in the resonate frequencies in the control group without graphene, but they were not visible in the experimental group with graphene when the COP changed from C1 to C4. With the increase in COP, the transmittance of the GELM gradually increased compared with that of the bare sample, but it decreased from C3 to C4. In particular, at f 1 , the energy was not high because of the lower frequency, and the change was not clear. This change can be explained by the Fermi level change in graphene, as shown in Figure 4c. After the change from EF0 to EF1, when the COP continued to increase to C2, the Fermi level transitioned from EF1 to EF2 and was closer to the Dirac point, which resulted in a decrease in the conductivity of graphene and an increase in the transmission of GELM. Until the COP reached C3, the Fermi level reached a position extremely close to the Dirac point, and the conductivity was approximately the minimum value; thus, the transmission amplitude of the GELM reached the maximum. When the COP continually increased to C4, the Fermi level crossed the Dirac point, and the conductivity started to increase. This change caused the transmission amplitude of the sensor to start to decrease.
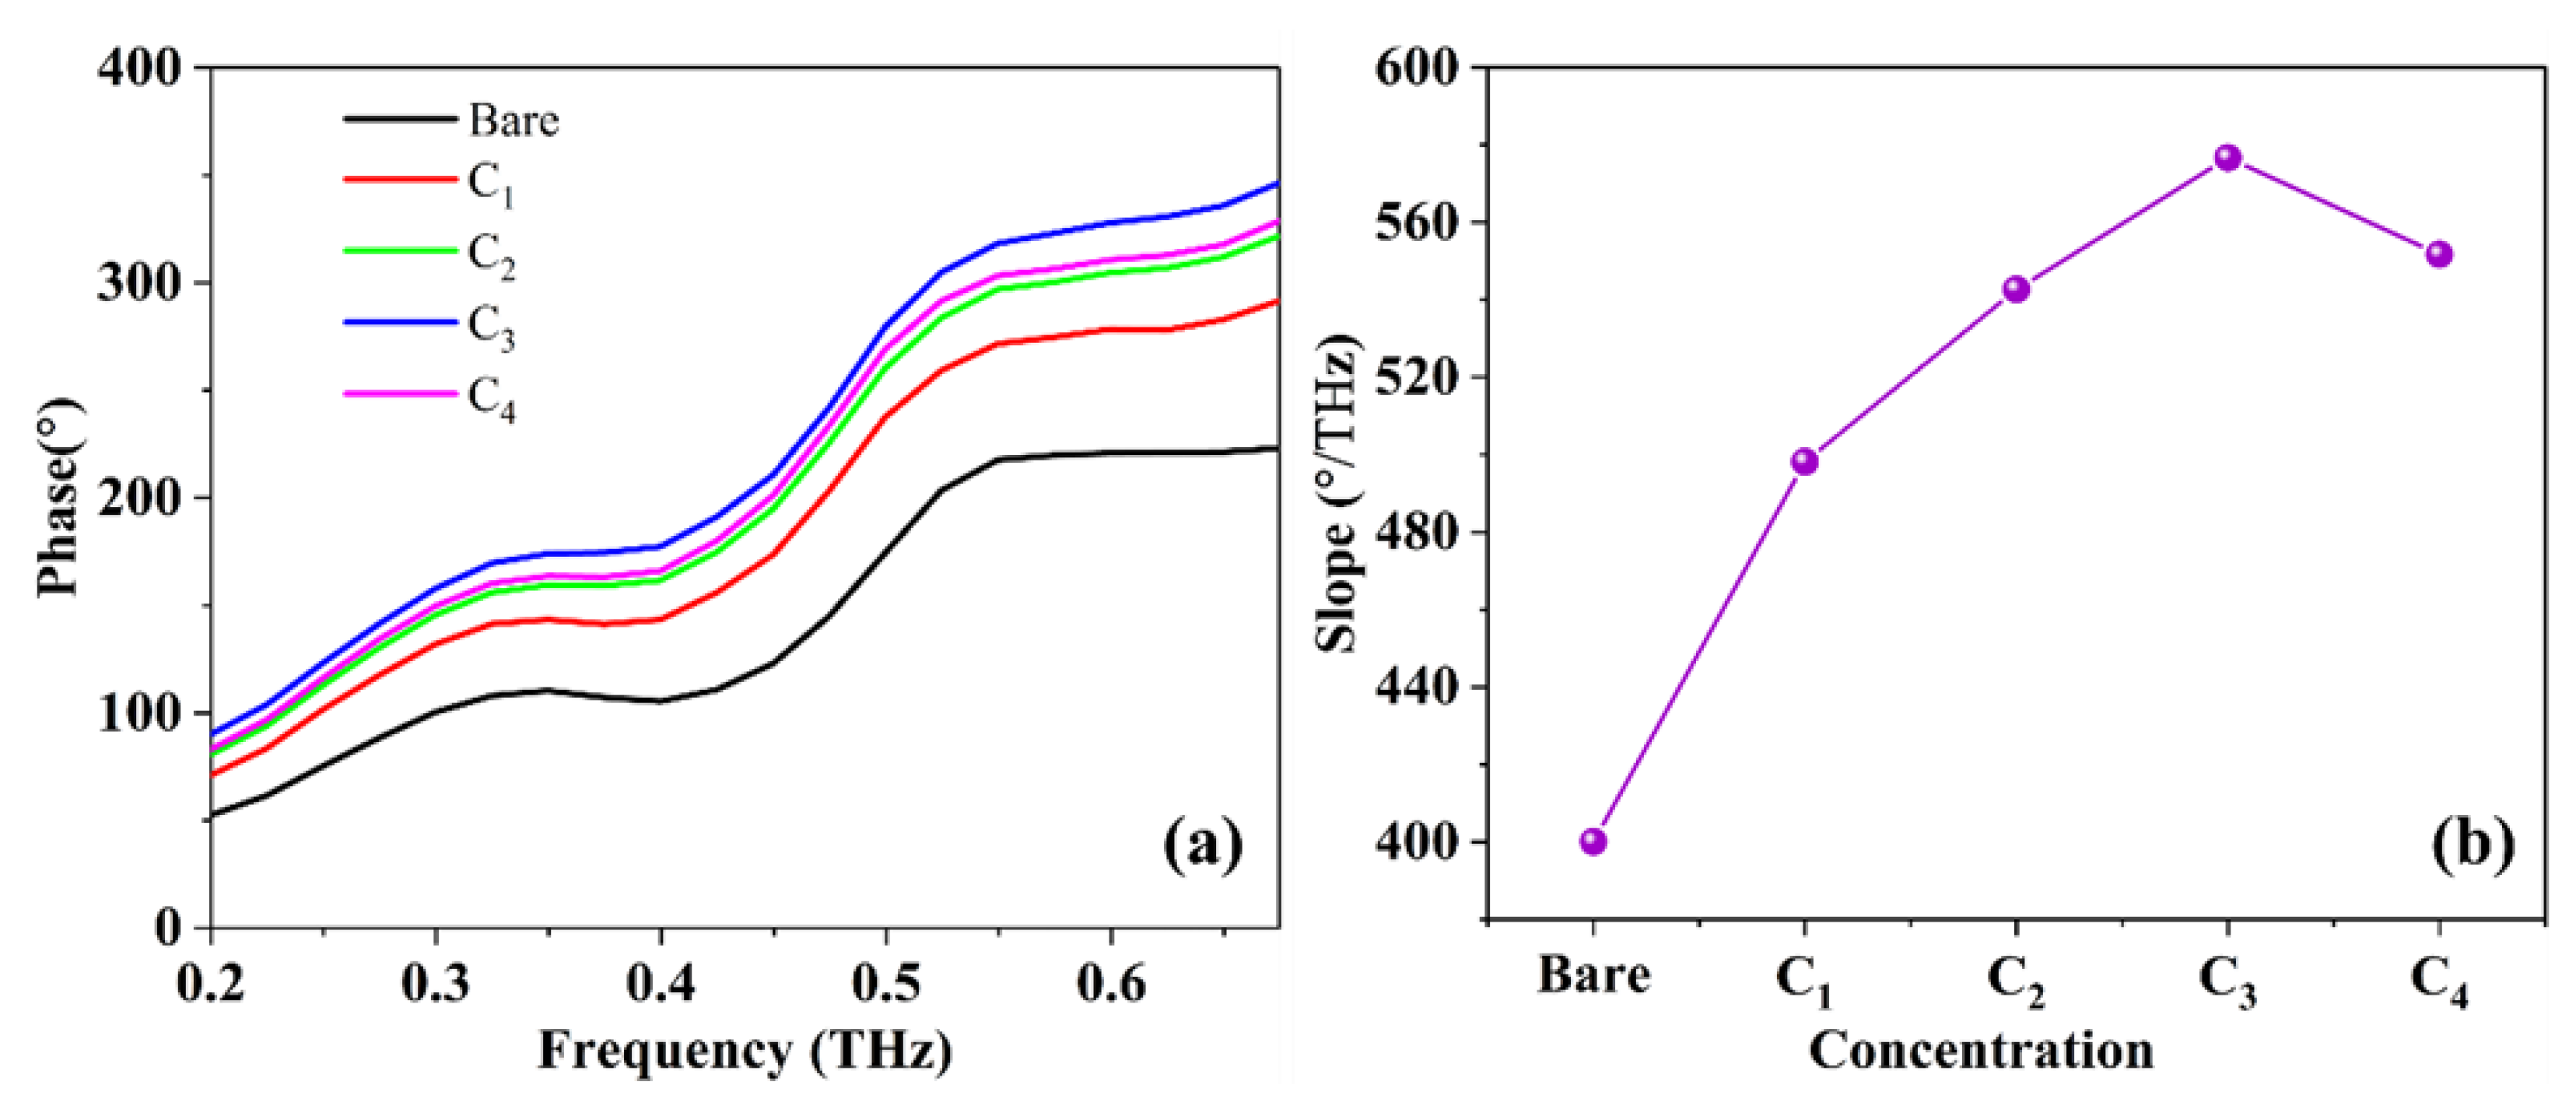
Moreover, the change in phase can also strongly demonstrate the sensitivity of the sensor to OVA. As with the transmission spectrum, the corresponding phase data can be obtained after the FFT of the time-domain signal obtained by THz-TDS, based on which the phase spectra of each COP are shown in Figure 6a. As can be observed, the phase value of each COP increased with the increase in frequency, and the phase value from bare to C3 increased and then decreased when the COP improved to C4 at the same frequency. This phase-change trend is the same as the pattern of the amplitude changes above. To characterize the performance of the GELM by changing the phase spectra, we fitted the phase curve of each COP to obtain its slope, as shown in Figure 6b. The slope showed a boost from bare to C3 and there was an approximately linear growth from C1 to C3; however, the slope declined from C3 to C4. This trend validates the theory of Fermi-level variation in graphene, as explained above. Another explanation for the turning point in C3 is that the COP reached the performance ceiling of the GELM. Continuing to increase the COP will result in excessive quantities of analyte, which causes the loss to increase, and the biosensor function cannot be realized. According to the above theory, the GELM can also perform biosensor functions by characterizing phase changes.
According to the analysis of the sensor performance in the above two dimensions, it can be observed that C1 and C3 are the concentration points of important changes. The change at C1 indicates that there was a significant change in the spectra compared to the COP of C1 with bare GELM on the surface. Compared with previous studies, the novelty of this study is that the LoD reached the C1 concentration of 8.631 pg/mL. Table 1 lists the LoD records achieved by previous studies by other researchers in the field of biosensors in the THz band. The change around C3 occurred because the Fermi level crossed the Dirac point, which changed the trend of the amplitude and phase.
To further analyze the internal mechanism of the GELM, the coupled resonator model can be used. This model describes the near-field coupling of CSRs and VSRs in EIT-like MMs. The interference in the MMs can be analytically described by coupling differential equations as follows [39,53]:
x ¨ 1 + γ 1   x ˙ 1 + ω 0 1   x 1 + κ x 2 = E
x ¨ 2 + γ 2 x ˙ 2 + ( ω 0 + δ ) 2   x 2 + κ x 1 = 0
where x 1 , x 2 , γ 1 , and γ 2 represent the resonant amplitudes and losses of CSRs and VSRs, respectively. ω 0 represents the resonant frequency of the CSRs, δ represents the detuning of the resonant frequency of the CSRs from the VSRs, and κ represents the coupling coefficient between the two resonators. By solving Equation (3), susceptibility χ is obtained as follows:
χ = χ r + i χ i ( ω ω 0 δ ) + i γ 2 2 ( ω ω 0 + i γ 1 2 ) ( ω ω 0 δ + i γ 2 2 ) κ 2 4
where χ r and χ i represent the real and imaginary parts of χ, respectively. As is well known, χ i is proportional to the energy losses; therefore, the transmission of biosensor T can be acquired as follows [54]:
T = 1 g χ i
where g represents the geometric parameter describing the strength of the coupling of the CSRs with the incident electric field E. Through Equations (3) and (4), the corresponding fitting parameters of resonators for different analyte concentrations can be acquired, as shown in Figure 7. (The fitting data are in the supporting information).
As shown in Figure 7, there was no significant change in δ with the increasing concentration. The change in γ 2 and κ showed the same trend; that is, from C1 to C3, the values gradually increased with the increase in COP, then the values decreased when the COP ascended to C4. For γ 1 , the trend of the change in value is opposite to that of γ 2 when the COP increases. The reason is that as the VSRs are gradually excited, the CSRs are gradually suppressed. This can be seen in the value slump when the COP increased from C2 to C3, and then rose back when the COP increased to C4 continually. The clearest change was that both γ 2 and κ reached their highest values at C3, which brought the Fermi level of graphene closest to the Dirac point, but γ 1 decreased sharply. According to the change in the amplitude at f 2 , as shown in Figure 5a, it can be considered that because the total loss of the two resonators was the lowest at C3, the amplitude was the largest here. Combined with the explanation of the Fermi level mentioned above, it can be inferred that the coupling situation of the two-part resonators (i.e., CSRs and VSRs) in the EIT-like MMs was indeed affected by the Fermi level change in graphene. These changes indicated that the introduction of the analyte changed the local dielectric environment of the sensor, which changed the Fermi level of graphene, and the change in graphene affected the coupling of resonators in the MMs.

4. Conclusions

In this study, we designed a THz biosensor that combined EIT-like MMs and graphene. Experiments showed that the biosensor could achieve an LoD of 8.63 pg/mL for OVA and realize the sensing functions of amplitude, phase, and frequency. Its sensitivity was an order of magnitude higher than that of the published papers in the LoD dimension. The internal mechanism of the biosensor for analyte sensing was explained by simulation, fitting of the coupled resonator model, and theoretical analysis of the graphene electric field change. The results showed that, because the EIT-like MMs combined with graphene, when the sensor was covered with OVA, it changed the Fermi level of graphene and then changed the electrical conductivity. Moreover, the change in electrical conductivity could affect the coupling of the resonators in the MMs. As a result, the multidimensional ultra-sensitive sensing of OVA has been realized. This study improves the detection limit of THz sensors and broadens the scope of research in this field.

Supplementary Materials

The following supporting information can be downloaded at: https://www.mdpi.com/article/10.3390/photonics10010067/s1, Figure S1: Results of data fitting at Bare concentration (R-square is 0.97853); Figure S2: Results of data fitting at C1 concentration (R-square is 0.97265); Figure S3: Results of data fitting at C2 concentration (R-square is 0.96050); Figure S4: Results of data fitting at C3 concentration (R-square is 0.96930); Figure S5: Results of data fitting at C3 concentration (R-square is 0.96911).

Author Contributions

Conceptualization, R.X. and H.Y.; methodology, P.B.; software, L.L.; validation, X.Y., X.H., and Z.L.; formal analysis, Z.W.; investigation, M.W.; resources, L.L.; data curation, P.B.; writing—original draft preparation, R.X.; writing—review and editing, H.Y.; visualization, X.Y.; supervision, J.Y.; project administration, J.Y.; funding acquisition, L.L. All authors have read and agreed to the published version of the manuscript.

Funding

This research was funded by the Special Funding of the Taishan Scholar Project (grant no. tsqn201909150), the National Natural Science Foundation of China (grant no. 61701434, 61601183, 61735010, 62201496), the Natural Science Foundation of Shandong Province (grant no. ZR2020FK008, ZR2021MF014, ZR2022QF054), the Qingchuang Science and Technology Plan of Shandong Universities (grant no. 2019KJN001) and Young Backbone Teachers in University of Henan Province (grant no. 2020GGJS099).

Institutional Review Board Statement

Not applicable.

Informed Consent Statement

Not applicable.

Data Availability Statement

Data underlying the results presented in this paper are not publicly available at this time but may be obtained from the authors upon reasonable request.

Conflicts of Interest

The authors declare no conflict of interest.

References

  1. Rahman, B.M.A.; Viphavakit, C.; Chitaree, R.; Ghosh, S.; Pathak, A.K.; Verma, S.; Sakda, N. Optical Fiber, Nanomaterial, and THz-Metasurface-Mediated Nano-Biosensors: A Review. Biosensors 2022, 12, 42. [Google Scholar] [CrossRef] [PubMed]
  2. Huang, C.; Zhang, Y.; Liang, L.; Yao, H.; Qiu, F.; Liu, W. Analysis of Graphene-Based Tunable THz Four-Band Absorption Sensors. Appl. Opt. 2022, 61, 2103–2107. [Google Scholar] [CrossRef]
  3. Degl’Innocenti, R.; Lin, H.; Navarro-Cía, M. Recent Progress in Terahertz Metamaterial Modulators. Nanophotonics 2022, 11, 1485–1514. [Google Scholar] [CrossRef]
  4. Chen, B.; Wu, J.; Li, W.; Zhang, C.; Fan, K.; Xue, Q.; Chi, Y.; Wen, Q.; Jin, B.; Chen, J.; et al. Programmable Terahertz Metamaterials with Non-Volatile Memory. Laser Photonics Rev. 2022, 16, 2100472. [Google Scholar] [CrossRef]
  5. Yang, J.; Qi, L.M.; Wu, L.Q.; Lan, F.; Lan, C.W.; Tao, X.; Liu, Z.Y. Research Progress of Terahertz Metamaterial Biosensors. Spectrosc. Spectr. Anal. 2021, 41, 1669–1677. [Google Scholar] [CrossRef]
  6. Yang, J.; Lin, Y.-S. Design of Tunable Terahertz Metamaterial Sensor with Single- and Dual-Resonance Characteristic. Nanomaterials 2021, 11, 2212. [Google Scholar] [CrossRef]
  7. Vafapour, Z.; Dutta, M.; Stroscio, M.A. Sensing, Switching and Modulating Applications of a Superconducting THz Metamaterial. IEEE Sens. J. 2021, 21, 15187–15195. [Google Scholar] [CrossRef]
  8. Mayani, M.G.; Herraiz-Martinez, F.J.; Domingo, J.M.; Giannetti, R. Resonator-Based Microwave Metamaterial Sensors for Instrumentation: Survey, Classification, and Performance Comparison. IEEE Trans. Instrum. Meas. 2021, 70, 1–14. [Google Scholar] [CrossRef]
  9. Luo, Z.; Ji, S.; Zhao, J.; Wu, H.; Dai, H. A Multiband Metamaterial Absorber for GHz and THz Simultaneously. Results Phys. 2021, 30, 104893. [Google Scholar] [CrossRef]
  10. Liu, X.; Ren, Z.; Yang, T.; Chen, L.; Wang, Q.; Zhou, J. Tunable Metamaterial Absorber Based on Resonant Strontium Titanate Artificial Atoms. J. Mater. Sci. Technol. 2021, 62, 249–253. [Google Scholar] [CrossRef]
  11. Kindness, S.J.; Almond, N.W.; Michailow, W.; Wei, B.; Delfanazari, K.; Braeuninger-Weimer, P.; Hofmann, S.; Beere, H.E.; Ritchie, D.A.; Degl’Innocenti, R. A Terahertz Chiral Metamaterial Modulator. Adv. Opt. Mater. 2020, 8, 2000581. [Google Scholar] [CrossRef]
  12. Chiang, W.F.; Silalahi, H.M.; Chiang, Y.C.; Hsu, M.C.; Zhang, Y.S.; Liu, J.H.; Yu, Y.; Lee, C.R.; Huang, C.Y. Continuously Tunable Intensity Modulators with Large Switching Contrasts Using Liquid Crystal Elastomer Films That Are Deposited with Terahertz Metamaterials. Opt. Express 2020, 28, 27676–27687. [Google Scholar] [CrossRef] [PubMed]
  13. Forouzeshfard, M.R.; Ghafari, S.; Vafapour, Z. Solute Concentration Sensing in Two Aqueous Solution Using an Optical Metamaterial Sensor. J. Lumin. 2021, 230, 117734. [Google Scholar] [CrossRef]
  14. Yang, M.; Zhang, Z.; Liang, L.; Yan, X.; Wei, D.; Song, X.; Zhang, H.; Lu, Y.; Wang, M.; Yao, J. Sensitive Detection of the Concentrations for Normal Epithelial Cells Based on Fano Resonance Metamaterial Biosensors in Terahertz Range. Appl. Opt. 2019, 58, 6268–6273. [Google Scholar] [CrossRef] [PubMed]
  15. Chen, S.; Li, Z.; Liu, W.; Cheng, H.; Tian, J. From Single-Dimensional to Multidimensional Manipulation of Optical Waves with Metasurfaces. Adv. Mater. 2019, 31, e1802458. [Google Scholar] [CrossRef]
  16. Cong, L.; Singh, R. Spatiotemporal Dielectric Metasurfaces for Unidirectional Propagation and Reconfigurable Steering of Terahertz Beams. Adv. Mater. Deerfield Beach Fla 2020, 32, e2001418. [Google Scholar] [CrossRef]
  17. Dong, T.; Li, S.; Manjappa, M.; Yang, P.; Zhou, J.; Kong, D.; Quan, B.; Chen, X.; Ouyang, C.; Dai, F.; et al. Nonlinear THz-Nano Metasurfaces. Adv. Funct. Mater. 2021, 31, 2100463. [Google Scholar] [CrossRef]
  18. Dănilă, O.; Mănăilă-Maximean, D.; Bărar, A.; Loiko, V.A. Non-Layered Gold-Silicon and All-Silicon Frequency-Selective Metasurfaces for Potential Mid-Infrared Sensing Applications. Sensors 2021, 21, 5600. [Google Scholar] [CrossRef]
  19. Askari, M.; Bahadoran, M. A Refractive-Index-Based Microwave Sensor Based on Classical Electromagnetically Induced Transparency in Metamaterials. Optik 2022, 253, 168589. [Google Scholar] [CrossRef]
  20. Li, G.; Yang, J.; Zhang, Z.; Wen, K.; Tao, Y.; Han, Y.; Zhang, Z. Double Spectral Electromagnetically Induced Transparency Based on Double-Bar Dielectric Grating and Its Sensor Application. Appl. Sci. 2020, 10, 3033. [Google Scholar] [CrossRef]
  21. Xu, Z.; Wang, Y.; Fang, S. Dielectric Characterization of Liquid Mixtures Using EIT-like Transmission Window. IEEE Sens. J. 2021, 21, 17859–17867. [Google Scholar] [CrossRef]
  22. Yan, X.; Yang, M.; Zhang, Z.; Liang, L.; Wei, D.; Wang, M.; Zhang, M.; Wang, T.; Liu, L.; Xie, J.; et al. The Terahertz Electromagnetically Induced Transparency-like Metamaterials for Sensitive Biosensors in the Detection of Cancer Cells. Biosens. Bioelectron. 2019, 126, 485–492. [Google Scholar] [CrossRef] [PubMed]
  23. Yang, M.; Liang, L.; Zhang, Z.; Xin, Y.; Wei, D.; Song, X.; Zhang, H.; Lu, Y.; Wang, M.; Zhang, M.; et al. Electromagnetically Induced Transparency-like Metamaterials for Detection of Lung Cancer Cells. Opt. Express 2019, 27, 19520–19529. [Google Scholar] [CrossRef]
  24. Zhang, J.; Mu, N.; Liu, L.; Xie, J.; Feng, H.; Yao, J.; Chen, T.; Zhu, W. Highly Sensitive Detection of Malignant Glioma Cells Using Metamaterial-Inspired THz Biosensor Based on Electromagnetically Induced Transparency. Biosens. Bioelectron. 2021, 185, 113241. [Google Scholar] [CrossRef]
  25. Lin, S.; Xu, X.; Hu, F.; Chen, Z.; Wang, Y.; Zhang, L.; Peng, Z.; Li, D.; Zeng, L.; Chen, Y.; et al. Using Antibody Modified Terahertz Metamaterial Biosensor to Detect Concentration of Carcinoembryonic Antigen. IEEE J. Sel. Top. Quantum Electron. 2021, 27, 1–7. [Google Scholar] [CrossRef]
  26. Wang, G.; Zhu, F.; Lang, T.; Liu, J.; Hong, Z.; Qin, J. All-Metal Terahertz Metamaterial Biosensor for Protein Detection. Nanoscale Res. Lett. 2021, 16, 109. [Google Scholar] [CrossRef] [PubMed]
  27. Xiong, W.; Shen, J. Fingerprint Extraction from Interference Destruction Terahertz Spectrum. Opt. Express 2010, 18, 21798–21803. [Google Scholar] [CrossRef] [PubMed]
  28. Zhao, G.; Yu, B.; Zhang, C. Terahertz Spectroscopic Investigation of Four Kinds of Vitamins. J. Appl. Phys. 2009, 106, 104702. [Google Scholar] [CrossRef]
  29. Jia, Z.; Huang, L.; Su, J.; Tang, B. Tunable Electromagnetically Induced Transparency-Like in Graphene Metasurfaces and Its Application as a Refractive Index Sensor. J. Light. Technol. 2021, 39, 1544–1549. [Google Scholar] [CrossRef]
  30. Liu, J.-Y.; Huang, T.-J.; Yin, L.-Z.; Han, F.-Y.; Liu, P.-K. High Sensitivity Terahertz Biosensor Based on Goos-Hänchen Effect in Graphene. IEEE Photonics J. 2020, 12, 1–6. [Google Scholar] [CrossRef]
  31. Monfared, Y.E.; Qasymeh, M. Graphene-Assisted Infrared Plasmonic Metamaterial Absorber for Gas Detection. Results Phys. 2021, 23, 103986. [Google Scholar] [CrossRef]
  32. Veeraselvam, A.; Mohammed, G.N.A.; Savarimuthu, K.; Anguera, J.; Paul, J.C.; Krishnan, R.K. Refractive Index-Based Terahertz Sensor Using Graphene for Material Characterization. Sens. Basel. 2021, 21, 8151. [Google Scholar] [CrossRef]
  33. Xu, W.; Xie, L.; Zhu, J.; Tang, L.; Singh, R.; Wang, C.; Ma, Y.; Chen, H.-T.; Ying, Y. Terahertz Biosensing with a Graphene-Metamaterial Heterostructure Platform. Carbon 2019, 141, 247–252. [Google Scholar] [CrossRef]
  34. Yao, H.; Yan, X.; Yang, M.; Yang, Q.; Liu, Y.; Li, A.; Wang, M.; Wei, D.; Tian, Z.; Liang, L. Frequency-Dependent Ultrasensitive Terahertz Dynamic Modulation at the Dirac Point on Graphene-Based Metal and All-Dielectric Metamaterials. Carbon 2021, 184, 400–408. [Google Scholar] [CrossRef]
  35. Zhou, R.; Wang, C.; Huang, Y.; Huang, K.; Wang, Y.; Xu, W.; Xie, L.; Ying, Y. Label-Free Terahertz Microfluidic Biosensor for Sensitive DNA Detection Using Graphene-Metasurface Hybrid Structures. Biosens. Bioelectron. 2021, 188, 113336. [Google Scholar] [CrossRef] [PubMed]
  36. Tabish, T.A.; Hayat, H.; Abbas, A.; Narayan, R.J. Graphene Quantum Dots-Based Electrochemical Biosensing Platform for Early Detection of Acute Myocardial Infarction. Biosensors 2022, 12, 77. [Google Scholar] [CrossRef] [PubMed]
  37. Tabish, T.A.; Abbas, A.; Narayan, R.J. Graphene Nanocomposites for Transdermal Biosensing. WIREs Nanomed. Nanobiotechnology 2021, 13, e1699. [Google Scholar] [CrossRef]
  38. Lee, S.-H.; Choe, J.-H.; Kim, C.; Bae, S.; Kim, J.-S.; Park, Q.-H.; Seo, M. Graphene Assisted Terahertz Metamaterials for Sensitive Bio-Sensing. Sens. Actuators B Chem. 2020, 310, 127841. [Google Scholar] [CrossRef]
  39. Yao, H.; Sun, Z.; Yan, X.; Yang, M.; Liang, L.; Ma, G.; Gao, J.; Li, T.; Song, X.; Zhang, H.; et al. Ultrasensitive, Light-Induced Reversible Multidimensional Biosensing Using THz Metasurfaces Hybridized with Patterned Graphene and Perovskite. Nanophotonics 2022, 11, 1219–1230. [Google Scholar] [CrossRef]
  40. Fu, X.; Sheng, L.; Yu, Y.; Ma, M.; Cai, Z.; Huang, X. Rapid and Universal Detection of Ovalbumin Based on N,O,P-Co-Doped Carbon Dots-Fluorescence Resonance Energy Transfer Technology. Sens. Actuators B Chem. 2018, 269, 278–287. [Google Scholar] [CrossRef]
  41. Jiang, J.; Zhang, X.; Zhang, W.; Liang, S.; Wu, H.; Jiang, L.; Li, X. Out-of-Plane Focusing and Manipulation of Terahertz Beams Based on a Silicon/Copper Grating Covered by Monolayer Graphene. Opt. Express 2017, 25, 16867–16878. [Google Scholar] [CrossRef] [PubMed]
  42. Zhang, Y.; Li, Y.; Cao, Y.; Liu, Y.; Zhang, H. Graphene Induced Tunable and Polarization-Insensitive Broadband Metamaterial Absorber. Opt. Commun. 2017, 382, 281–287. [Google Scholar] [CrossRef]
  43. Hanson, G.W. Dyadic Green’s Functions and Guided Surface Waves for a Surface Conductivity Model of Graphene. J. Appl. Phys. 2008, 103, 064302. [Google Scholar] [CrossRef] [Green Version]
  44. Horng, J.; Chen, C.-F.; Geng, B.; Girit, C.; Zhang, Y.; Hao, Z.; Bechtel, H.A.; Martin, M.; Zettl, A.; Crommie, M.F.; et al. Drude Conductivity of Dirac Fermions in Graphene. Phys. Rev. B 2011, 83, 165113. [Google Scholar] [CrossRef] [Green Version]
  45. Xu, G.; Zhang, Y.; Duan, X.; Balandin, A.A.; Wang, K.L. Variability Effects in Graphene: Challenges and Opportunities for Device Engineering and Applications. Proc. IEEE 2013, 101, 1670–1688. [Google Scholar] [CrossRef] [Green Version]
  46. Bardarson, J.H.; Tworzydlo, J.; Brouwer, P.W.; Beenakker, C.W. One-Parameter Scaling at the Dirac Point in Graphene. Phys. Rev. Lett. 2007, 99, 106801. [Google Scholar] [CrossRef] [Green Version]
  47. Young, S.M.; Zaheer, S.; Teo, J.C.Y.; Kane, C.L.; Mele, E.J.; Rappe, A.M. Dirac Semimetal in Three Dimensions. Phys. Rev. Lett. 2012, 108, 140405. [Google Scholar] [CrossRef] [PubMed] [Green Version]
  48. Guo, X.; Zhang, Z.; Yang, M.; Bing, P.; Yan, X.; Yang, Q.; Wei, D.; Liu, L.; Liang, L.; Yao, J. Time-Frequency Double Domain Resolving by Electromagnetically Induced Transparency Metasensors for Rapid and Label-Free Detection of Cancer Biomarker Midkine. Opt. Lasers Eng. 2021, 142, 106566. [Google Scholar] [CrossRef]
  49. Xu, W.; Huang, Y.; Zhou, R.; Wang, Q.; Yin, J.; Kono, J.; Ping, J.; Xie, L.; Ying, Y. Metamaterial-Free Flexible Graphene-Enabled Terahertz Sensors for Pesticide Detection at Bio-Interface. ACS Appl. Mater. Interfaces 2020, 12, 44281–44287. [Google Scholar] [CrossRef]
  50. Cui, Z.; Wang, Y.; Shi, Y.; Zhu, Y.; Zhang, D.; Hong, Z.; Feng, X. Significant Sensing Performance of an All-Silicon Terahertz Metasurface Chip for Bacillus Thuringiensis Cry1Ac Protein. Photonics Res. 2022, 10, 740. [Google Scholar] [CrossRef]
  51. Yan, X.; Li, T.; Ma, G.; Gao, J.; Wang, T.; Yao, H.; Yang, M.; Liang, L.; Li, J.; Li, J.; et al. Ultra-Sensitive Dirac-Point-Based Biosensing on Terahertz Metasurfaces Comprising Patterned Graphene and Perovskites. Photonics Res. 2022, 10, 280. [Google Scholar] [CrossRef]
  52. Zeng, Q.; Liu, W.; Lin, S.; Chen, Z.; Zeng, L.; Hu, F. Aptamer HB5 Modified Terahertz Metasurface Biosensor Used for Specific Detection of HER2. Sens. Actuators B Chem. 2022, 355, 131337. [Google Scholar] [CrossRef]
  53. Xiao, S.; Wang, T.; Liu, T.; Yan, X.; Li, Z.; Xu, C. Active Modulation of Electromagnetically Induced Transparency Analogue in Terahertz Hybrid Metal-Graphene Metamaterials. Carbon 2018, 126, 271–278. [Google Scholar] [CrossRef] [Green Version]
  54. Ding, J.; Arigong, B.; Ren, H.; Zhou, M.; Shao, J.; Lu, M.; Chai, Y.; Lin, Y.; Zhang, H. Tuneable Complementary Metamaterial Structures Based on Graphene for Single and Multiple Transparency Windows. Sci. Rep. 2014, 4, 6128. [Google Scholar] [CrossRef] [PubMed]
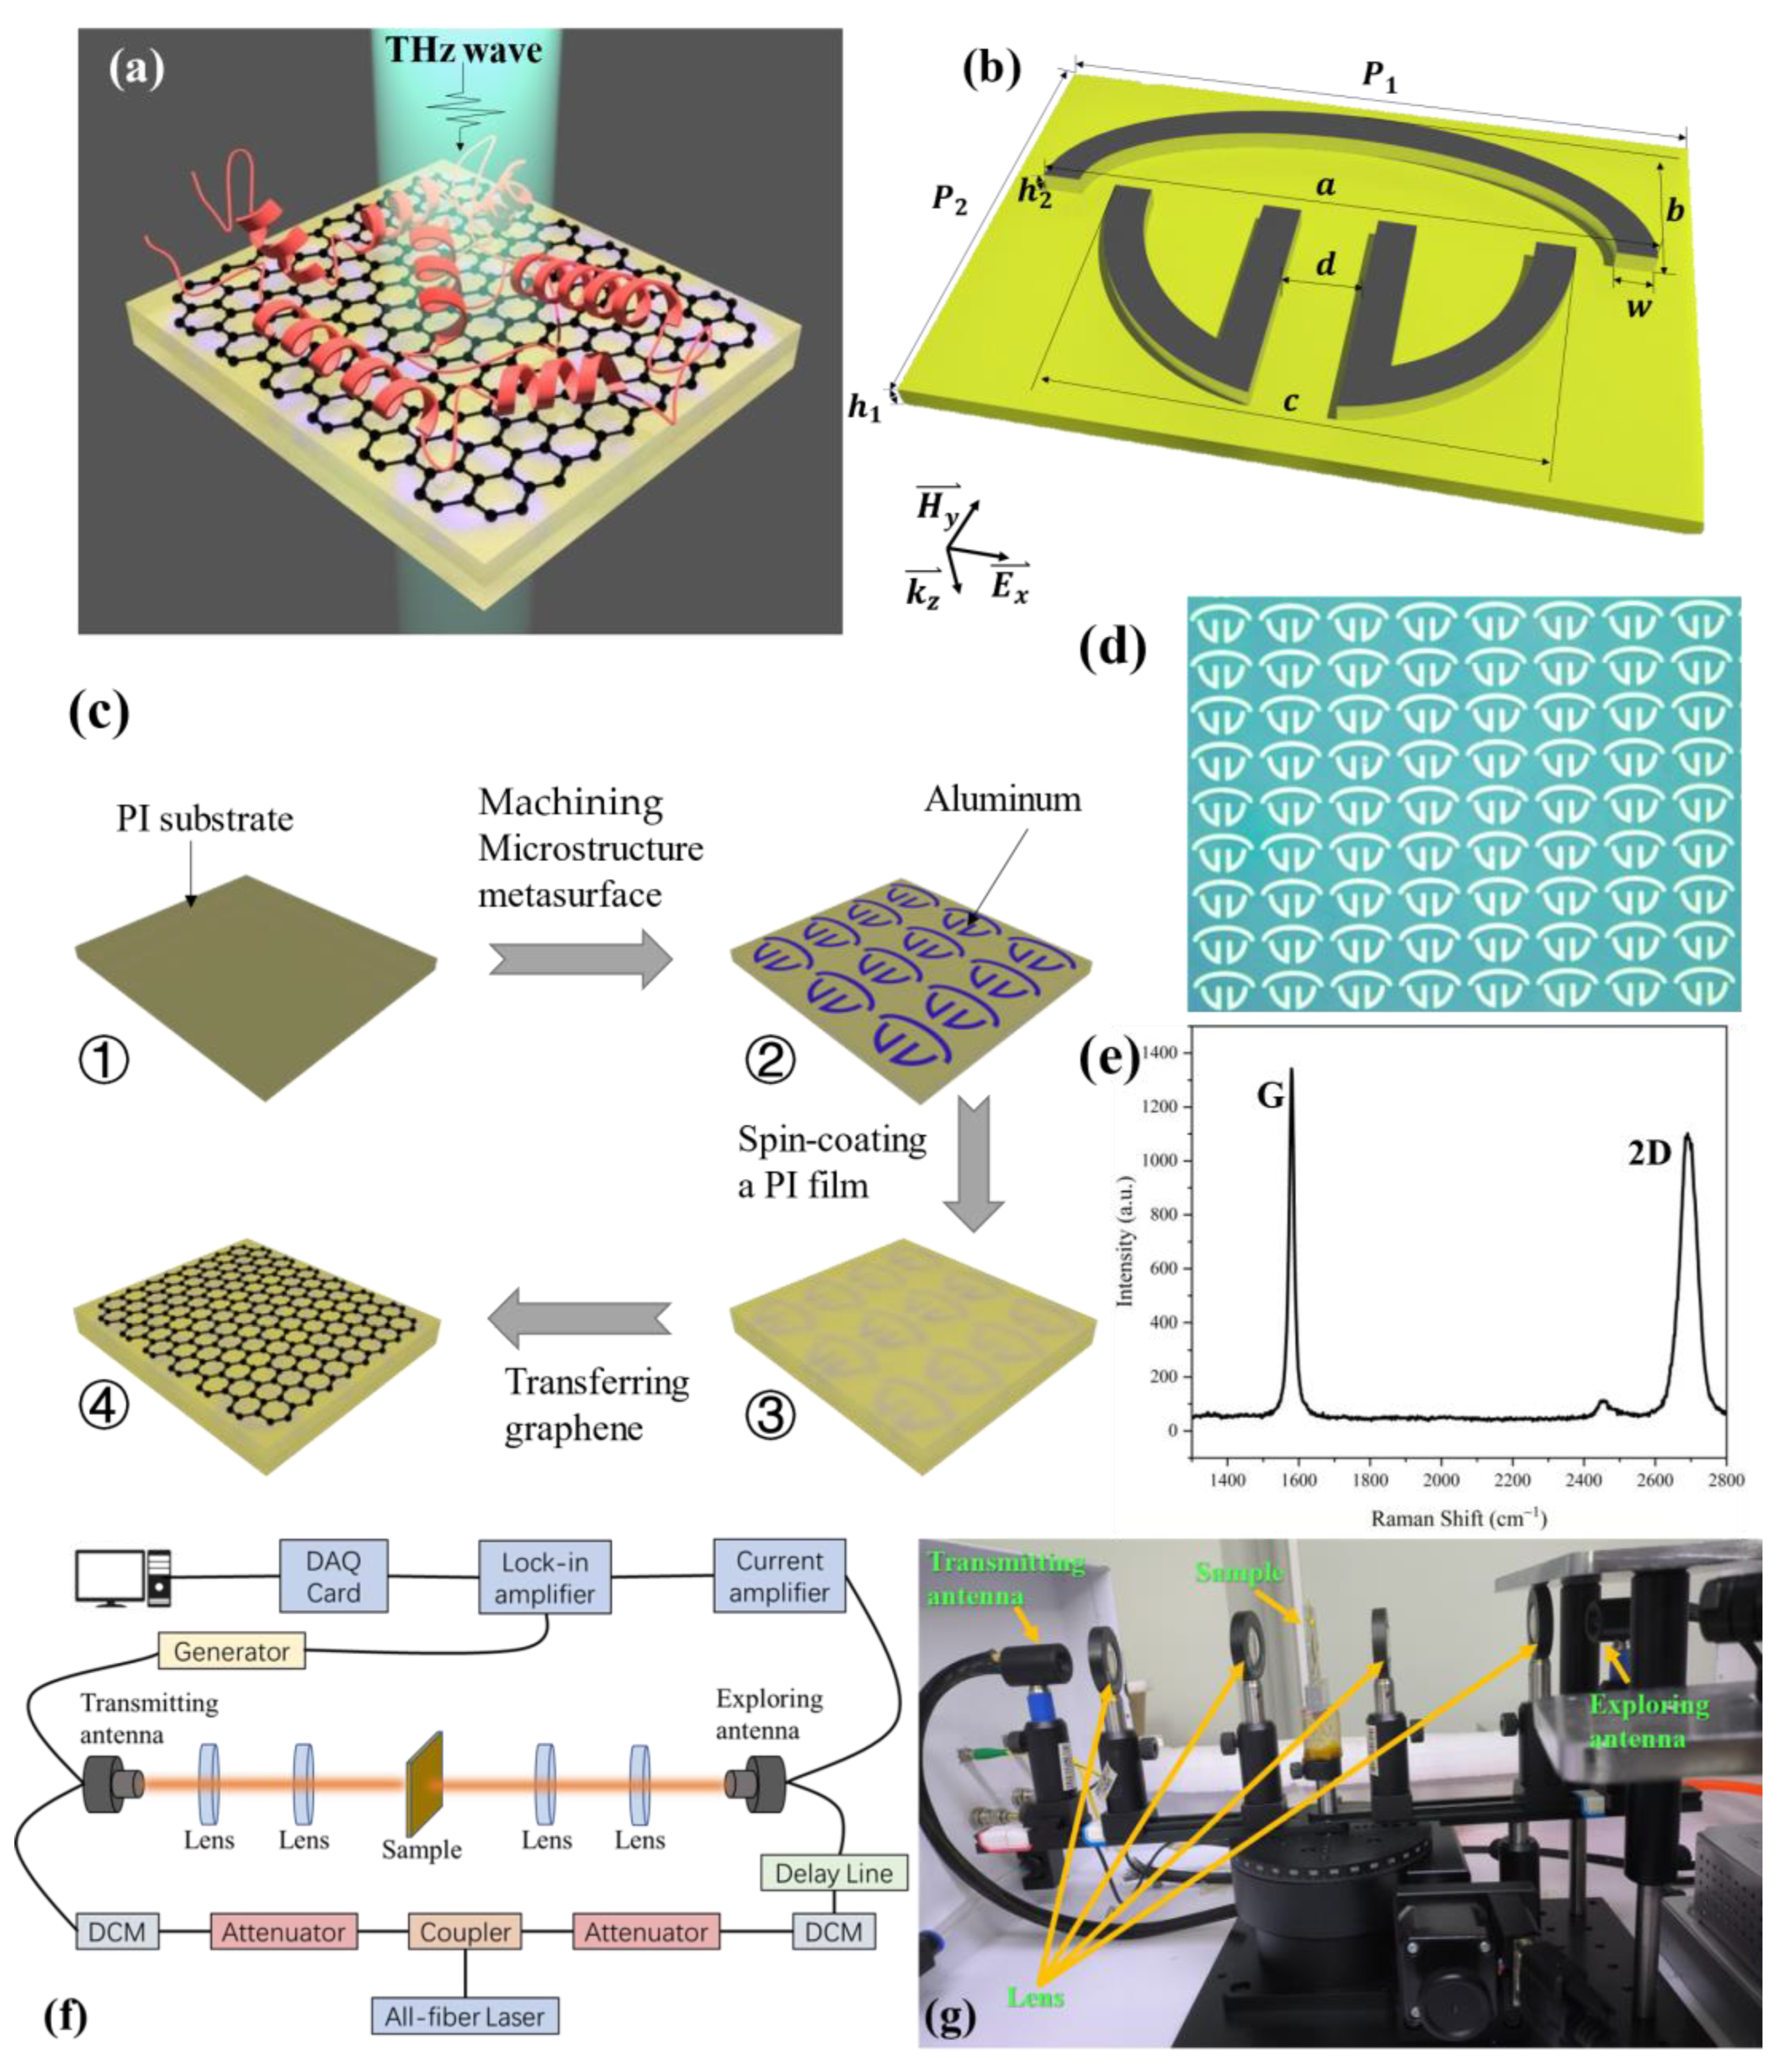
Figure 1. (a) Schematic of biosensor structure. (b) Schematic of MM structure and geometric parameters: P 1 = 162   μ m , P 2 = 108   μ m , h 1 = 15   μ m , h 2 = 0.2   μ m , a = 144   μ m , b = 36   μ m , c = 108   μ m , d = 18   μ m , w = 9   μ m . (c) Fabrication of the proposed biosensor. (d) Micrograph of fabricated biosensor sample. (e) Raman spectra of three-layer graphene were measured with a 514 nm excitation laser. (f) The schematic view of the all-fiber THz-TDS measurement setup. (g) Experimental photoelectric equipment.
Photonics 10 00067 g001
Figure 2. (a) Transmission spectra of individual CSRs, individual VSRs, and the entire ELM. (bd) Electric field distribution of the ELM in the z-direction at frequencies of 0.619 THz, 0.987 THz, and 0.746 THz, respectively.
Photonics 10 00067 g002
Figure 3. Experimental results of the control group. (a) Transmittance spectra of sensors with different concentrations of OVA. (b) The amplitude changes of the sensor under the influence of different concentrations of OVA. (c) The frequency changes of the sensor under the influence of different concentrations of OVA. (d) Phase spectrograms of different OVA concentrations. (e) The change in the slope of the phase curve with the concentration of OVA.
Photonics 10 00067 g003
Figure 4. (a) Transmittance spectra of sensors with different concentrations of OVA. (b) Simulated spectra of different Fermi levels of graphene for the sensor. (c) Schematic of graphene Fermi level changes under the influence of various concentrations of OVA.
Photonics 10 00067 g004
Figure 5. (a) The amplitude changes of the sensor under the influence of different concentrations of OVA. (b) The frequency changes of the sensor under the influence of different concentrations of OVA.
Photonics 10 00067 g005
Figure 6. (a) Phase spectrograms of different OVA concentrations. (b) Graph of the change in the slope of the phase curve with the concentration of OVA.
Photonics 10 00067 g006
Figure 7. The resonance parameters γ 1 , γ 2 , δ, and κ with OVA concentration obtained by fitting the transmission spectra in Figure 4a.
Photonics 10 00067 g007
Table 1. Comparison of this study with previous THz biosensors.
MaterialAnalytesLoDSensing TypeReference
MMMDK500 ng/mLAmplitude + Frequency[48]
Graphene + PICMM130 ng/mLAmplitude[49]
Graphene + MMFructose100 ng/mLAmplitude[35]
Graphene + MMCMM20 ng/mLAmplitude[35]
MM + SiBTP10 ng/mLAmplitude + Frequency[50]
Graphene + MMWP6.25 ng/mLAmplitude + Frequency + Phase[39]
Graphene + MM +PISericin780 pg/mLAmplitude + Phase[51]
MM + SiO2 + SiHER2100 pg/mLAmplitude + Frequency[52]
Graphene + MM + PIOvalbumin8.63 pg/mLAmplitude + Frequency + PhaseThis work
LoD: limit of detection, PI: polyimide, MM: metamaterial, MDK: midkine, CMM: chlorpyrifos methyl molecules, BTP: Bacillus thuringiensis protein, WP: whey protein, HER2: human epidermal growth factor receptor 2.
Disclaimer/Publisher’s Note: The statements, opinions and data contained in all publications are solely those of the individual author(s) and contributor(s) and not of MDPI and/or the editor(s). MDPI and/or the editor(s) disclaim responsibility for any injury to people or property resulting from any ideas, methods, instructions or products referred to in the content.