Article

Identification of Browning in Human Adipocytes by Partial Least Squares Regression (PLSR), Infrared Spectral Biomarkers, and Partial Least Squares Discriminant Analysis (PLS-DA) Using FTIR Spectroscopy

1
Division of Biotechnology, College of Life Sciences & Biotechnology, Korea University, Seoul 02841, Republic of Korea
2
R&D Department, NMS LAB, Anyang-si 14001, Republic of Korea
3
R&D Institute, Biosolution Co., Ltd., 232, Gongneung-ro, Nowon-gu, Seoul 01811, Republic of Korea
*
Author to whom correspondence should be addressed.
These authors contributed equally to this work.
Photonics 2023, 10(1), 2; https://doi.org/10.3390/photonics10010002
Submission received: 22 November 2022 / Revised: 14 December 2022 / Accepted: 19 December 2022 / Published: 21 December 2022
(This article belongs to the Special Issue Biomedical Spectroscopy: Techniques and Applications)

Abstract

:
We aimed to identify the browning of white adipocytes using partial least squares regression (PLSR), infrared spectral biomarkers, and partial least squares discriminant analysis (PLS-DA) with FTIR spectroscopy instead of molecular biology. PLSR helps distinguish human beige adipocytes treated with norepinephrine and rosiglitazone. When PLSR was based on the selected regions of 3997–3656 and 1618–938 cm−1, PLSR achieved an R2 of cross-validation of 88.95, a root mean square error of cross validation (RMSECV) of 2.13, and a ratio performance deviation (RPD) of 3.01. Infrared spectral biomarkers [1635 cm−1 (β-sheet amide I), 879–882, 860–3 cm−1 (A-form helix), and 629–38 cm−1 (OH out-of-plane bending)] were identified in human beige adipocytes based on spectral differences between human beige adipocytes and human white adipocytes, principal component analysis-linear discriminant analysis (PCA-LDA) cluster vector, U-test, and Fisher’s score per wavenumber. PLS-DA yielded a useful classification of adipocytes and expression distribution of adipogenesis genes in adipocytes. PLSR, infrared spectral biomarkers, and PLS-DA using FTIR spectroscopy are proposed as effective tools for identifying specific biological activities in a limited environment through features that do not require labeling and are relatively inexpensive in terms of time and labor.

1. Introduction

Obesity is defined as an abnormal accumulation of fat cells in the body. Obesity is a worldwide concern, and is associated with type 2 diabetes, heart disease, metabolic syndrome, and cancer [1,2,3,4,5,6]. Obesity impacts both white and brown adipocytes. White adipocytes have a unilocular lipid droplet shape, low mitochondrial density, lack the thermogenic marker mitochondrial proton pump uncoupling protein 1 (UCP1), and participate in energy storage and endocrine regulation [7,8]. Brown adipocytes contain multi-locular lipid droplets, exhibit high mitochondrial density, and express UCP1. They also participate in thermogenesis and endocrine regulation [7,8].
Several studies have investigated obesity severity. Among them, research on the browning of white adipocytes has recently gained popularity. This is because browning in white adipose tissue has been recognized as a potential therapeutic strategy for obesity-related treatment. It contributes to an energy balance through browning, which mainly induces energy-storing white adipocytes into energy-consuming beige/brite adipocytes such as brown adipocytes [9,10,11]. Browning is defined as the transformation of white adipocytes into beige adipocytes in the presence of cold exposure, β3-adrenergic receptor agonists (e.g., norepinephrine), PPAR gamma agonists (e.g., rosiglitazone), cancer cachexia, and tissue injury [12,13]
FTIR spectroscopy uses an infrared source to view chemical pictures of materials [14]. It is employed in various industries, including polymers, forensics, semiconductors, petrochemicals, and medicine. Infrared spectra reveal information regarding molecular vibrations. In particular, FTIR has been applied to various applications in biomedicine, including adipocyte biology [15,16,17,18,19]. FTIR helped elucidate that the anti-adipogenic effects of baicalein are mediated through the bioactive lipid pathway in adipocytes and enabled the analysis of the composition, structural alterations, and triglyceride-dependent differentiation of adipose tissue [20,21,22,23]. FTIR analysis also revealed that genomic loci regulate the tissue response in high-fat diet-fed mice [24]. Most of the data were used to determine changes in a given peak, to compare the ratio between peaks, or to use unsupervised classical learning of machine learning, such as principal component analysis (PCA).
In addition to comparison of ratios of specific peaks, there are methods of comparison that use the full infrared wavelength containing chemical information. These methods are regression and classification in supervised classical learning of machine learning [25]. Regression and classification algorithms are two ways used to create a prediction model. Regression methods predict continuous values such as price, salary, and age, whereas classification algorithms (also called logistic regression) predict discrete values, such as gender and true/false findings. Linear statistical regression models establishe a linear relationship between the independent variables x (x1, x2, …, xκ) and the dependent variable y. In contrast to the linear regression model, logistic regression analysis shows that the value of the independent variable y is binary (0 or 1), which can easily lead to a classification problem in which a decision is made as true/false or effective or not [26,27]. However, according to several studies, linear regression is superior in binary classifications and used to measure the efficacy of medications [28,29,30,31]. Linear regression was also utilized to identify the geographical origin of plants such as red pepper and soybean, which contain the same genomes and similar compositions [32,33]. In PCA scatter plots, linear discriminant analysis (LDA) scatter plots, and partial least squares regression (PLSR) comparative trials, the R2 of PLSR was the best in FTIR-based diagnosis of dengue fever [34]. PCA and LDA are unsupervised classical learning methods and PLSR is a regression of supervised classical learning. PLSR is a linear regression method based on both the target and the data matrix concurrently [34]. PLSR is a linear quantitative multivariate model that extracts latent variables, and forms a linear combination of the original spectral variables with the highest covariance between the spectral variables and the variable to be predicted [35,36].
Based on the advantages of linear regression in discrimination analysis, PLSR and FTIR spectroscopy were utilized in this study to determine the browning of adipocytes. In addition, infrared spectral biomarkers as biological signals of browning in adipocytes and PLS-DA for classification of adipocytes and expression distribution of adipogenesis genes in adipocytes were investigated.

2. Materials and Methods

2.1. Human Adipose-Derived Stem Cell Culture and Differentiation

The human adipose-derived stem cells (hADSCs) were provided by Biosolution Co., Ltd. (Seoul, Korea). The hADSCs (human preadipocytes, hPA) were cultured to a maximum of five times passages in order to minimize cell abnormalities. Cells were grown in Dulbecco’s modified Eagle’s medium and Ham’s F-12 (DMEM/F12) containing 1% penicillin-streptomycin, 10% fetal bovine serum (FBS), and GlutaMAX (Gibco, New York, USA) at 37 °C in a humidified atmosphere with 5% CO2. They were differentiated into mature adipocytes after modifying the protocol as previously described [37]. For beige adipogenic differentiation, cells were cultured for 48 h after being fully confluent (day 0). Next, cells were induced in differentiation induction medium supplemented with 0.5 mM isobutylmethylxanthine (IBMX), 100 nM dexamethasone, 1 µM rosiglitazone, 2 nM 3,3′,5-triiodo-L-thyronine (T3), and 100 nM insulin (Sigma-Aldrich, Massachusetts, USA) for 7 days. They were further cultured for 8 days until adipogenic differentiation was completed in the maintenance medium supplemented with 1 µM rosiglitazone, 2 nM T3, and 100 nM insulin (hBA + Rosi). White adipogenic differentiation was incubated without rosiglitazone from days 3 to 15 in the above beige protocol (hWA). Furthermore, 1 µM norepinephrine (NE) (Sigma-Aldrich, USA) was added for 6 h to induce beige adipocyte phenotype through adrenergic stimulation (hBA + NE). Adipocytes were harvested immediately after differentiation was completed, and all conditioned media were incubated for 48 h.

2.2. Oil-Red-O Staining

Differentiated adipocytes were incubated in 12-well plates, washed with phosphate-buffered saline (PBS, Cellgro, New York, USA), and fixed with 4% paraformaldehyde (Daejung, Seoul, Korea) for 1 h at room temperature. The cells were stained with 0.5% filtered Oil-red-O (ORO) (Sigma, New York, USA) solution in isopropanol for 1 h at room temperature and washed with PBS. Lipid droplets stained with ORO dye were observed through a microscope.

2.3. Quantitative Reverse Transcription PCR (qRT-PCR) Analysis

The total RNA of differentiated adipocytes cultured in 6-well plates was extracted with TRIzol (Invitrogen, Massachusetts, USA) according to the manufacturer’s instructions, followed by cDNA synthesis from 1 µg of total RNA and 100 µM of oligo-dT primers, using a cDNA synthesis kit (CellSafe, Yongin, Korea). For real-time qPCR, the Capital™ qPCR green mix high ROX (Biotechrabbit, Berlin, Germany) was used to detect adipocyte-specific gene expression using the StepOnePlus Real-Time PCR system (ThermoFisher, Massachusetts, USA). The primers used in this study were as follows (Table 1):
Uncoupling protein 1 (UCP1), type II iodothyronine deiodinase (DIO2), and cell death-inducing DFFA (CIDEA) are thermogenic markers [7,8,9]. Fatty acid-binding protein 4 (FABP4), adiponectin (ADIPOQ), and peroxisome proliferator-activated receptor gamma (PPARG) are general adipogenic markers [8,12]. Cbp/p300-interacting transactivator 1 (CITED1), pyruvate dehydrogenase kinase 4 (PDK4), fatty acid-binding protein 3 (FABP3), phosphate acetyltransferase (PAT2), and mitochondrial carnitine/acylcarnitine carrier protein (SLC25A20) are beige-specific markers [7,8].

2.4. Preparation and Collection of FTIR Spectra

Human adipocytes were fixed on a CaF2 window (Bruker Optics, Ettlingen, Germany) by air-drying. Human adipocytes on a gelatin-coated slide glass and human adipocyte-conditioned medium on a slide glass (Marienfeld, Lauda-Konigshofen, Germany) were fixed by air-drying. They were stored at −20 °C prior to FTIR analyses. FTIR spectra were collected three times using a LOMUS (Bruker Optics, Ettlingen, Germany) with 2 cm−1 resolution, 5 × 5 µm pixel size, and 16 scans per pixel.

2.5. Partial Least-Squares Regression (PLSR) and Partial Least-Squares Discriminant Analysis (PLS-DA) Modeling

PLSR models of adipocytes were prepared using OPUS 8.5 (Bruker Optics, Ettlingen, Germany). A value of 100 was used for hBA, and a value of 0 was used for other human adipocytes. In adipocyte-conditioned media, a value of 100 was entered for hBA-CM, and a value of 0 was entered for other adipocyte-conditioned media (Table 2 and Table S1). The number of spectra, preprocessing conditions, and the used wavenumbers for PLSRs were searched using the ‘optimize’ function in OPUS (Table 2 and Table S1). Cross-validation was performed with k-fold cross-validation (k = 4) using OPUS. The number of spectra, preprocessing conditions and used wavenumbers for PLS-DA are described in Table S1. PCA, PLS, and PCA-LDA scatter plots were run using the IRootLab toolbox, and PLS-DA was run using the PLS Toolbox (Eigenvector Research, Inc., Washington, USA) in MATLAB Version 2021a (The Math Works Inc., Massachusetts, USA).
Table 2. Comparing PLSRs using FTIR spectra of human adipocyte.
PLSR for ObjectiveNo. of Spectra from 3 Tests (n = 3)Used WavenumbersPre-TreatmentInput Value Predicted ValuePeaks in Pre-Processed Spectra Used for PLSRR2 aRMSECV bRPD cComment
hBA15 (hWA),
12 (hBA + NE),
11 (hBA + Rosi)
3997–3656, 1618–938 cm−11st derivative,
vector normalization,
17 smoothing points,
PLS
hWA; 0
hBA + NE, hBA + Rosi; 100
−18.2~32.5
68.8~134.5
3700–3584 cm−1 (OH), 1509 cm−1 (CH in-plane), 1448 cm−1 (CH3 asy d), 1221 cm−1 (phosphate), 1145 cm−1 (oligosaccharides), 970 cm−1 (DNA)88.952.133.01Figure 1F,G
hBA on a slide glass14 (hWA),
15 (hBA + NE),
15 (hBA + Rosi)
3997–3756, 3278–3037, 2798–1838 cm−11st derivative,
vector normalization,
17 smoothing points,
PLS
hWA; 0hBA + NE, hBA + Rosi; 100−26.0~29.5
66.7~122.7
3700–3584 cm−1 (lipid-related CH), 3216 cm−1 (OH sym e), 3078 cm−1 (CH ring), 2731 m−1 (NH)92.111.723.56Figure 2A,B
hBA-CM on a slide glass13 (hWA-CM)
16 (hBA + NE-CM),
16 (hBA + Rosi-CM)
3997–3338, 3118–2898, 2678–2459, 2239–1800 cm−11st derivative,
vector normalization,
17 smoothing points,
PLS
hWA-CM; 0
hBA + NE-CM, hBA + Rosi-CM; 100
−27.0~31.6
80.6~111.9
3561 cm−1 (OH), 3111 cm−1 (CH), 3050 cm−1 (Amid B), 2975 cm−1 (NH, CH), 2956 cm−1 (CH3 asy (lipids)), 2947 cm−1 (CH), 2678 cm−1 (NH), 2600 cm−1 (H bonded NH)93.391.533.89Figure 2C,D
a R2, Coefficient of determination of cross-validation; b RMSECV, Root Mean Square Error of Cross-Validation; c RPD, ratio performance deviation; d asy, asymmetry; e sym, symmetry.
Figure 1. Characteristics of human adipocytes assessed via ORO, expression of human adipogenic/thermogenic markers, and PLSR using FTIR spectra of human adipocytes. (A) Schematic images of human adipose-derived stem cell differentiation. (B) Characteristics of mature adipocytes assessed with ORO. (C) Expression levels of general adipogenic markers in adipocytes determined via qPCR analysis. (D) Expression levels of thermogenic markers in adipocytes determined via qPCR analysis. (E) Expression levels of beige-specific markers were assayed by qPCR. (F) PLSR for hBA and transparent yellow box indicating non-overlapping area. (G) Pre-processed spectra used in PLSR for hBA. ORO and qPCR results are shown as mean ± SEM (n = 3). * p < 0.05; ** p < 0.01 compared to each group.
Photonics 10 00002 g001
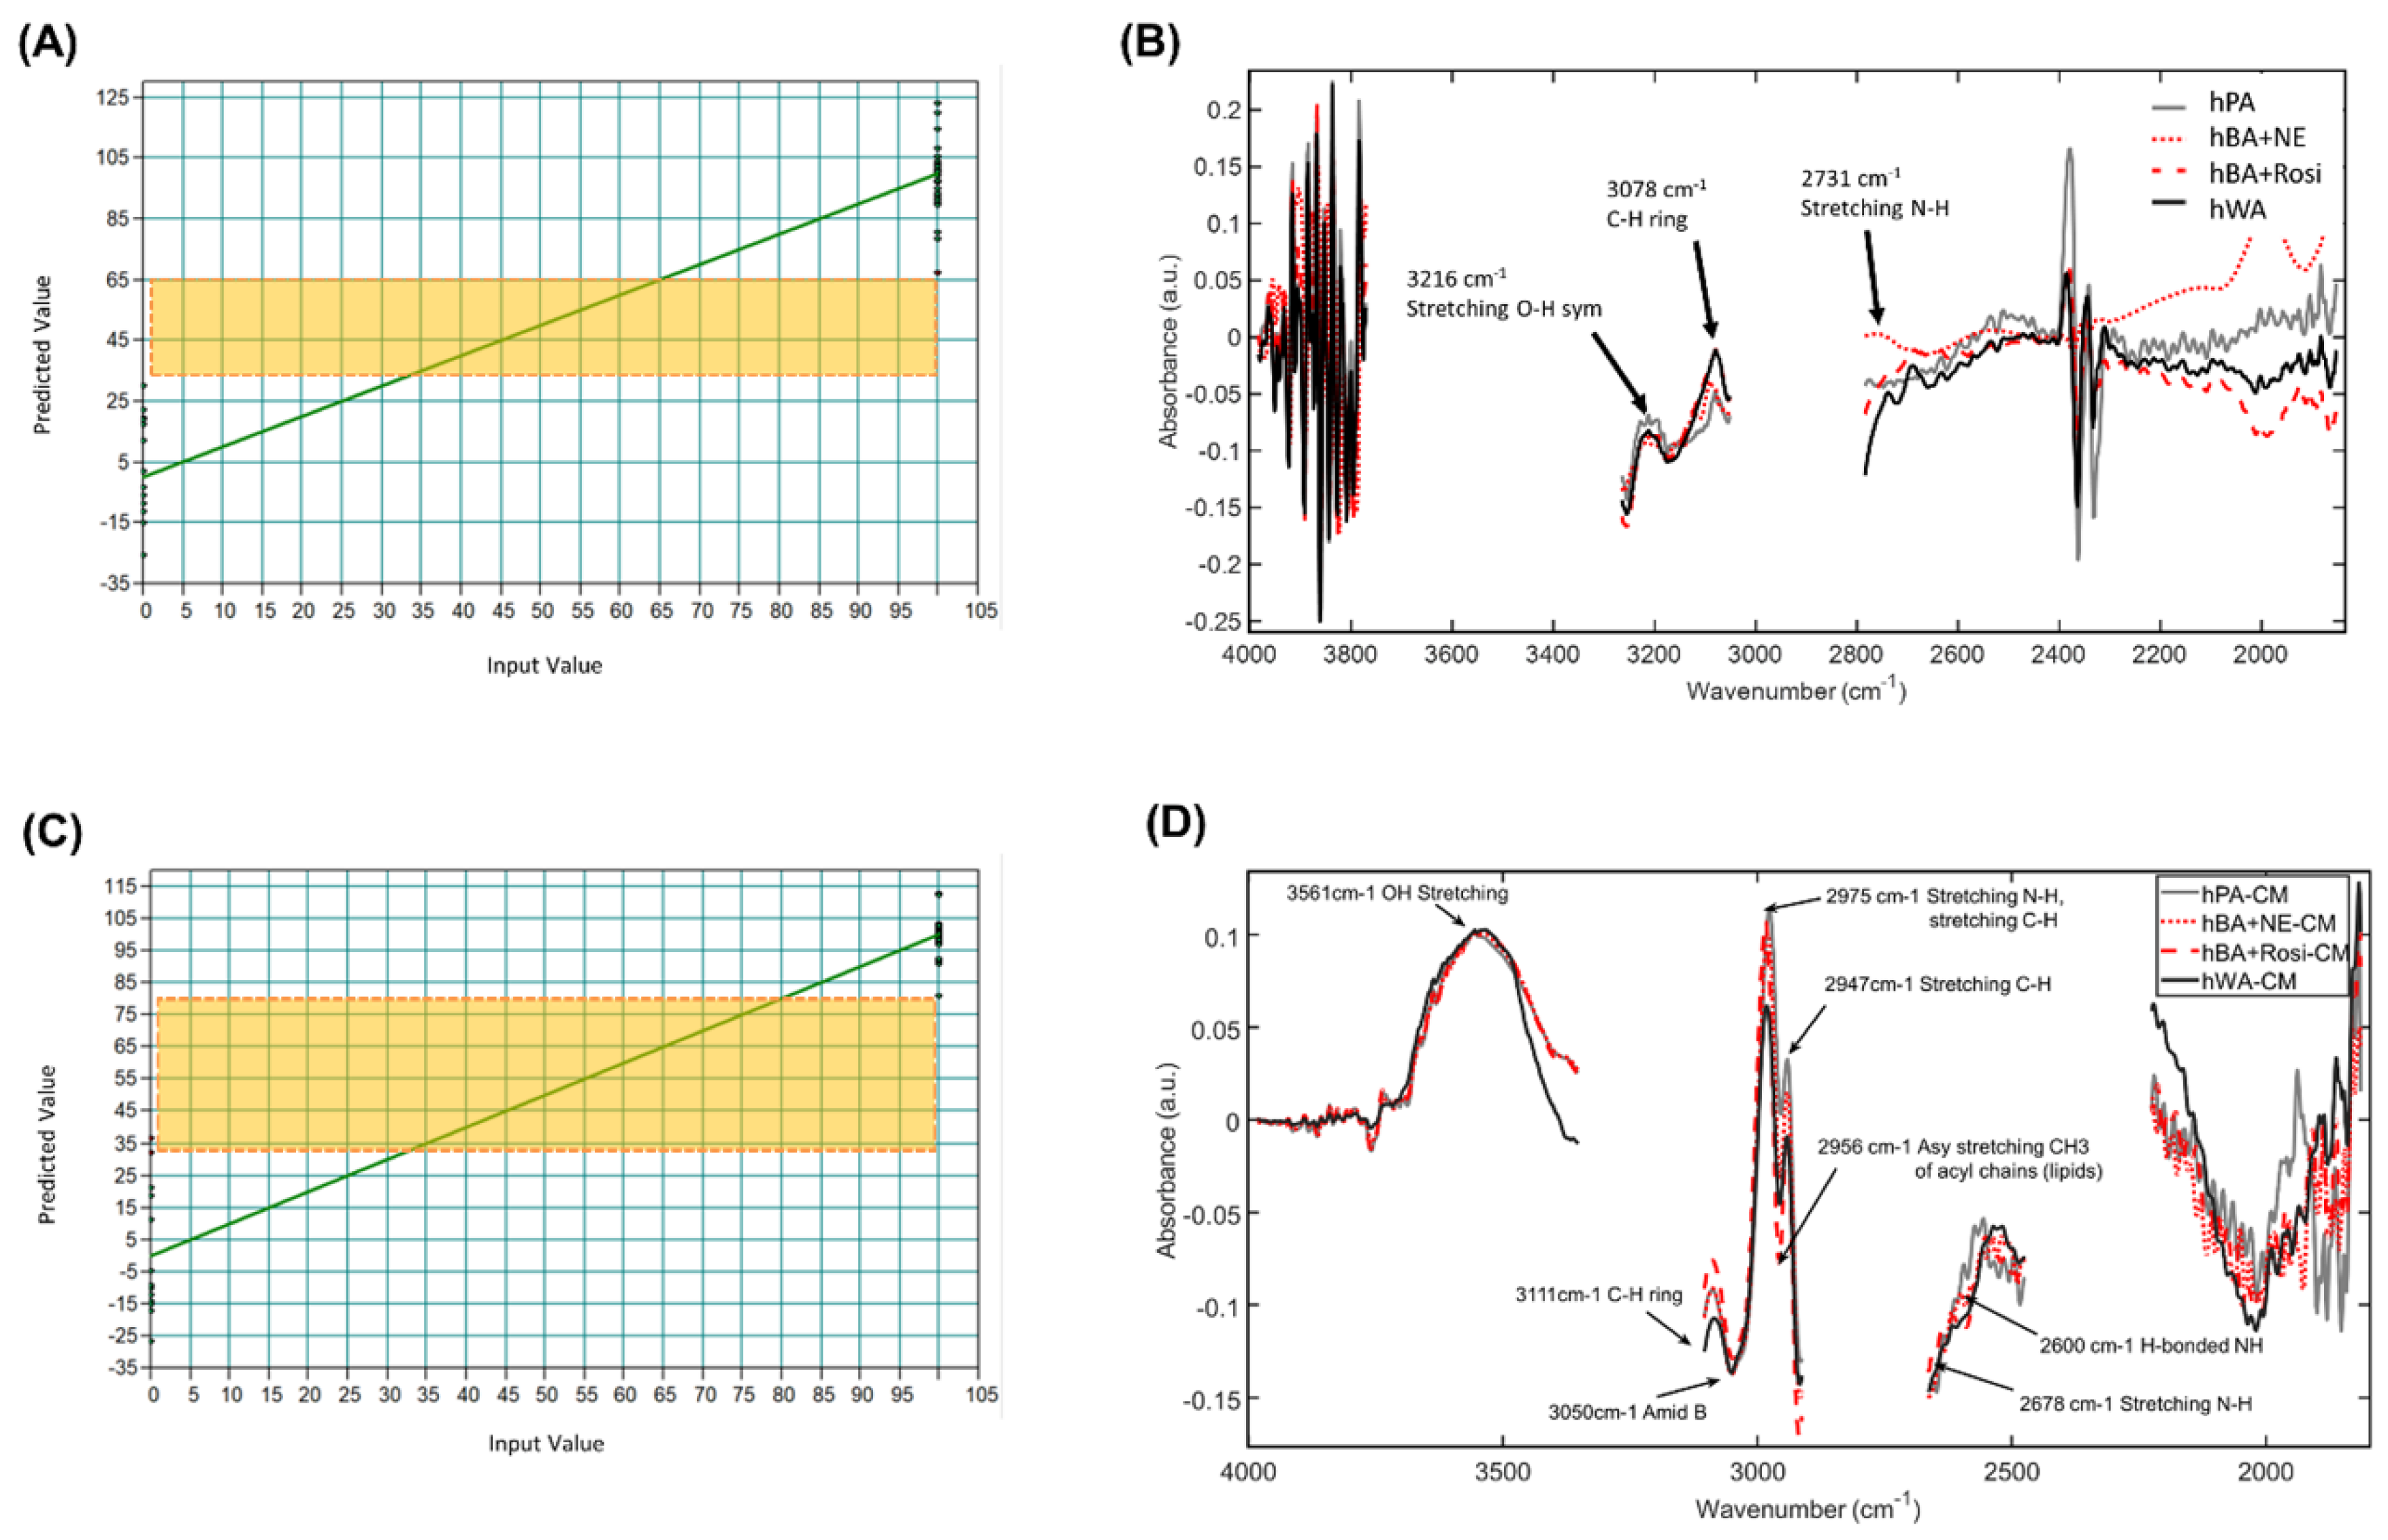
Figure 2. PLSR using FTIR spectra of human adipocytes on a gelatin-coated slide glass and human adipocyte-conditioned media on a slide glass. (A) PLSR for hBA on a gelatin-coated slide glass and transparent yellow box indicating non-overlapping area. (B) Pre-processed spectra used in PLSR for hBA on a gelatin-coated slide glass. (C) PLSR for hBA-CM on a slide glass and transparent yellow box indicating non-overlapping area. (D) Pre-processed spectra used in PLSR for hBA-CM on a slide glass.
Photonics 10 00002 g002

2.6. Infrared Spectral Biomarkers

The number of spectra, preprocessing conditions, and wavenumbers used for infrared spectral biomarkers are described in Table S1. As methods of finding the difference between two groups with full infrared wavelength containing chemical information, infrared spectral biomarkers were identified by overlapping peak wavenumbers based on differences between mean spectra, PCA-LDA cluster vector, the U test, and Fisher’s score per wavenumber using the IRootLab toolbox in MATLAB Version 2021a (The Math Works Inc., Massachusetts, USA). Molecular vibration information related to infrared spectral biomarkers can be found in Movasaghi [38].

2.7. Statistical Analysis

Data from the ORO and qPCR analyses were analyzed using Tukey’s one-way ANOVA followed by a post-hoc test for multiple comparisons using GraphPad Prism 8 (GraphPad Software, California, USA). Statistical significance was set at p < 0.05.

3. Results

3.1. PLSR Using FTIR Spectra of Established Human Adipocytes

hPA was differentiated into mature adipocytes by inducing with an adipogenic cocktail for 15 days (Figure 1A). Differentiated hBA + Rosi, hBA + NE, and hWA were confirmed using ORO staining. Lipid accumulation was significantly increased by approximately four-fold in the differentiated groups compared with the hPA group (Figure 1B). The differentiation of hBAs and hWA was established using adipogenic markers, including PPARG, FABP4, and ADIPOQ, using qPCR and compared to the hPA group (Figure 1C). To confirm beige adipocyte differentiation, the expression of thermogenic and beige-specific genes was investigated. The expression of thermogenic markers, including UCP1, CIEDA, and DIO2 was significantly enhanced in the hBA + Rosi and hBA + NE groups compared to the hPA and hWA groups (Figure 1D and Figure S6A). Moreover, the expression of beige-specific markers, including FABP3, PDK4, PAT2, SLC25A20, and CITED1 was significantly up-regulated in the BA + Rosi group compared with the hPA, hWA, and hBA + NE groups. The hBA + NE group showed an increasing trend compared with the hPA and hWA groups (Figure 1E). Furthermore, the protein level of UCP1 was significantly elevated in the hBA + Rosi group than in the hPA, hWA, and hBA + NE groups (Figure S6B). As a screening method for drug induced hBA, PLSR was prepared as a reference to the mRNA expression of thermogenic markers (Figure 1F). The differences in the pre-processed spectra used in PLSR for hBA were used to investigate the biological basis of the accurate PLSR-based prediction (Figure 1F). The peaks in PLSR for hBA were related to OH, CH in-plane, asymmetric CH3, phosphate, oligosaccharides, and DNA (Figure 1G, Table 2).

3.2. PLSR Using FTIR Spectra of Human Adipocytes and Human Adipocyte-Conditioned Media on a Slide Glass

After confirming the possibility of human adipocyte experiments on the CaF2 window, the possibility of PLSR for hBA on a slide glass was tested despite the inability to obtain spectra at wavenumbers lower than 1600 cm−1 owing to the use of a slide glass (Figures S7 and S8). Glass slides were smeared with gelatin to attach the adipocytes to the slide glass, and the adipocytes were cultured. PLSR screened for browning in human adipocytes on a gelatin-coated slide glass (Figure 2A). Differences between hWA (black), hBA + Rosi, and hBA + NE (red) in the spectra were confirmed (Figure 2B). The peaks in PLSR for hBA on a slide glass were related to lipid-related CH, OH symmetry, and NH (Figure 2B, Table 2). As described in the previous human adipocyte experiment using a slide glass, wavenumbers up to 1600 cm−1 were used in the experiment involving human adipocyte conditioned media (data not shown). A significant result was obtained (Figure 2C, Table 2). The peaks in PLSR for hBA-CM were related to OH, CH, amide B, NH, and asymmetric CH3 (lipids) (Figure 2D, Table 2).

3.3. Comparing PLSRs

All PLSRs were performed with PLS, first derivative, vector normalization, and 17 smoothing points (Table 2). Important wavenumbers, such as amide I/II and B-form DNA, were included in hBA. Otherwise, olefinic, asymmetric CH3, and asymmetric CH2 were included in hBA on a slide glass and hBA-CM on a slide glass (Table 3).

3.4. Infrared Spectral Biomarkers on Human Beige Adipocytes

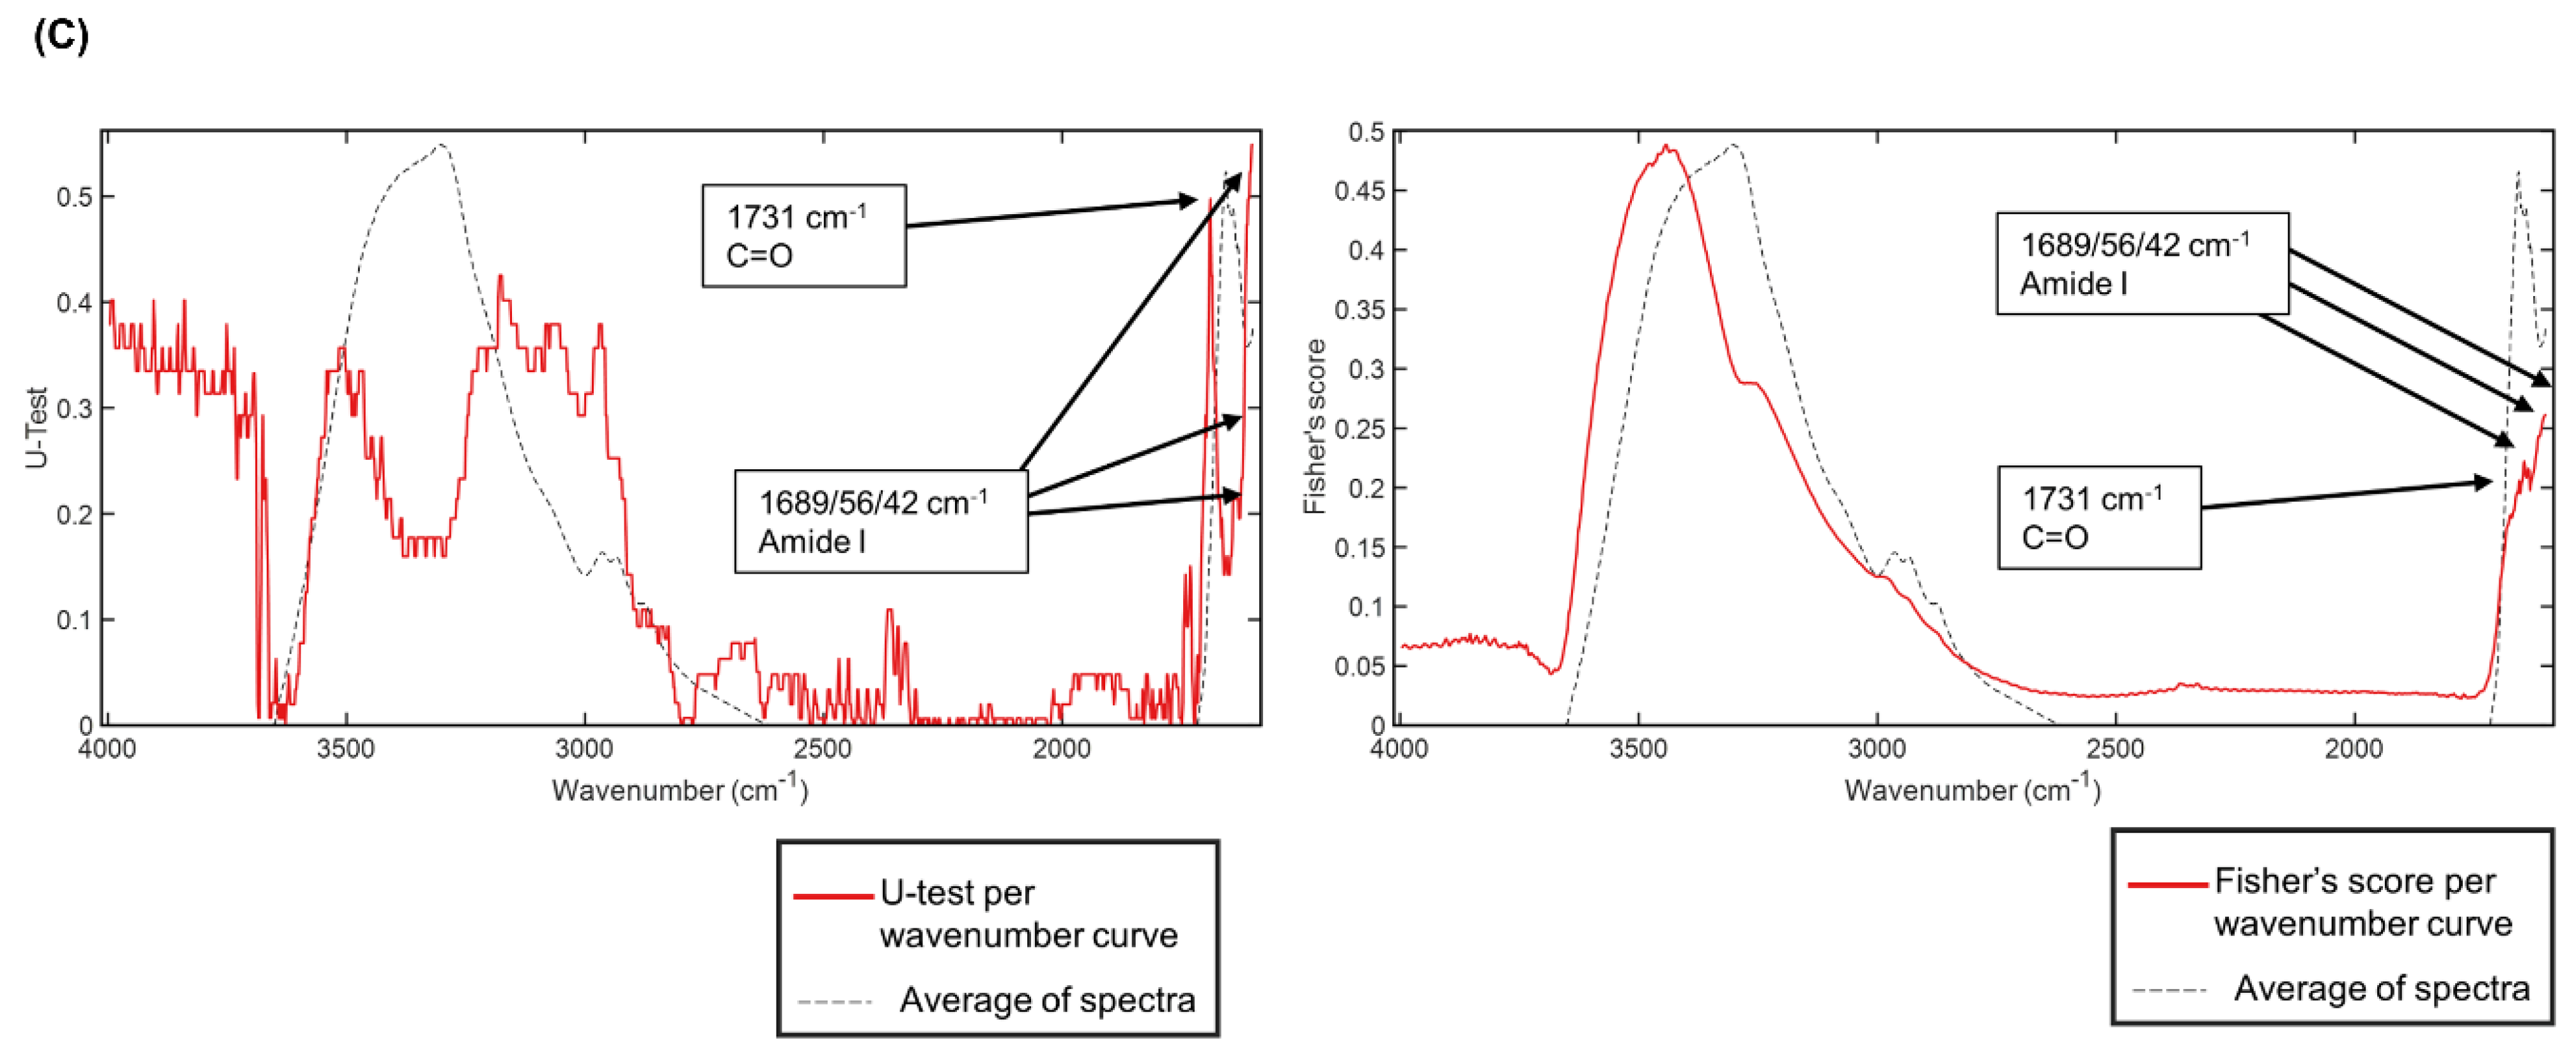
An alternative to PLSR for identifying infrared spectral biomarkers was reviewed by searching for overlapping peak wavenumbers. Infrared spectral biomarkers of hBA + NE were related to OH asymmetry, β-sheet amide I, PO2 symmetry, νPO4 (of nucleic acids and proteins), A-form helix, and OH out-of-plane bending (Figure 3A–D, Table 4). Infrared spectral biomarkers of hBA + Rosi were related to β-sheet amide I, amide III, collagen, C-O, A-form helix, and OH out-of-plane bending (Figure 3A–D, Table 4). Amide, DNA change, and OH out-of-plane bending-related infrared spectral biomarkers (1635, 879–882, 860–3, 629–38 cm−1) were identified in both hBA + NE and hBA + Rosi (Table 4).

3.5. Infrared Spectral Biomarkers on Human Beige Adipocyte-Conditioned Media on a Slide Glass

The spectra were removed at less than 1600 cm−1 in the hBA-CM on a slide glass (Figure S8). Therefore, infrared spectral biomarkers were only obtained between 4000 and 1600 cm−1. The infrared spectral biomarkers of hBA + NE-CM were related to C-H, ν (C=C) (lipids and fatty acids), C=O (fatty acid ester), and amide I (Figure 4A–C, Table 4). The infrared spectral biomarkers of hBA + Rosi-CM were related to C=O (fatty acid ester) and amide I (Figure 4A–C, Table 4). Infrared spectral biomarkers (1728–33, 1656–9, 1640–8 cm−1) associated with fatty acid esters and amide I were identified in both hBA + NE-CM and hBA + Rosi-CM on a slide glass.

3.6. PLS-DA, Classification of Adipocytes and Expression Distribution of Adipogenesis Genes in Adipocytes

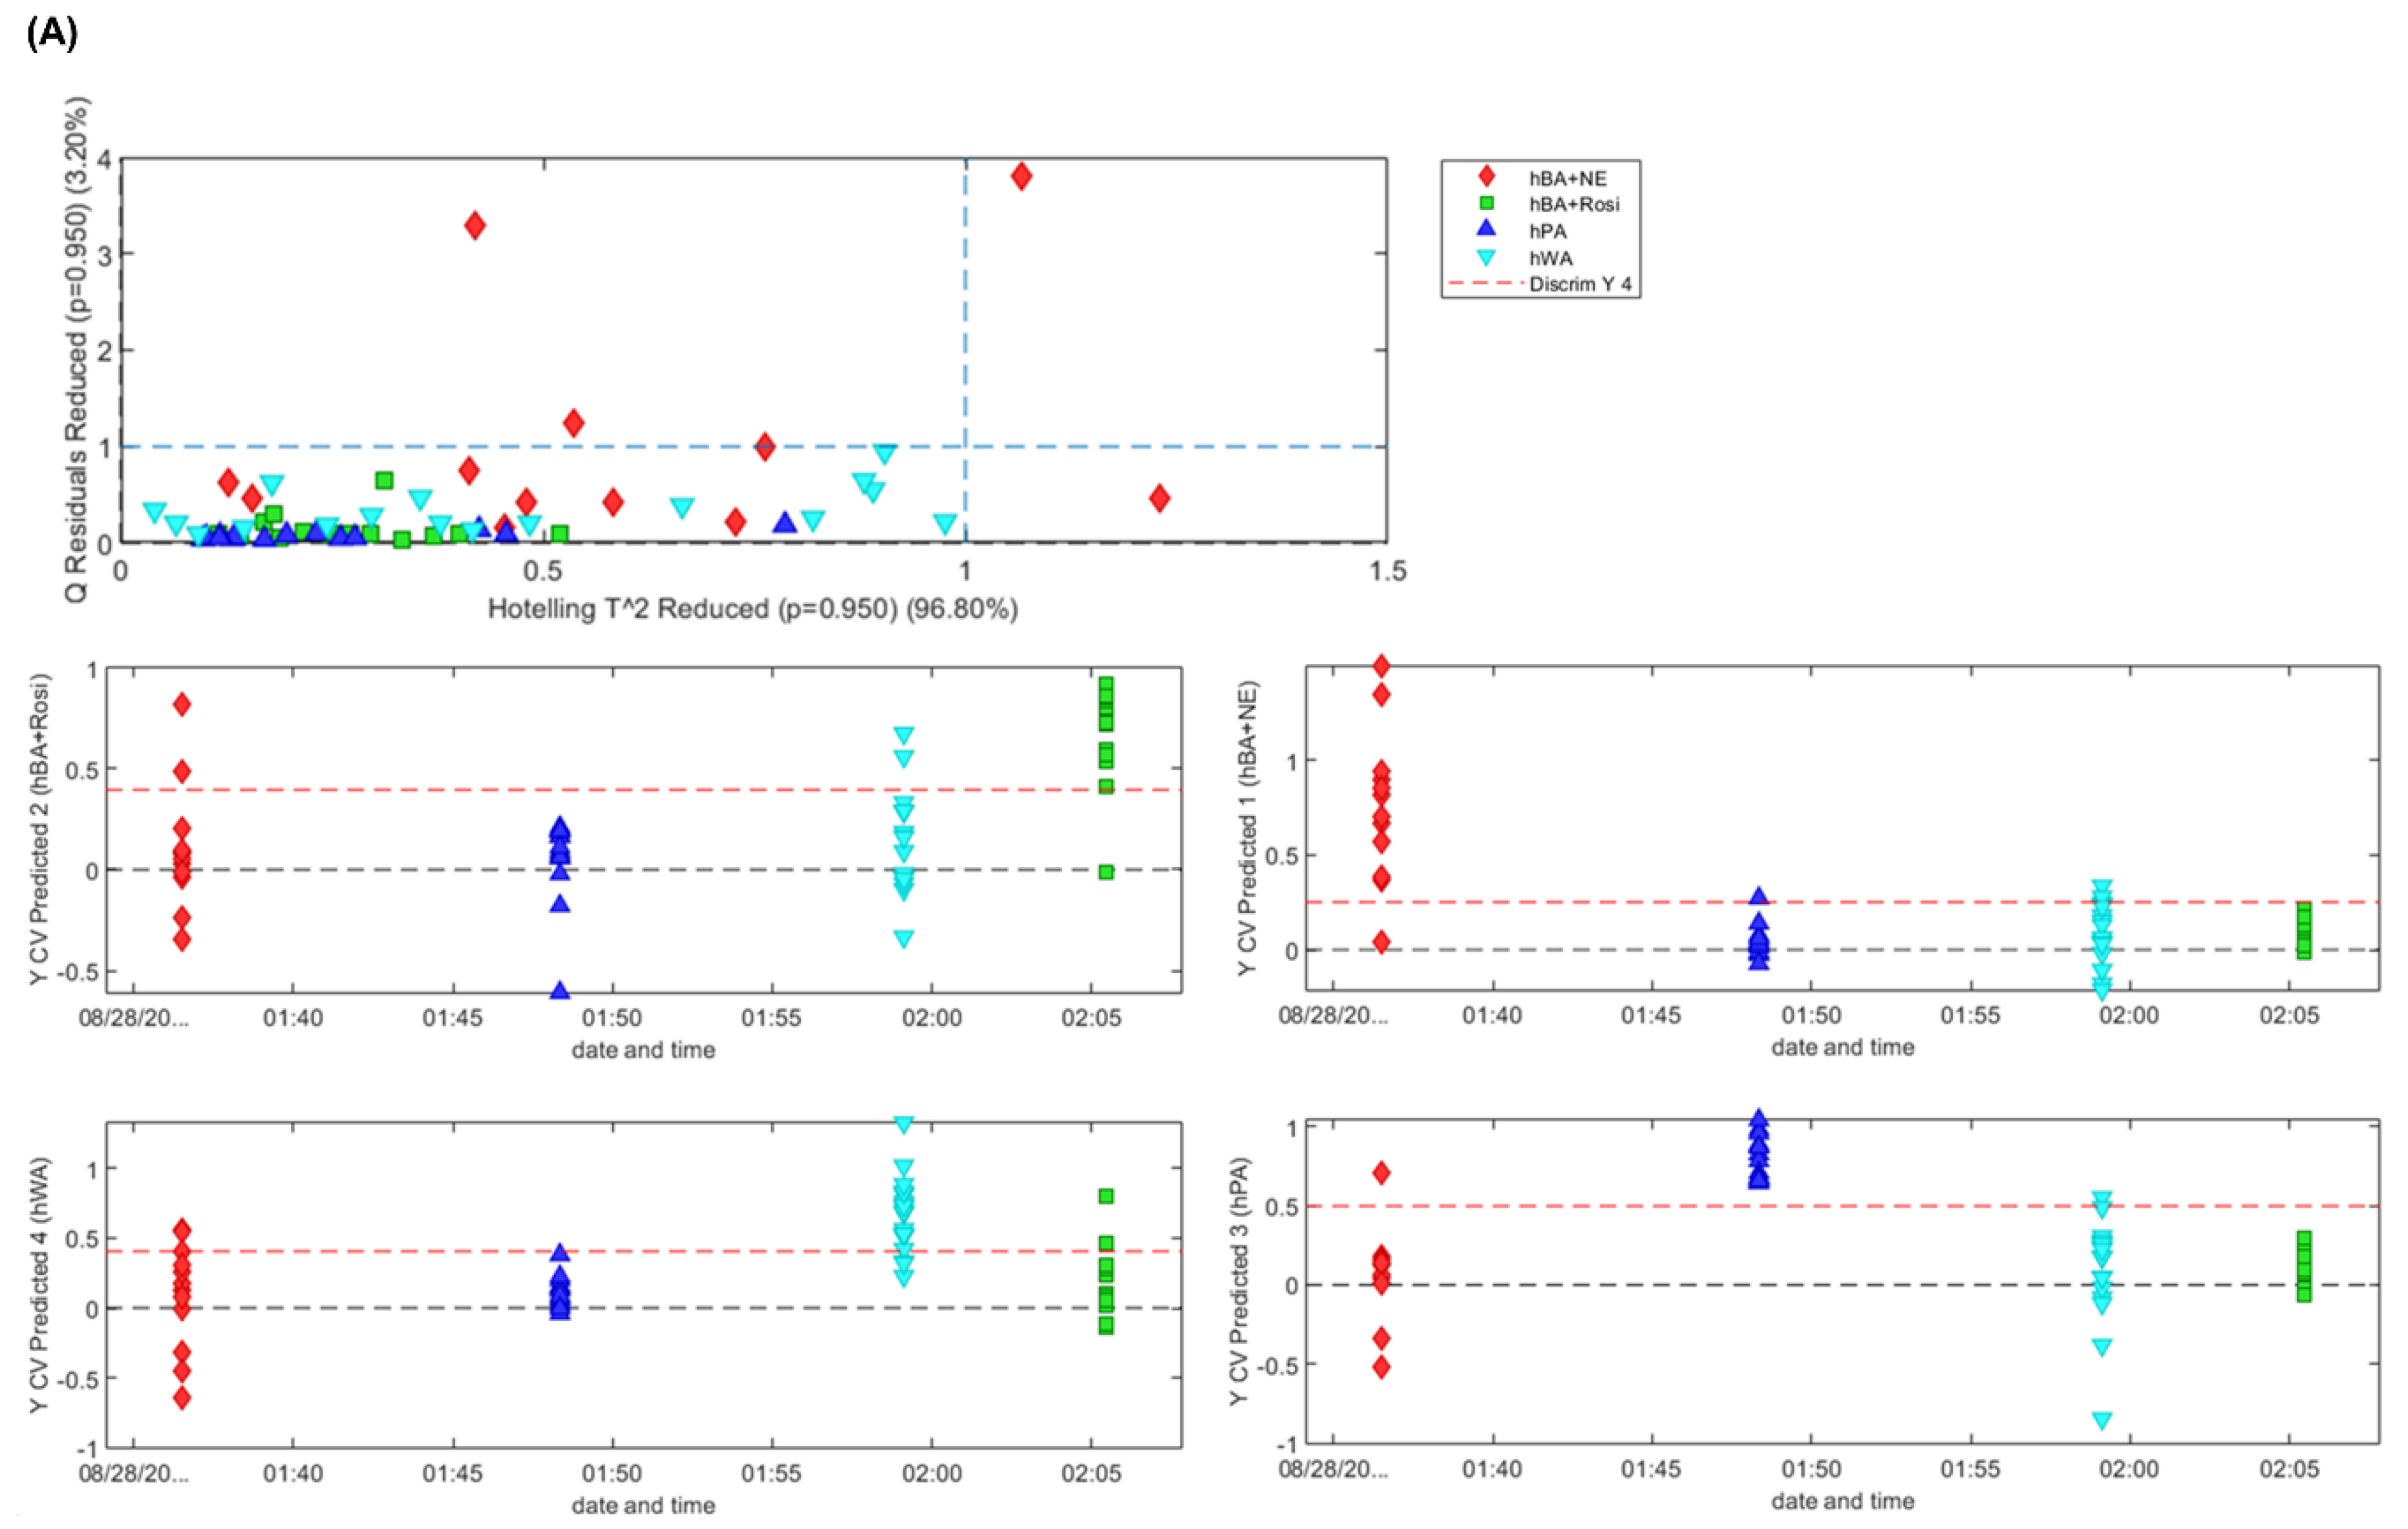
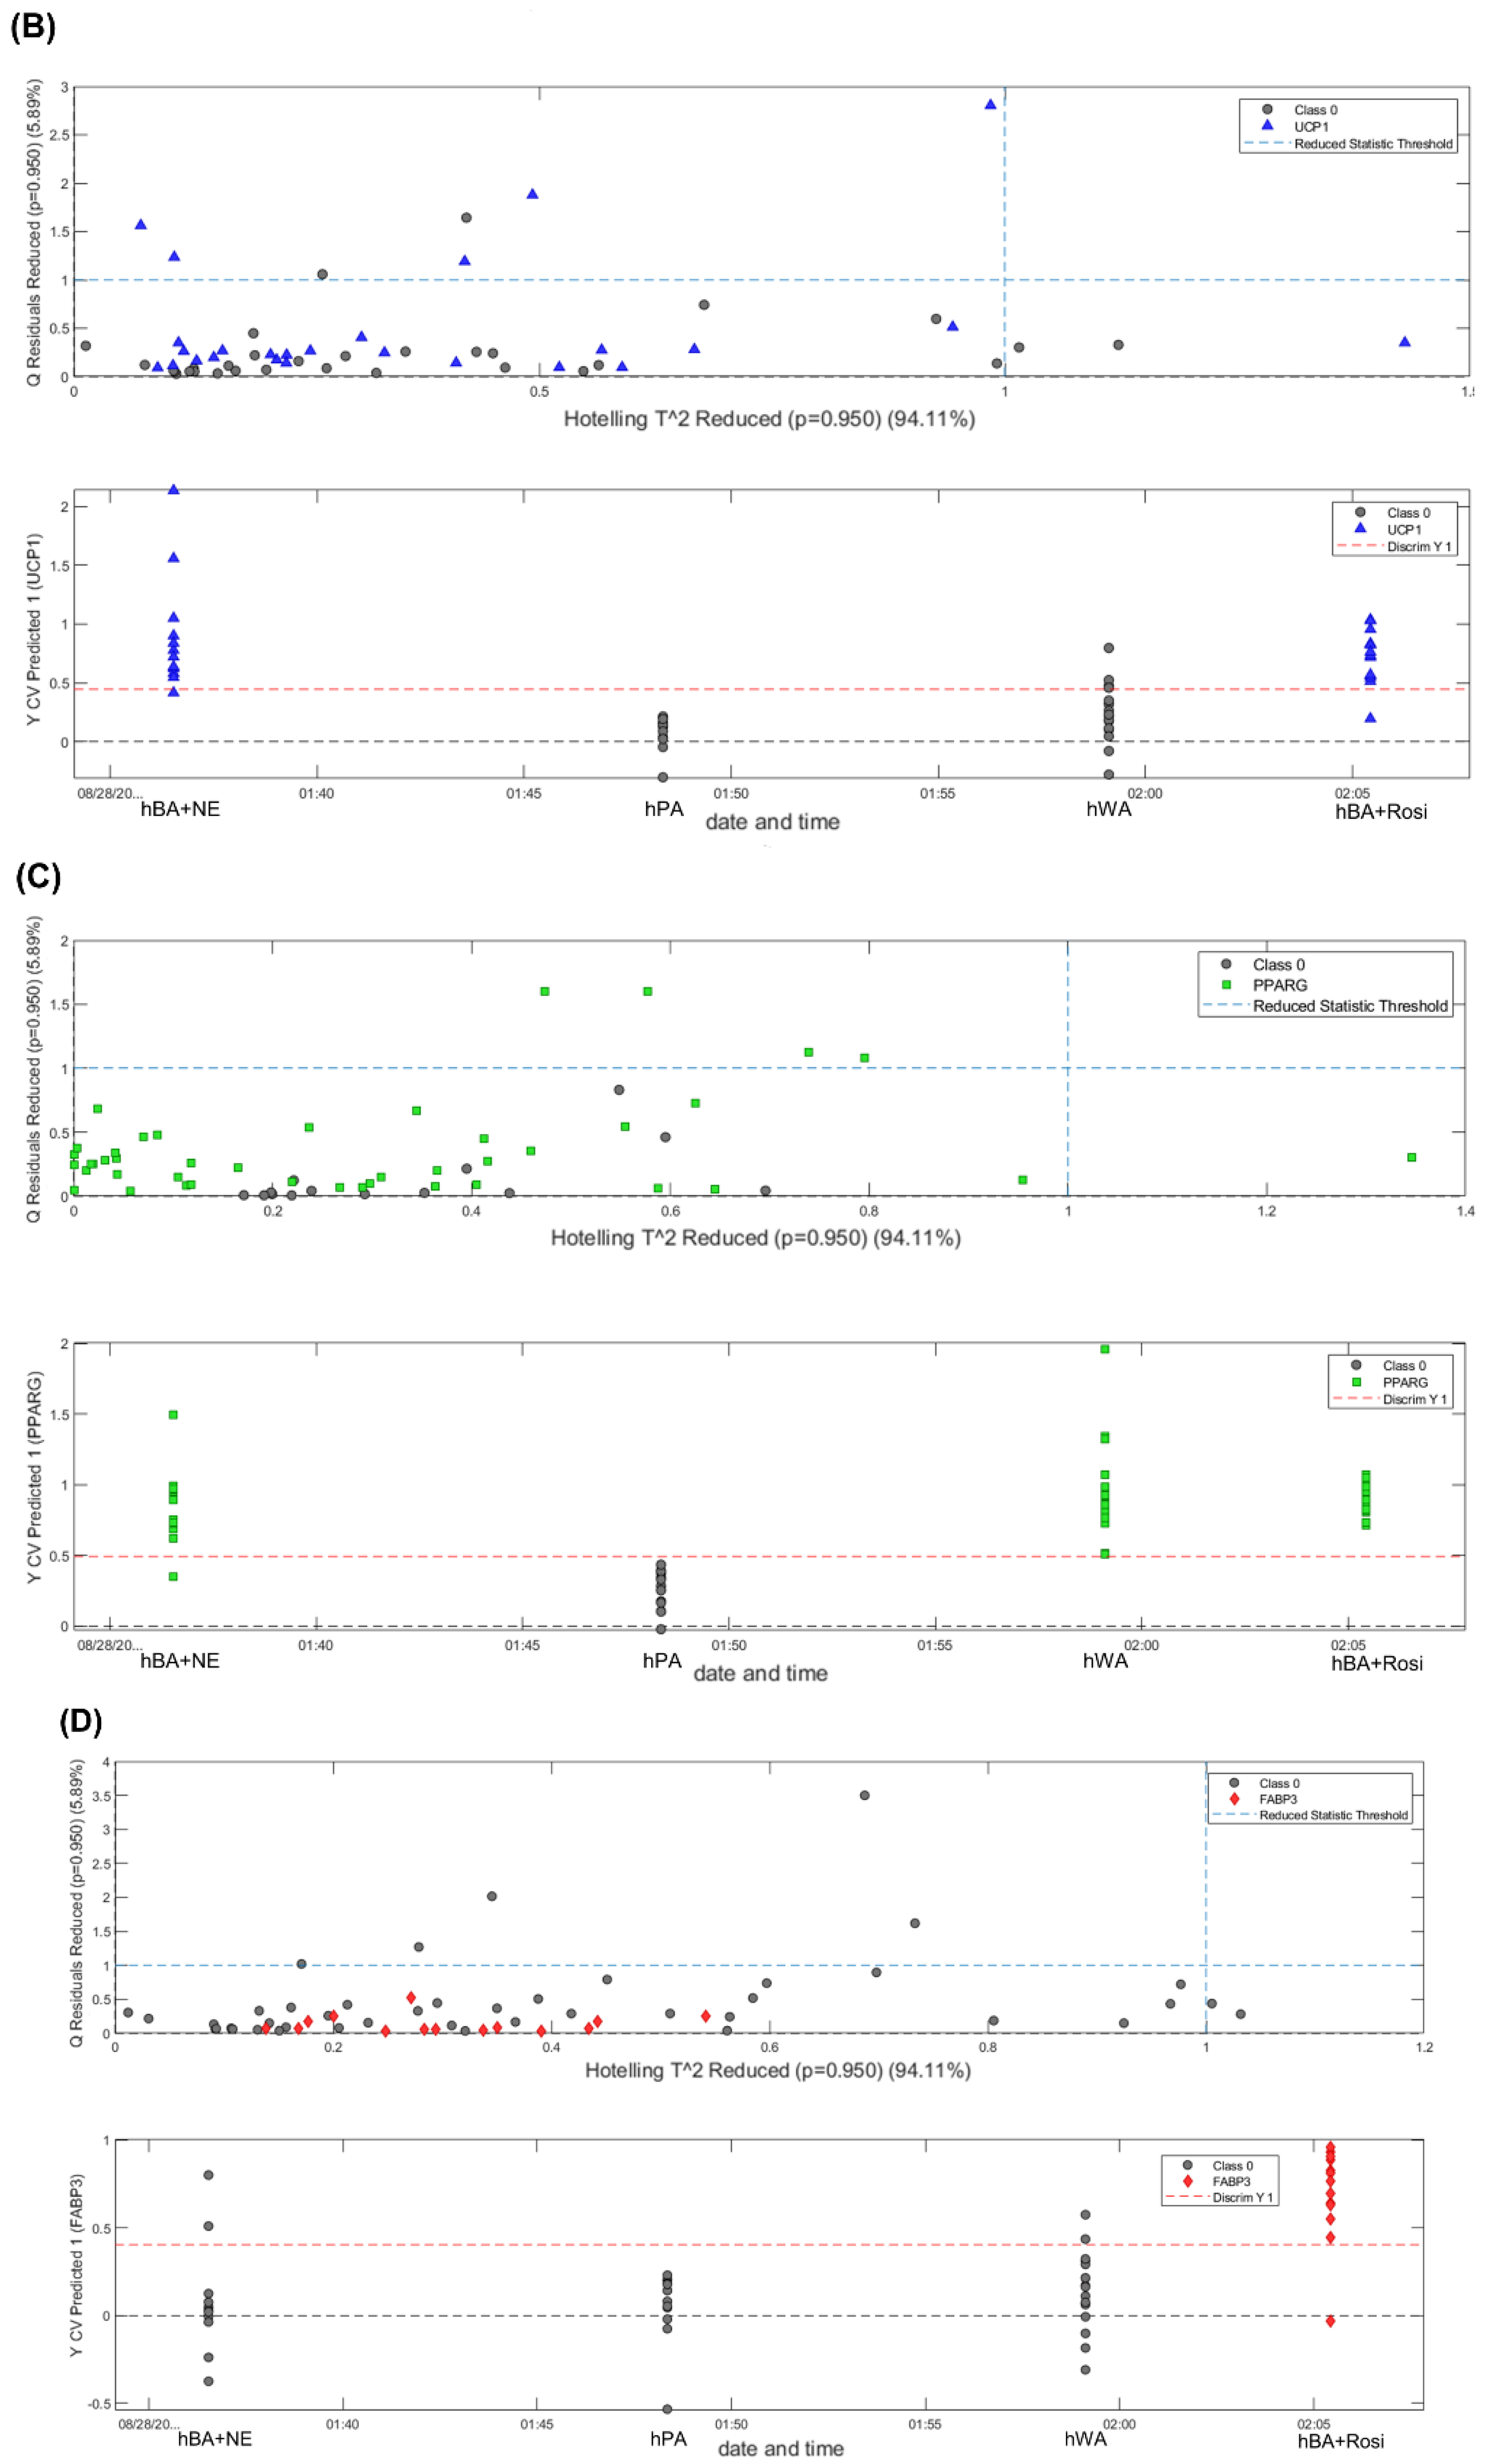
Additionally, good results were achieved using PLS-DA, which is a discrimination method based on PLS regression. The predicted hPA and a bit of overlap between hBA + NE and + Rosi in predicted hBA + NE and hBA + Rosi were shown (Figure 5A). Otherwise, there was overlap (among hBA +NE, +Rosi, and hWA) in the predicted hWA (Figure 5A). Predicted genes showed a tendency similar to the mRNA expression of qPCR in predicted UCP1, PPARG, and FABP3 (Figure 1C,D and Figure 5B–D).

4. Discussion

This study was conducted to determine whether PLSR and FTIR spectroscopy can be used instead of molecular biology approaches to identify the browning of white adipocytes and the spectral peaks in pre-processed spectra used for PLSR as biological signals. FTIR is suggested to be an effective tool in a limited environment because it does not require labeling and is relatively free of time and labor. A predictive model of PLSR was used to identify beige adipocytes instead of changes in a given peak and to compare the ratio between peaks [39]. This is because it can be checked intuitively without needing to carefully observe and compare the spectra. hBA and hBA-CM were difficult to distinguish via PCA-LDA, PCA, and PLS scatter plot analyses, which are unsupervised classical machine learning methods [25] (Figures S1 and S2). Furthermore, PLS-DA, an unsupervised classical machine learning method, was also not able to clearly distinguish between hBA and others (Figure 5B). For reference, UCP1 is one representative mRNA at the time of browning in adipocyte, and is described in Method and Materials. Interestingly, there has been a recent report on the discrimination between Korean domestic and foreign soybeans using modified PLSR, a supervised classical learning of machine learning technique [25], in near-infrared spectroscopy [32]. In addition, a previous study showed that PLSR can be applied to the identification of cell type to discriminate between ginseng cultivated for 5 five and six years by FTIR analysis [40]. Based on these studies, the application of PLSR yielded significant results for hBA and was confirmed with the test set validation as external validation (Figure 1F and Figure S3). This was done as a previous study, in which dengue was diagnosis with sera using PLRS and FTIR [34]. When using a high throughput search for future drug candidates, it would be effective if the predicted value of PLSR is less than 35 as a negative effect, 35–70 as uncertainty, and more than 70 as a positive effect (Figure 1F and Table 2). By converting PLSR to a confusion matrix according to “less 35 as a negative and over 70 as a positive” and making an AUC-ROC curve based on Narkhede’s papers [41,42], the AUC will be one higher than the AUC in the PLS-DA ROC curve (Figure S5). Additionally, the advantage of PLSR is that it does not require testing white adipocytes to check the effect in high throughput searches for future drug candidates, and the effect of the drug candidates is intuitively confirmed as the numerical result of PLSR’s predictive model.
Several metabolic events are activated and connected during adipocyte differentiation. PPARG is known as a key transcriptional player in adipogenesis, and ADIPOQ and FABP4 are also adipogenic markers [8,12]. In addition, beige adipocytes maximize the metabolic process for energy burning through the thermogenesis of mitochondria [4,8]. In particular, UCP1 is the most important factor in the thermogenesis of beige adipocytes, and CIEDA and DIO2 are also involved [8,9,10]. Moreover, factors such as PAT2, SLC25A20, FABP3, PDK4, and CITED1 are involved in determining the phenotype of beige adipocytes [7,8]. In this study, adipocyte differentiation was confirmed by indicating that lipid accumulation and expression of adipogenic genes were significantly increased (Figure 1B,C). It was also demonstrated that beige adipocytes were established through the up-regulation of thermogenic and beige-specific gene expression (Figure 1D,E). Rosiglitazone activates PPARG, fatty acid increases, and AMP increases via oxidation and NE-β3 adrenoceptor binding [13]. Thus, as shown in Figure 1F, detection of the peaks associated with the lipid region in pre-processed spectra of PLSR for hBA were linked to increased AMP and triglyceride breakdown to boost fatty acid levels [12,43]. This study also revealed significant findings, verifying nucleic acid-related peaks, since many transcription factors, such as PPARG, are involved in multiple gene (DNA/RNA) activations during the browning process (Table 2 and Table 3) [12,13]. Detection of both lipid and nucleic acid peaks implies that the PLSR approach is a robust alternative to complex molecular biological methodologies that require a lot of time, intensive labor, and reagents. Examples of molecular biology methodologies are Oil-red-O staining, Quantitative Reverse transcription PCR analysis, and Western blotting. These methods are described in Materials and Methods (Figure 1B–E and Figure S6).
Generally, in FTIR, data are analyzed using CaF2 windows; however, this has the disadvantage of being expensive. However, it has been reported that cell types can be identified through FTIR analysis using glass substrates, a relatively inexpensive material [44]. Therefore, in this study, the possibility of using a slide glass considering the economic aspects of FTIR was verified by referring to previous studies (Figure 2A). PLSR for hBA on a slide glass yielded critical information regarding increased fatty acid levels (Figure 2B). In addition to its convenience, the use of inexpensive slide glass is comparable to using expensive conventional CaF2 windows (Table 2). Although a slide glass was employed in human adipocyte-conditioned media, a regression (Figure 2C, Table 2), similar to the results shown in Figure 2A was achieved. Liquid samples, such as conditioned medium in this study and fertilized eggs or blood serum from breast cancer patients, were analyzed by FTIR, establishing its efficacy and applicability in biological studies [45,46].
Infrared spectral biomarkers, which are important wavenumber variables, are associated with chemical bonds in various cellular activities [47]. In this regard, several methods have been reported: the spectral difference between normal and abnormal, PCA-LDA cluster vector, U-test per wavenumber and Fisher’s score per wavenumber [48,49,50,51,52,53]. The spectral biomarkers found in this study can also be thought to be linked to genes, especially thermogenic markers (e.g., UCP1), related to the browning of adipocytes. Thus, this study demonstrates the possibility of lipidomics using spectral variables. In addition, the spectral peaks in pre-processed spectra used for PLSR to distinguish beige adipocytes and the infrared spectral biomarkers in the four adipocytes (hPA, hWA, hBA + NE, hBA + Rosi) seem to have a low correlation (Table 2 and Table 4).
In this study, infrared spectral biomarkers and PLSR were used to detect hBA. Amide, DNA changes, and OH out-of-plane bending-related infrared spectral biomarkers were identified in hBA (Table 4) [50]. Infrared spectral biomarkers associated with fatty acid ester and amide I were discovered in hBA-CM on a slide glass [50]. Due to the distinct mechanisms of Rosi and NE, variations in infrared spectral biomarkers were detected in hBA and hBA-CM (Table 4). Furthermore, using PLS-DA based on the PLS method, the adipocyte-type prediction model showed excellent results (Figure 5A and Figure S4) [54]. Although it was difficult to distinguish between adipocytes based on the expressed gene using PLS-DA, predicted genes of PLS-DA showed a tendency similar to qPCR analysis (Figure 1C,D, Figure 5B–D and Figure S5). This should be verified through single-cell analysis in the future; however, the distribution of the expressed genes among cells may be determined through PLS-DA (Figure 5B–D and Figure S5).

5. Conclusions

In conclusion, this study indicates that PLSR and FTIR spectroscopy are efficient tools for screening drug candidates and identifying specific biological phenomena. It is particularly useful for browning in adipocytes. However, this study has several limitations. For example, the activator is not strong, as in the case of Rosi or NE, only the uncertainty values would appear. In addition, overfitting is possible when using PLS. Thus, there is a need for cross-validation using molecular biological methods with actual candidate drugs in advance, when PLSR and FTIR spectroscopy are applied. In addition, the study indicated that PLSR, infrared spectral biomarkers, and PLS-DA using FTIR spectroscopy are efficient tools for identifying specific biological activities in lipid biology (Table S1). Further, these approaches may be used in high-throughput analysis as alternatives to molecular biological methods.

Supplementary Materials

The following supporting information can be downloaded at: https://www.mdpi.com/article/10.3390/photonics10010002/s1, Figure S1: The 3D scatter plots of PCA-LDA, PCA, and PLS using FTIR spectra of human adipocytes; Figure S2: The 3D scatter plots of PCA-LDA, PCA, and PLS using FTIR spectra of human adipocytes conditioned media; Figure S3: Test set validation (A) Test set validation of PLSR for hBA. (B) Test set validation of PLSR for hBA on a slide glass. (C) Test set validation of PLSR for hBA-CM on a slide glass; Figure S4: ROC of PLS-DA used in classification of adipocytes; Figure S5: ROC of PLS-DA used in expression distribution of adipogenic genes in adipocytes; Figure S6: Analysis of brown-like adipocyte characteristics of adipocytes in differentiated hBA; Figure S7: Raw spectra of hBA, hPA and hWA on a slide glass; Figure S8. Raw spectra of hBA-CM, hPA-CM and hWA-CM on a slide glass; Table S1: Summarization of objective, methods, results, and discussion of this study.

Author Contributions

Conceptualization, D.-H.S., S.-J.P. and Y.K.; methodology, D.-H.S. and S.-J.P.; software, D.-H.S. and S.-J.P.; validation, D.-H.S., S.-J.P., S.-J.Y. and Y.K.; formal analysis, D.-H.S. and S.-J.P.; investigation, D.-H.S. and S.-J.P.; resources, D.-H.S., S.-J.P. and Y.-H.R.; data curation, D.-H.S. and S.-J.P.; writing—original draft preparation, D.-H.S. and S.-J.P.; writing—review and editing, Y.K.; visualization, D.-H.S. and S.-J.P.; supervision, Y.K.; project administration, D.-H.S. and S.-J.P.; funding acquisition, D.-H.S., S.-J.P. and Y.K. All authors have read and agreed to the published version of the manuscript.

Funding

This study was supported by a Korea University Grant.

Institutional Review Board Statement

The study was conducted according to the guidelines of the Declaration of Helsinki, and experimental protocol was approved by “Institutional Review Board of Hangang Sacred Heart Hospital” (2017–118).

Informed Consent Statement

Not applicable.

Data Availability Statement

Not applicable.

Conflicts of Interest

The authors declare no conflict of interest.

Abbreviations

hADSCs: human adipose-derived stem cells [also called hPA, human preadipo-cytes]; hBA, human beige adipocytes; hBA + NE, human beige adipocytes treated with norepinephrine; hBA + Rosi, human beige adipocytes treated with rosiglitazone; hWA, human white adipocytes; hPA-CM, human preadipocyte-conditioned medium; hBA-CM, human beige adipocyte-conditioned medium; hBA + NE-CM, human beige adipocyte-conditioned medium treated with norepinephrine; hBA + Rosi-CM, human beige adipocyte-conditioned medium treated with rosiglitazone; hWA-CM, human white adipocyte-conditioned medium.

References

  1. Renehan, A.G.; Tyson, M.; Egger, M.; Heller, R.F.; Zwahlen, M. Body-mass index and incidence of cancer: A systematic review and meta-analysis of prospective observational studies. Lancet 2008, 371, 569–578. [Google Scholar] [CrossRef] [PubMed]
  2. James, P.T. Obesity: The worldwide epidemic. Clin. Dermatol. 2004, 22, 276–280. [Google Scholar] [PubMed]
  3. Kahn, S.E.; Hull, R.L.; Utzschneider, K.M. Mechanisms linking obesity to insulin resistance and type 2 diabetes. Nature 2006, 444, 840–846. [Google Scholar] [CrossRef] [PubMed]
  4. Seale, P.; Lazar, M.A. Brown Fat in Humans: Turning up the Heat on Obesity. Diabetes 2009, 58, 1482–1484. [Google Scholar] [CrossRef] [PubMed] [Green Version]
  5. Feakins, R.M. Obesity and metabolic syndrome: Pathological effects on the gastrointestinal tract. Histopathology 2016, 68, 630–640. [Google Scholar] [CrossRef] [PubMed]
  6. Pischon, T.; Boeing, H.; Hoffmann, K. General and abdominal adiposity and risk of death in Europe. J. Vasc. Surg. 2009, 49, 811–812. [Google Scholar] [CrossRef] [Green Version]
  7. Harms, M.J.; Li, Q.; Lee, S.; Zhang, C.; Kull, B.; Hallen, S.; Thorell, A.; Alexandersson, I.; Hagberg, C.E.; Peng, X.R. Mature human white adipocytes cultured under membranes maintain identity, function, and can transdifferentiate into brown-like adipocytes. Cell Rep. 2019, 27, 213–225.e5. [Google Scholar] [CrossRef] [Green Version]
  8. Keda, K.; Maretich, P.; Kajimura, S. The common and distinct features of brown and beige adipocytes. Trends Endocrinol. Metab. 2018, 29, 191–200. [Google Scholar]
  9. Peschechera, A.; Eckel, J. “Browning” of adipose tissue—Regulation and therapeutic perspectives. Arch. Physiol. Biochem. 2013, 119, 151–160. [Google Scholar] [CrossRef]
  10. Bartelt, A.; Heeren, J. Adipose tissue browning and metabolic health. Nat. Rev. Endocrinol. 2014, 10, 24–36. [Google Scholar] [CrossRef]
  11. Montanari, T.; Boschi, F.; Colitti, M. Comparison of the Effects of Browning-Inducing Capsaicin on Two Murine Adipocyte Models. Front. Physiol. 2019, 10, 1380. [Google Scholar] [CrossRef]
  12. Wang, S.; Pan, M.-H.; Hung, W.-L.; Tung, Y.-C.; Ho, C.-T. From white to beige adipocytes: Therapeutic potential of dietary molecules against obesity and their molecular mechanisms. Food Funct. 2019, 10, 1263–1279. [Google Scholar] [CrossRef]
  13. Fayyad, A.M.; Khan, A.A.; Abdallah, S.H.; Alomran, S.S.; Bajou, K.; Khattak, M.N.K. Rosiglitazone Enhances Browning Adipocytes in Association with MAPK and PI3-K Pathways During the Differentiation of Telomerase-Transformed Mesenchymal Stromal Cells into Adipocytes. Int. J. Mol. Sci. 2019, 20, 1618. [Google Scholar] [CrossRef] [Green Version]
  14. Derrick, M.R.; Stulik, D.; Landry, J.M. Infrared Spectroscopy in Conservation Science; Getty Publications: Los Angeles, CA, USA, 2000. [Google Scholar]
  15. Baker, M.J.; Byrne, H.J.; Chalmers, J.; Gardner, P.; Goodacre, R.; Henderson, A.; Kazarian, S.G.; Martin, F.L.; Moger, J.; Stone, N.; et al. Clinical applications of infrared and Raman spectroscopy: State of play and future challenges. Analyst 2018, 143, 1735–1757. [Google Scholar] [CrossRef]
  16. Denbigh, J.L.; Perez-Guaita, D.; Vernooij, R.R.; Tobin, M.J.; Bambery, K.R.; Xu, Y.; Southam, A.D.; Khanim, F.L.; Drayson, M.T.; Lockyer, N.P.; et al. Probing the action of a novel anti-leukaemic drug therapy at the single cell level using modern vibrational spectroscopy techniques. Sci. Rep. 2017, 7, 2649. [Google Scholar] [CrossRef]
  17. Al-Jorani, K.; Rüther, A.; Haputhanthri, R.; Deacon, G.B.; Li, H.L.; Cullinane, C.; Wood, B.R. ATR-FTIR spectroscopy shows changes in ovarian cancer cells after incubation with novel organoamidoplatinum (ii) complexes. Analyst 2018, 143, 6087–6094. [Google Scholar] [CrossRef]
  18. Yamaguchi, R.-T.; Hirano-Iwata, A.; Kimura, Y.; Niwano, M.; Miyamoto, K.-i.; Isoda, H.; Miyazaki, H. In situ real-time monitoring of apoptosis on leukemia cells by surface infrared spectroscopy. J. Appl. Phys. 2009, 105, 024701. [Google Scholar] [CrossRef]
  19. Lamberti, A.; Sanges, C.; Arcari, P. FT-IR spectromicroscopy of mammalian cell cultures during necrosis and apoptosis induced by drugs. Spectroscopy 2010, 24, 420791. [Google Scholar] [CrossRef]
  20. Dunkhunthod, B.; Thumanu, K.; Eumkeb, G. Application of FTIR microspectroscopy for monitoring and discrimination of the anti-adipogenesis activity of baicalein in 3T3-L1 adipocytes. Vib. Spectrosc. 2017, 89, 92–101. [Google Scholar] [CrossRef]
  21. Buckus, B.; Brimas, G.; Stašinskas, A.; Smalenskaitė, A.; Tautkus, S.; Beganskienė, A.; Kareiva, A. Analytical characterization of adipose tissue structure and composition: A novel approach towards diagnosis of metabolic disturbances in the human body. chemija 2015, 26, 98–106. [Google Scholar]
  22. Baloglu, F.K.; Garip, S.; Heise, S.; Brockmann, G.; Severcan, F. FTIR imaging of structural changes in visceral and subcutaneous adiposity and brown to white adipocyte transdifferentiation. Analyst 2015, 140, 2205–2214. [Google Scholar] [CrossRef] [PubMed]
  23. Kucuk Baloglu, F.; Baloglu, O.; Heise, S.; Brockmann, G.; Severcan, F. Triglyceride dependent differentiation of obesity in adipose tissues by FTIR spectroscopy coupled with chemometrics. J. Biophotonics 2017, 10, 1345–1355. [Google Scholar] [CrossRef] [PubMed]
  24. Dogan, A.; Lasch, P.; Neuschl, C.; Millrose, M.K.; Alberts, R.; Schughart, K.; Naumann, D.; Brockmann, G.A. ATR-FTIR spectroscopy reveals genomic loci regulating the tissue response in high fat diet fed BXD recombinant inbred mouse strains. BMC Genom. 2013, 14, 386. [Google Scholar] [CrossRef] [PubMed] [Green Version]
  25. Mathew, P.S.; Pillai, A.S. 10—Artificial intelligence in the management of neurological disorders: Its prevalence and prominence. In Augmenting Neurological Disorder Prediction and Rehabilitation Using Artificial Intelligence; Pillai, A.S., Menon, B., Eds.; Academic Press: Cambridge, MA, USA, 2022; pp. 193–221. [Google Scholar]
  26. Freedman, D.A. Statistical Models: Theory and Practice; Cambridge University Press: Cambridge, UK, 2009. [Google Scholar]
  27. Tolles, J.; Meurer, W.J. Logistic regression: Relating patient characteristics to outcomes. Jama 2016, 316, 533–534. [Google Scholar] [CrossRef] [PubMed]
  28. Norris, C.M.; Ghali, W.A.; Saunders, L.D.; Brant, R.; Galbraith, D.; Faris, P.; Knudtson, M.L.; Investigators, A. Ordinal regression model and the linear regression model were superior to the logistic regression models. J. Clin. Epidemiol. 2006, 59, 448–456. [Google Scholar] [CrossRef]
  29. Hellevik, O. Linear versus logistic regression when the dependent variable is a dichotomy. Qual. Quant. 2009, 43, 59–74. [Google Scholar] [CrossRef]
  30. Siregar, C.; Martono, S.; Rohman, A. Application of Fourier transform infrared (FTIR) spectroscopy coupled with multivariate calibration for quantitative analysis of curcuminoid in tablet dosage form. J. Appl. Pharm. Sci. 2018, 8, 151–156. [Google Scholar]
  31. Algethami, F.K.; Eid, S.M.; Kelani, K.M.; Elghobashy, M.R.; Abd El-Rahman, M.K. Chemical fingerprinting and quantitative monitoring of the doping drugs bambuterol and terbutaline in human urine samples using ATR-FTIR coupled with a PLSR chemometric tool. RSC Adv. 2020, 10, 7146–7154. [Google Scholar] [CrossRef]
  32. Ahn, H.-G.; Kim, Y.-H. Discrimination of Korean domestic and foreign soybeans using near infrared reflectance spectroscopy. Korean J. Crop Sci. 2012, 57, 296–300. [Google Scholar] [CrossRef] [Green Version]
  33. Seo, Y.-W.; Ahn, C.K.; Lee, H.; Park, E.; Mo, C.; Cho, B.-K. Non-destructive sorting techniques for viable pepper (Capsicum annuum L.) seeds using Fourier transform near-infrared and raman spectroscopy. J. Biosyst. Eng. 2016, 41, 51–59. [Google Scholar] [CrossRef] [Green Version]
  34. Naseer, K.; Ali, S.; Mubarik, S.; Hussain, I.; Mirza, B.; Qazi, J. FTIR spectroscopy of freeze-dried human sera as a novel approach for dengue diagnosis. Infrared Phys. Technol. 2019, 102, 102998. [Google Scholar] [CrossRef]
  35. Wold, S.; Sjöström, M.; Eriksson, L. PLS-regression: A basic tool of chemometrics. Chemom. Intell. Lab. Syst. 2001, 58, 109–130. [Google Scholar] [CrossRef]
  36. Mukherjee, S.; Martínez-González, J.; Dowling, D.P.; Gowen, A. Predictive modelling of the water contact angle of surfaces using attenuated total reflection–Fourier transform infrared (ATR-FTIR) chemical imaging and partial least squares regression (PLSR). Analyst 2018, 143, 3729–3740. [Google Scholar] [CrossRef]
  37. Lee, M.-J.; Fried, S.K. Optimal protocol for the differentiation and metabolic analysis of human adipose stromal cells. In Methods in Enzymology; Elsevier: Amsterdam, The Netherlands, 2014; pp. 49–65. [Google Scholar]
  38. Movasaghi, Z.; Rehman, S.; ur Rehman, D.I. Fourier Transform Infrared (FTIR) Spectroscopy of Biological Tissues. Appl. Spectrosc. Rev. 2008, 43, 134–179. [Google Scholar] [CrossRef]
  39. Shon, D.; Park, S.; Yoon, S.; Ko, Y. Identification of Biochemical Differences in White and Brown Adipocytes Using FTIR Spectroscopy. Appl. Sci. 2022, 12, 3071. [Google Scholar] [CrossRef]
  40. Lee, B.-J.; Kim, H.-Y.; Lim, S.R.; Huang, L.; Choi, H.-K. Discrimination and prediction of cultivation age and parts of Panax ginseng by Fourier-transform infrared spectroscopy combined with multivariate statistical analysis. PLoS ONE 2017, 12, e0186664. [Google Scholar] [CrossRef] [Green Version]
  41. Narkhede, S. Understanding confusion matrix. Towards Data Sci. 2018, 180, 1–12. [Google Scholar]
  42. Narkhede, S. Understanding auc-roc curve. Towards Data Sci. 2018, 26, 220–227. [Google Scholar]
  43. Merlin, J.; Sato, M.; Chia, L.Y.; Fahey, R.; Pakzad, M.; Nowell, C.J.; Summers, R.J.; Bengtsson, T.; Evans, B.A.; Hutchinson, D.S. Rosiglitazone and a β3-adrenoceptor agonist are both required for functional browning of white adipocytes in culture. Front. Endocrinol. 2018, 9, 249. [Google Scholar] [CrossRef]
  44. Bassan, P.; Mellor, J.; Shapiro, J.; Williams, K.J.; Lisanti, M.P.; Gardner, P. Transmission FT-IR chemical imaging on glass substrates: Applications in infrared spectral histopathology. Anal. Chem. 2014, 86, 1648–1653. [Google Scholar] [CrossRef]
  45. Zandbaaf, S.; Khorrami, M.R.K.; Garmarudi, A.B.; Rashidi, B.H. Infrared spectroscopic and chemometric approach for identifying morphology in embryo culture medium samples. Infrared Phys. Technol. 2020, 106, 103284. [Google Scholar] [CrossRef]
  46. Sitnikova, V.E.; Kotkova, M.A.; Nosenko, T.N.; Kotkova, T.N.; Martynova, D.M.; Uspenskaya, M.V. Breast cancer detection by ATR-FTIR spectroscopy of blood serum and multivariate data-analysis. Talanta 2020, 214, 120857. [Google Scholar] [CrossRef]
  47. Morris, A.D.; Morais, C.L.M.; Lima, K.M.G.; Freitas, D.L.D.; Brady, M.E.; Dhaygude, A.P.; Rowbottom, A.W.; Martin, F.L. Distinguishing active from quiescent disease in ANCA-associated vasculitis using attenuated total reflection Fourier-transform infrared spectroscopy. Sci. Rep. 2021, 11, 9981. [Google Scholar] [CrossRef]
  48. Trevisan, J.; Angelov, P.P.; Carmichael, P.L.; Scott, A.D.; Martin, F.L. Extracting biological information with computational analysis of Fourier-transform infrared (FTIR) biospectroscopy datasets: Current practices to future perspectives. Analyst 2012, 137, 3202–3215. [Google Scholar] [CrossRef]
  49. Baker, M.J.; Trevisan, J.; Bassan, P.; Bhargava, R.; Butler, H.J.; Dorling, K.M.; Fielden, P.R.; Fogarty, S.W.; Fullwood, N.J.; Heys, K.A. Using Fourier transform IR spectroscopy to analyze biological materials. Nat. Protoc. 2014, 9, 1771. [Google Scholar] [CrossRef]
  50. Trevisan, J.; Angelov, P.P.; Scott, A.D.; Carmichael, P.L.; Martin, F.L. IRootLab: A free and open-source MATLAB toolbox for vibrational biospectroscopy data analysis. Bioinformatics 2013, 29, 1095–1097. [Google Scholar] [CrossRef] [Green Version]
  51. Martin, F.L.; Kelly, J.G.; Llabjani, V.; Martin-Hirsch, P.L.; Patel, I.I.; Trevisan, J.; Fullwood, N.J.; Walsh, M.J. Distinguishing cell types or populations based on the computational analysis of their infrared spectra. Nat. Protoc. 2010, 5, 1748–1760. [Google Scholar] [CrossRef]
  52. Gajjar, K.; Heppenstall, L.D.; Pang, W.; Ashton, K.M.; Trevisan, J.; Patel, I.I.; Llabjani, V.; Stringfellow, H.F.; Martin-Hirsch, P.L.; Dawson, T. Diagnostic segregation of human brain tumours using Fourier-transform infrared and/or Raman spectroscopy coupled with discriminant analysis. Anal. Methods 2013, 5, 89–102. [Google Scholar] [CrossRef]
  53. Walsh, M.J.; Singh, M.N.; Pollock, H.M.; Cooper, L.J.; German, M.J.; Stringfellow, H.F.; Fullwood, N.J.; Paraskevaidis, E.; Martin-Hirsch, P.L.; Martin, F.L. ATR microspectroscopy with multivariate analysis segregates grades of exfoliative cervical cytology. Biochem. Biophys. Res. Commun. 2007, 352, 213–219. [Google Scholar] [CrossRef]
  54. Robotti, E.; Marengo, E. Chemometric multivariate tools for candidate biomarker identification: LDA, PLS-DA, SIMCA, Ranking-PCA. In 2-D PAGE Map Analysis; Springer: Berlin/Heidelberg, Germany, 2016; pp. 237–267. [Google Scholar]
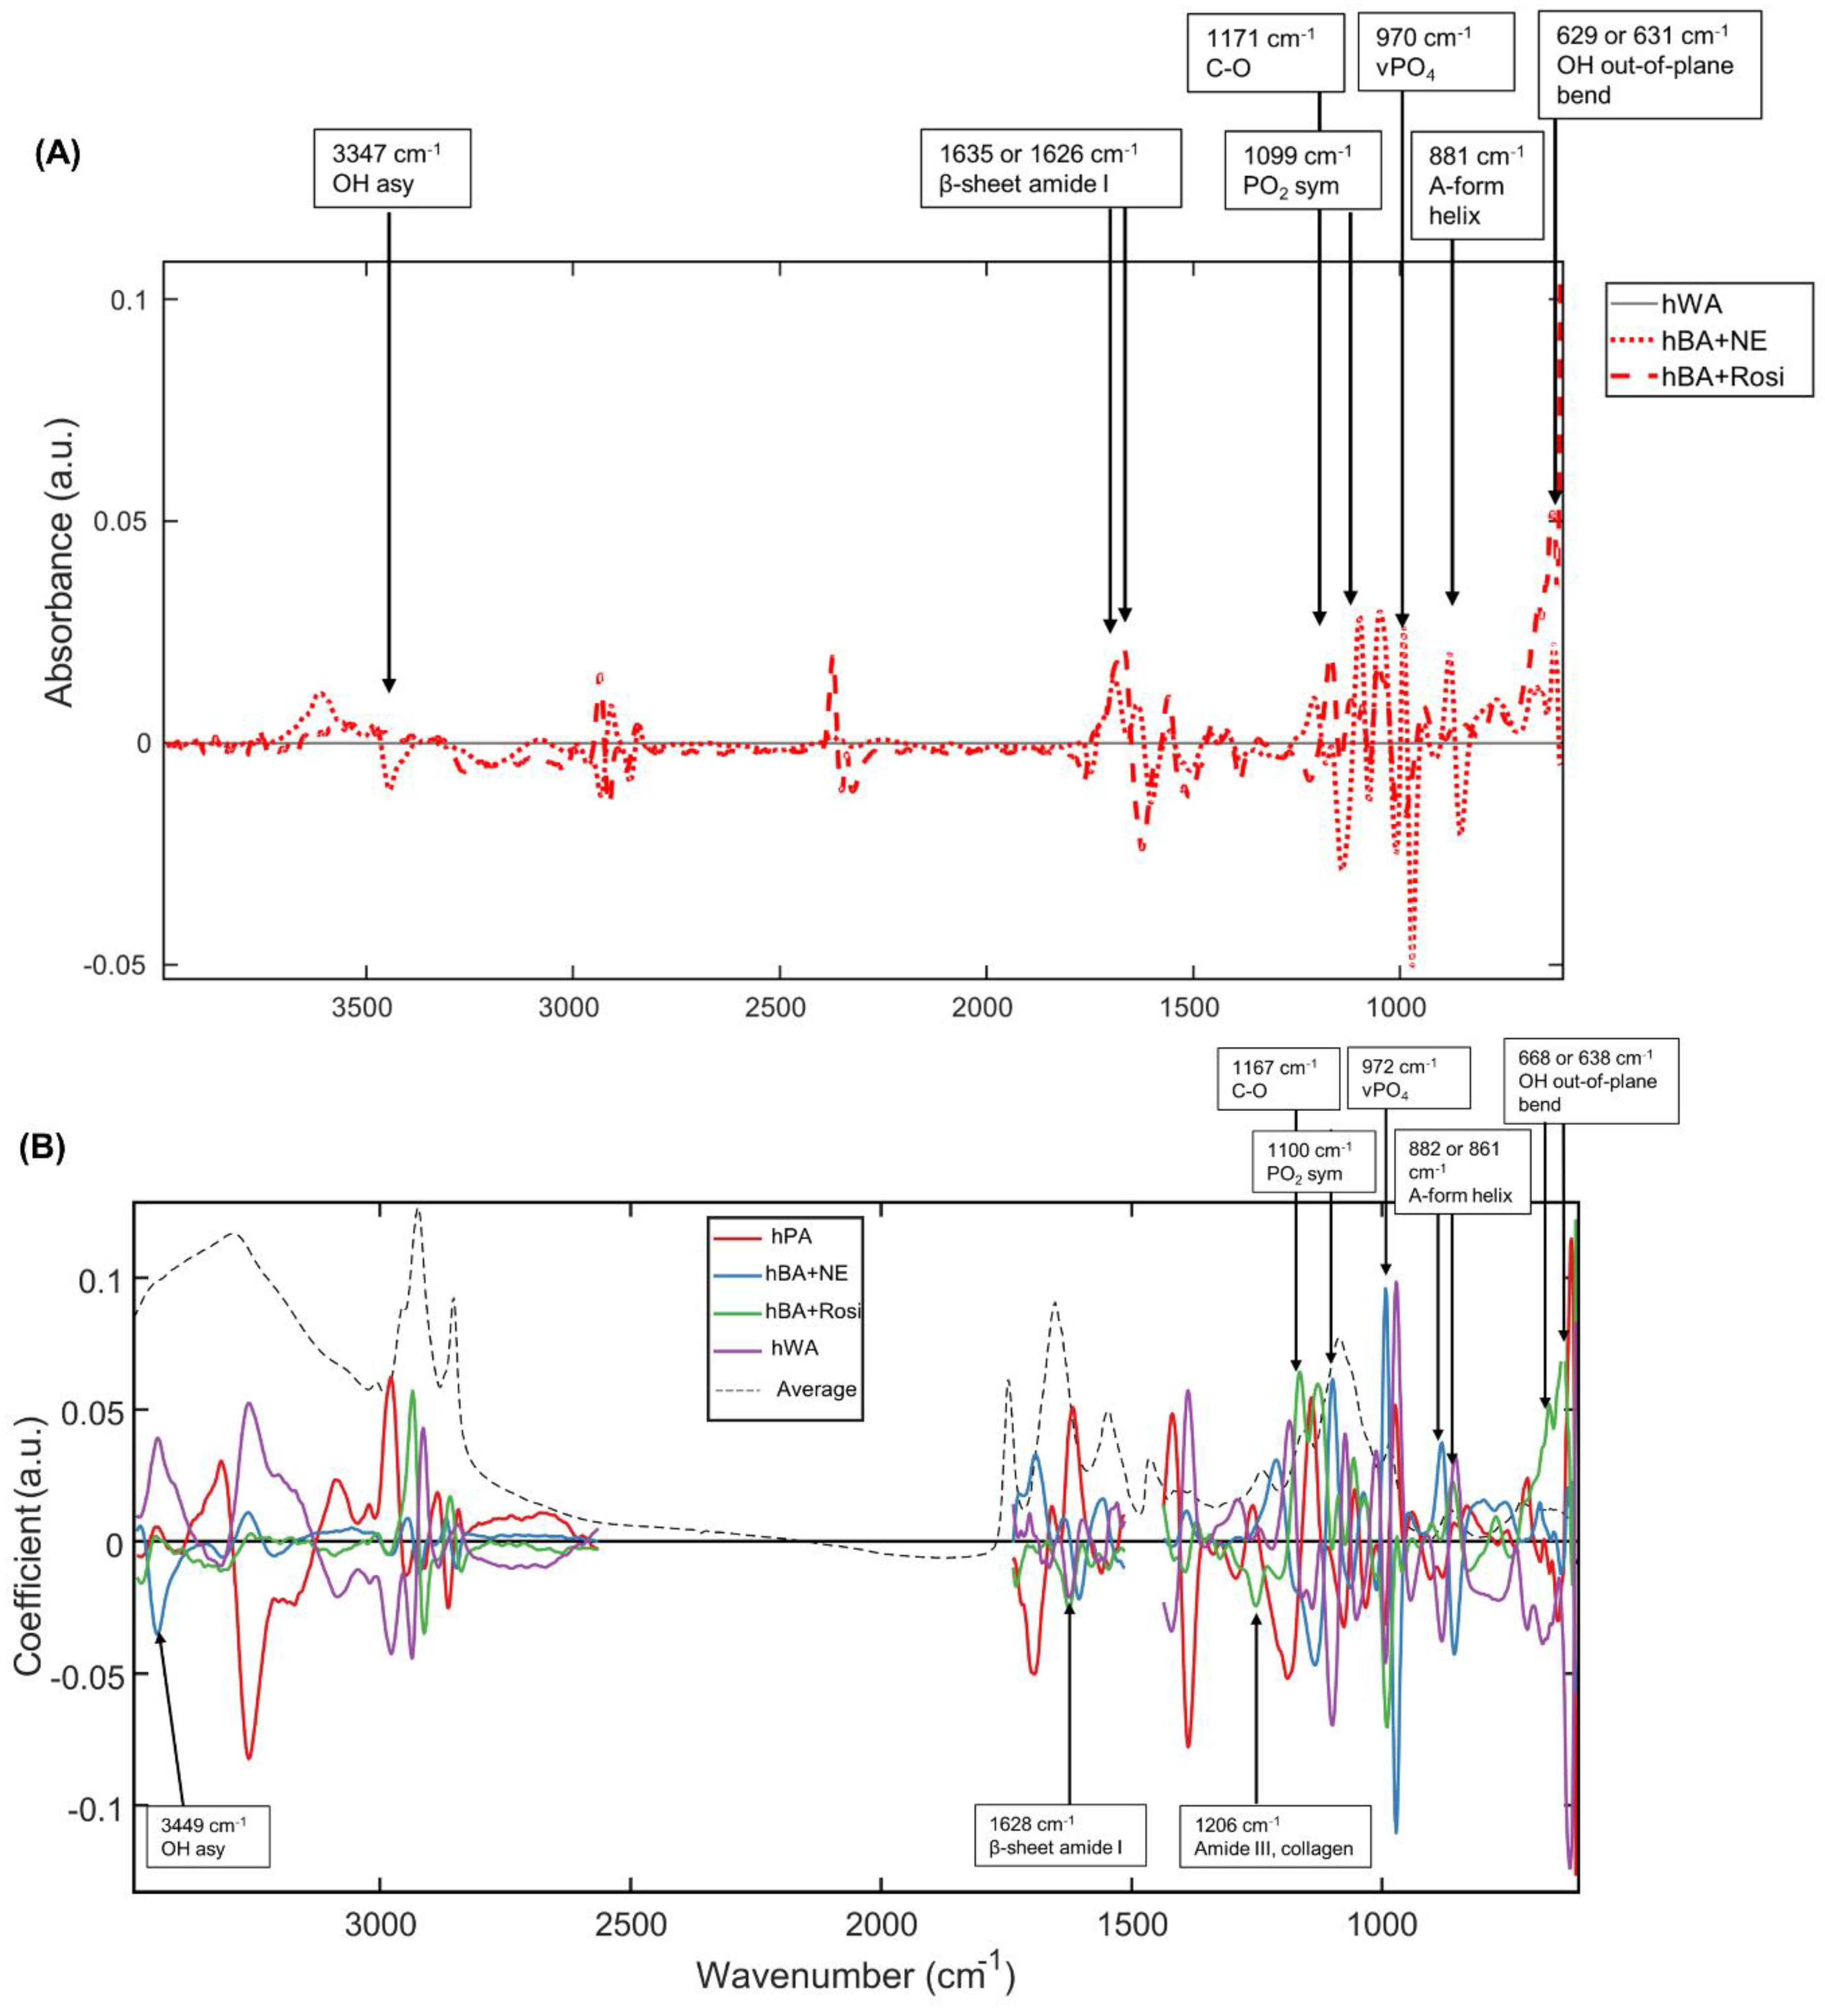
Figure 3. Infrared spectral biomarkers of hBA. (A) The differences between mean spectra of hBA and hWA. (B) PCA-LDA cluster vector for hBA. (C) U-test per wavenumber for hBA. (D) Fisher’s score per wavenumber for hBA. −log(0.05) = 1.3, significance level.
Photonics 10 00002 g003aPhotonics 10 00002 g003b
Figure 4. Infrared spectral biomarkers of hBA-CM. (A) The differences between mean spectra of hBA-CM and hWA-CM. (B) PCA-LDA cluster vector for hBA-CM. (C) U-test, and Fisher’s score per wavenumber for hBA-CM). −log(0.05) = 1.3, significance level.
Photonics 10 00002 g004aPhotonics 10 00002 g004b
Figure 5. Classification of adipocytes and expression distribution of adipogenic genes in adipocytes determined using PLS-DA. (A) Classification of adipocytes using PLS-DA. (B) UCP1′s expression distribution using PLS-DA. (C) PPARG’s expression distribution using PLS-DA. (D) FABP3′s expression distribution using PLS-DA.
Photonics 10 00002 g005aPhotonics 10 00002 g005b
Table 1. List of primers used for qRT-PCR.
GeneForward (5′–3′)Reverse (5′–3′)Accession No.
GAPDHGGAAGGTGAAGGTCGGAGTCGAAGGGGTCATTGATGGCAACNM_001256799
CIDEATGGGAGACAACACGCATTTCATCATACATGGTGGCCTTCACGNM_001279
PPARGGACCCAGAAAGCGATTCCTTCTCCATTACGGAGAGATCCACGNM_001330615
ADIPOQTTGCCTACCACATCACAGTCTTTACGCTCTCCTTCCCCATACNM_001177800
UCP1ACTTGGTGTCGGCTCTTATCGCCGTTGGTCCTTCGTTAGTGANM_021833
CITED1CCTCACCTGCGAAGGAGGAGGAGAGCCTATTGGAGATCCCNM_001144885
FABP3ACCAAGCCTACCACAATCATCGCAAGTTTCCCTCCATCCAGTGTNM_001320996
FABP4GCAGCTTCCTTCTCACCTTGATCACATCCCCATTCACACTGANM_001442
PAT2TATGTCGCCTCCTGAAAGTGCTTCTTCACAGCGAGGGGTAGTNM_181776
SLC25A20AGACACAGCCACCGAGTTTGTCCCCAAACCAAACCCAAAGANM_000387
PDK4TCAGCCTTCCCTTACACCAATAAACCAGCCAAAGGAGCATTCNM_002612
DIO2GTCCTCCATCAGGTTTTAGCAACTCACCCAATTTCACCATCCANM_000793
Table 3. Inclusion of important wavenumbers in the infrared region for each PLSR.
Wavenumber3005 cm−1
Olefinic
2955 cm−1
CH3 asy 1
2920 cm−1
CH2 asy
2870 cm−1
CH3 sym 2
2850 cm−1
CH2 sym
1744 cm−1
TG 3
1652 cm−1
Amide I
1543 cm−1
Amide II
1240 cm−1
B-Form DNA
1220 cm−1
B-Form DNA
Type
hBAX 4XXXXXXO 5OO
hBA on a slide glassOOOOOOONA 6NANA
hBA-CM on a slide glassOOOXXXXNANANA
1 asy, asymmetry; 2 sym, symmetry; 3 TG, triglyceride; 4 X, not included; 5 O, included; 6 NA, not available.
Table 4. Infrared spectral biomarkers for browning in human adipocytes in adipocyte/conditioned medium.
Statistical TestPeak Wavenumber (cm−1 )
Meaning of peaksOH asyβ-sheet amide IPO2 symνPO4A-form helixOH out-of-plane bendMeaning of peaksβ-sheet amide IAmide III, collagenC-OA-form helixOH out-of-plane bendOH out-of-plane bend
differences between mean spectrahBA + NE334716351099970881629hBA + Rosi1626 1171 668631
PCA-LDA cluster3449 1100972882 162812061167861668638
U-test per wavenumber344416351100977 63316351204 861 633
Fisher’s score per wavenumber344416351097972879 163512061164860668
Meaning of peaksC-Hν(C=C)C=Oamide Iamide Iamide IMeaning of peaksC=Oamide Iamide Iamide Iamide I
differences between mean spectrahBA + NE-CM on a slide glass294017541728 1640hBA + Rosi-CM on a slide glass 1666 1648
PCA-LDA cluster29411752172816881658 1733168616631659
U-test per wavenumber 173116891656164217311689 16561642
Fisher’s score per wavenumber 168816561643 1688 16561645
Disclaimer/Publisher’s Note: The statements, opinions and data contained in all publications are solely those of the individual author(s) and contributor(s) and not of MDPI and/or the editor(s). MDPI and/or the editor(s) disclaim responsibility for any injury to people or property resulting from any ideas, methods, instructions or products referred to in the content.