Article

Spatio-Temporal Dynamics of Vegetation and Water Stress in the Trichonida Basin Using Remote Sensing and Climatic Drought Indicators


by
Fatima Daide
1,
Eleni Ioanna Koutsovili
2,3,
Mohammed Mouad Mliyeh
1,
Abderrahim Lahrach
1,
Isavela N. Monioudi
4 and
Ourania Tzoraki
4,*
1
Laboratory of Geo-Resources and Environment, Faculty of Sciences and Techniques, University of Sidi Mohamed Ben Abdellah, Fez 30000, Morocco
2
Istituto di Elettronica e di Ingegneria dell’Informazione e delle Telecomunicazioni (IEIIT), Consiglio Nazionale delle Ricerche (CNR), 56122 Pisa, Italy
3
Department of Agriculture, Food and Environment, University of Pisa, 56124 Pisa, Italy
4
Department of Marine Sciences, School of Environment, University of the Aegean, 81100 Mytilene, Greece
*
Author to whom correspondence should be addressed.
Limnol. Rev. 2026, 26(2), 22; https://doi.org/10.3390/limnolrev26020022

Submission received: 17 March 2026 / Revised: 21 May 2026 / Accepted: 22 May 2026 / Published: 28 May 2026

Abstract

Freshwater lakes in Mediterranean regions are highly sensitive to climatic variability, particularly to droughts intensified by rising temperatures and increasing atmospheric evaporative demand. This study investigates drought variability and ecosystem responses in the Trichonida basin, the largest natural freshwater system in Greece, using an integrated approach that combines the Standardized Precipitation Evapotranspiration Index (SPEI) at multiple time scales with satellite-derived Normalized Difference Vegetation Index (NDVI), Crop Water Stress Index (CWSI), and lake surface water temperature. SPEI analysis revealed increasingly recurrent and persistent drought conditions in recent years, especially at medium- and long-term scales. NDVI exhibited pronounced seasonal variability and a moderate long-term increase at the basin scale, largely associated with agricultural activity and irrigation practices, while sharp declines were observed during severe drought episodes. CWSI showed strong seasonal patterns characterized by recurrent summer water stress events, but no significant long-term trend. Correlation analysis indicated positive relationships between NDVI and SPEI at medium- to long-term time scales, and significant negative correlations between CWSI and SPEI at short and medium time scales. A strong relationship between NDVI and CWSI further suggests the sensitivity of vegetation greenness to water stress, particularly during summer and autumn. Lake surface water temperature exhibited seasonal warming trends that coincided with periods of increased vegetation water stress. Drought-related water risks arise for calcareous fens dominated by Cladium mariscus in the Lake Trichonida system, a habitat of high conservation value, whose productivity is strongly seasonally controlled and closely linked to thermal dynamics. Overall, the combined multi-indicator analysis provides valuable insights into drought impacts and seasonal ecosystem vulnerability in Mediterranean lake basin environments, highlighting the importance of integrated monitoring frameworks for sustainable freshwater ecosystem management under increasing climatic variability.

1. Introduction

Freshwater lakes in Mediterranean regions function as strategic water reservoirs and ecological hotspots, while being increasingly exposed to the combined effects of climate change, prolonged drought periods, agricultural intensification, and land-use change, highlighting the necessity for comprehensive drought monitoring approaches that assess ecosystem health and hydrological stress to support sustainable management [1]. Such approaches can capture complex interactions between climatic forcing, vegetation responses, and water body dynamics [2,3]. Mediterranean freshwater systems are particularly vulnerable to alterations in precipitation patterns and rising air temperatures, which can have compound effects on water levels, thermal structure, and overall ecological functioning [4]. Over recent decades, Greek lake systems have exhibited substantial changes, including declining water volumes, modified salinity regimes, habitat degradation, and consistent warming trends in lake surface temperatures, driven by the combined effects of reduced precipitation and landscape transformation [2,4].
Drought is a complex and multidimensional phenomenon that manifests differently across temporal scales and ecosystem components. Remote sensing techniques and drought indices have been used extensively in agricultural- and landscape-scale drought research, offering continuous observations that link atmospheric moisture deficits with vegetation responses [5,6]. The integration of multiple remote sensing-derived indices offers a promising approach for comprehensive water stress assessment and the development of early warning systems in vulnerable freshwater ecosystems [7,8,9].
The Standardized Precipitation Evapotranspiration Index (SPEI) serves as a tool for characterizing climatic drought and incorporates temperature effects on water demand through potential evapotranspiration, making it particularly relevant for Mediterranean climates where high evaporative demand amplifies drought impacts [10]. SPEI has been successfully applied to analyze drought impacts on lake watersheds, demonstrating its ability to capture multi-scale drought forcing and to reveal distinct drought dynamics and ecosystem responses [11,12,13].
The Normalized Difference Vegetation Index (NDVI) [14], is one of the most widely used indicators of vegetation greenness and has been applied extensively in drought-related studies [15]. In lake ecosystems, NDVI monitoring includes riparian zones and watershed vegetation, which play important roles in regulating water and nutrient flows to lakes [16]. Vegetation responses to water stress often provide early signals of drought impacts and ecosystem degradation, making NDVI a valuable complement to meteorological drought indices [17,18]. Previous studies have shown significant correlations between SPEI and NDVI across lake watersheds, with NDVI exhibiting variable lag responses depending on vegetation type, seasonality, and drought intensity [11,19]. These findings highlight the importance of assessing SPEI–NDVI relationships to better understand how drought conditions influence vegetation variations across seasons and drought timescales [20].
However, NDVI often reflects a lagged response to water stress, as reductions in vegetation greenness typically occur after plants have experienced sustained water deficits. To complement this cumulative response, the Crop Water Stress Index (CWSI) quantifies vegetation water stress by relating satellite-derived land surface temperature to evapotranspiration processes [21], making it particularly useful for assessing plant water deficit conditions [17,22,23]. Although CWSI has been widely applied in agricultural and irrigation management contexts, its potential application to riparian vegetation and lake catchment zones remains relatively underexplored in the literature. Incorporating CWSI into lake-focused drought assessments could therefore provide insights into land surface water demand that influences both anthropogenic water use and natural hydrological processes feeding lake systems.
Water surface temperature is a fundamental physical parameter that controls lake metabolism, stratification patterns, and evaporation rates, while also serving as an integrative indicator of climate forcing and energy balance [24]. Lake surface temperature responds to both atmospheric forcing and hydrological changes, making it a sensitive indicator of climate-related impacts on aquatic ecosystems and a critical component of drought assessment. In recent decades, increasing lake surface temperatures have been documented across Greek lakes, with potential consequences for thermal stratification, evaporation rates, and overall ecological functioning [2].
Lake Trichonida represents a freshwater ecosystem of exceptional ecological, hydrological, and socio-economic importance at both national and regional scales. As the largest natural freshwater lake in Greece, it constitutes a critical water resource supporting irrigation, domestic water supply, and economic activities across and beyond its catchment [25,26]. The lake also plays a key role in flood regulation, drought mitigation, biodiversity conservation, carbon sequestration, and local microclimate regulation [27]. Despite sustained anthropogenic pressures, including intensive agriculture and water abstractions, Lake Trichonida has largely preserved its oligotrophic character, maintaining good ecological status under the Water Framework Directive [28,29]. Its designation within the Natura 2000 network underscores its high conservation and research value, particularly regarding sensitive habitats such as calcareous fens, which are increasingly threatened by hydrological alterations and climatic variability [26,30]. These characteristics make Lake Trichonida an ideal case study for investigating spatio-temporal dynamics of vegetation and water stress under combined climatic and anthropogenic influences.
Despite growing recognition of the value of multi-parameter monitoring, integrated analysis that combines vegetation dynamics, water stress, climatic drought, and lake surface water temperature remains scarce, particularly for Mediterranean lake ecosystems. Lake Trichonida has been studied primarily with respect to water quality, trophic status, biological assessments, and eutrophication monitoring [31,32,33], with limited attention given to the combined impacts of drought variability and thermal stress. This knowledge gap constrains our understanding of how atmospheric drought affects vegetation and hydrological dynamics in lake systems under increasing climate pressure.
This study contributes to the existing literature by providing a multi-integrated framework specifically designed for a Mediterranean lake catchment system, combining short- and long-term drought characterization with vegetation dynamics and stress monitoring and lake thermal dynamics. Particular emphasis is placed on calcareous fens with Cladium mariscus, a sensitive groundwater-dependent ecosystem that remains underrepresented in remote sensing-based drought studies.
In this context, the present study conducts a comprehensive multi-indicator assessment of drought variability in the Trichonida basin. Specifically, it aims to
(1)
Assess drought variability using multi-timescale SPEI to characterize meteorological patterns and identify critical accumulation periods for ecosystem impacts;
(2)
Analyze vegetation response using the NDVI to quantify cumulative drought effects on vegetation greenness;
(3)
Quantify vegetation water stress using the CWSI to detect rapid physiological responses to water deficits and identify periods of severe stress;
(4)
Examine the role of lake surface water temperature on land-cover-specific vegetation dynamics and water stress, as well as investigate seasonal and interannual relationships among all applied indicators.

2. Materials and Methods

2.1. Study Area

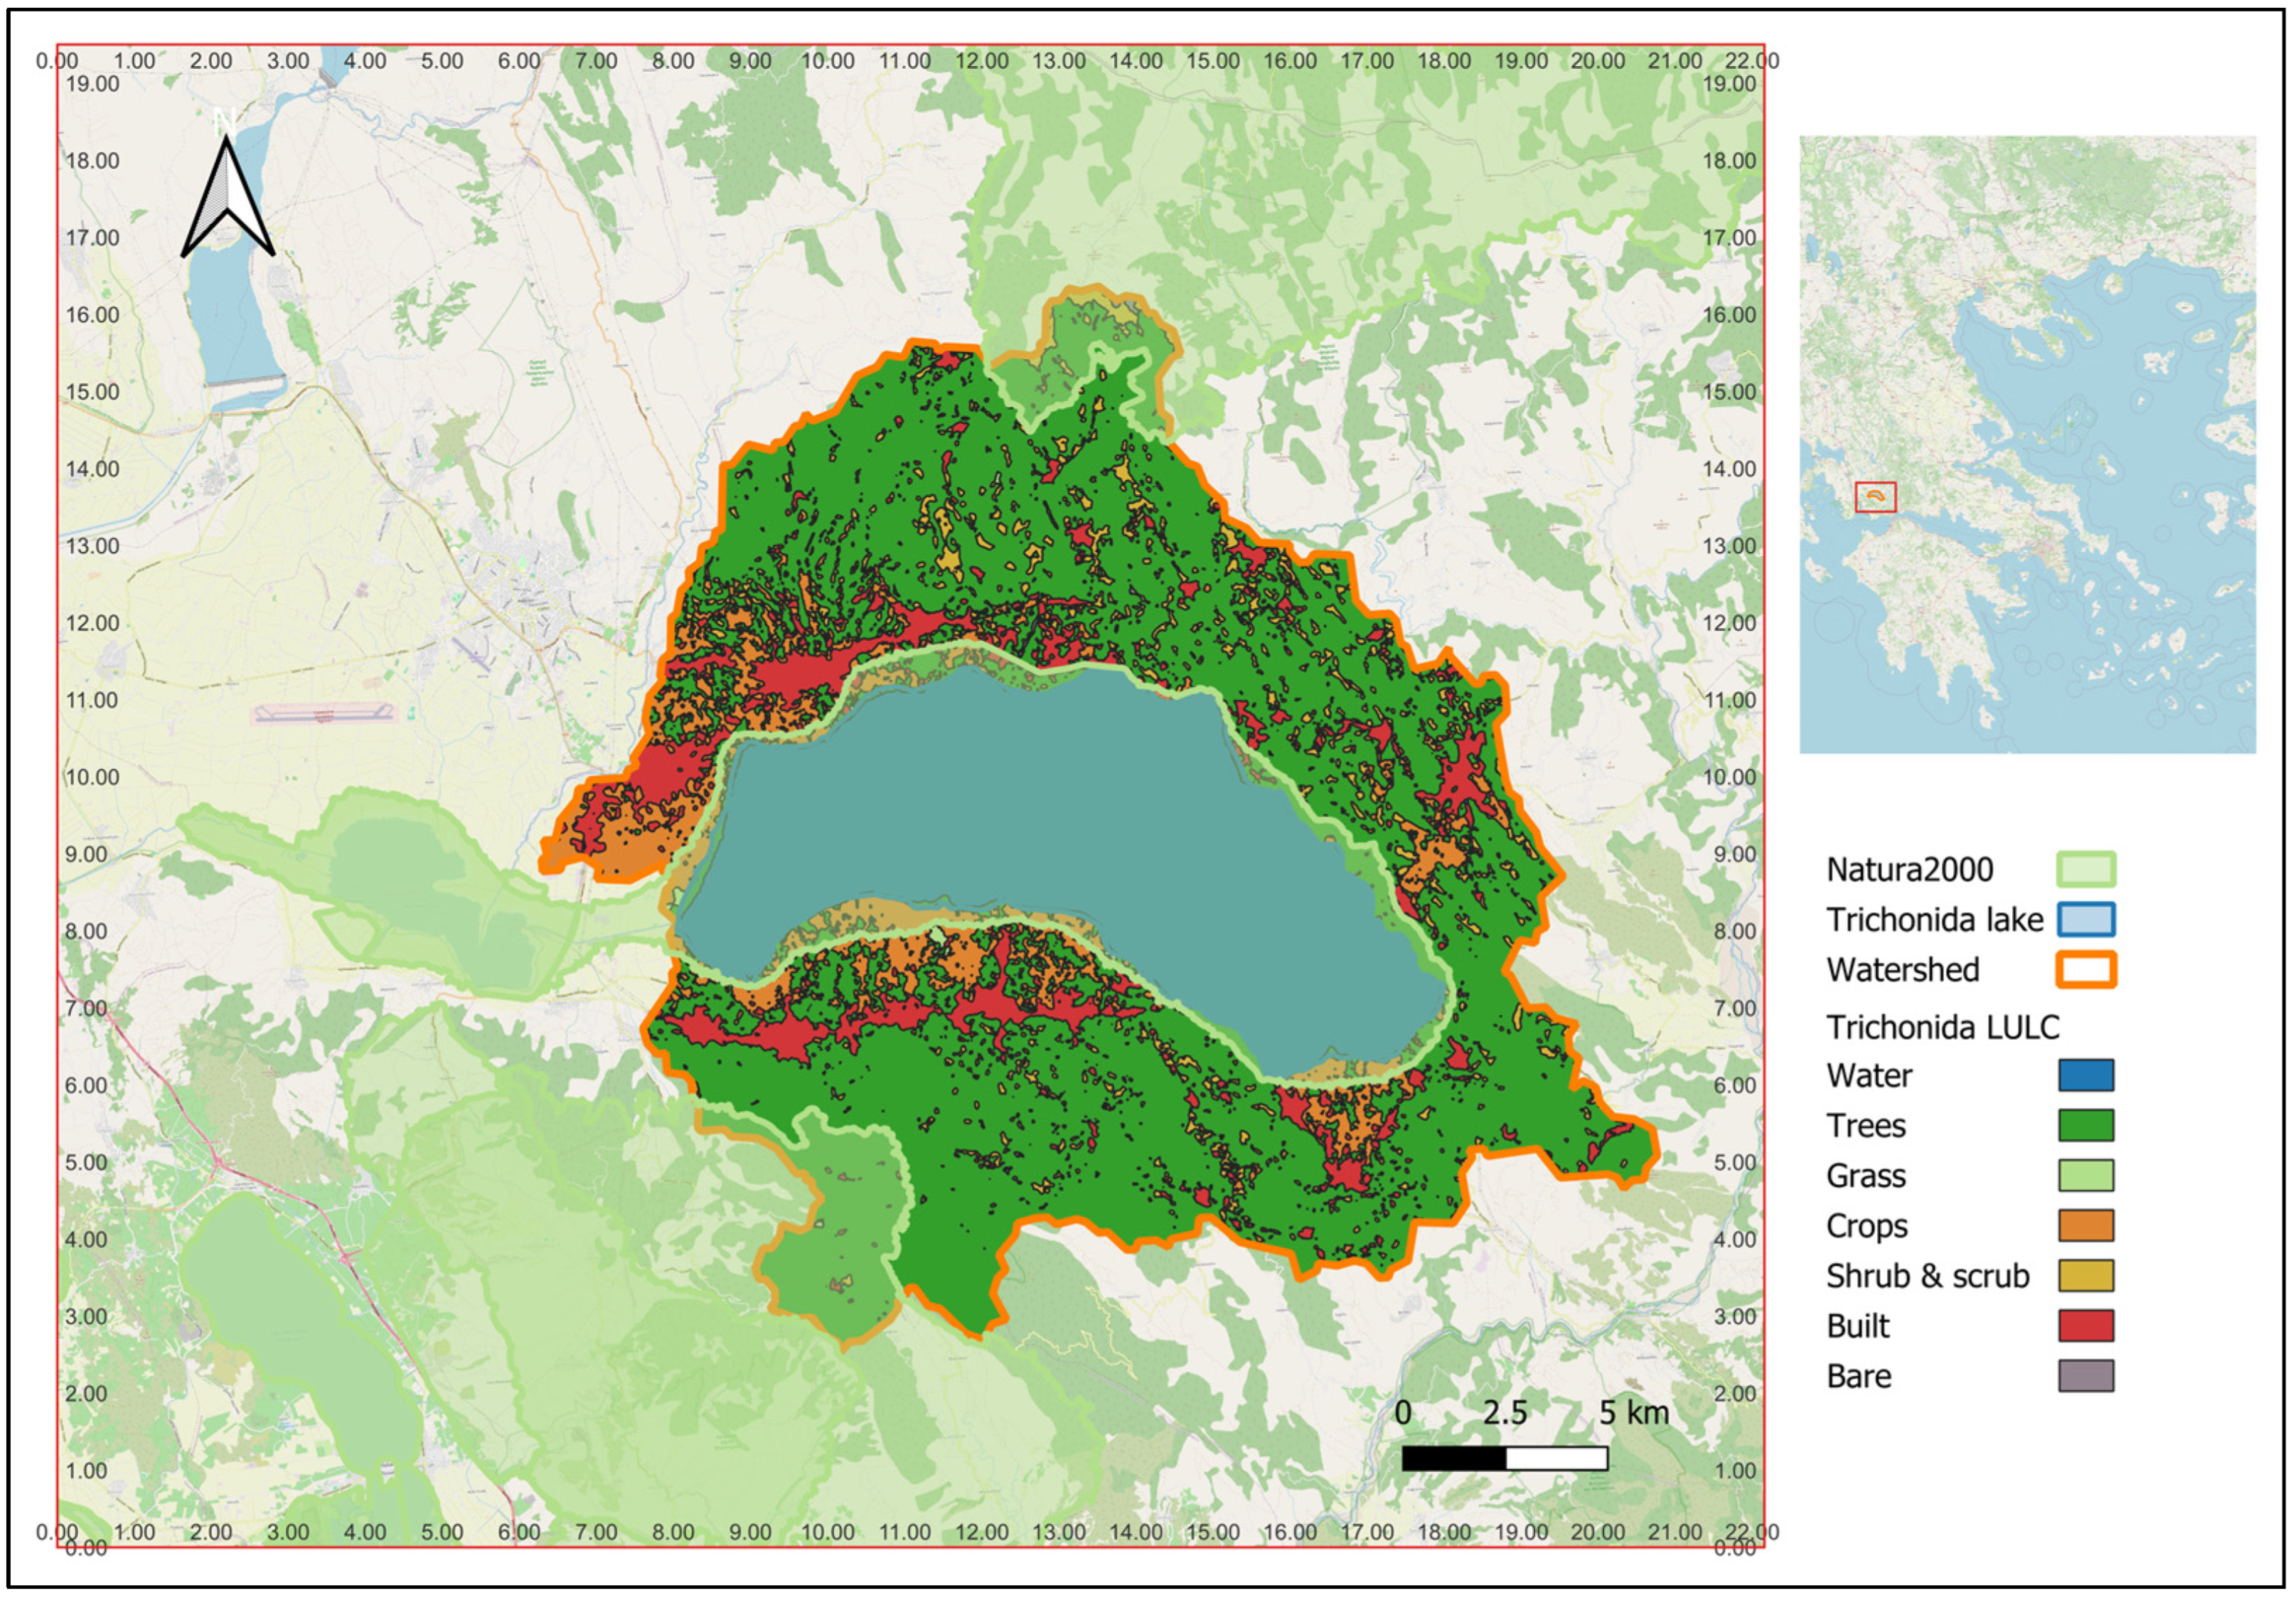
Lake Trichonida, also referred to as Lake Trichonis, is located in the Regional Unit of Aetoloakarnania, in central–western Greece (Figure 1), at an altitude of approximately 16 m above sea level. It is the largest and deepest natural freshwater lake in Greece, extending over a surface area of about 97 km2, with a maximum length of approximately 19 km and a mean width of 6 km [27,29]. The lake has a mean depth of about 30 m and a maximum depth reaching 58 m, while its total water volume is estimated at approximately 2.6 × 10⁹ m3 [26].
Lake Trichonida is located within the Trichonida basin, with a catchment area of approximately 406 km2, characterized by lowland to semi-mountainous terrain [26]. Figure 1 presents the spatial extent of the watershed, the lake boundary, the Natura 2000 protected areas, and the main land-use/land-cover (LULC) classes within the basin.
Lake surface waters account for approximately 23% of the total catchment area. Forested areas dominate the basin (56%), followed by agricultural land (8%), shrub and scrub vegetation (4%), grasslands, and smaller proportions of built-up and bare areas. The distribution of land uses highlights the strong influence of natural and semi-natural ecosystems surrounding the lake, alongside localized agricultural and residential development.
Topographically, the basin is bounded to the north by Mount Panetoliko (1924 m), to the southwest by Mount Arakinthos (<900 m), and to the east by Mount Harama (<700 m) [34]. The lake is hydraulically connected to the adjacent Lake Lysimacheia via a narrow, superficial canal approximately 2.8 km long located at its western margin [27].
Hydrologically, Lake Trichonida is a warm monomictic lake of karstic origin and belongs to the national type of Deep Natural Lakes (GR-DNL) within the Greek National Water Monitoring Network [27,33]. The lake receives inflows from approximately 30 seasonal streams draining the surrounding basin, as well as substantial groundwater inputs supplied by karstic springs [25,35]. Additional inflows originate from a diversion channel connected to the Stratos II hydroelectric reservoir, while a significant volume of water is diverted annually from Lake Trichonida to Lake Lysimacheia [36]. Direct water abstractions primarily serve irrigation and domestic uses. The lake exhibits pronounced seasonal and interannual water-level fluctuations, with reported annual variations of up to 1 m, driven by climatic variability and water management practices [35,37].
The regional climate is classified as Csa according to the Köppen–Geiger system, corresponding to a warm temperate Mediterranean climate with hot, dry summers [27,38]. Mean annual precipitation is approximately 936 mm, while the mean annual air temperature is around 17 °C, exhibiting considerable seasonal variability [25,39]. During the spring and summer months, inflows are limited due to low rainfall, whereas outflows increase substantially to meet agricultural water demands, contributing to the observed water-level declines [39].
The geological setting of the catchment is dominated by highly permeable calcareous formations in the northern and eastern parts, while low-permeability flysch formations prevail in the southern and western sections. Around the lake, Quaternary and Pleistocene alluvial deposits are widespread [30,37]. These geological conditions favor strong surface–groundwater interactions and play a key role in the lake’s hydrological regime.
Lake Trichonida is generally classified as an oligotrophic to oligo-mesotrophic system, despite receiving nutrient inputs from intensive agricultural activities, urban effluents, livestock grazing, and small-scale industrial sources within its catchment [28,29,30,40]. Although oligotrophic conditions have been historically reported, recent studies indicate a gradual tendency toward mesotrophic conditions, reflecting increasing nutrient pressures [27,34]. According to national Water Framework Directive-compliant assessments based on aquatic macrophytes, the lake has maintained a good ecological status during the period of 2013–2021 [27,41].
The lake and its surrounding riparian zone are part of the Natura 2000 network (Figure 1) and constitute a Special Area for Conservation (code GR2310009), owing to their high ecological and research value [29,42]. Of particular importance are the associated riparian wetlands, which include the priority habitat of calcareous fens with Cladium mariscus (EU Habitats Directive 92/43/EEC). These wetlands occupy a narrow lacustrine belt with an average width of approximately 80 m, but their extent has declined markedly over recent decades due to hydrological alterations and land-use pressures [25,30].

2.2. Data Sources and Preprocessing

This study integrates remote sensing vegetation indices, drought indicators, and lake surface water temperature to assess the spatio-temporal dynamics of vegetation condition and water stress in the Trichonida basin. SPEI data were obtained from the global SPEIbase v2.9 dataset [43]. NDVI data were derived from MODIS sensors (National Aeronautics and Space Administration (NASA), Washington, DC, USA) (MOD13Q1 at 250 m) for basin-scale analysis, while higher-resolution NDVI from Landsat 8 Collection 2 Tier 1 and Tier 2 Surface Reflectance product (United States Geological Survey (USGS), Reston, VA, USA) at 30 m spatial resolution was used for land-cover-specific assessments. Evapotranspiration products used for CWSI calculation were derived from MODIS MOD16A2 product (NASA, Washington, DC, USA) at 500 m spatial resolution). Lake surface water temperature was extracted from Landsat 8 and Landsat 9 Collection 2 Level 2 products at 30 m resolution. Monthly time series of the Normalized Difference Vegetation Index (NDVI), Crop Water Stress Index (CWSI), and the Standardized Precipitation Evapotranspiration Index (SPEI) were analyzed over the period of 2000–2023, while lake surface water temperature was analyzed for the period of 2015–2024. Detailed descriptions of each dataset are provided in the following subsections.

2.2.1. Climatic Drought Index (SPEI)

The Standardized Precipitation Evapotranspiration Index (SPEI) was used to quantify meteorological drought severity across the study area. SPEI combines precipitation and potential evapotranspiration anomalies into a standardized multi-scalar drought index [10]. It is based on the climatic water balance (precipitation—PET) and is therefore sensitive to changes in both rainfall deficits and atmospheric evaporative demand, particularly in arid, semi-arid, and Mediterranean regions [44]. Monthly SPEI values were calculated at 1-, 3-, 6-, 9-, and 12-month accumulation periods to capture short- to long-term drought conditions, using the global SPEIbase dataset (v2.9), which provides multiscale Standardized Precipitation Evapotranspiration Index values derived from gridded climate data [43]. The selected accumulation periods allow differentiation between short-term moisture deficits affecting vegetation water stress and longer-term hydrological drought conditions influencing ecosystem functioning. Due to the relatively coarse spatial resolution of the SPEIbase dataset (~0.5°, ~50 km), which is primarily designed for regional-scale applications, a single basin-scale SPEI series was considered representative of the dominant hydroclimatic forcing across the study area.

2.2.2. Remote Sensing Vegetation Index (NDVI)

Vegetation dynamics were assessed using the Normalized Difference Vegetation Index (NDVI), a widely used spectral indicator of vegetation greenness [14]. NDVI data were obtained from the Terra Moderate Resolution Imaging Spectroradiometer (MODIS) Vegetation Indices (MOD13Q1) (NASA, Washington, DC, USA), at 16-day composite product at 250 m spatial resolution [45]. Monthly NDVI time series were produced by averaging all valid observations within each month after removing cloudy or low-quality pixels based on the MODIS quality assurance layers.
To assess ecosystem-specific vegetation dynamics, NDVI was additionally derived from Landsat imagery (30 m spatial resolution) for the period of 2013–2025. Mean monthly NDVI values were extracted for agricultural areas, Cladium mariscus fens, and surrounding forested areas. These data were used for subsequent trend and correlation analyses. To verify the robustness of Landsat-derived NDVI patterns, Sentinel-2 imagery (10 m spatial resolution) was further extracted for the overlapping period of 2017–2025. The Sentinel-2 time series was used for comparison of seasonal dynamics within calcareous fens.

2.2.3. Crop Water Stress Index (CWSI)

Vegetation water stress, which refers to the physiological response of plants to insufficient water availability caused by precipitation deficits and increased evaporative demand, was evaluated using the Crop Water Stress Index (CWSI), a widely used indicator developed by [21,46]. CWSI was derived from the evapotranspiration-based formulation using the MODIS MOD16A2 evapotranspiration product (NASA, Washington, DC, USA), which provides 8-day composite estimates of ET and PET at 500 m resolution [47,48]. Monthly actual evapotranspiration (ET) and potential evapotranspiration (PET) were extracted and aggregated into monthly means.
CWSI was then calculated as
C W S I = 1 E T P E T
Values close to 0 indicate low water stress, while values approaching 1 reflect severe water stress. In heterogeneous landscapes, ET/PET-based formulations may reflect not only short-term water availability but also differences in vegetation structure and hydrological functioning across land-cover types [49]. Accordingly, the index is considered here as a basin-scale integrated indicator of vegetation water stress integrating both climatic forcing and ecosystem-specific characteristics.

2.2.4. Lake Surface Water Temperature

Lake surface water temperature was analyzed to examine its influence on land-cover-specific vegetation dynamics and vegetation water stress. Temperature data were obtained from the Landsat 8 and Landsat 9 Collection 2, Level 2, Tier 1 surface reflectance products (LANDSAT/LC08/C02/T1_L2 and LANDSAT/LC09/C02/T1_L2) for the period of 2015–2024. Images were corrected, and cloud-affected pixels were removed. The monthly mean lake surface temperature was computed and used for trend and correlation analysis.

2.3. Statistical Analysis

2.3.1. Trend Analysis

Long-term trends were evaluated using the Mann–Kendall test (MK) [50,51] to assess the presence of monotonic trends in NDVI, land-cover-specific NDVI, CWSI, SPEI, and lake temperature, and the Sen’s slope estimator [52] to quantify the magnitude of the detected trends. The Mann–Kendall test is non-parametric, assumes monotonic trends, and is robust to non-normality and outliers, making it well-suited for hydroclimatic and ecological time series with high interannual variability. However, the presence of temporal autocorrelation in the time series may influence the significance of detected trends and should be considered when interpreting the results. Sen’s slope estimator provides a robust measure of trend magnitude that is resistant to outliers. Both analyses were performed using the Kendall and trend packages in R (version 4.3.2).

2.3.2. Correlation Analysis

Pearson correlation coefficients were computed to examine how vegetation greenness and stress indicators respond to climatic variability, by assessing the relationships between overall NDVI and SPEI, CWSI and SPEI, NDVI and CWSI, as well as the links between lake surface temperature and land-cover-specific NDVI and CWSI. Additionally, to investigate intra-annual climatic and ecological dynamics, correlations were computed for winter, spring, summer, and autumn, allowing to identify season specific drought impacts on vegetation activity and water stress. It should be noted that the analyses were performed using non-deseasonalized time series; therefore, the reported correlations may reflect shared seasonal variability in addition to interannual hydroclimatic relationships.

2.3.3. Software Environment

All data processing, statistical analyses, and visualization were carried out using standard R packages, while remote sensing data were processed and extracted using Google Earth Engine (Google LLC, Mountain View, CA, USA) [53].

3. Results

3.1. Temporal Variability of Drought Conditions Based on SPEI

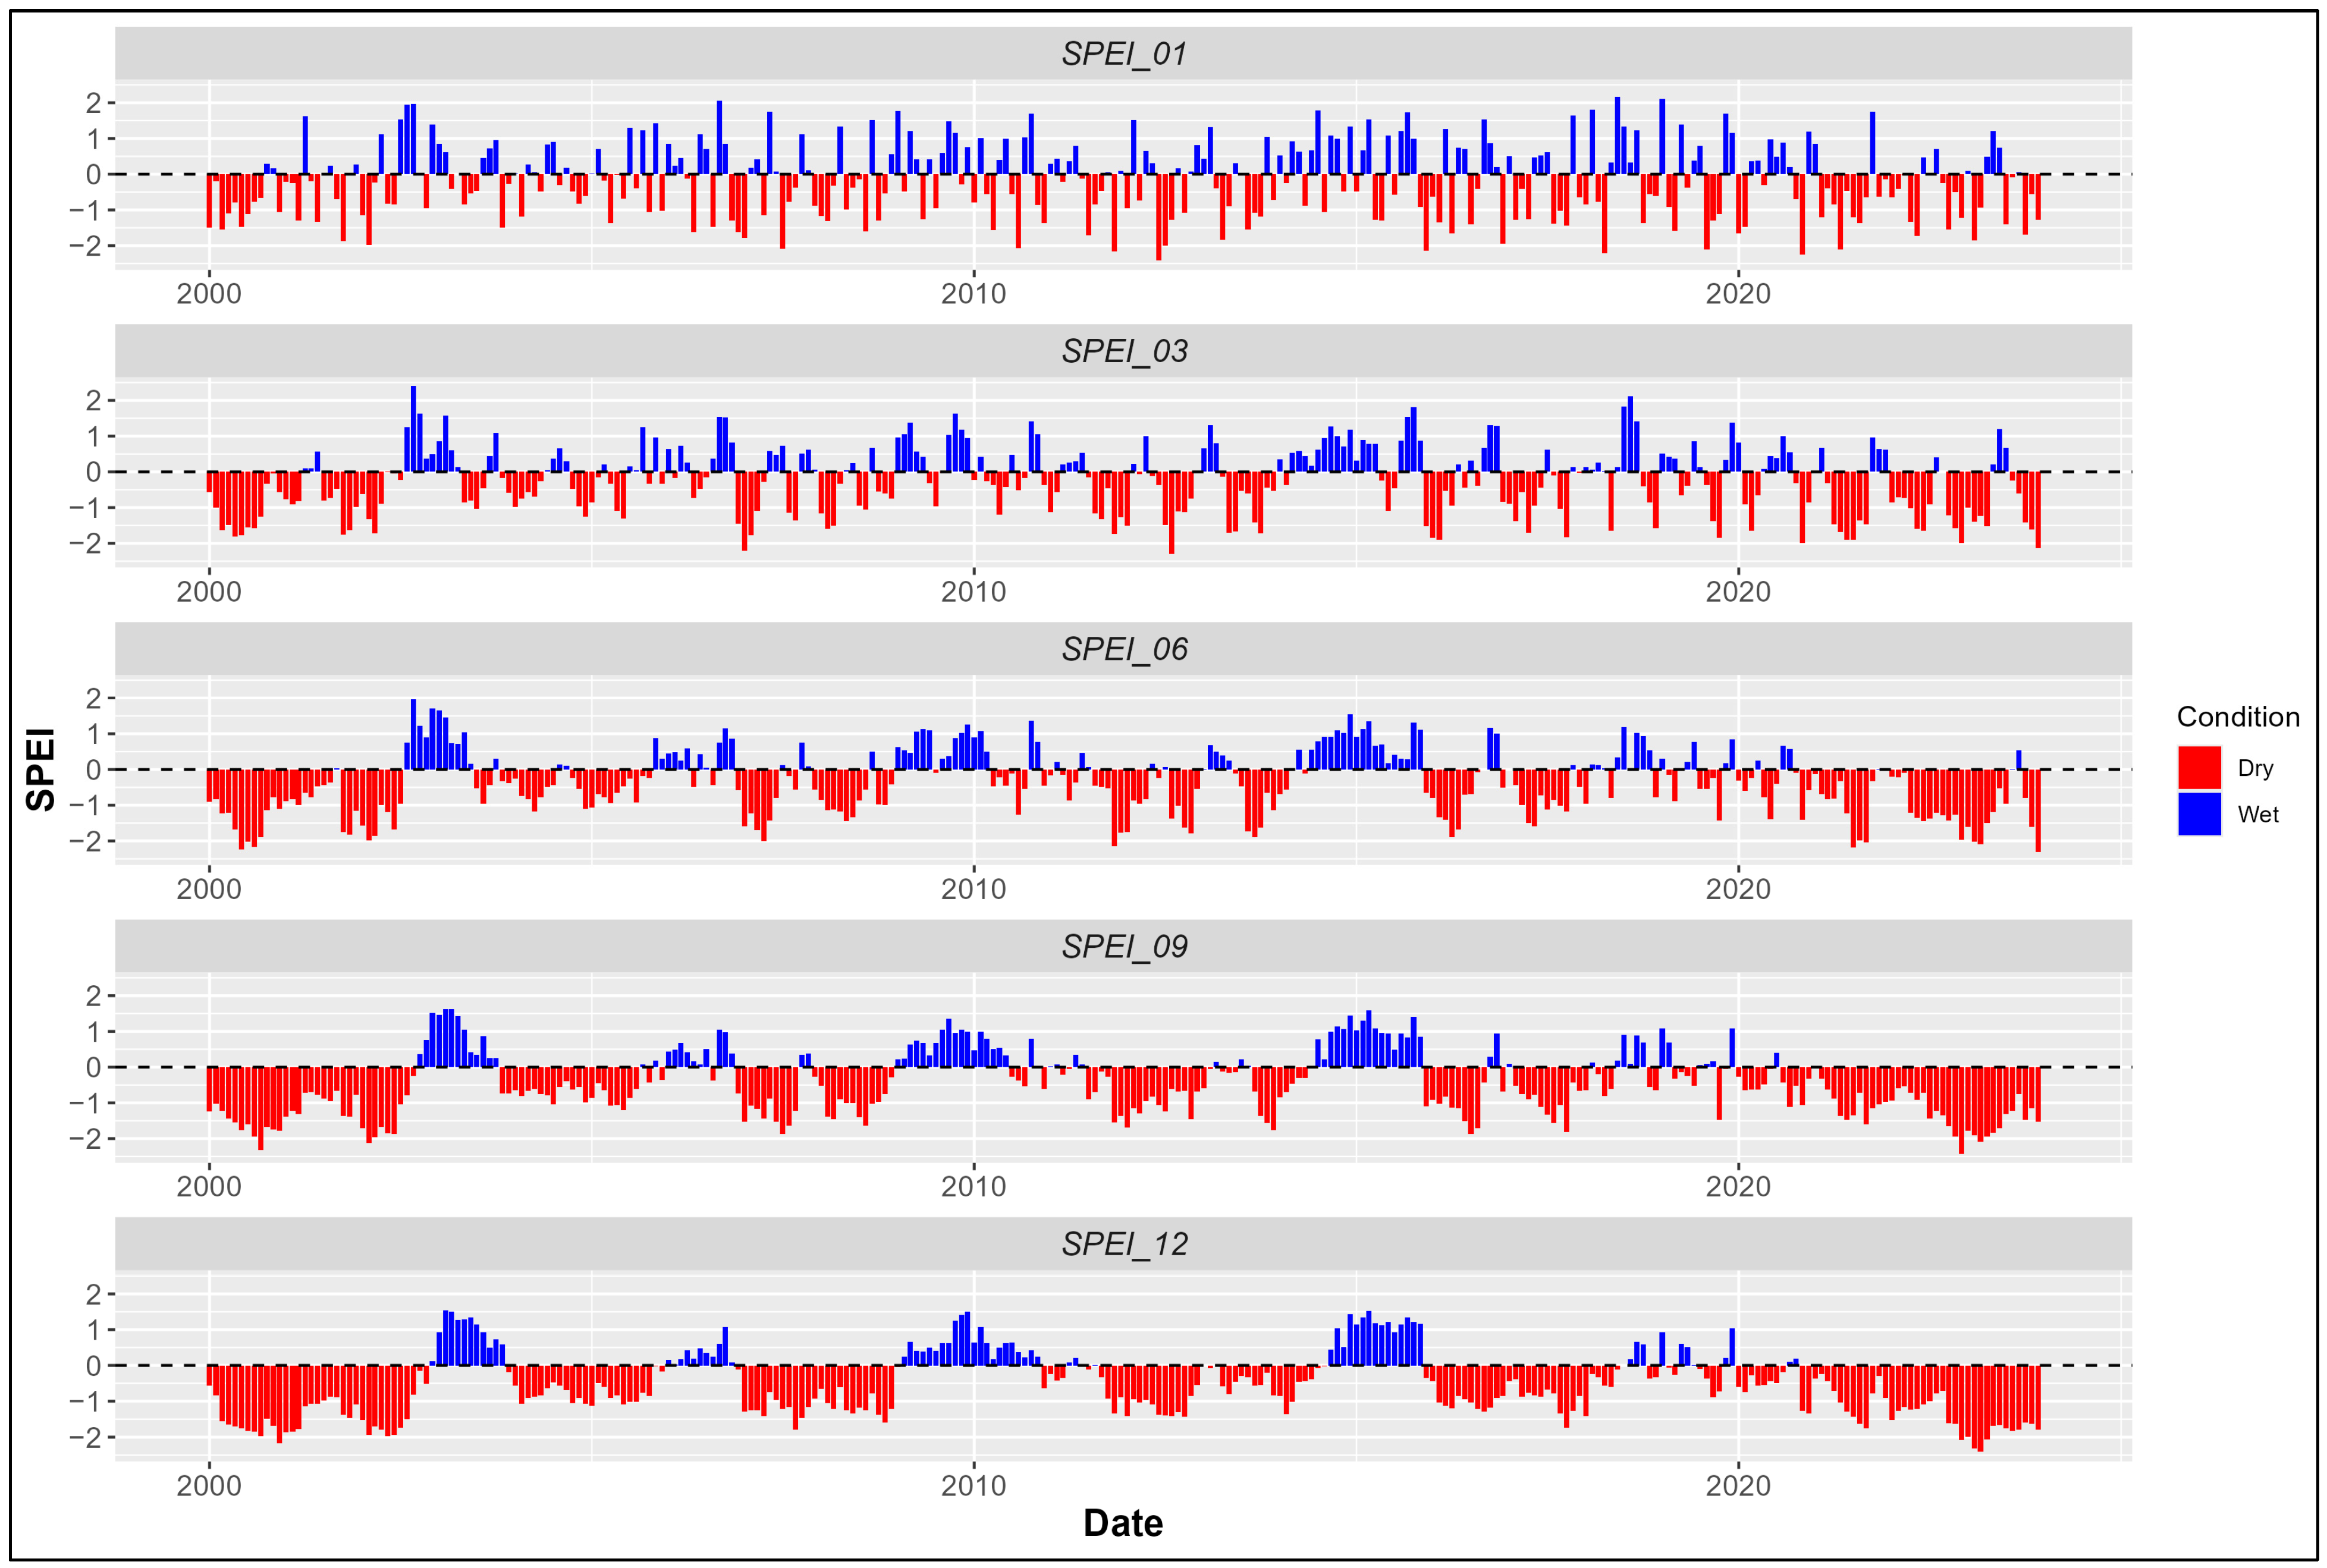
Figure 2 illustrates the temporal evolution of drought conditions derived from the SPEI at multiple time scales (1, 3, 6, 9, and 12 months). Overall, the SPEI time series reveals alternating wet and dry conditions, indicating high hydroclimatic variability throughout the study period.
At short time scales (SPEI-1 and SPEI-3), the index shows pronounced fluctuations, reflecting rapid responses to short-term meteorological conditions. Severe drought events are becoming more frequent after 2015, with sharp transitions between wet and dry conditions.
At intermediate time scales (SPEI-6 and SPEI-9), drought events display greater temporal persistence, characterized by prolonged dry periods, particularly after 2010, indicating the development of seasonal-scale drought conditions.
At the longest time scale (SPEI-12), the most recent decade is dominated by persistent negative SPEI values compared to earlier periods, during which wet conditions were more frequent. SPEI-12 highlights the occurrence of extended drought periods with limited recovery, suggesting a shift towards prolonged hydrological drought conditions.
The Mann–Kendall test applied to the SPEI time series revealed no statistically significant long-term trend across all the time scales. For example, SPEI-12 indicated a non- significant trend (Z = −0.15, p = 0.88), while Sen’s slope values close to zero further confirmed the absence of a meaningful long-term trend in drought conditions.

3.2. Temporal Dynamics and Trend Analysis of Vegetation Activity (NDVI)

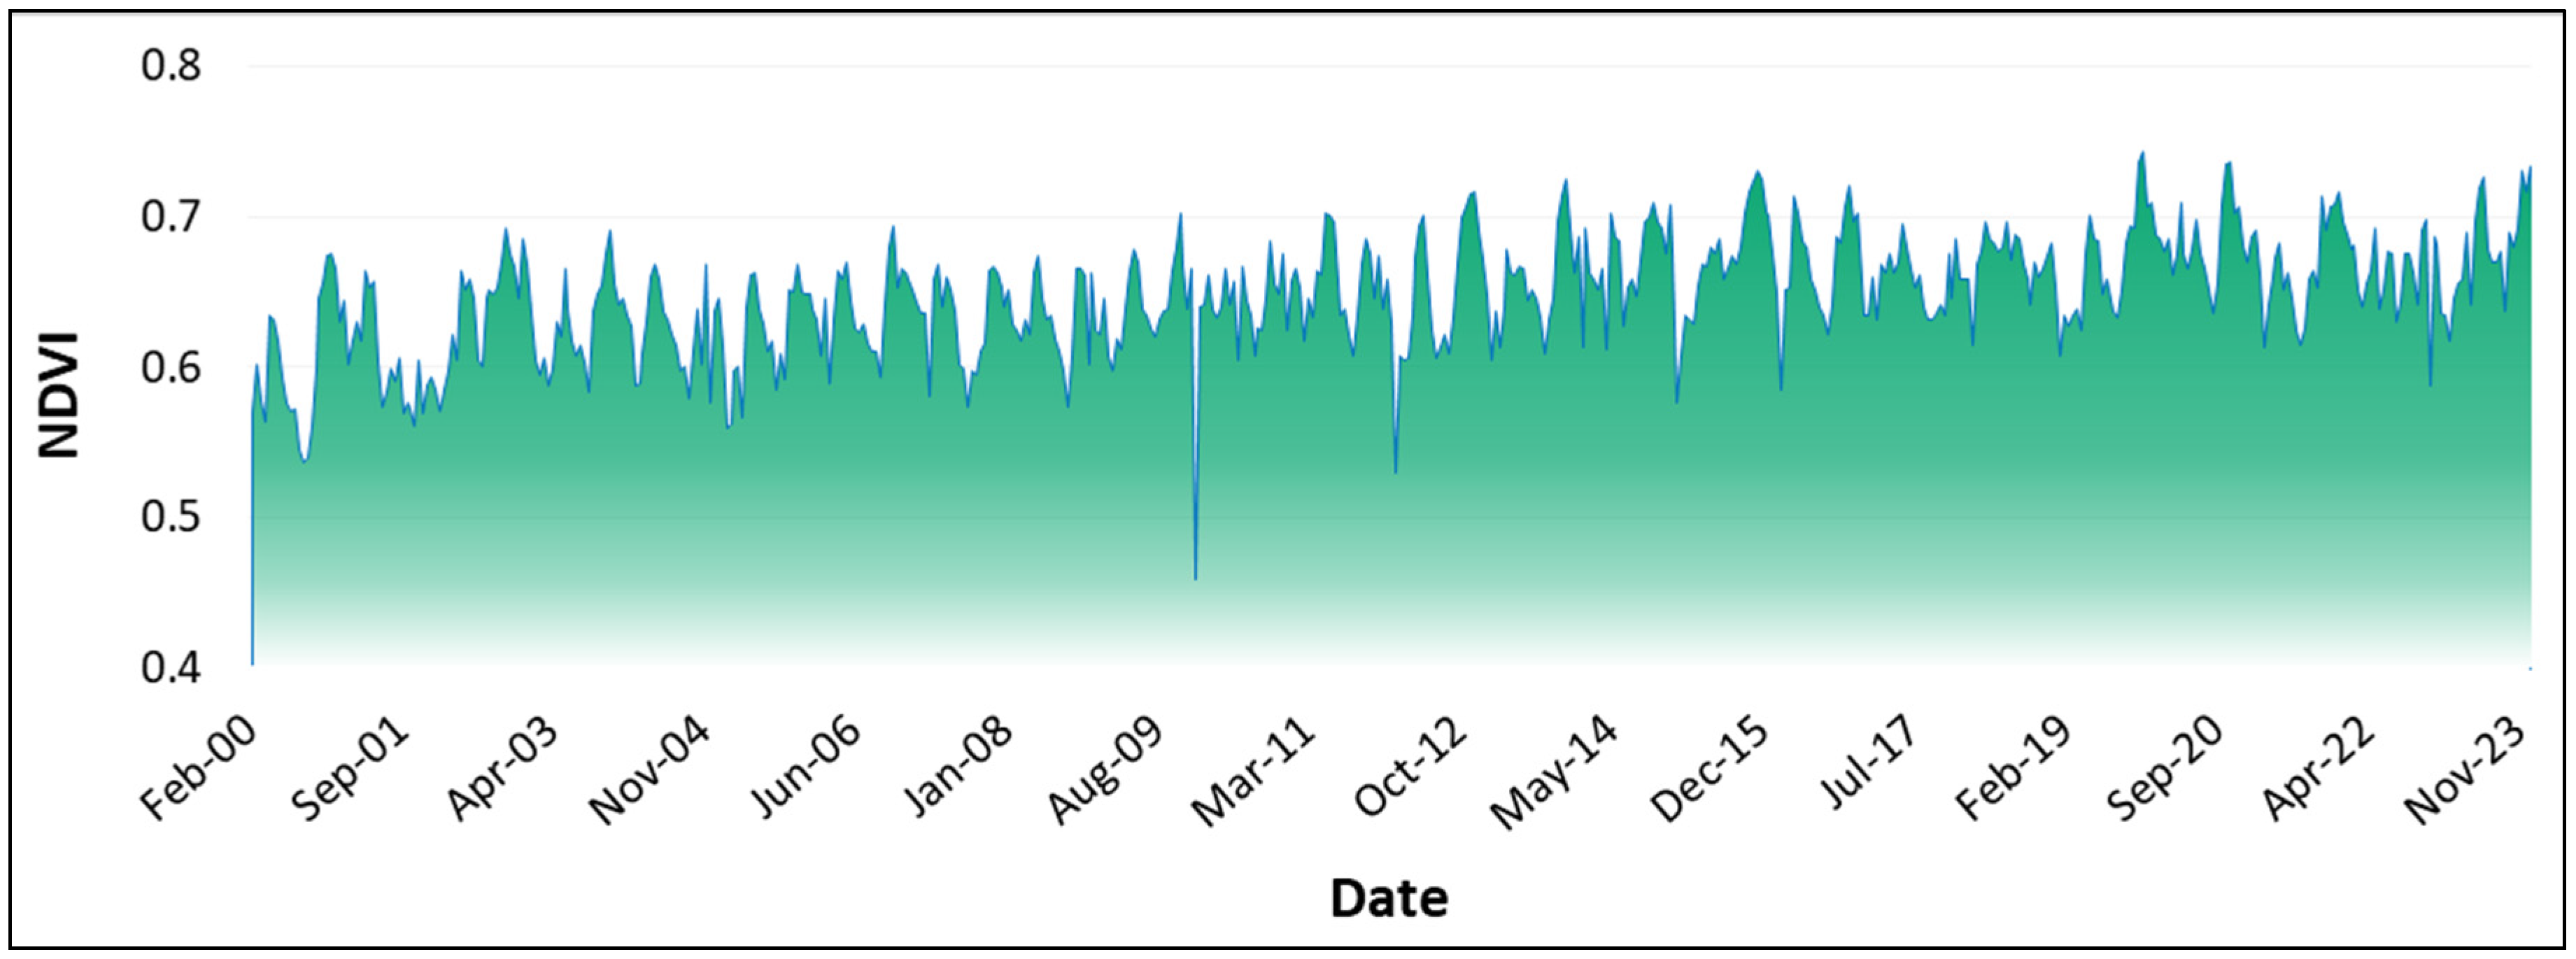
The NDVI time series (Figure 3) shows a pronounced seasonal pattern, with consistently high values throughout the study period, indicating generally favorable vegetation conditions across the basin. However, a marked decline is observed during 2009–2011 and in several years after 2018, coinciding with major drought years identified by the SPEI analysis.
Overall, an upward trend is observed, suggesting a gradual increase in vegetation greenness over time. This positive evolution is confirmed by the Mann–Kendall test analysis, which indicated a highly significant increasing trend (Z = +9.95, p < 0.001). The positive Sen’s slope (0.000243) further indicates a sustained enhancement of vegetation activity over time.
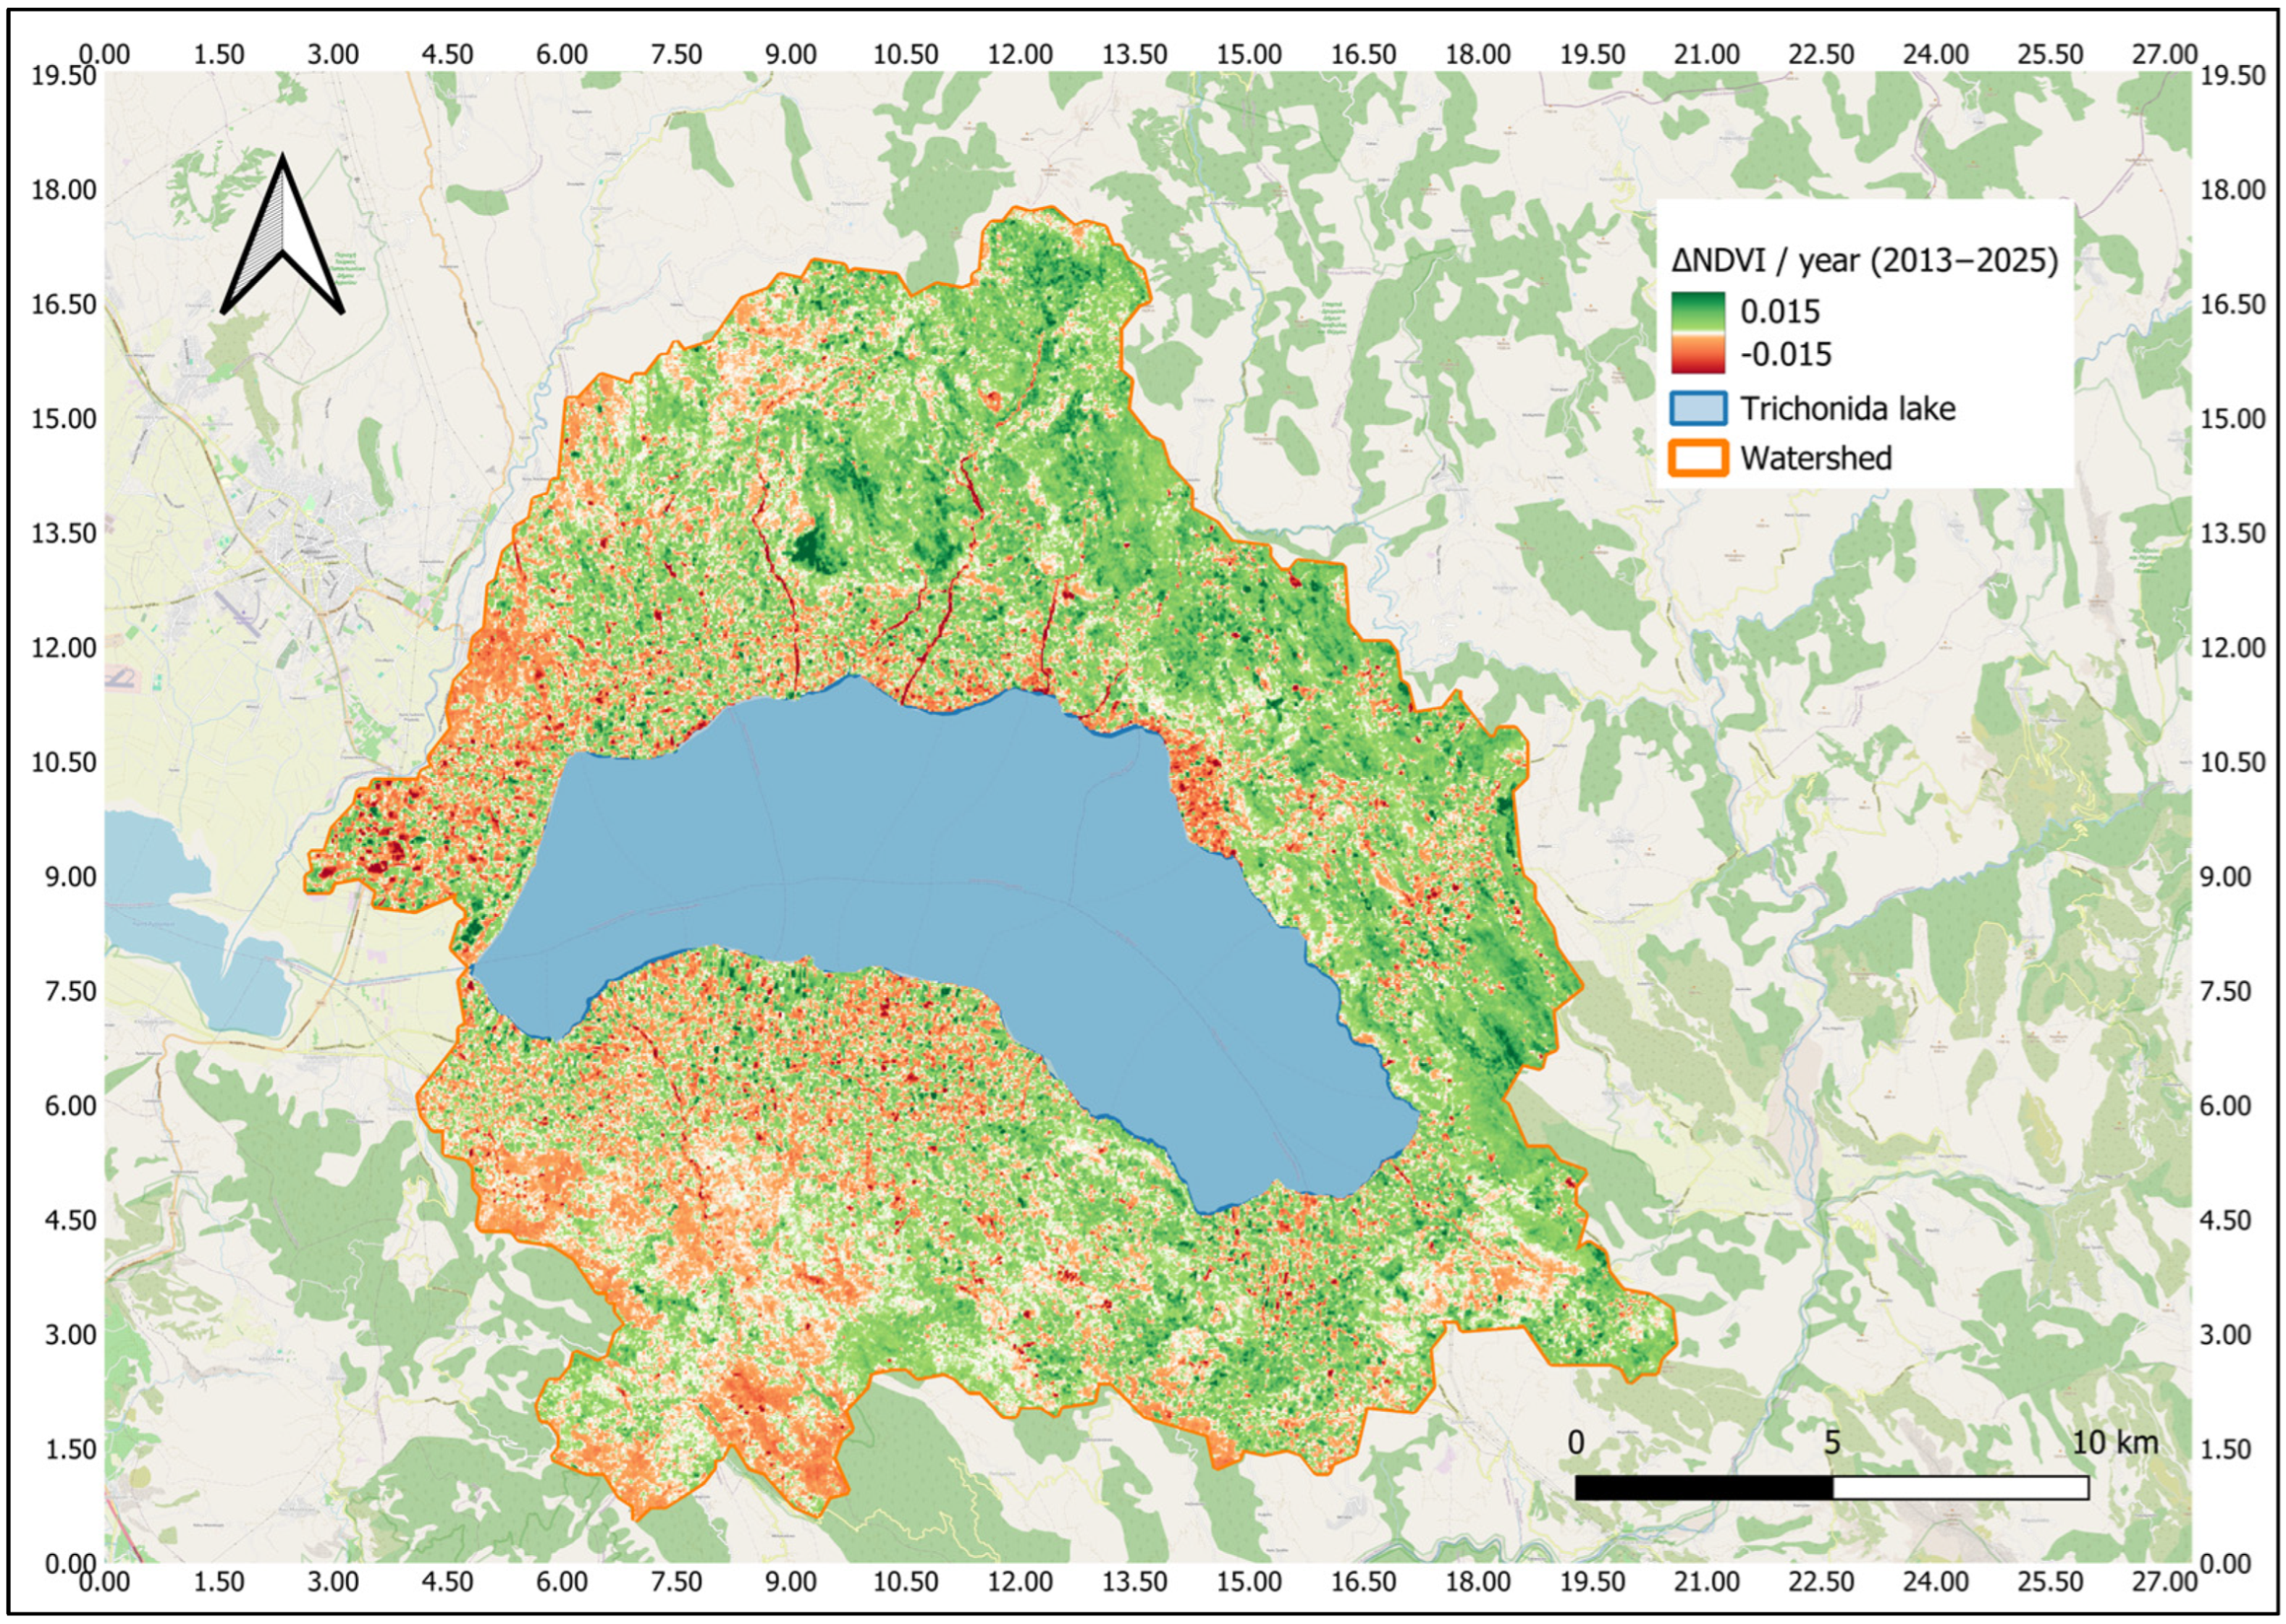
To further examine the spatial distribution of vegetation changes across the basin, a pixel-based NDVI trend analysis was conducted using Landsat imagery for the period of 2013–2025. The magnitude of the trend was estimated for each pixel using the Theil–Sen slope estimator, and statistical significance was determined using the Mann–Kendall test. The generated spatial trend map (Figure 4) highlights the areas exhibiting increasing or decreasing NDVI values during the study period. The results revealed that almost none of the pixels exhibited a strictly monotonic, statistically significant trend (p < 0.05) over this 13-year period.

3.2.1. Land-Cover-Specific NDVI Dynamics

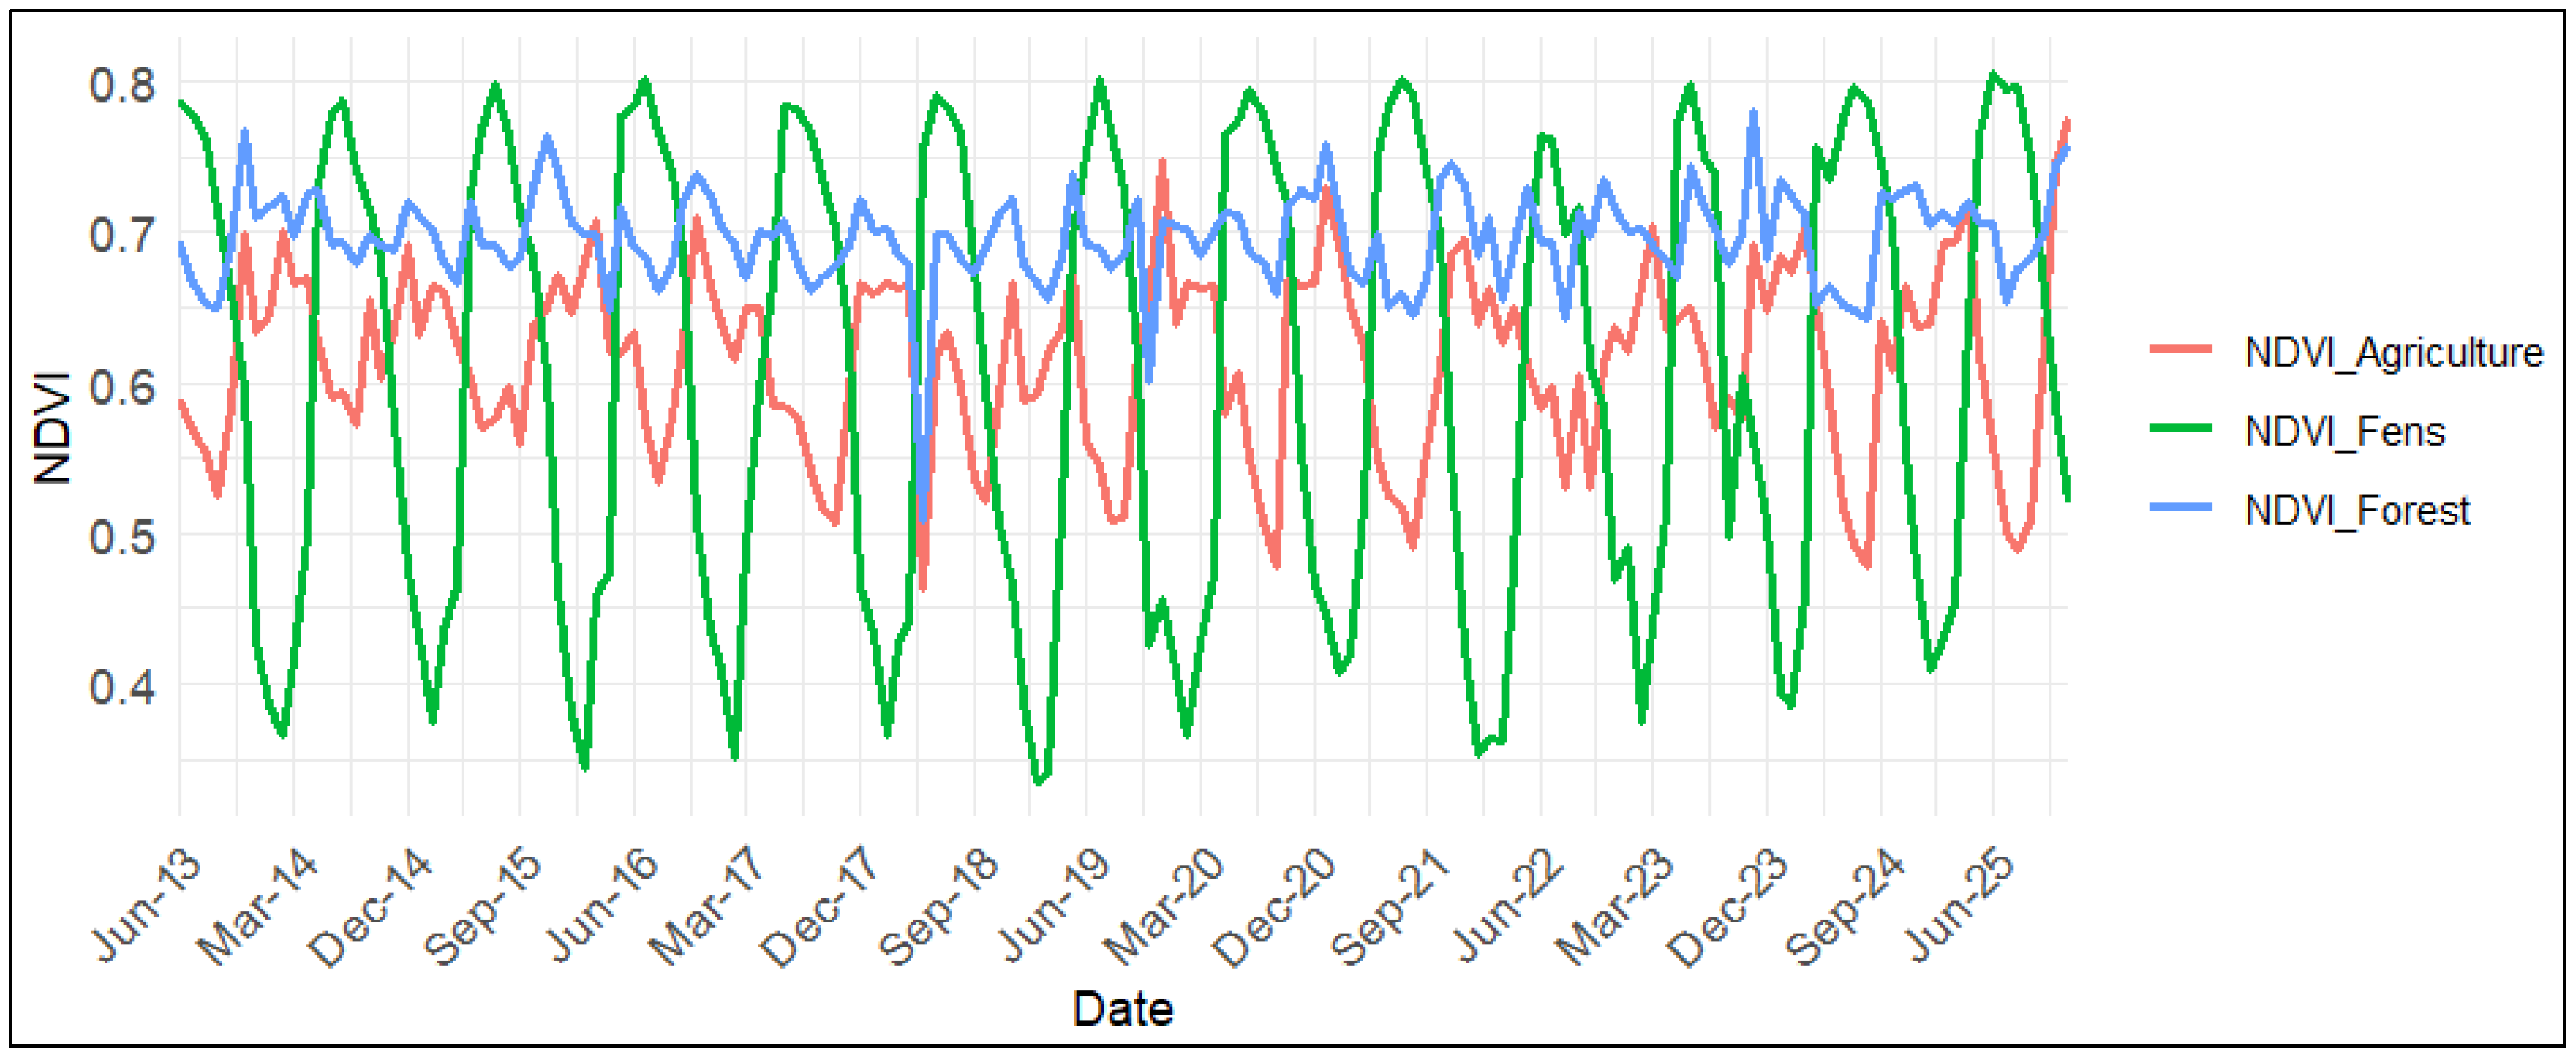
The Land-Cover-Specific NDVI time series (Figure 5) shows a clear seasonal pattern, with peak greenness during the growing season and reduced values in winter. Fens showed the most pronounced fluctuations, with NDVI values ranging from approximately 0.35 to 0.80. Agricultural areas showed moderate seasonal variation, with some occasional sharp declines. Forest areas displayed maintained high NDVI values with smaller seasonal amplitude.
The Mann–Kendall test revealed no statistically significant trends in NDVI for agriculture (p = 0.738), fens (p = 0.678), or forest (p = 0.454), indicating overall stability in vegetation greenness across all land-cover types during the study period.

3.2.2. Influence of Lake Surface Water Temperature on Land-Cover NDVI

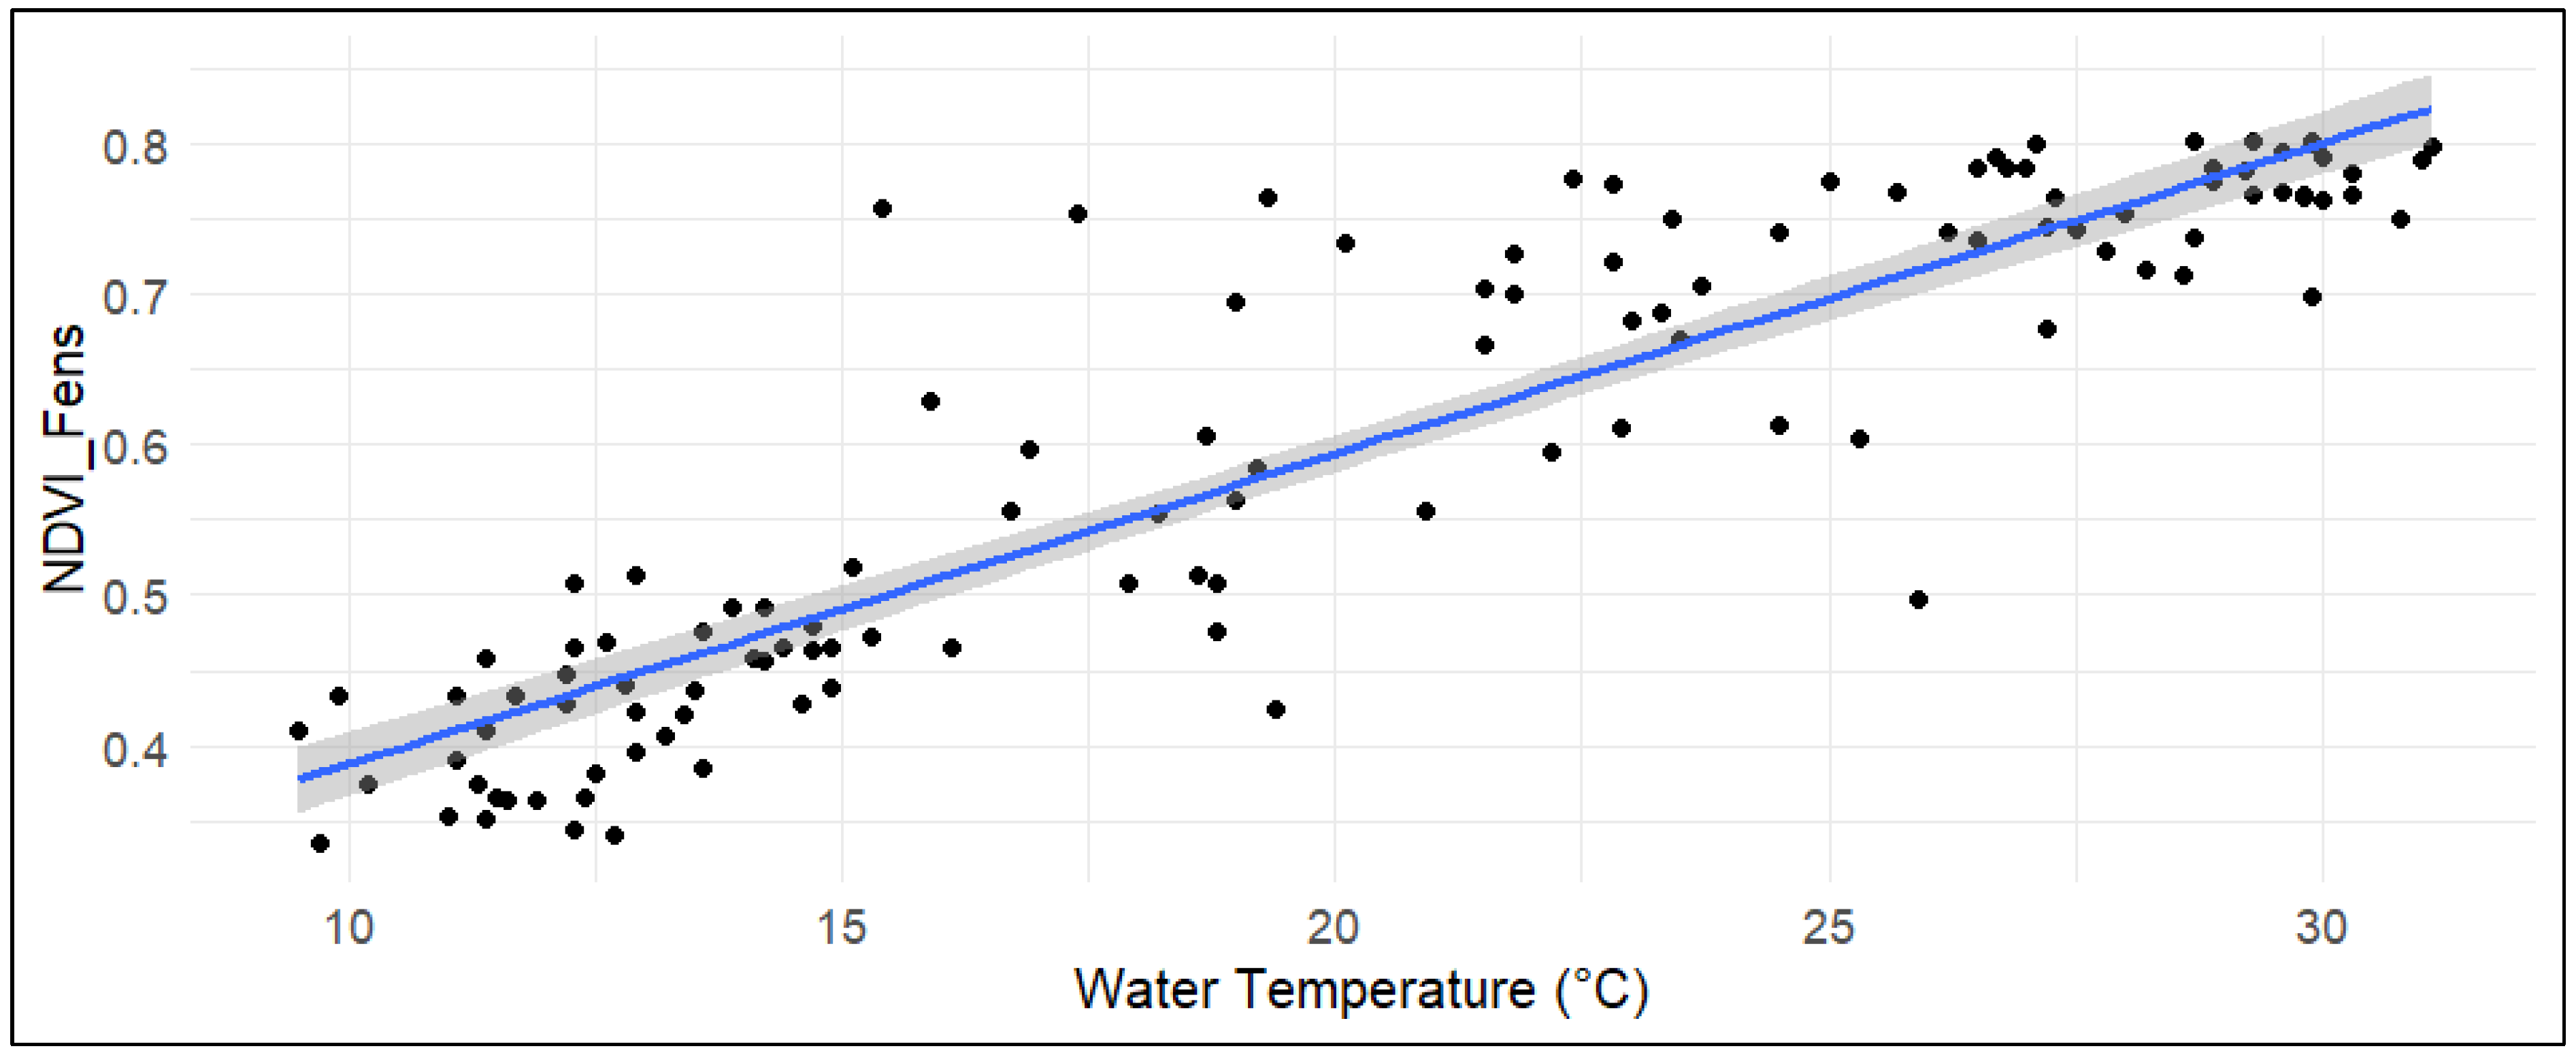
Correlation analysis revealed different responses among land-cover types to lake surface water temperature. Fen NDVI exhibited a strong positive correlation with water temperature (r = 0.905, p < 0.001), reflecting the synchronized seasonal evolution of vegetation activity and lake thermal conditions (Figure 6). In contrast, agricultural NDVI showed a significant negative correlation (r = −0.688, p < 0.001). Forest NDVI exhibited a weak negative correlation (r = −0.192, p = 0.036).
These results highlight different ecological responses to thermal variability among land-cover types at the annual scale.
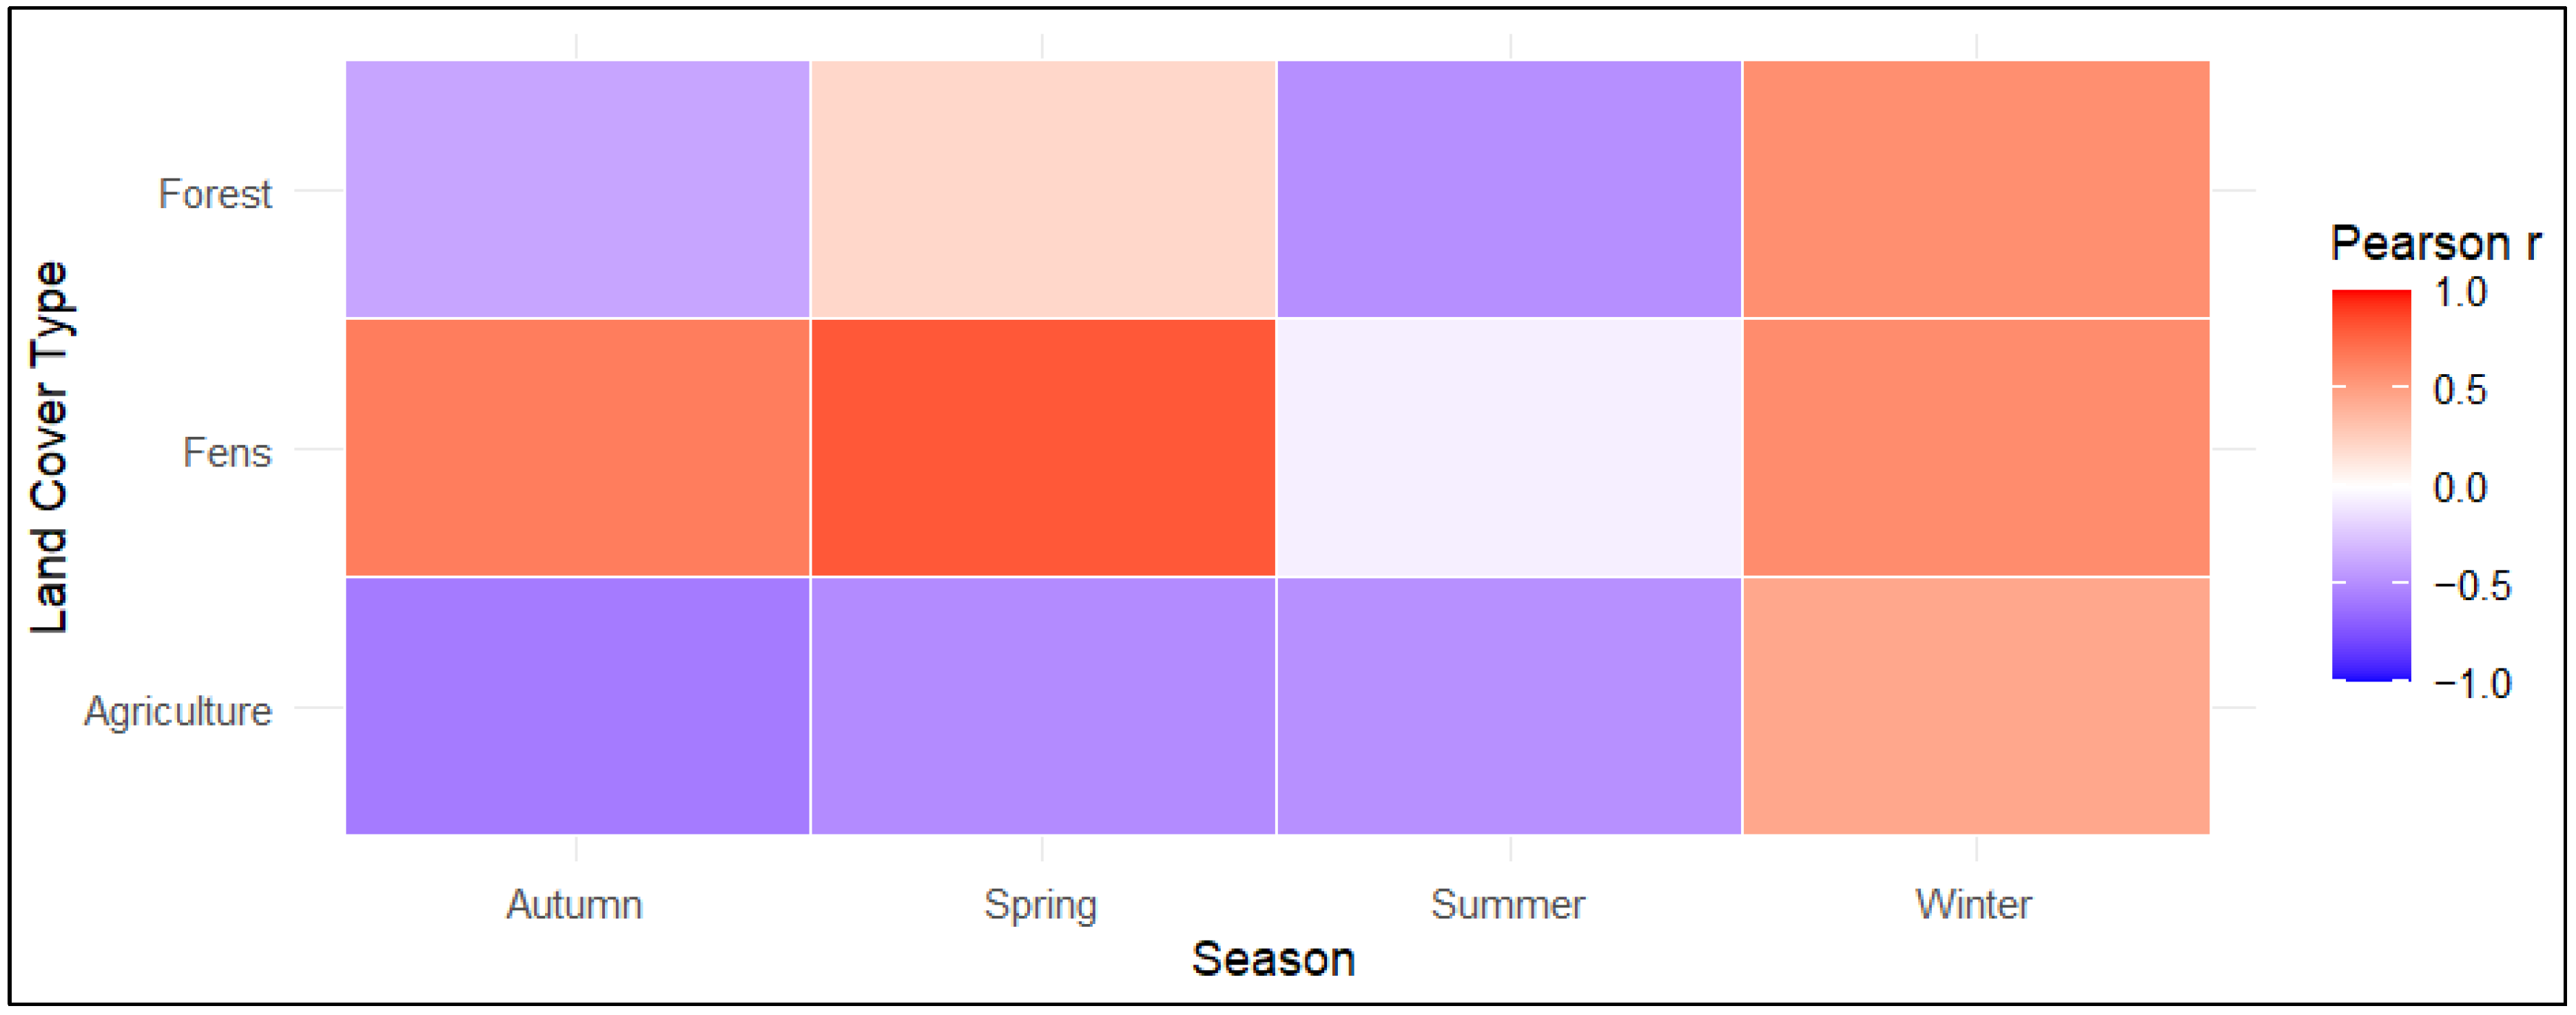
Seasonal correlation analysis (Figure 7) showed that these relationships are not uniform throughout the year. Fen NDVI demonstrated positive correlations during spring (r = 0.812, p < 0.001), autumn (r = 0.654, p < 0.001), and winter (r = 0.587, p < 0.001), whereas agricultural NDVI showed negative correlations during the growing season (spring and summer) but a positive correlation in winter. Forest NDVI exhibited a negative response during summer (r = −0.485, p < 0.01) and a positive correlation in winter (r = 0.574, p < 0.001).

3.3. Temporal Variability and Trend Analysis of Water Stress (CWSI)

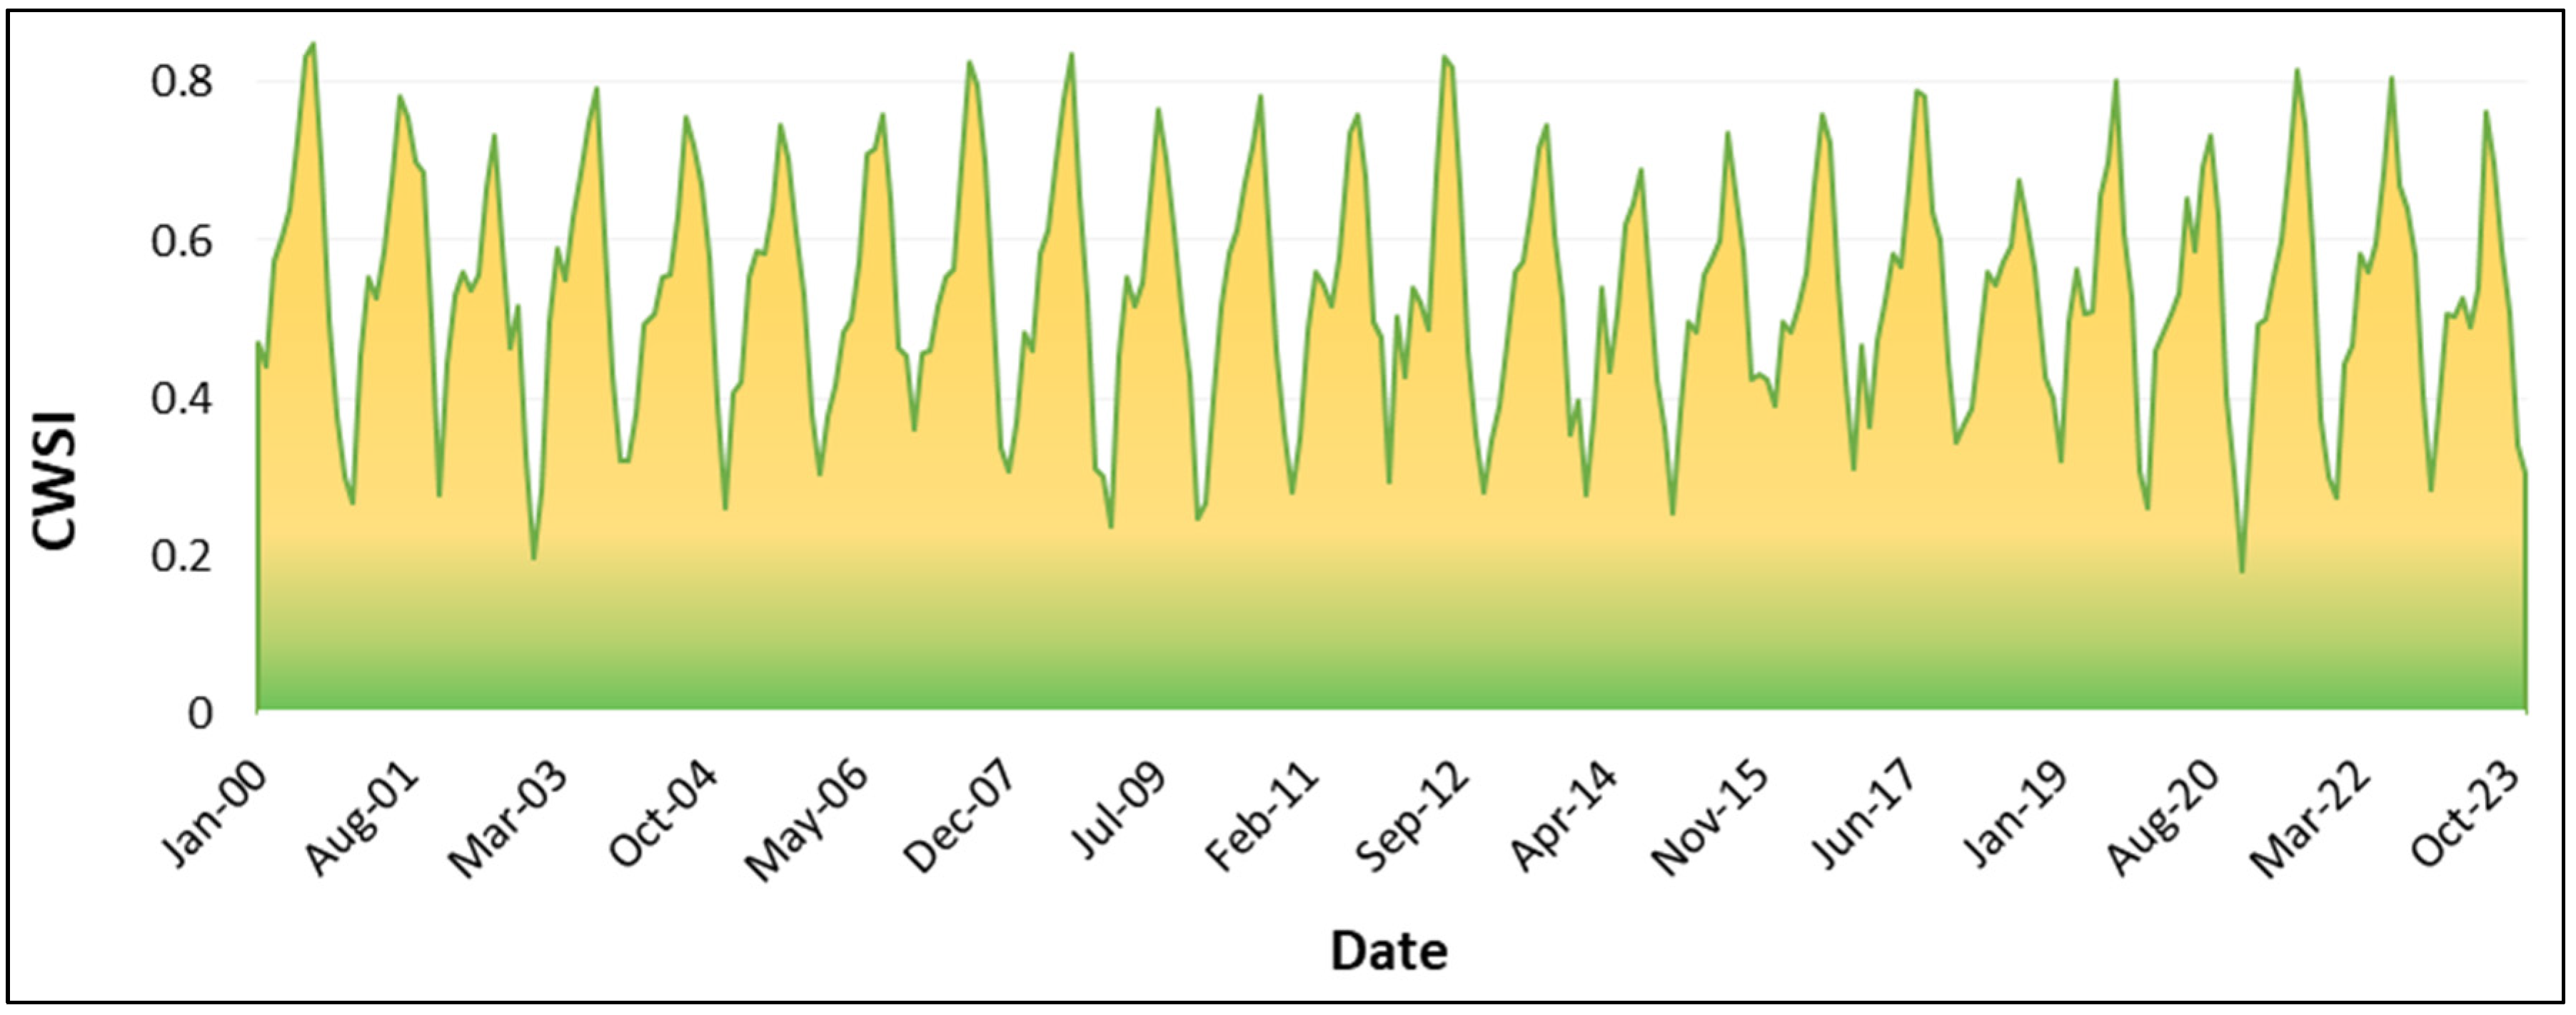
The temporal evolution of monthly mean CWSI reveals a marked seasonal variability, with values ranging between 0.18 and 0.88 (Figure 8). High CWSI values occur during late spring and summer periods, with peaks exceeding 0.8, indicating severe vegetation water stress. In contrast, lower values are generally observed during winter and early spring, indicating a low vegetation water stress.
To assess whether vegetation water stress has increased during the most critical period of the year, a seasonal trend analysis was performed for summer (June–August). The Mann–Kendall test revealed no statistically significant trend (Z = −0.58, p = 0.56). Sen’s slope estimator indicated a very weak negative tendency (−0.000109). These results suggest that although crops in the study area experience consistently high water stress during summer, no significant long-term increase or decrease in summer water stress is detected over the study period.
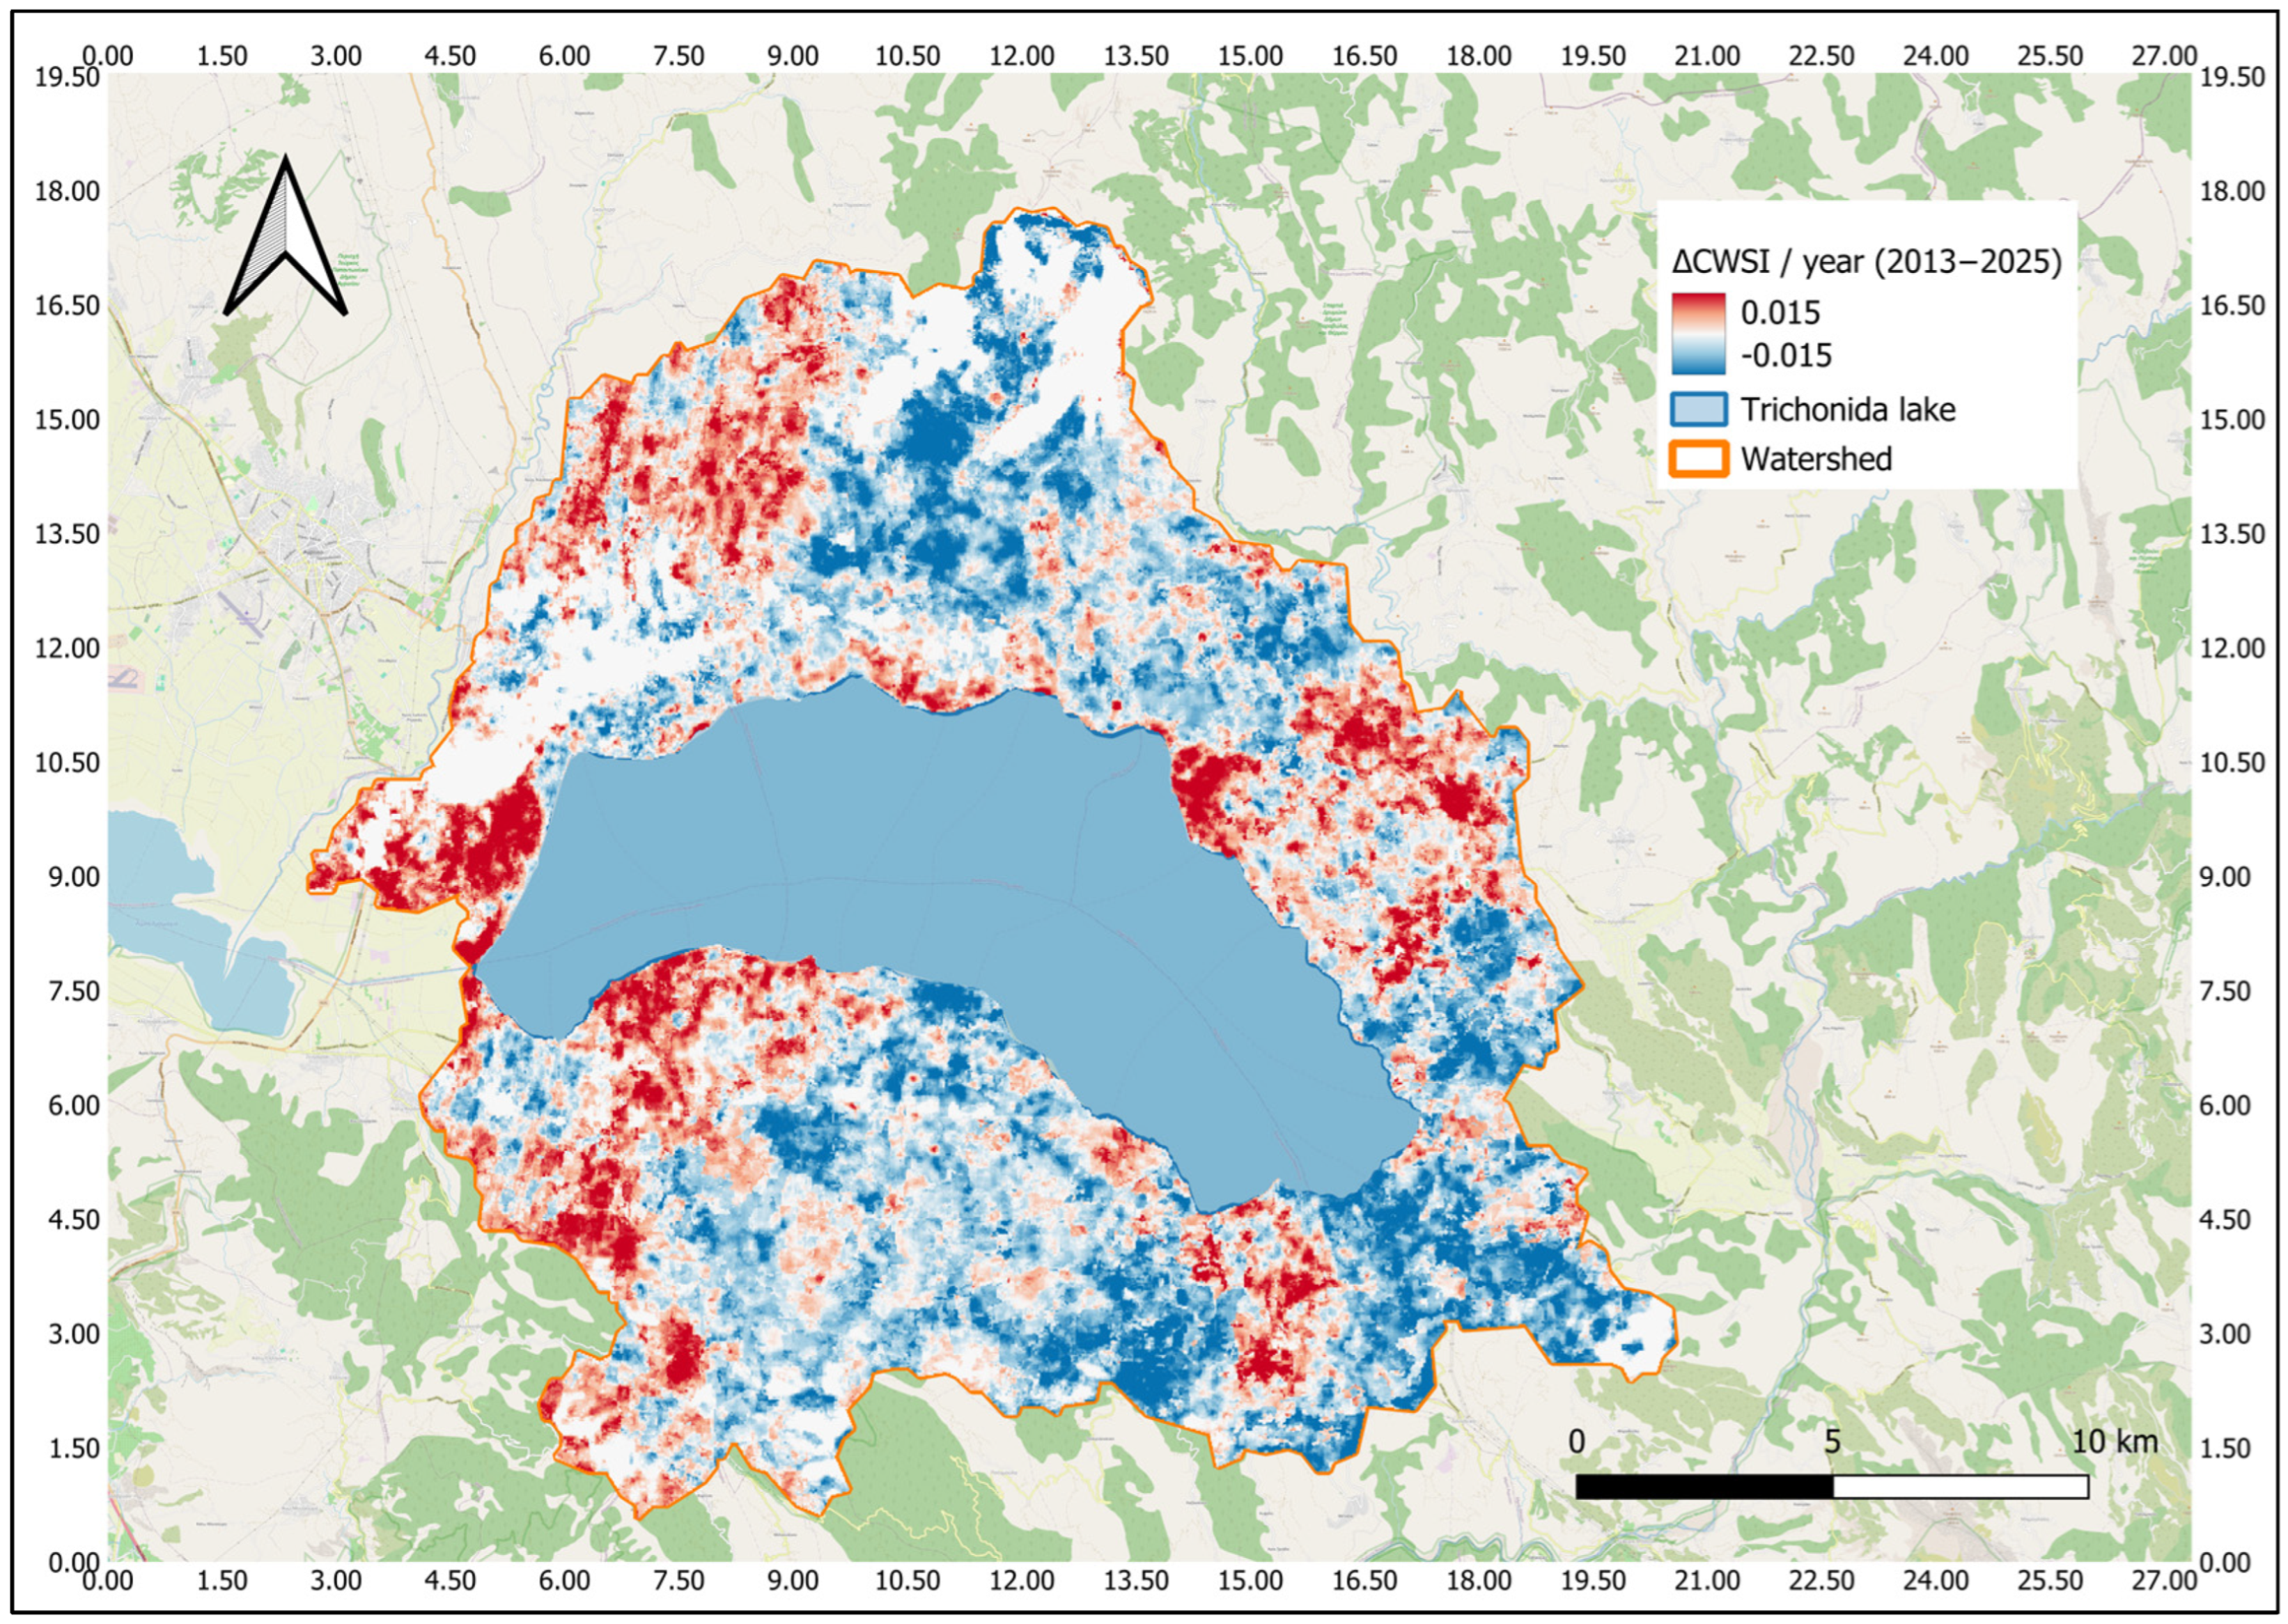
To evaluate the spatial distribution of long-term changes in vegetation water stress, a pixel-based CWSI trend analysis was performed using Landsat imagery for the period of 2013–2025. The Theil–Sen slope estimator was used to quantify the magnitude of CWSI changes at the pixel level, while the Mann–Kendall test was applied to assess statistical significance. The resulting spatial trend map (Figure 9) illustrates the spatial distribution of increasing or decreasing vegetation water stress during the study period. Overall, the map reveals spatially heterogeneous patterns, with some localized areas showing slight increases or decreases in vegetation water stress, while most pixels exhibit weak or non-significant trends.

Influence of Lake Water Temperature on Water Stress Dynamics

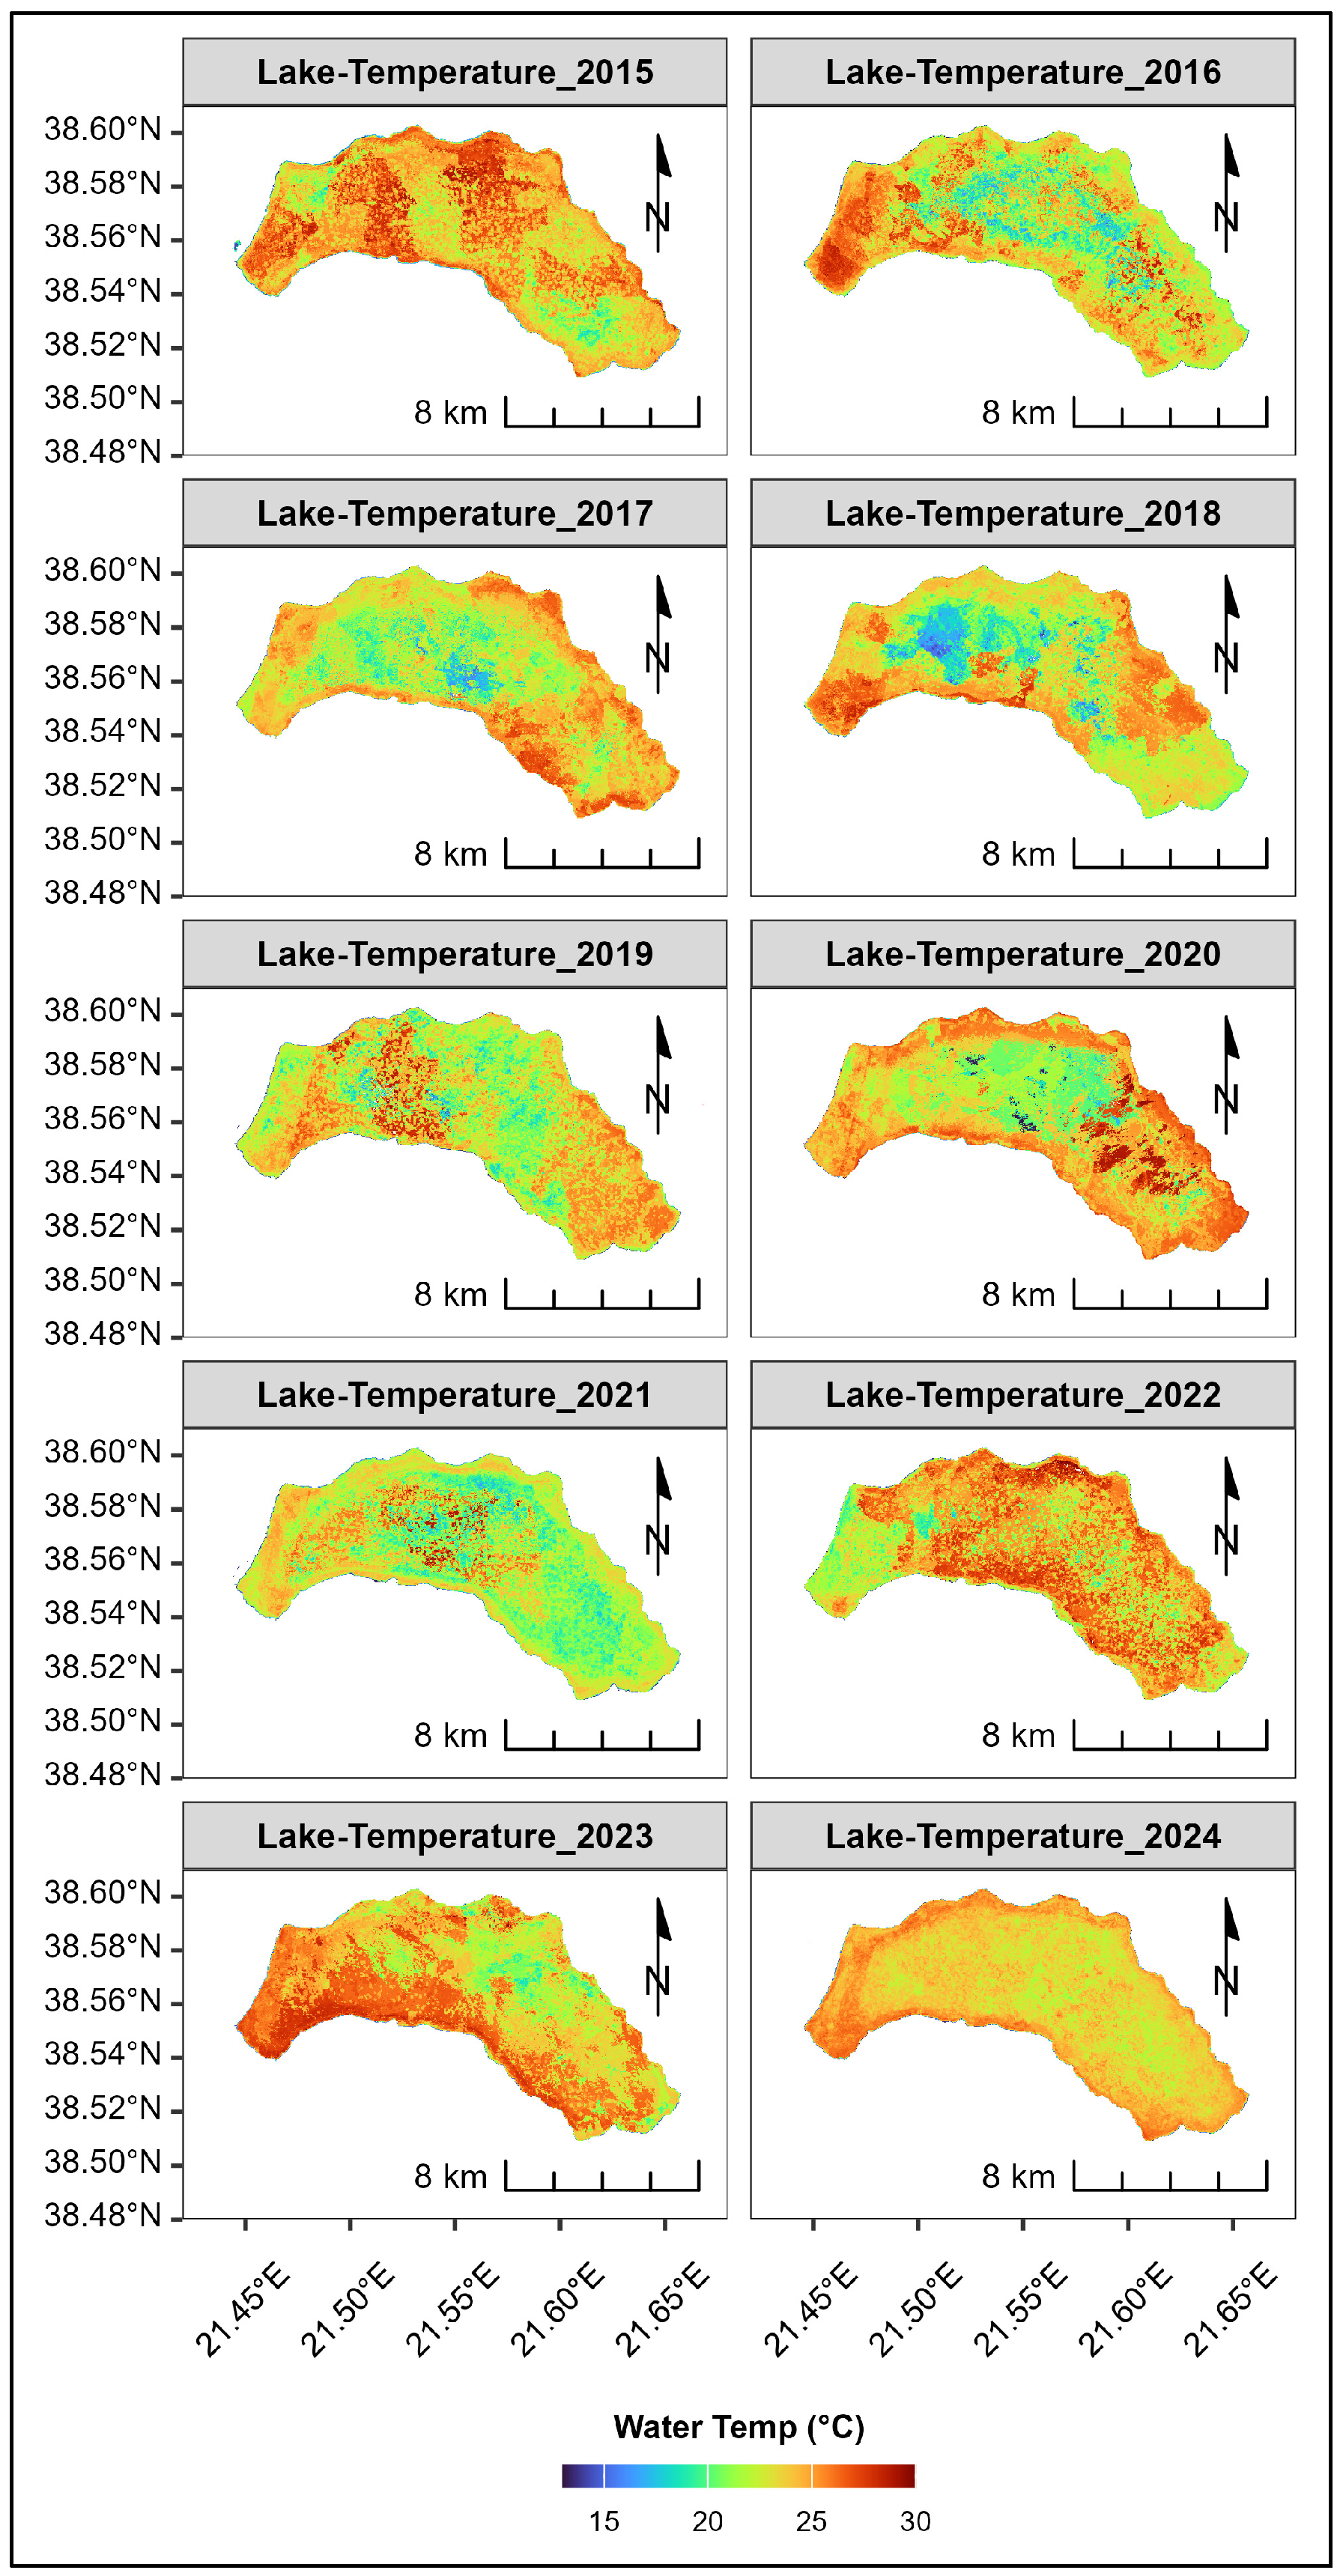
The spatio-temporal variability of lake surface water temperature during the period 2015–2024 is presented in Figure 10. The spatial temperature maps (Figure 10) show a clear spatial heterogeneity across the lake, along with notable interannual variability. Several years (2018, 2020, 2022, and 2024) are characterized by extended areas of high surface temperature exceeding 28–30 °C.
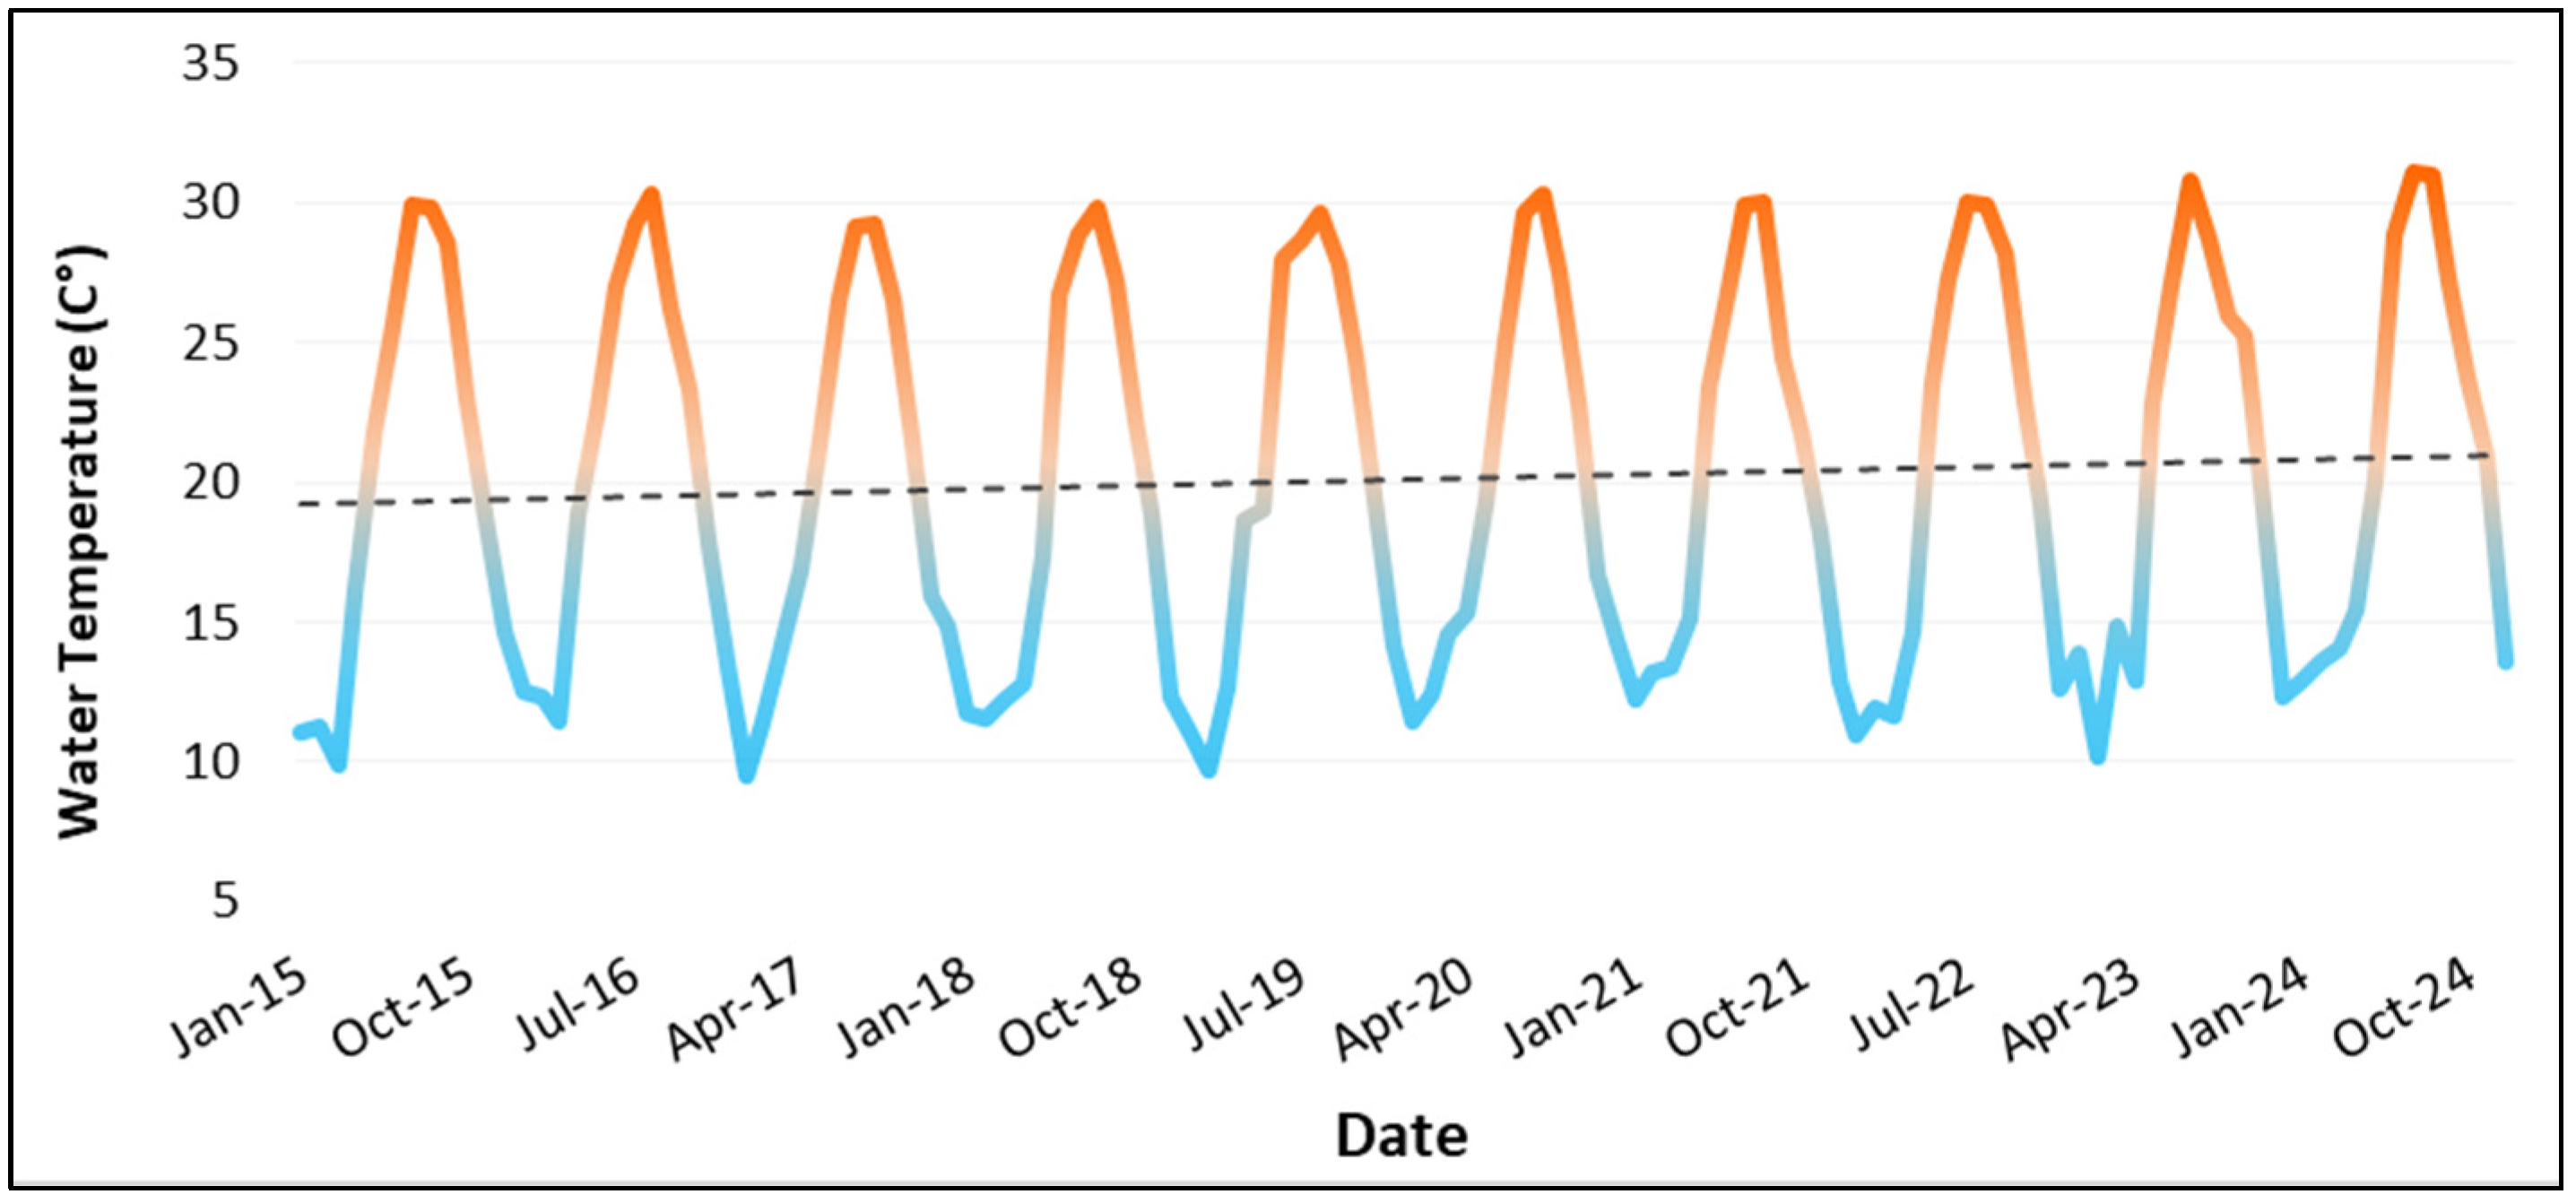
The monthly time series (Figure 11) indicates a marked seasonal cycle, with minimum water temperature occurring in winter (approximately 9–13 °C) and maximum values observed in summer, reaching up to 31.1 °C. The Mann–Kendall trend test applied to the full monthly water temperature series indicates a statistically non-significant long-term trend (Z = 1.09, p = 0.28), with a weak positive Sen slope trend of 0.0146.
Seasonal trend analysis focusing on the summer months indicates a more pronounced warming trend. Although still statistically non-significant, the Mann–Kendall test suggests a near-significant increasing trend (Z = 1.89, p = 0.059), accompanied by a positive Sen slope of 0.0546, indicating a gradual intensification of summer thermal conditions.
Correlation analysis shows a strong and statistically significant positive relationship between lake surface water temperature and CWSI (r = 0.73, p < 0.001), suggesting that both variables co-vary strongly across the seasonal cycle. In contrast, no significant correlation is observed between lake surface temperature and NDVI (r = 0.007, p =0.94). Similarly, lake temperature shows no significant association with SPEI at most time scales, with the exception of SPEI-3, which exhibits a weak but significant positive correlation (r = 0.20, p = 0.04).

3.4. Relationship Between Drought, Vegetation, and Water Stress (SPEI-NDVI-CWSI Correlations)

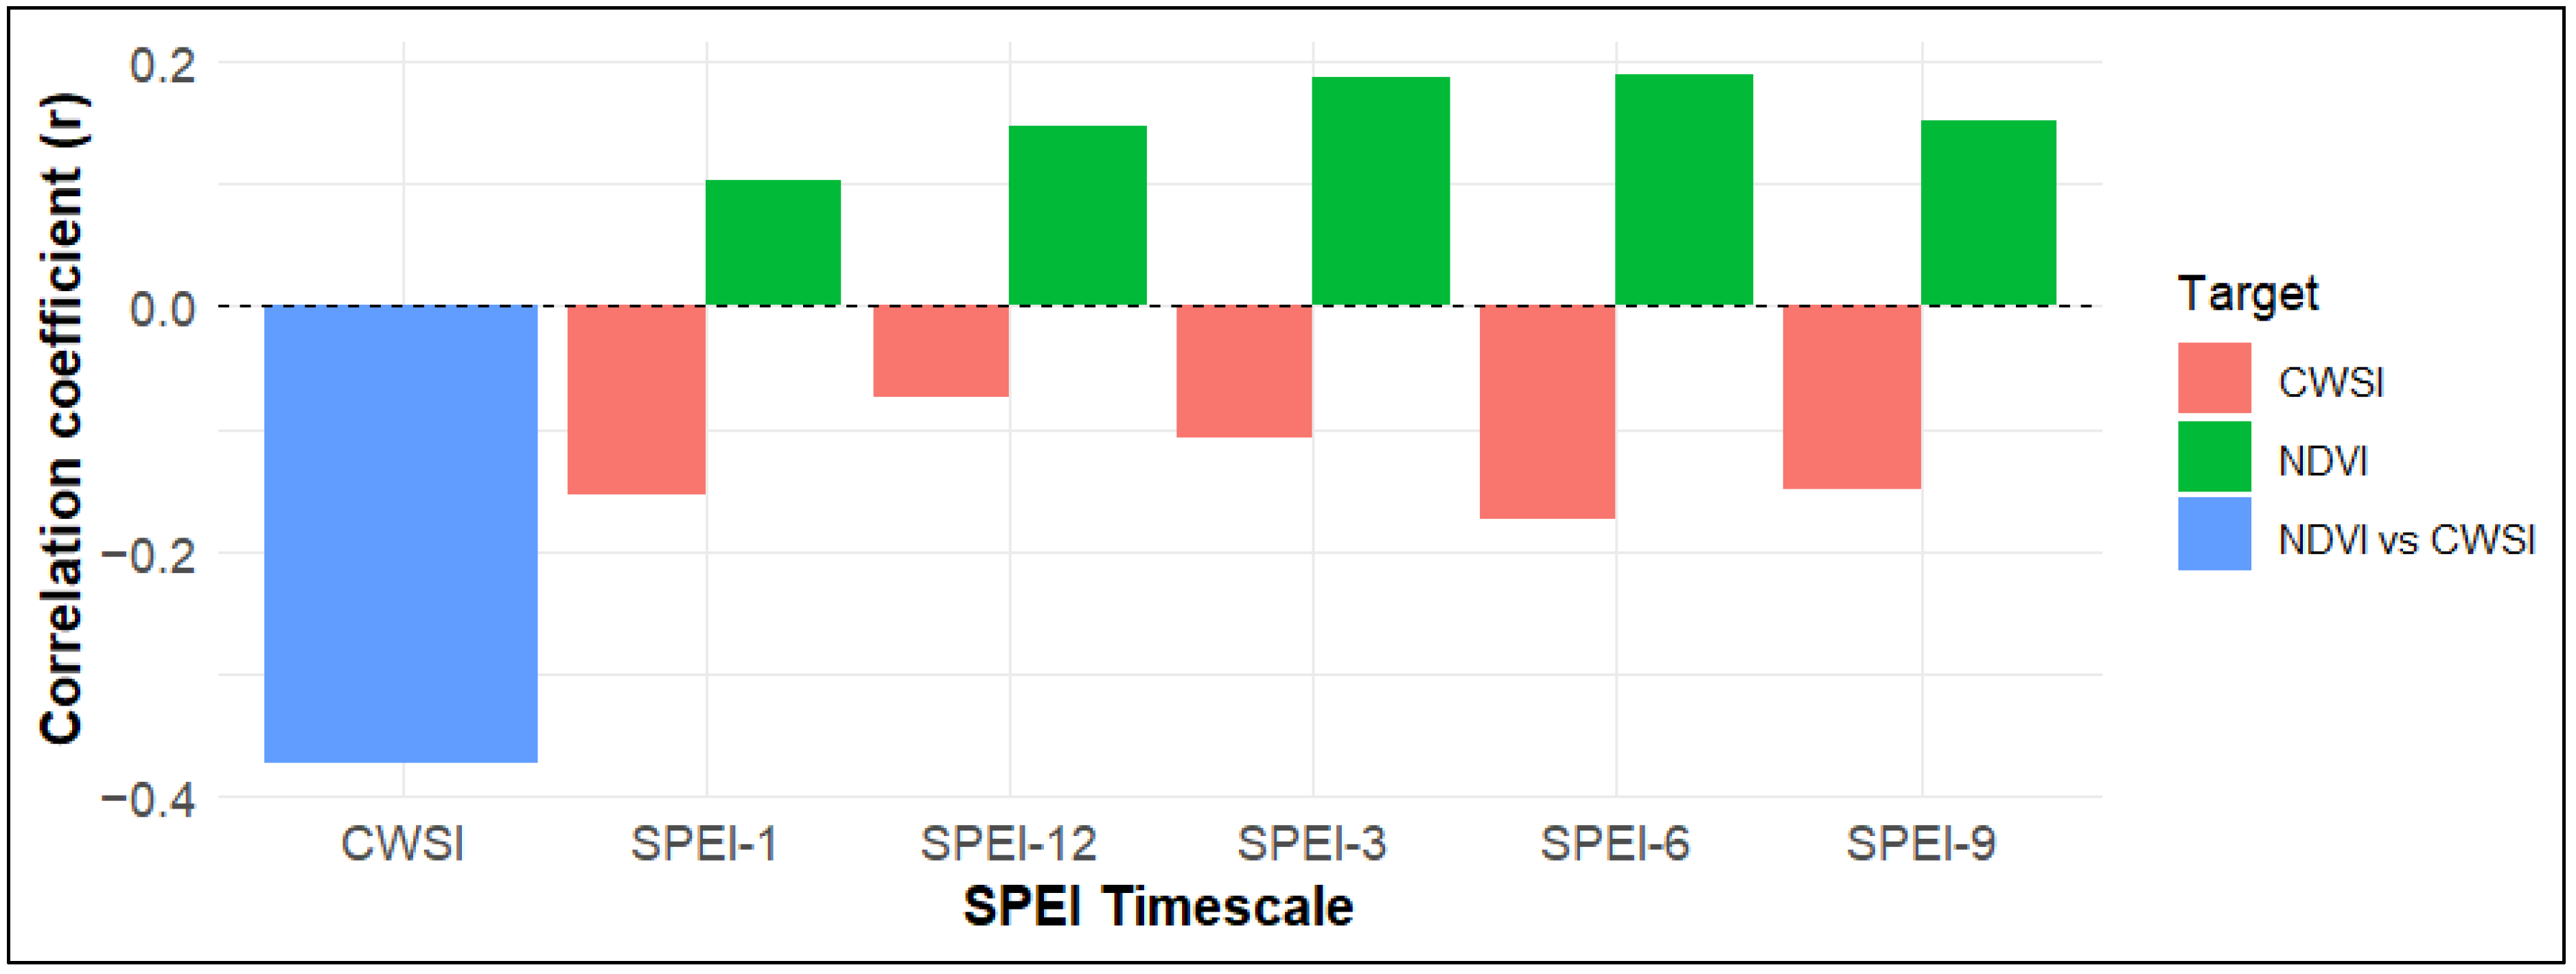
Correlation analysis revealed significant relationships between drought conditions, vegetation activity, and vegetation water stress (Table 1; Figure 12). NDVI showed positive and statistically significant correlations with SPEI at medium- and long-term time scales (SPEI-3 to SPEI-12), with correlation coefficients ranging from 0.15 to 0.19 (p < 0.05). These relationships indicate that vegetation greenness may be influenced by climatic conditions.
In contrast, CWSI exhibited significant negative correlations with SPEI at short- to medium-term time scales, particularly for SPEI-1, SPEI-6, and SPEI-9 (r ranging from −0.15 to −0.147, p < 0.05), indicating increased vegetation water stress during drought conditions.
Furthermore, a strong and highly significant negative correlation was observed between NDVI and CWSI (r = −0.37, p < 0.001), suggesting that higher vegetation greenness is associated with lower water stress.
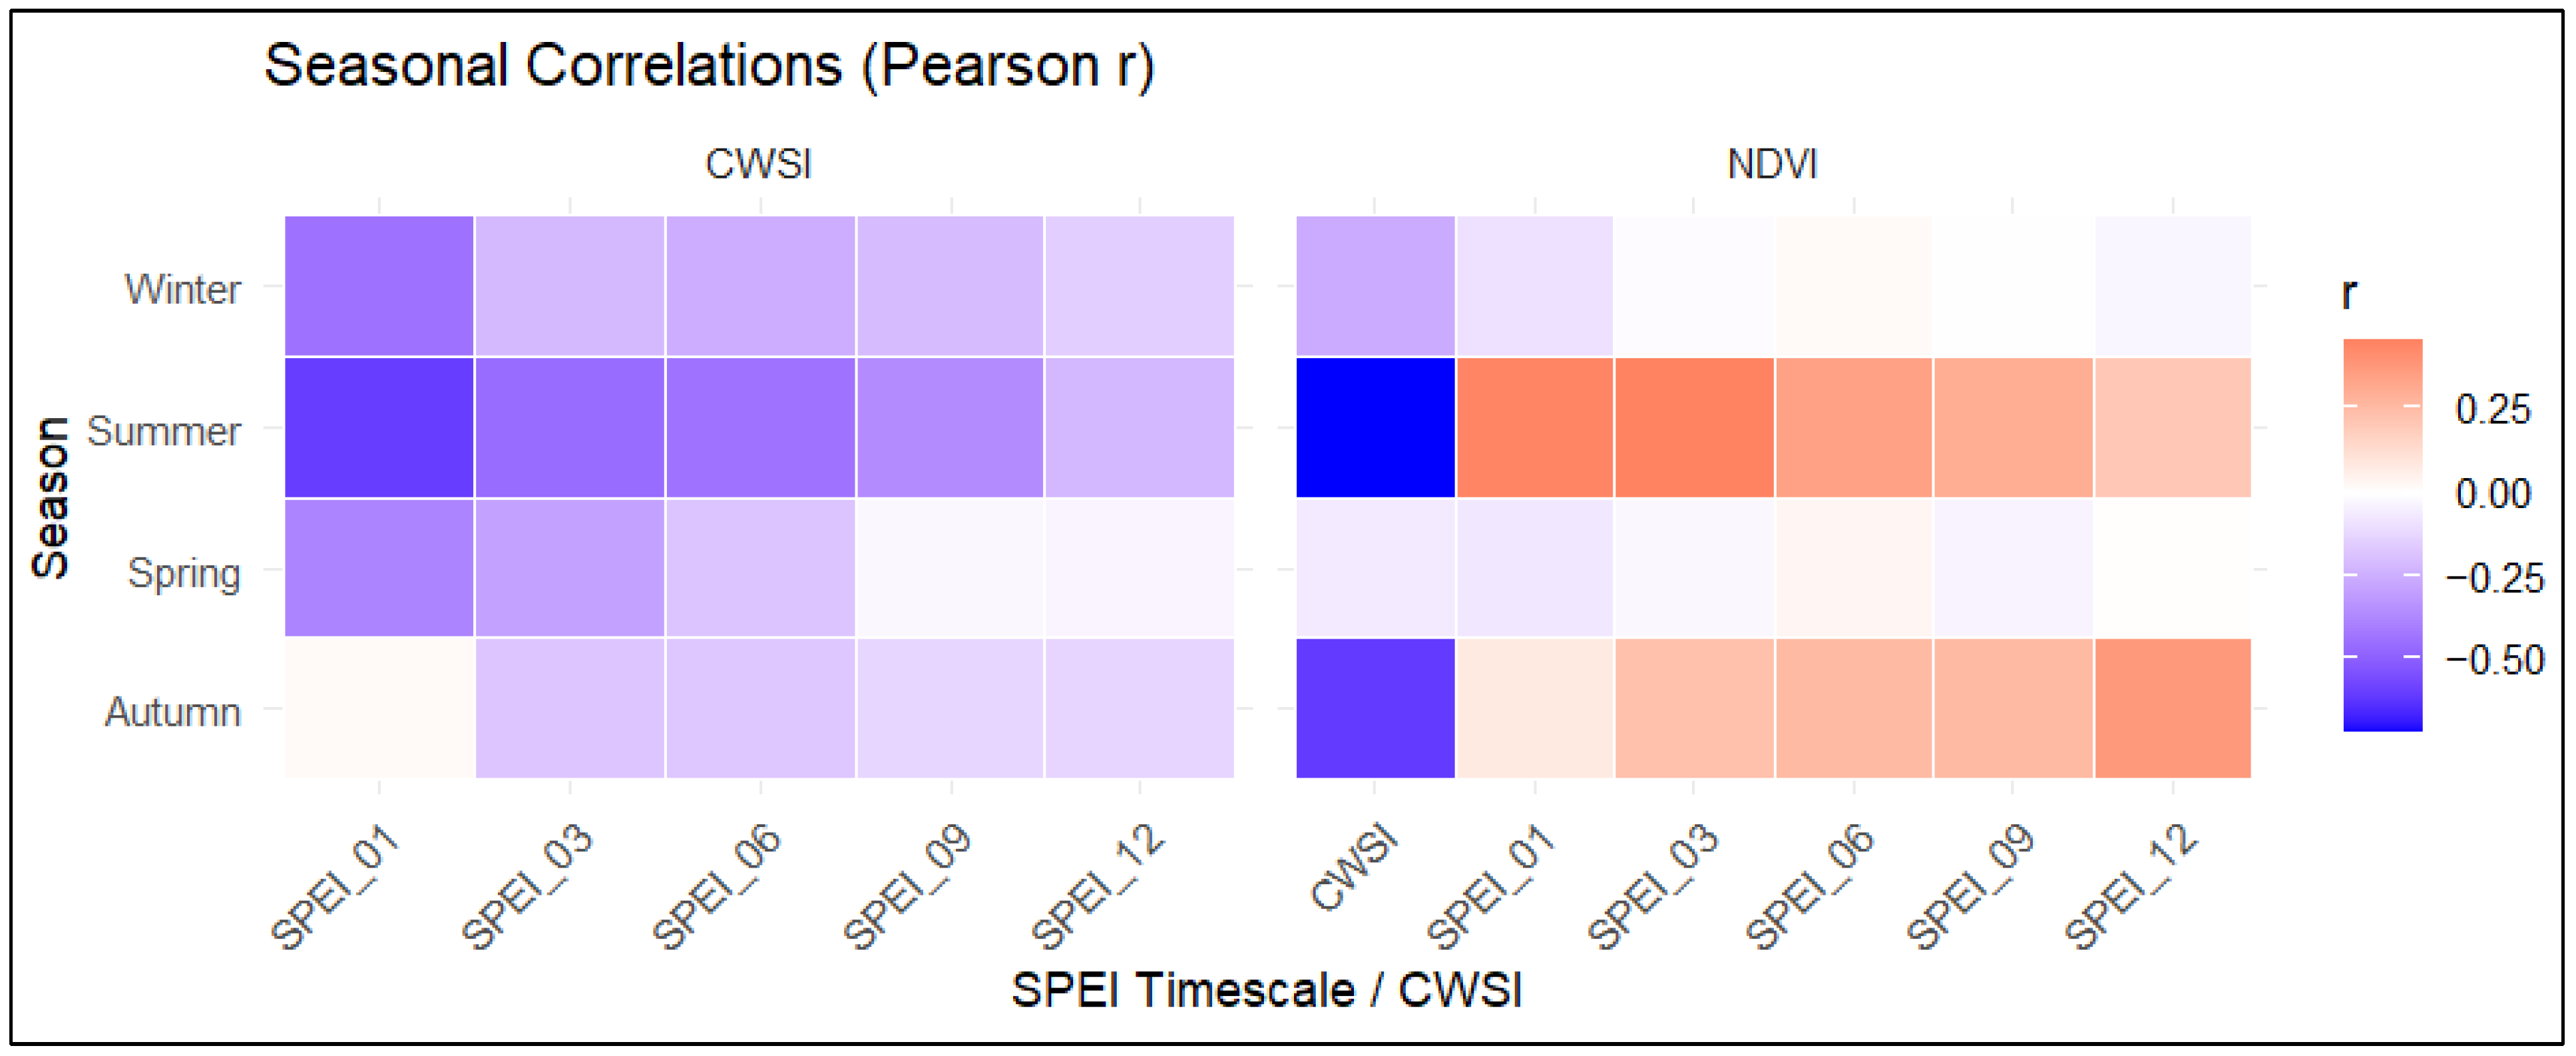
A seasonal correlation analysis was also conducted, and it revealed that these relationships vary throughout the year (Figure 13). The strongest negative correlations between CWSI and SPEI were observed during the winter, spring, and especially summer, mainly at short- and medium-term time scales (e.g., SPEI-1 in winter: r = −0.43, p < 0.001; SPEI-1 to SPEI-6 in summer: r = −0.43 to −0.60, p < 0.001). This pattern highlights the intensification of vegetation water stress under dry conditions.
In contrast, NDVI presented the strongest positive correlations with SPEI during summer and autumn, especially at medium- and long-term time scales (SPEI-3 to SPEI-9 in summer: r = 0.30–0.45, p < 0.05; SPEI-3 to SPEI-12 in autumn: r = 0.23–0.37, p < 0.05). Additionally, a strong negative correlation was found between NDVI and CWSI, in summer (r = −0.71, p < 0.001) and autumn (r = −0.61, p < 0.001), highlighting that water stress impacts vegetation greenness during these seasons.

4. Discussion

This study provides an integrated assessment of drought variability in the Trichonida basin by combining multi-timescale SPEI with satellite-derived NDVI, CWSI, and lake surface water temperature. The results show the sensitivity of vegetation and water stress to drought conditions. Although no statistically significant long-term drought trend was detected, the persistence of dry conditions in recent years suggests an increasing vulnerability of the ecosystem to climatic variability.
The SPEI analysis revealed alternating dry and wet periods, with more persistent drought conditions emerging after 2010, particularly at medium- and long-term timescales. This pattern is typical of Mediterranean climates, where drought intensification often manifests through changes in drought characteristics; specifically, increased persistence, reduced recovery intervals, and greater seasonal clustering of dry conditions, rather than through a simple monotonic trend in drought indices [9,54,55,56]. Therefore, the absence of a statistically significant long-term trend in SPEI does not preclude increasing ecosystem vulnerability; rather, it reflects high interannual variability in which droughts tend to occur as episodic but prolonged and increasingly recurrent events [10,54]. The shift toward more persistent negative SPEI observed at medium- and long-term timescales in the post-2010 period provides a physically consistent basis for interpreting heightened ecosystem vulnerability even in the absence of a monotonic drying signal. Increased temperatures and atmospheric evaporative demand, however, exacerbate the severity of droughts in Mediterranean ecosystems, even when precipitation trends are weak or insignificant, highlighting the relevance of SPEI for capturing drought processes in warming climates [57,58].
Another key feature of drought dynamics in the Mediterranean is seasonal dependence. Previous high-resolution analyses have shown that drought effects are most pronounced during the warm season, when evaporation peaks and soil moisture limitations intensify [59]. Such seasonal sensitivity supports the interpretation that prolonged negative SPEI values observed at longer timescales reflect cumulative hydroclimatic stress rather than short-term meteorological variations, which is expected to influence vegetation activity.
The NDVI analysis showed a clear seasonal variability and a statistically significant increasing long-term trend, indicating an overall increase in vegetation greenness across the basin. This trend suggests sustained vegetation activity despite recurrent drought episodes. However, given the presence of agricultural areas around the Trichonida basin, this increase likely reflects the combined influence of climatic variability and anthropogenic land management practices, particularly irrigation, which can maintain vegetation greenness. Similar trends of stable or increasing NDVI in stress-prone regions have been observed in Mediterranean and semi-arid regions and are often linked to the combined influence of climate variability, land management practices, adaptive ecosystem responses, and possible CO2 fertilization effects, rather than simple linear degradation processes [20,60,61]. In contrast, land-cover-specific NDVI analyses (2013–2025) for agricultural areas, forests, and calcareous fens did not reveal statistically significant trends. This likely reflects the relatively short temporal coverage of the land-cover dataset, which reduces the statistical power to detect monotonic changes. In addition, the strong interannual variability associated with agricultural practices around the Trichonida basin, such as changes in cropping and irrigation management, may obscure consistent long-term signals. As a result, while the basin-scale NDVI shows a significant increasing trend, land-cover-specific dynamics appear more variable and do not display a clear long-term trajectory over the analyzed period. Pronounced decreases in NDVI during specific periods coincide with severe drought conditions identified by SPEI, which indicate a high sensitivity of vegetation activity to sustained climatic water deficits. Under prolonged soil moisture deficit, plants respond by reducing stomatal conductance, which limits photosynthetic activity and progressively translates into reduced canopy greenness detectable by remote sensing [62]. Similar results have been reported, where plant productivity is primarily governed by seasonal to interannual water availability [20]. This is consistent with the positive correlations between NDVI and SPEI at medium- and long-term timescales, suggesting that vegetation in the Trichonida basin is controlled by cumulative hydroclimatic stress rather than short-term meteorological variability.
While NDVI reflects cumulative vegetation responses, CWSI provides more direct insight into the physiological water stress experienced by vegetation. The CWSI analysis reveals the absence of a monotonic trend despite recurring episodes of severe summer stress, suggesting that vegetation in the Trichonida basin region is primarily driven by strong interannual variability. Similar behavior has been reported in other Mediterranean and semi-arid environments, where water stress indicators respond mainly to episodic drought events and seasonal extremes, even under ongoing climate warming [54,57].
This is also consistent with the spatial trend analysis, where the predominance of non-significant pixel-level trends in NDVI and CWSI suggests that ecosystem responses are not characterized by uniform long-term changes, but rather by spatially heterogeneous and temporally variable dynamics typical of Mediterranean environments. Ecologically, this pattern may reflect hydrological buffering, with vegetation activity and water stress regulated more by seasonal changes and episodic drought events than by gradual degradation.
Seasonal correlation analysis revealed that NDVI is most strongly linked to drought conditions during summer and autumn, when high evaporative demand and limited soil moisture availability control photosynthetic activity [63,64]. The strong negative correlation between NDVI and CWSI during these seasons suggests that increased water stress directly limits vegetation greenness during active growth periods. This finding highlights that vegetation greenness alone may not fully capture ecosystem water stress and underscores the importance of integrating NDVI with drought and water stress indicators such as SPEI and CWSI. Correlation-based analyses provide useful insights into relationships among variables; however, they do not imply causality and may be influenced by shared seasonal variability. In addition, vegetation responses to drought may vary across temporal scales and can involve delayed responses depending on vegetation type and water availability, highlighting the importance of considering lagged relationships in drought–vegetation interactions [65,66].
The significant negative correlations between CWSI and SPEI at short- and medium-term timescales indicate that vegetation water stress responds rapidly to drought conditions. These results indicate that both short-term moisture deficits and accumulated drought exert direct control on plant water status. This rapid response highlights the ability of CWSI to capture early physiological stress, consistent with findings by [17], who showed that CWSI exhibits stronger correlations with SPEI at the three-month scale compared to greenness-based indices. In contrast, NDVI integrates longer-term vegetation responses, suggesting that CWSI may detect water stress earlier than greenness-based indices, making the two indicators complementary in capturing drought impacts across different timescales. Similar sensitivities have been reported for thermal and evapotranspiration-based indices, which often detect drought onset earlier than vegetation greenness indicators [67,68]. Although CWSI was analyzed at the basin scale, it is important to recognize that, in heterogeneous environments, ET/PET-based indices may reflect not only short-term water stress but also differences in vegetation structure and hydrological functioning. As a result, part of the observed variability in CWSI may be associated with ecosystem-specific characteristics rather than purely climatic water stress.
A key finding of this study is the positive correlation between lake surface water temperature and CWSI, indicating a close association between thermal conditions and vegetation water stress. Although no statistically significant long-term trend was observed in monthly lake surface temperature, a slight upward trend during summer suggests that episodic warming could intensify atmospheric evaporative demand and amplify vegetation water stress. From a physiological perspective, CWSI is fundamentally controlled by canopy–air temperature differences and vapor pressure deficit, where elevated thermal conditions increase evaporative demand, promote stomatal closure, and lead to higher canopy temperatures [21,46]. In lake-dominated environments, warmer surface waters may influence local microclimates and indirectly intensify vegetation water stress during warm periods, as reported in other lake and riparian systems [24,69]. In this study, the observed correlation between lake surface temperature and CWSI likely reflects shared seasonal responses to common climatic drivers, particularly air temperature and solar radiation, rather than a direct interaction between thermal conditions and vegetation water stress.
To better understand how these thermal controls affect different ecosystems around the basin, land-cover-specific NDVI dynamics were examined. Different seasonal behaviors were observed among agricultural, forest, and fen ecosystems. Agricultural NDVI displays stronger seasonal fluctuations, likely reflecting crop phenology and management practices, including irrigation. Forest NDVI exhibits comparatively stable responses to water-temperature variability, suggesting buffered ecological functioning. In contrast, fen NDVI shows a pronounced positive seasonal association with lake surface water temperature, coinciding with higher productivity during warm periods; however, the strong association is largely driven by their shared seasonal cycle, and the use of non-deseasonalized time series is therefore a limitation, as it does not separate seasonal effects from interannual variability. Although a single basin-scale SPEI series was used, the land-cover-specific NDVI dynamics reveal distinct ecosystem responses under the same climatic forcing, highlighting differences in ecohydrological behavior related to rooting depth, water access, and groundwater dependence. These contrasting dynamics suggest that the sensitivity of each vegetation type to drought likely varies across accumulation timescales. Both Landsat- and Sentinel-2-derived NDVI time series follow the same seasonal trajectory and exhibit the same amplitude patterns, reinforcing the robustness of the observed patterns across sensors and spatial resolutions.
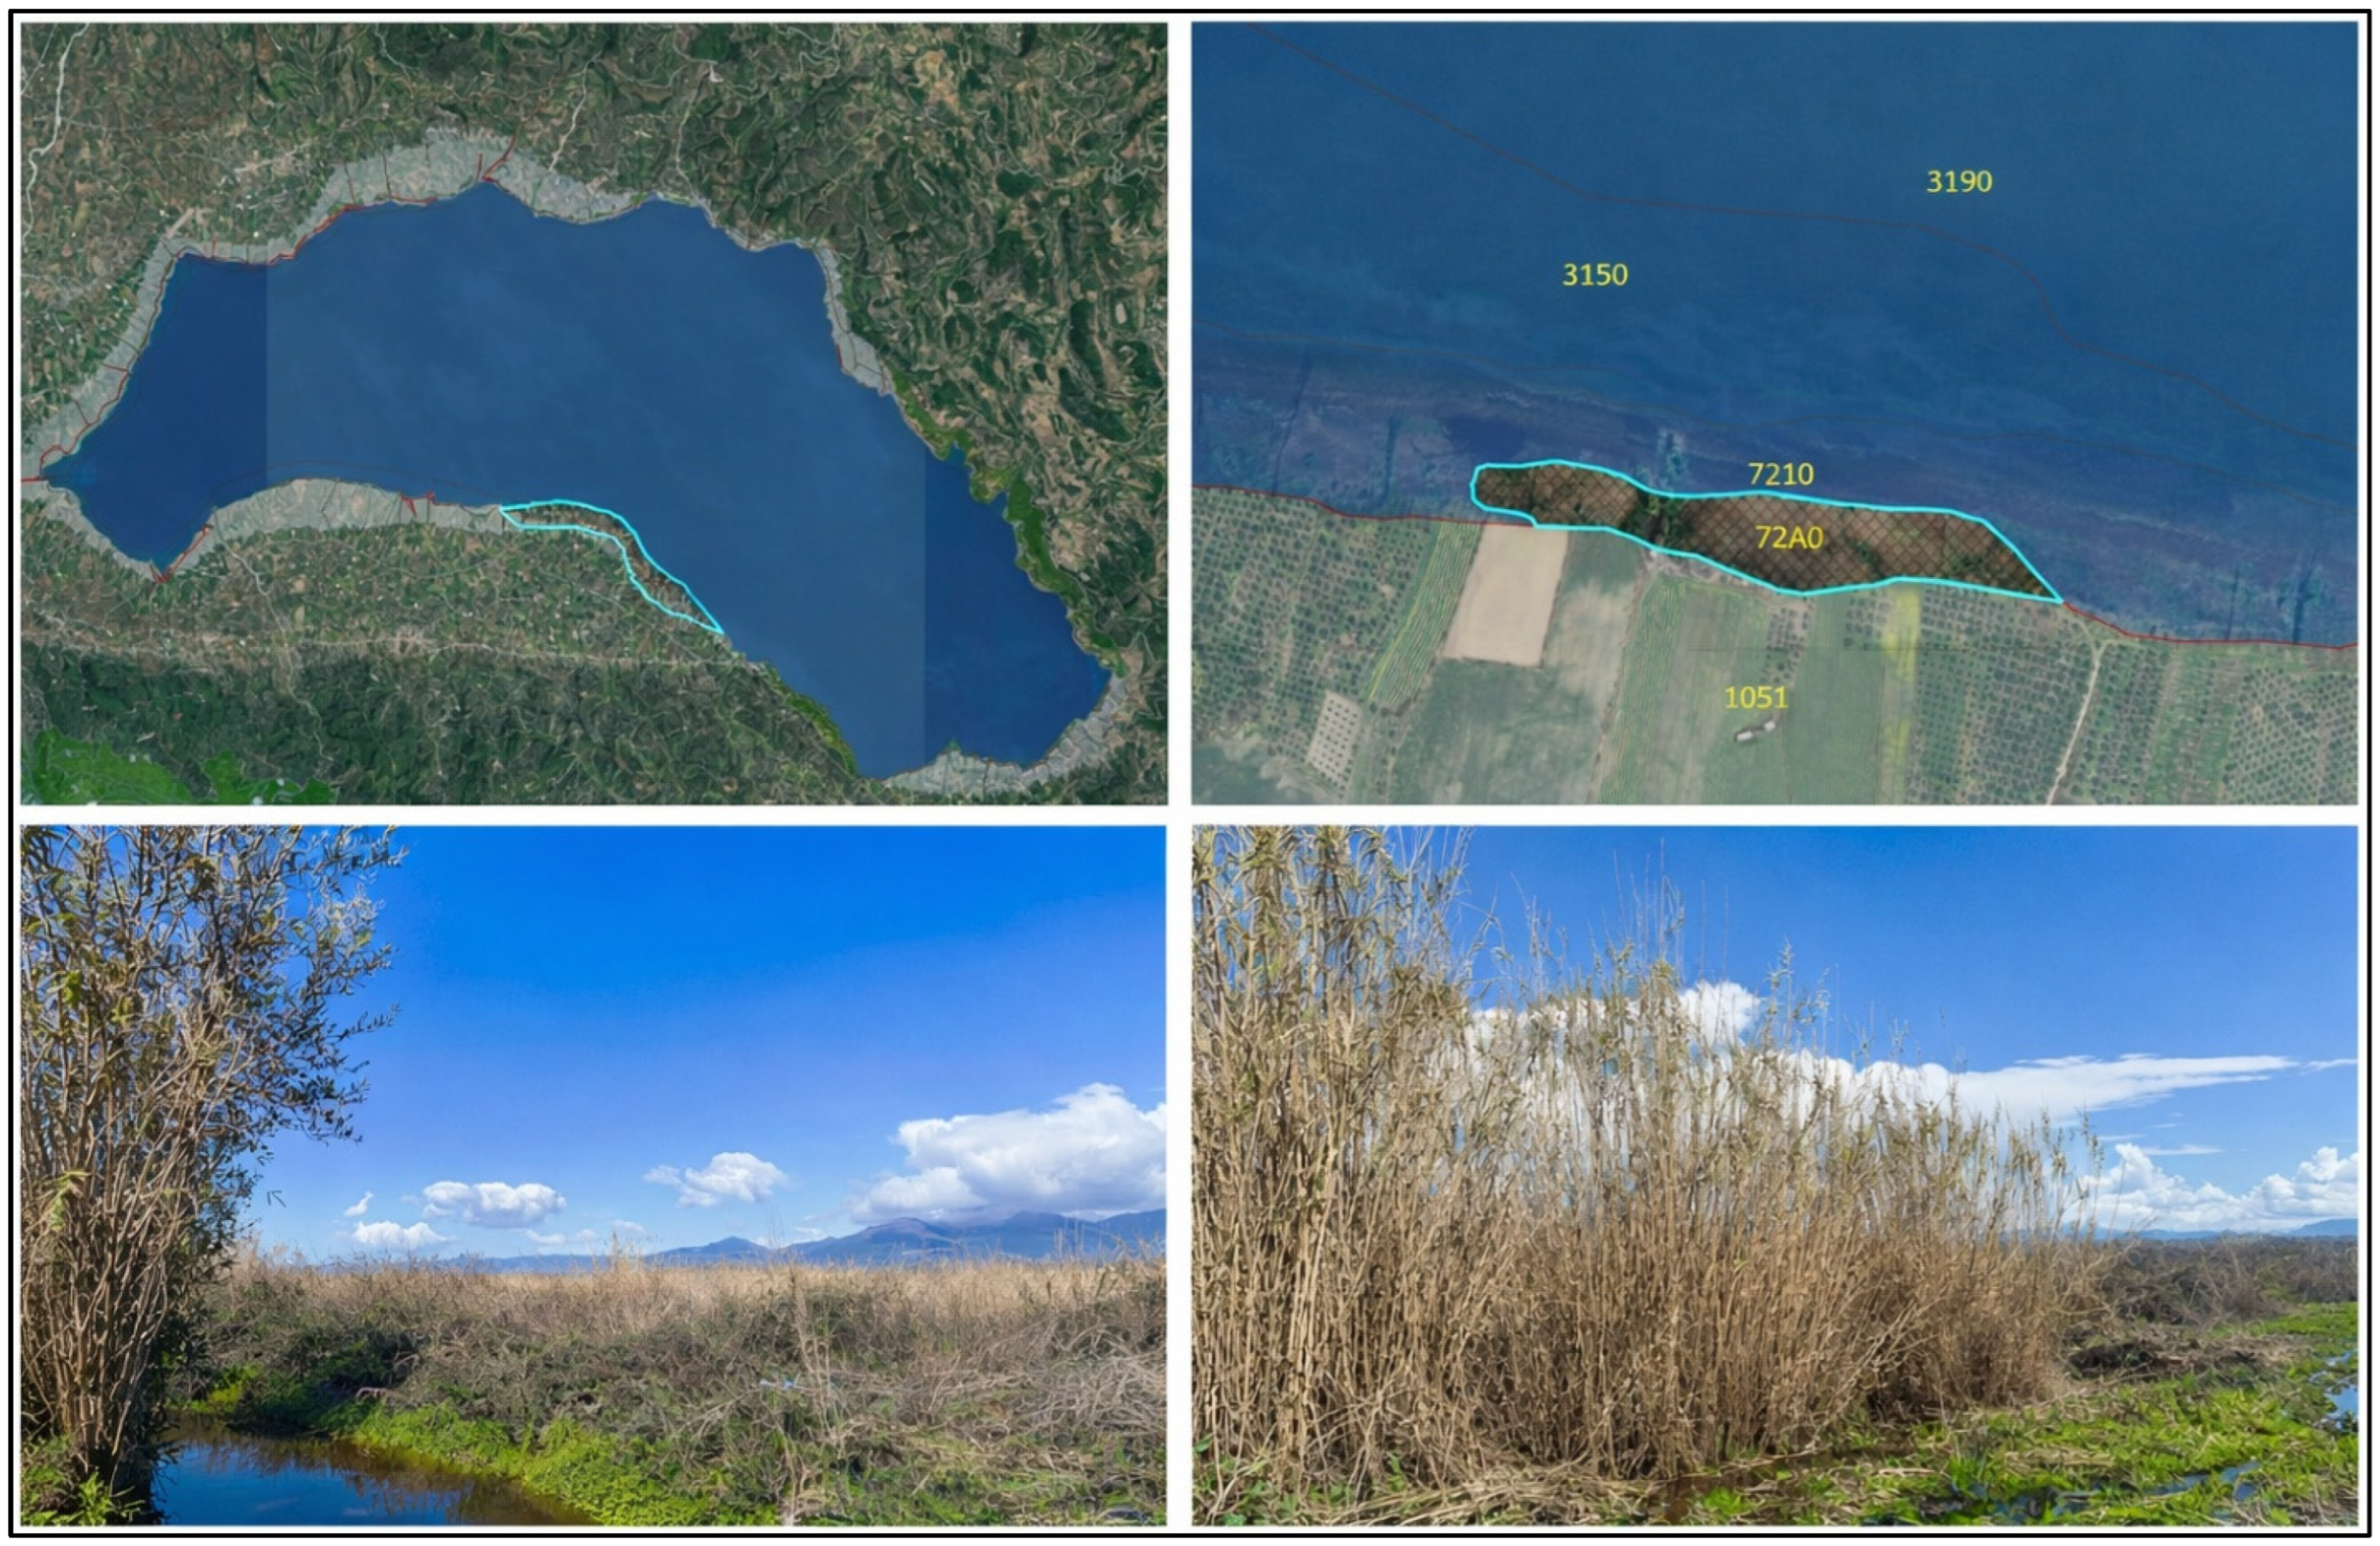
Over recent decades, the upstream transformation of calcareous fen surroundings into agricultural land appears to have altered local ecohydrological dynamics. Increased water abstraction for irrigation and intensified nutrient inputs may influence both lake processes and adjacent wetland functioning (Figure 14). Despite these pressures, fen vegetation maintains a distinct seasonal behavior compared to agricultural and forest ecosystems. Productivity increases during warm periods, suggesting that thermal conditions play a major role in regulating seasonal activity when moisture availability remains sufficient.
Calcareous fens with Cladium mariscus are primarily more sensitive to groundwater-level fluctuations that regulate the baseflow entering the lake than to variations in water temperature. These long-lasting wetland ecosystems can persist under moderate anthropogenic pressure, provided that key hydrological and geochemical conditions remain stable [70,71]. Their ecological value lies not only in sustaining rare and protected plant assemblages but also in maintaining high levels of biodiversity linked to carbonate-rich substrates and shallow groundwater regimes [72,73]. The results from Lake Trichonida highlight how these systems respond to ongoing environmental change, particularly land-use modification and hydroclimatic variability.
Although the resilience of C. mariscus to extremely high water temperatures has not yet been investigated, previous studies suggest that hydrological stability is more critical for its persistence and that hydrological alterations may lead to a reduction in the extent of this habitat [39]. In the present study, higher lake temperature and increased vegetation water stress are associated during drought episodes, suggesting a potential vulnerability of the species to combined thermal and hydrological stress, driven by shared seasonal atmospheric forcing rather than a direct causal interaction. Furthermore, declining lake water levels affect water inflow to calcareous fens, thereby weakening their buffering capacity against acidification.
The unimodal phenological signal observed in fen NDVI, characterized by a summer maximum and winter minimum, indicates that calcareous fens reach peak productivity during the warmest months. Such hydrological buffering allows fen vegetation to exploit high solar radiation and elevated temperatures without experiencing the water stress commonly observed in surrounding ecosystems.
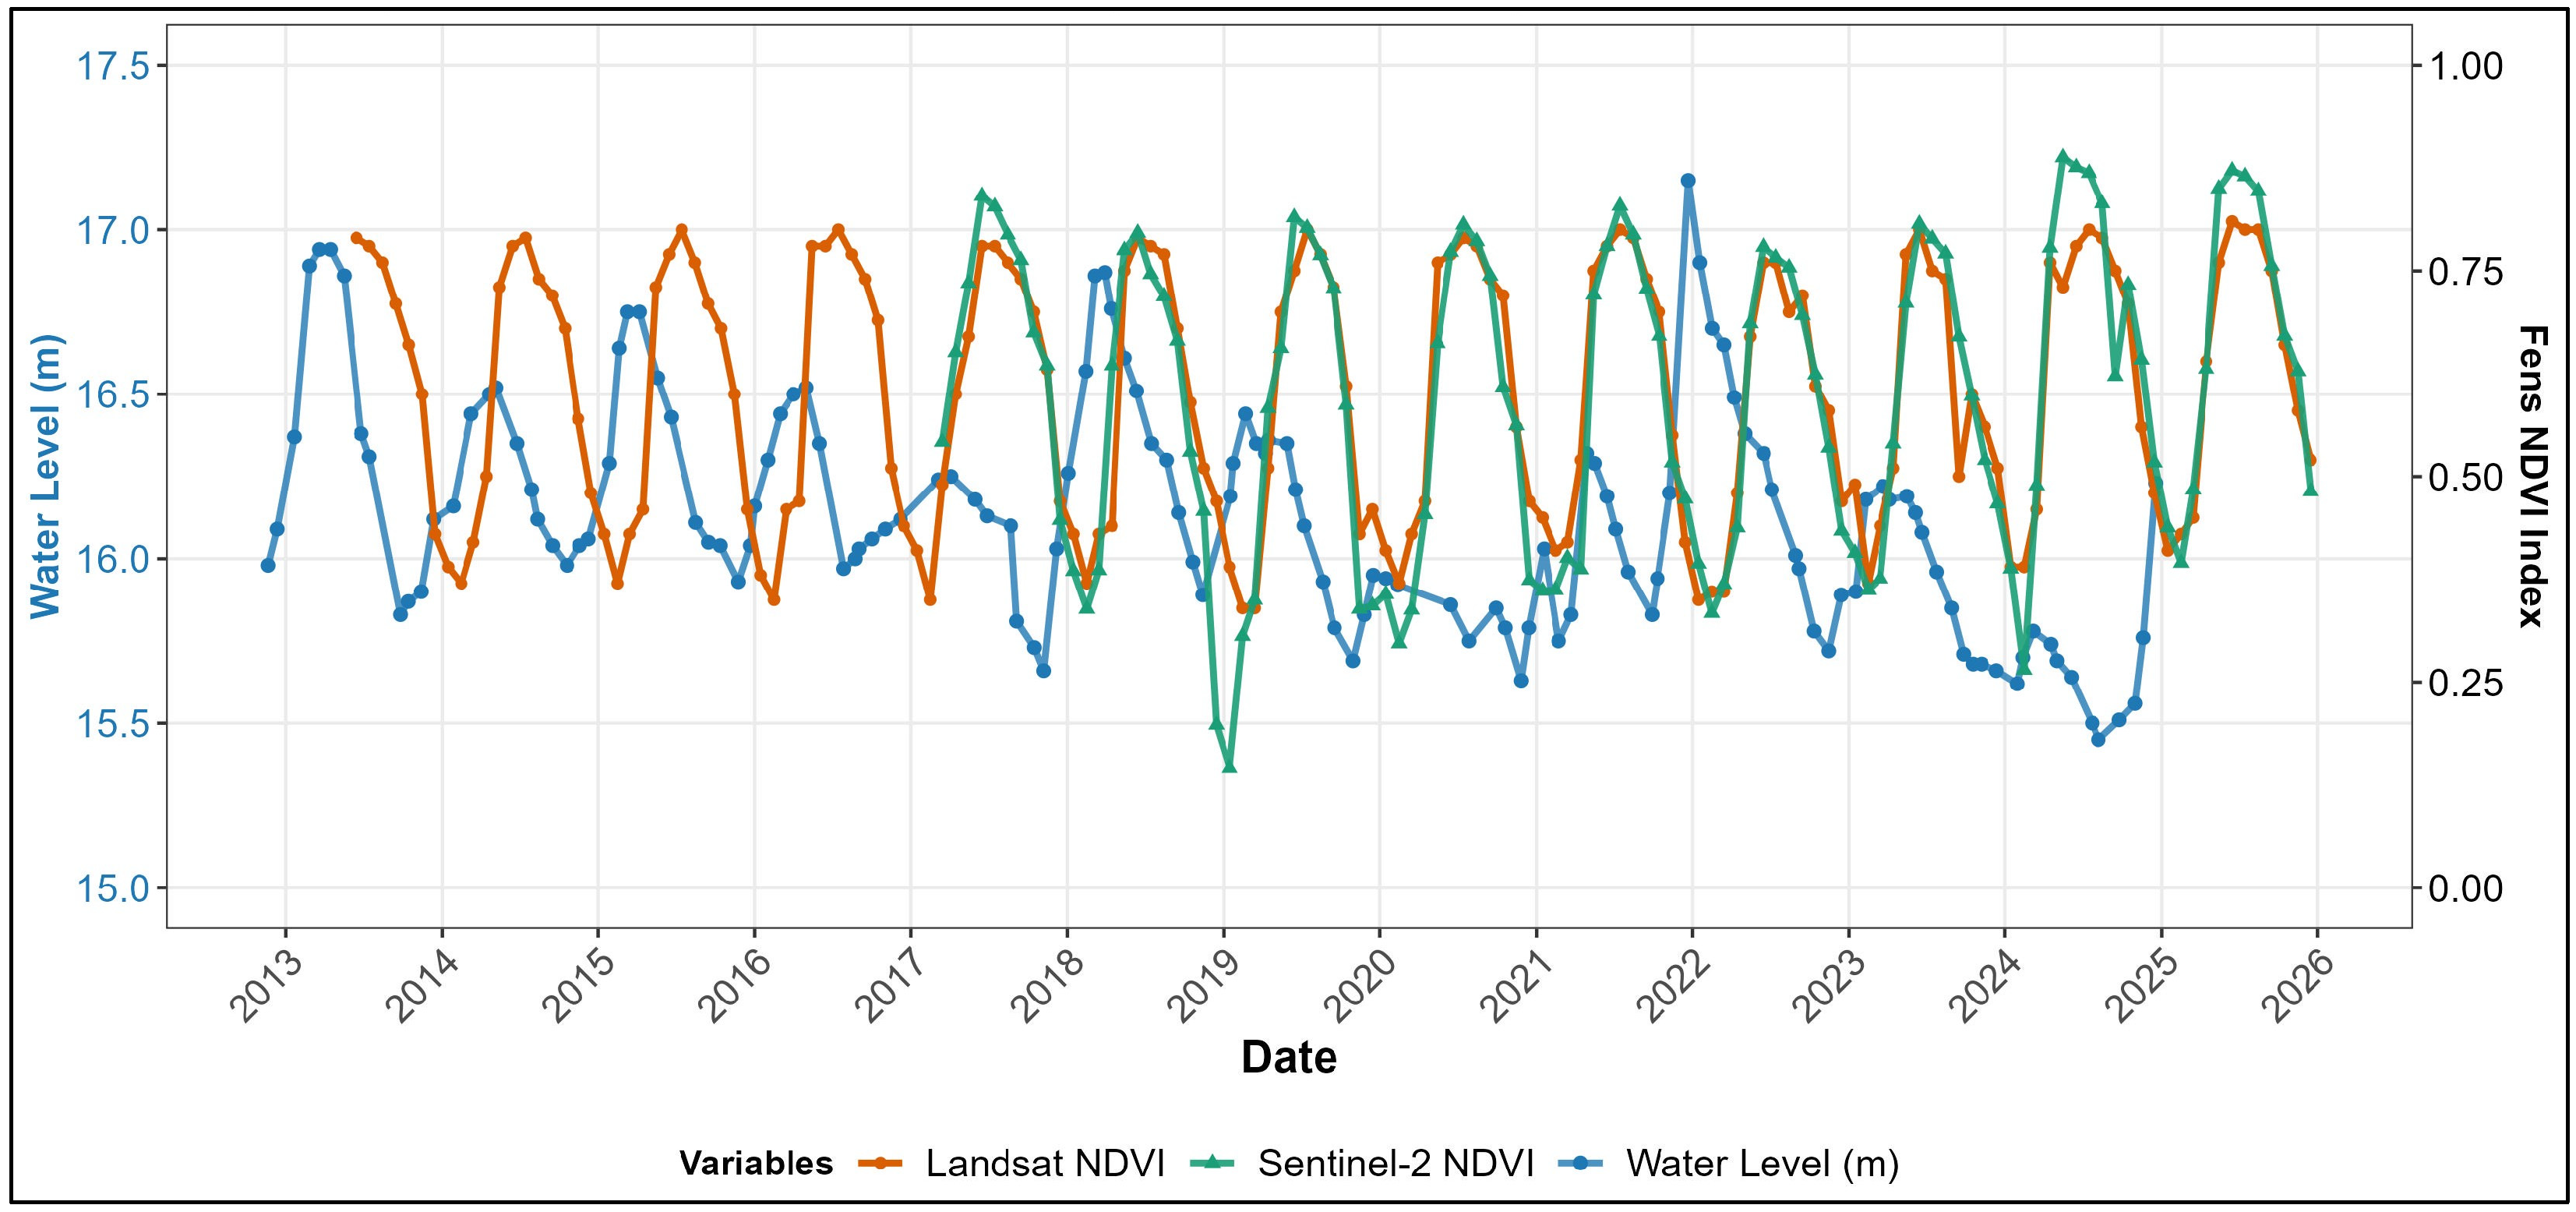
Interestingly, the close relationship between fen NDVI and water temperature persists even during periods of reduced lake water level (Figure 15). The absence of pronounced NDVI declines during low-level phases suggests that fen vegetation is not directly controlled by short-term lake-level fluctuations but rather by local groundwater stability and micro-hydrological conditions. This pattern reinforces the interpretation of calcareous fens as hydrologically buffered ecosystems, where vegetation dynamics are more responsive to thermal and seasonal drivers under stable groundwater conditions rather than transient changes in surface water levels.
Overall, the coupling between drought conditions, thermal dynamics, and vegetation responses indicates that ecosystem responses in Lake Trichonida are governed by strong seasonal controls and interannual variability rather than monotonic degradation. Maintaining stable hydrological regimes is therefore essential for preserving ecological resilience, particularly for groundwater-dependent ecosystems such as calcareous fens under increasing climatic and land-use pressures. Long-term monitoring integrating remote sensing, hydrological measurements, and ecological indicators will be essential for assessing future resilience thresholds.

5. Conclusions

This study presents an assessment of drought dynamics and vegetation responses in the Trichonida basin by analyzing multi-timescale SPEI, satellite-derived NDVI and CWSI, and lake surface water temperature. This integrated approach enabled a comprehensive characterization of both cumulative drought conditions and vegetation dynamics, emphasizing the strong seasonal control of hydroclimatic variability in Mediterranean lake ecosystems.
The findings indicate that, despite the absence of a statistically significant long-term trend in climatic drought, the persistence of dry conditions, particularly during summer and autumn, increases ecosystem vulnerability. NDVI trends suggest overall stability of vegetation greenness across natural ecosystems, while the observed basin-scale increase is likely influenced by agricultural activity and irrigation practices. Nevertheless, significant seasonal declines during drought events indicate the sensitivity of vegetation to cumulative water deficits. In contrast, CWSI more effectively detected short-term physiological stress, responding rapidly to short- and medium-term drought conditions and increased thermal forcing, providing crucial information on vegetation water stress that greenness-based indices alone cannot detect. These findings suggest that ecosystem responses are primarily governed by strong seasonal controls and interannual variability rather than monotonic long-term degradation. Calcareous fens with Cladium mariscus appear more sensitive to drought events, resulting in water deficit and habitat shrinking under sustained hydrological stress.
The combined use of CWSI, SPEI, NDVI, and lake surface water temperature indicates the role of atmospheric evaporative demand and seasonal warming in enhancing vegetation condition and water stress around the lake, indicating the added value of this integrated framework for assessing ecosystem responses to climatic variability. These findings have important implications for water resource management in Mediterranean lake systems, particularly in supporting early drought detection, informing conservation planning for groundwater-dependent ecosystems, and promoting more adaptive management strategies under increasing climatic pressure.

Author Contributions

Conceptualization, F.D., O.T. and E.I.K.; methodology, F.D.; software, M.M.M. and F.D.; validation, M.M.M.; formal analysis, F.D. and I.N.M.; resources, M.M.M.; writing—original draft preparation, F.D. and E.I.K.; writing—review and editing, F.D., E.I.K., M.M.M., I.N.M. and O.T.; supervision, A.L. All authors have read and agreed to the published version of the manuscript.

Funding

This research received no external funding.

Data Availability Statement

The data that support the findings of this study are available from the corresponding author upon reasonable request.

Acknowledgments

The authors wish to thank Lambros Tsounis for the valuable information about and photos of the calcareous fen.

Conflicts of Interest

The authors declare no conflicts of interest.

References

  1. Latinopoulos, D.; Ntislidou, C.; Kagalou, I. Multipurpose Plans for the Sustainability of the Greek Lakes: Emphasis on Multiple Stressors. Environ. Process. 2016, 3, 589–602. [Google Scholar] [CrossRef]
  2. Stefanidis, K.; Kostara, A.; Papastergiadou, E. Implications of Human Activities, Land Use Changes and Climate Variability in Mediterranean Lakes of Greece. Water 2016, 8, 483. [Google Scholar] [CrossRef]
  3. Helali, J.; Asaadi, S.; Jafarie, T.; Habibi, M.; Salimi, S.; Momenpour, S.E.; Shahmoradi, S.; Hosseini, S.A.; Hessari, B.; Saeidi, V. Drought Monitoring and Its Effects on Vegetation and Water Extent Changes Using Remote Sensing Data in Urmia Lake Watershed, Iran. J. Water Clim. Chang. 2022, 13, 2107–2128. [Google Scholar] [CrossRef]
  4. Stefanidis, K.; Varlas, G.; Papadopoulos, A.; Dimitriou, E. Four Decades of Surface Temperature, Precipitation, and Wind Speed Trends over Lakes of Greece. Sustainability 2021, 13, 9908. [Google Scholar] [CrossRef]
  5. El-bouhali, A.; Ech-chahdi, K.E.O.; Amyay, M. Monitoring of Agricultural Drought Using Remote Sensing Data in the Sebou Watershed, Morocco. In Proceedings of the E3S Web of Conferences; EDP Sciences: Les Ulis, France, 2025; Volume 607, p. 7. [Google Scholar]
  6. Zribi, M.; Nativel, S.; Le Page, M. Analysis of Agronomic Drought in a Highly Anthropogenic Context Based on Satellite Monitoring of Vegetation and Soil Moisture. Remote Sens. 2021, 13, 2698. [Google Scholar] [CrossRef]
  7. Stamou, A.; Bakousi, A.; Dosiou, A.; Tsifodimou, Z.-E.; Karachaliou, E.; Tavantzis, I.; Stylianidis, E. Mapping Drought Incidents in the Mediterranean Region with Remote Sensing: A Step Toward Climate Adaptation. Land 2025, 14, 1564. [Google Scholar] [CrossRef]
  8. Sakellariou, S.; Dalezios, N.R.; Spiliotopoulos, M.; Alpanakis, N.; Faraslis, I.; Tziatzios, G.A.; Sidiropoulos, P.; Dercas, N.; Dom, A.; Mart, H.; et al. Remotely Sensed Comparative Spatiotemporal Analysis of Drought and Wet Periods in Distinct Mediterranean Agroecosystems. Remote Sens. 2024, 16, 3652. [Google Scholar] [CrossRef]
  9. Lazoglou, G.; Papadopoulos-Zachos, A.; Georgiades, P.; Zittis, G.; Velikou, K.; Manios, E.M.; Anagnostopoulou, C. Identification of Climate Change Hotspots in the Mediterranean. Sci. Rep. 2024, 14, 29817. [Google Scholar] [CrossRef]
  10. Vicente-Serrano, S.M.; Beguería, S.; López-Moreno, J.I. A Multiscalar Drought Index Sensitive to Global Warming: The Standardized Precipitation Evapotranspiration Index. J. Clim. 2010, 23, 1696–1718. [Google Scholar] [CrossRef]
  11. Zhang, J.; Ding, J.; Wu, P.; Tan, J.; Huang, S.; Teng, D.; Cao, X.; Wang, J.; Chen, W. Assessing Arid Inland Lake Watershed Area and Vegetation Response to Multiple Temporal Scales of Drought across the Ebinur Lake Watershed. Sci. Rep. 2020, 10, 1354. [Google Scholar] [CrossRef]
  12. Gebrechorkos, S.H.; Peng, J.; Dyer, E.; Miralles, D.G.; Vicente-Serrano, S.M.; Funk, C.; Beck, H.E.; Asfaw, D.T.; Singer, M.B.; Dadson, S.J. Global High-Resolution Drought Indices for 1981–2022. Earth Syst. Sci. Data Discuss. 2023, 15, 5449–5466. [Google Scholar] [CrossRef]
  13. Zhong, S.; Sun, Z.; Di, L. Characteristics of Vegetation Response to Drought in the CONUS Based on Long-Term Remote Sensing and Meteorological Data. Ecol. Indic. 2021, 127, 107767. [Google Scholar] [CrossRef]
  14. Tucker, C.J. Red and Photographic Infrared Linear Combinations for Monitoring Vegetation. Remote Sens. Environ. 1979, 8, 127–150. [Google Scholar] [CrossRef]
  15. Liu, Q.; Yao, F.; Garcia-Garcia, A.; Zhang, J.; Li, J.; Ma, S.; Li, S.; Peng, J. The Response and Sensitivity of Global Vegetation to Water Stress: A Comparison of Different Satellite-Based NDVI Products. Int. J. Appl. Earth Obs. Geoinf. 2023, 120, 103341. [Google Scholar] [CrossRef]
  16. Naiman, R.J.; Decamps, H. The Ecology of Interfaces: Riparian Zones. Annu. Rev. Ecol. Syst. 1997, 28, 621–658. [Google Scholar] [CrossRef]
  17. Mliyeh, M.M.; Ait Brahim, Y.; Koutsovili, E.-I.; Tzoraki, O.; Zian, A.; Aqnouy, M.; Benaabidate, L. Multi-Index Approach to Assess and Monitor Meteorological and Agricultural Drought in the Mediterranean Region: Case of the Upper Oum Er Rabia Watershed, Morocco. Water 2024, 16, 3104. [Google Scholar] [CrossRef]
  18. Vazini Ahghar, E.; Shah-Hosseini, R.; Nazari, B.; Dodangeh, P.; Mousavi, S.M. Assessment of Drought in Agricultural Areas by Combining Meteorological and Remote Sensing Data. Proceedings 2023, 87, 28. [Google Scholar] [CrossRef]
  19. Lv, W.; Wu, C.; Yeh, P.J.-F.; Hu, B.X. Spatio-Temporal Variability of Dryness and Wetness Based on Standardized Precipitation Evapotranspiration Index and Standardized Wetness Index and Its Relation to the Normalized Difference Vegetation Index. Int. J. Climatol. 2021, 42, 671–690. [Google Scholar] [CrossRef]
  20. Gouveia, C.M.; Trigo, R.M.; Beguería, S.; Vicente-Serrano, S.M. Drought Impacts on Vegetation Activity in the Mediterranean Region: An Assessment Using Remote Sensing Data and Multi-Scale Drought Indicators. Glob. Planet. Chang. 2017, 151, 15–27. [Google Scholar] [CrossRef]
  21. Idso, S.B.; Jackson, R.D.; Pinter, P.J., Jr.; Reginato, R.J.; Hatfield, J.L. Normalizing the Stress-Degree-Day Parameter for Environmental Variability. Agric. Meteorol. 1981, 24, 45–55. [Google Scholar] [CrossRef]
  22. Ciężkowski, W.; Szporak-Wasilewska, S.; Kleniewska, M.; Jóźwiak, J.; Gnatowski, T.; Dąbrowski, P.; Góraj, M.; Szatyłowicz, J.; Ignar, S.; Chormański, J. Remotely Sensed Land Surface Temperature-Based Water Stress Index for Wetland Habitats. Remote Sens. 2020, 12, 631. [Google Scholar] [CrossRef]
  23. Mliyeh, M.M.; Aqnouy, M.; Laaraj, M.; Bouizrou, I.; Tariq, A.; Benaabidate, L.; Kraiem, H.; Shitu, K. Assessing Drought Dynamics in a Semi-Arid Basin: A Multi-Index Approach Using Hydrological and Remote-Sensing Indicators. Environ. Sci. Eur. 2025, 37, 180. [Google Scholar] [CrossRef]
  24. Woolway, R.I.; Merchant, C.J. Worldwide Alteration of Lake Mixing Regimes in Response to Climate Change. Nat. Geosci. 2019, 12, 271–276. [Google Scholar] [CrossRef]
  25. Dimitriou, E.; Moussoulis, E. Hydrological and Nitrogen Distributed Catchment Modeling to Assess the Impact of Future Climate Change at Trichonis Lake, Western Greece. Hydrogeol. J. 2010, 18, 441–454. [Google Scholar] [CrossRef]
  26. Perivolioti, T.M.; Mouratidis, A.; Terzopoulos, D.; Kalaitzis, P.; Ampatzidis, D.; Tušer, M.; Frouzova, J.; Bobori, D. Production, Validation and Morphometric Analysis of a Digital Terrain Model for Lake Trichonis Using Geospatial Technologies and Hydroacoustics. ISPRS Int. J. Geo-Inf. 2021, 10, 91. [Google Scholar] [CrossRef]
  27. Tompoulidou, M.; Karadimou, E.; Apostolakis, A.; Tsiaoussi, V. A Geographic Object-Based Image Approach Based on the Sentinel-2 Multispectral Instrument for Lake Aquatic Vegetation Mapping: A Complementary Tool to In Situ Monitoring. Remote Sens. 2024, 16, 916. [Google Scholar] [CrossRef]
  28. Kehayias, G.; Doulka, E. Trophic State Evaluation of a Large Mediterranean Lake Utilizing Abiotic and Biotic Elements. J. Environ. Prot. 2014, 5, 17. [Google Scholar] [CrossRef][Green Version]
  29. Perivolioti, T.-M.; Frouzova, J.; Tušer, M.; Bobori, D. Assessing the Fish Stock Status in Lake Trichonis: A Hydroacoustic Approach. Water 2020, 12, 1823. [Google Scholar] [CrossRef]
  30. Bertahas, I.; Dimitriou, E.; Karaouzas, I.; Laschou, S.; Zacharias, I. Climate Change and Agricultural Pollution Effects on the Trophic Status of a Mediterranean Lake. Acta Hydrochim. Hydrobiol. 2006, 34, 349–359. [Google Scholar] [CrossRef]
  31. Petriki, O.; Moutopoulos, D.K.; Tsagarakis, K.; Tsionki, I.; Papantoniou, G.; Mantzouni, I.; Barbieri, R.; Stoumboudi, M.T. Assessing the Fisheries and Ecosystem Structure of the Largest Greek Lake (Lake Trichonis). Water 2021, 13, 3329. [Google Scholar] [CrossRef]
  32. Nikolopoulou, I.; Mavromati, E.; Moschandreou, K.; Navrozidou, V.; Kemitzoglou, D.; Tsiaoussi, V. Lake Phytoplankton Status and Trends: A Case Study from Greek Lakes, Eastern Mediterranean. Environ. Monit. Assess. 2025, 197, 733. [Google Scholar] [CrossRef]
  33. Kagalou, I.; Ntislidou, C.; Latinopoulos, D.; Kemitzoglou, D.; Tsiaoussi, V.; Bobori, D.C. Setting the Phosphorus Boundaries for Greek Natural Shallow and Deep Lakes for Water Framework Directive Compliance. Water 2021, 13, 739. [Google Scholar] [CrossRef]
  34. Efthimiou, G.; Stergiannis, P. Structure of a Riparian Forests in Western Greece. For. IDEAS 2023, 29, 130–145. [Google Scholar]
  35. Psilovikos, A.; Albanakis, K.; Palikaridis, C.; Vouvalidis, K. Enironmental Value and Importance of Lake Trichonis as the Largest Natural Freshwater Reservoir of Greece. In Proceedings of the 4th Panhellenic Geographical Conference, Athens, Greece, 12–14 October 1995; pp. 348–358. [Google Scholar]
  36. Gourgouletis, N.; Baltas, E. Investigating Hydroclimatic Variables Trends on the Natural Lakes of Western Greece Using Earth Observation Data. Sensors 2023, 23, 2056. [Google Scholar] [CrossRef]
  37. Dimitriou, E.; Zacharias, I. Identifying Microclimatic, Hydrologic and Land Use Impacts on a Protected Wetland Area by Using Statistical Models and GIS Techniques. Math. Comput. Model. 2010, 51, 200–205. [Google Scholar] [CrossRef]
  38. Kottek, M.; Grieser, J.; Beck, C.; Rudolf, B.; Rubel, F. World Map of the Köppen-Geiger Climate Classification Updated. Meteorol. Z. 2006, 15, 259–263. [Google Scholar] [CrossRef] [PubMed]
  39. Zacharias, I.; Dimitriou, E.; Koussouris, T. Integrated Water Management Scenarios for Wetland Protection: Application in Trichonis Lake. Environ. Model. Softw. 2005, 20, 177–185. [Google Scholar] [CrossRef]
  40. Zacharias, I.; Bertachas, I.; Skoulikidis, N.; Koussouris, T. Greek Lakes: Limnological Overview. Lakes Reserv. Res. Manag. 2002, 7, 55–62. [Google Scholar] [CrossRef]
  41. Zervas, D.; Tsiaoussi, V.; Tsiripidis, I. HeLM: A Macrophyte-Based Method for Monitoring and Assessment of Greek Lakes. Environ. Monit. Assess. 2018, 190, 326. [Google Scholar] [CrossRef] [PubMed]
  42. Luther, H.; Rzoska, J. Project Aqua: A Source Book of Inland Waters Proposed for Conservation; Blackwell Scientific Publications: Oxford, UK; Edinburgh, UK, 1971. [Google Scholar]
  43. Beguería, S.; Serrano, S.M.V.; Reig-Gracia, F.; Garcés, B.L. SPEIbase v.2.9 [Dataset]. 2023. Available online: https://digital.csic.es/handle/10261/332007 (accessed on 1 November 2025).
  44. Tomas-Burguera, M.; Vicente-Serrano, S.M.; Peña-Angulo, D.; Domínguez-Castro, F.; Noguera, I.; El Kenawy, A. Global Characterization of the Varying Responses of the Standardized Precipitation Evapotranspiration Index to Atmospheric Evaporative Demand. J. Geophys. Res. Atmos. 2020, 125, e2020JD033017. [Google Scholar] [CrossRef]
  45. Didan, K. MOD13Q1 MODIS/Terra Vegetation Indices 16-Day L3 Global 250m SIN Grid V006; [Dataset]; NASA Land Processes Distributed Active Archive Center: Sioux Falls, SD, USA, 2015. [Google Scholar] [CrossRef]
  46. Jackson, R.D.; Idso, S.B.; Reginato, R.J.; Pinter, P.J., Jr. Canopy Temperature as a Crop Water Stress Indicator. Water Resour. Res. 1981, 17, 1133–1138. [Google Scholar] [CrossRef]
  47. Mu, Q.; Zhao, M.; Running, S.W. Improvements to a MODIS Global Terrestrial Evapotranspiration Algorithm. Remote Sens. Environ. 2011, 115, 1781–1800. [Google Scholar] [CrossRef]
  48. Running, S.; Mu, Q.; Zhao, M.; Moreno, A. MODIS/Terra Net Evapotranspiration Gap-Filled 8-Day L4 Global 500m SIN Grid V061; [Data Set]; NASA EOSDIS Land Processes Distributed Active Archive Center: Sioux Falls, SD, USA, 2021. [Google Scholar] [CrossRef]
  49. Liu, C.; Sun, G.; McNulty, S.G.; Noormets, A.; Fang, Y. Environmental Controls on Seasonal Ecosystem Evapotranspiration/Potential Evapotranspiration Ratio as Determined by the Global Eddy Flux Measurements. Hydrol. Earth Syst. Sci. 2017, 21, 311–322. [Google Scholar] [CrossRef]
  50. Mann, H.B. Nonparametric Tests against Trend. Econom. J. Econom. Soc. 1945, 13, 245–259. [Google Scholar] [CrossRef]
  51. Kendall, M.G. Rank Correlation Methods; Griffin: London, UK, 1975. [Google Scholar]
  52. Sen, P.K. Estimates of the Regression Coefficient Based on Kendall’s Tau. J. Am. Stat. Assoc. 1968, 63, 1379–1389. [Google Scholar] [CrossRef]
  53. Gorelick, N.; Hancher, M.; Dixon, M.; Ilyushchenko, S.; Thau, D.; Moore, R. Google Earth Engine: Planetary-Scale Geospatial Analysis for Everyone. Remote Sens. Environ. 2017, 202, 18–27. [Google Scholar] [CrossRef]
  54. Spinoni, J.; Vogt, J.V.; Naumann, G.; Barbosa, P.; Dosio, A. Will Drought Events Become More Frequent and Severe in Europe? Int. J. Climatol. 2018, 38, 1718–1736. [Google Scholar] [CrossRef]
  55. Páscoa, P.; Russo, A.; Gouveia, C.M.; Soares, P.M.M.; Cardoso, R.M.; Careto, J.A.M.; Ribeiro, A.F.S. A High-Resolution View of the Recent Drought Trends over the Iberian Peninsula. Weather Clim. Extrem. 2021, 32, 100320. [Google Scholar] [CrossRef]
  56. Sánchez, D.E.; Cantos, J.O. One Country, Several Droughts: Characterisation, Evolution, and Trends in Meteorological Droughts in Spain Within the Context of Climate Change. Climate 2025, 13, 202. [Google Scholar] [CrossRef]
  57. Vicente-Serrano, S.M.; McVicar, T.R.; Miralles, D.G.; Yang, Y.; Tomas-Burguera, M. Unraveling the Influence of Atmospheric Evaporative Demand on Drought and Its Response to Climate Change. Wiley Interdiscip. Rev. Clim. Chang. 2020, 11, e632. [Google Scholar] [CrossRef]
  58. Perez, M.; Lombardi, D.; Bardino, G.; Vitale, M. Drought Assessment through Actual Evapotranspiration in Mediterranean Vegetation Dynamics. Ecol. Indic. 2024, 166, 112359. [Google Scholar] [CrossRef]
  59. Vicente-Serrano, S.M.; Azorin-Molina, C.; Peña-Gallardo, M.; Tomas-Burguera, M.; Domínguez-Castro, F.; Martín-Hernández, N.; Beguería, S.; El Kenawy, A.; Noguera, I.; García, M. A High-Resolution Spatial Assessment of the Impacts of Drought Variability on Vegetation Activity in Spain from 1981 to 2015. Nat. Hazards Earth Syst. Sci. 2019, 19, 1189–1213. [Google Scholar] [CrossRef]
  60. Parida, B.R.; Pandey, A.C.; Patel, N.R. Greening and Browning Trends of Vegetation in India and Their Responses to Climatic and Non-Climatic Drivers. Climate 2020, 8, 92. [Google Scholar] [CrossRef]
  61. Zhou, Y.; Fan, J.; Wang, X. Assessment of Varying Changes of Vegetation and the Response to Climatic Factors Using GIMMS NDVI3g on the Tibetan Plateau. PLoS ONE 2020, 15, e0234848. [Google Scholar] [CrossRef]
  62. Fu, Z.; Ciais, P.; Prentice, I.C.; Gentine, P.; Makowski, D.; Bastos, A.; Luo, X.; Green, J.K.; Stoy, P.C.; Yang, H.; et al. Atmospheric Dryness Reduces Photosynthesis along a Large Range of Soil Water Deficits. Nat. Commun. 2022, 13, 989. [Google Scholar] [CrossRef]
  63. Wang, H.; Li, Z.; Cao, L.; Feng, R.; Pan, Y. Response of NDVI of Natural Vegetation to Climate Changes and Drought in China. Land 2021, 10, 966. [Google Scholar] [CrossRef]
  64. Mehmood, K.; Anees, S.A.; Muhammad, S.; Hussain, K.; Shahzad, F.; Liu, Q.; Ansari, M.J.; Alharbi, S.A.; Khan, W.R. Analyzing Vegetation Health Dynamics across Seasons and Regions through NDVI and Climatic Variables. Sci. Rep. 2024, 14, 11775. [Google Scholar] [CrossRef] [PubMed]
  65. Yin, M.; Yin, Y.; Zong, X.; Deng, H. Global Vegetation Vulnerability to Drought Is Underestimated Due to the Lagged Effect. Agric. For. Meteorol. 2025, 364, 110451. [Google Scholar] [CrossRef]
  66. Du, Y.; Lv, S.; Wang, F.; Xu, J.; Zhao, H.; Tang, L.; Wang, H.; Zhang, H. Investigation into the Temporal Impacts of Drought on Vegetation Dynamics in China during 2000 to 2022. Sci. Rep. 2025, 15, 6351. [Google Scholar] [CrossRef]
  67. Anderson, M.C.; Hain, C.; Wardlow, B.; Pimstein, A.; Mecikalski, J.R.; Kustas, W.P. Evaluation of Drought Indices Based on Thermal Remote Sensing of Evapotranspiration over the Continental United States. J. Clim. 2011, 24, 2025–2044. [Google Scholar] [CrossRef]
  68. Maes, W.H.; Steppe, K. Estimating Evapotranspiration and Drought Stress with Ground-Based Thermal Remote Sensing in Agriculture: A Review. J. Exp. Bot. 2012, 63, 4671–4712. [Google Scholar] [CrossRef]
  69. O’Reilly, C.M.; Sharma, S.; Gray, D.K.; Hampton, S.E.; Read, J.S.; Rowley, R.J.; Schneider, P.; Lenters, J.D.; McIntyre, P.B.; Kraemer, B.M. Rapid and Highly Variable Warming of Lake Surface Waters around the Globe. Geophys. Res. Lett. 2015, 42, 10–773. [Google Scholar] [CrossRef]
  70. Zisenis, M. Is the Natura 2000 Network of the European Union the Key Land Use Policy Tool for Preserving Europe’s Biodiversity Heritage? Land Use Policy 2017, 69, 408–416. [Google Scholar] [CrossRef]
  71. Gałka, M.; Aunina, L.; Feurdean, A.; Hutchinson, S.; Kołaczek, P.; Apolinarska, K. Rich Fen Development in CE Europe, Resilience to Climate Change and Human Impact over the Last ca. 3500 Years. Palaeogeogr. Palaeoclimatol. Palaeoecol. 2017, 473, 57–72. [Google Scholar] [CrossRef]
  72. Gałka, M.; Feurdean, A.; Hutchinson, S.; Milecka, K.; Tanţău, I.; Apolinarska, K. Response of a Spring-Fed Fen Ecosystem in Central Eastern Europe (NW Romania) to Climate Changes during the Last 4000 Years: A High Resolution Multi-Proxy Reconstruction. Palaeogeogr. Palaeoclimatol. Palaeoecol. 2018, 504, 170–185. [Google Scholar] [CrossRef]
  73. Mauquoy, D.; Van Geel, B.; Scott, A.E. Plant Macrofossil Methods and Studies: Mire and Peat Macros. In Encyclopedia of Quaternary Science; Elsevier Science: Amsterdam, The Netherlands, 2013. [Google Scholar]
Figure 1. Geographical location of the Trichonida basin in Greece, including watershed boundary, spatial coordinate grid references, Natura 2000 protected areas, and land-use/land-cover (LULC) distribution within the catchment.
Limnolrev 26 00022 g001
Figure 2. Temporal evolution of the SPEI at multiple time scales (SPEI-1, SPEI-2, SPEI-6, SPEI-9, and SPEI-12) from 2000 to 2023.
Limnolrev 26 00022 g002
Figure 3. Time series of monthly mean NDVI from 2000 to 2023.
Limnolrev 26 00022 g003
Figure 4. Spatial distribution of NDVI trends for the period of 2013–2025 derived from Landsat imagery. Trend magnitude was estimated using the Theil–Sen slope (ΔNDVI/yr), while statistical significance was assessed using the Mann–Kendall test.
Limnolrev 26 00022 g004
Figure 5. Time series of monthly mean NDVI by land cover from 2013 to 2025.
Limnolrev 26 00022 g005
Figure 6. Relationship between monthly lake surface water temperature and fen NDVI (2015–2024).
Limnolrev 26 00022 g006
Figure 7. Seasonal Pearson correlation coefficients between land-cover-specific NDVI and lake surface water temperature.
Limnolrev 26 00022 g007
Figure 8. Temporal variation in the monthly mean CWSI from 2000 to 2023.
Limnolrev 26 00022 g008
Figure 9. Spatial distribution of CWSI trends across the Trichonida basin for the period of 2013–2025 derived from Landsat imagery using the Theil–Sen slope estimator.
Limnolrev 26 00022 g009
Figure 10. Monthly time series of lake water temperature over the period of 2015–2024.
Limnolrev 26 00022 g010
Figure 11. Spatial distribution of mean lake water surface temperature over the period of 2015–2024. Colors indicate temperature magnitude (blue: low, red: high), and the dashed line shows the mean value.
Limnolrev 26 00022 g011
Figure 12. Correlation analysis between climatic drought (SPEI), vegetation greenness (NDVI), and vegetation water stress (CWSI), expressed using Pearson correlation.
Limnolrev 26 00022 g012
Figure 13. Seasonal correlations between SPEI, NDVI, and CWSI.
Limnolrev 26 00022 g013
Figure 14. Location of the calcareous fen complex at Lake Trichonida derived from satellite imagery (top panels) and representative field photographs (taken 21 February 2026), highlighting vegetation structure and hydrological conditions (bottom panels).
Limnolrev 26 00022 g014
Figure 15. Monthly NDVI values of calcareous fens (green line, derived by Sentinel-2 data), NDVI values of calcareous fens (orange line, derived by Landsat data), and water level (m) (blue line).
Limnolrev 26 00022 g015
Table 1. Pearson correlation coefficients (r) and associated p-values between SPEI at different time scales, NDVI, and CWSI.
RelationshipCorrelation (r) p-Value
NDVI-SPEINDVI–SPEI-1+0.100.085
NDVI–SPEI-3+0.190.0015
NDVI–SPEI-6+0.190.0014
NDVI–SPEI-9+0.150.010
NDVI–SPEI-12+0.150.013
CWSI-SPEICWSI–SPEI-1−0.150.009
CWSI–SPEI-3−0.110.068
CWSI–SPEI-6−0.170.003
CWSI–SPEI-9−0.150.011
CWSI–SPEI-12−0.070.21
NDVI-CWSI−0.37<0.0000001
Disclaimer/Publisher’s Note: The statements, opinions and data contained in all publications are solely those of the individual author(s) and contributor(s) and not of MDPI and/or the editor(s). MDPI and/or the editor(s) disclaim responsibility for any injury to people or property resulting from any ideas, methods, instructions or products referred to in the content.