1. Introduction
Aquatic vegetation is a vital component of freshwater ecosystems, providing numerous ecological services, such as habitats for aquatic life, stabilization of shorelines, and regulation of water quality [
1,
2]. Aquatic vegetation also plays an essential role in nutrient cycling, carbon sequestration, and the overall functioning of aquatic environments. Therefore, monitoring and analysis of aquatic vegetation are key components for understanding ecosystem health, particularly in shallow lakes where the vegetation coverage is often more pronounced and sensitive to environmental changes [
3]. Changes in aquatic vegetation are often indicative of broader environmental shifts, such as nutrient loading, water temperature fluctuations, and hydrological alterations, making the accurate assessment of these changes crucial for effective lake management and conservation [
4,
5].
Traditionally, aquatic vegetation monitoring has relied on ground surveys, which are both costly and time-consuming. However, satellite remote sensing offers an efficient, cost-effective, and near-real-time solution for large-scale and continuous vegetation monitoring. Satellite remote sensing technology has revolutionized the way aquatic environments are monitored. With the ability to cover vast areas in a cost-effective and timely manner, satellite imagery has become an invaluable tool for environmental monitoring [
6,
7]. Among the most widely used remote sensing satellites are the Sentinel-2 missions, which provide high-resolution multispectral images with frequent revisit intervals. Sentinel-2 is an ideal tool for monitoring dynamic phenomena such as aquatic vegetation, particularly in regions where in situ measurements remain challenging or impractical [
8,
9,
10].
Aquatic vegetation could be classified into three main types: Submerged Aquatic Vegetation (SAV), Floating and Emergent Aquatic Vegetation (FEAV), and Algal Blooms (ABs). SAV consists of plants that grow entirely underwater, either without roots or with roots anchored in the sediment. SAV provides habitats, stabilizes sediments, reduces turbidity, and contributes to oxygenation. Commonly, SAV samples thrive in nutrient-rich, clear water. FEAV includes plants that either float on the water’s surface or grow in shallow water with roots submerged. Floating plants derive nutrients from the water, while Emergent plants extend above the surface. FEAV supports aquatic life, mitigates wave action, and helps excess nutrients absorption. ABs occur when algae overproduce, typically due to excess nutrients, warm temperatures, and calm water. These blooms lead to hypoxia, fish kills, and even toxin production harmful for health. They are often driven by anthropogenic factors such as agricultural runoff and industrial discharges. Each type (SAV, FEAV, and ABs) plays a vital role in aquatic ecosystems and is influenced by natural and human factors. Understanding aquatic vegetation types is essential for managing and conserving shallow lakes [
11].
This study aims to monitor and analyze the spatiotemporal dynamics of aquatic vegetation in Chimaditida Shallow Lake, located in northern Greece, by utilizing Sentinel-2 satellite imagery time series. This research specifically focuses on the utilization of two well-established vegetation indices, i.e., the Modified Normalized Difference Water Index (MNDWI) and the Normalized Difference Vegetation Index (NDVI), to quantify and track changes in aquatic vegetation coverage and water quantity. These indices are effective in distinguishing between water and vegetation, providing insight into the extent of SAV and FEAV, as well as the overall health of the aquatic environment [
9,
12].
The MNDWI is handy for highlighting areas of open water and aquatic vegetation by enhancing the reflectance of water bodies. It is a valuable index tool for detecting changes in water levels and identifying submerged aquatic plants [
9,
13]. Furthermore, the NDVI is a widely used vegetation index that assesses the density and health of vegetation by comparing the reflectance of light in the red and near-infrared spectra [
8,
9]. By applying both indices to time-series data, this study aims to assess how seasonal and climatic variations influence aquatic vegetation in Chimaditida Lake.
Chimaditida Lake is an ideal case study for this research, due to its ecological importance and vulnerability. As one of the shallow lakes in Greece, it faces a range of pressures from both natural and human-induced factors, such as eutrophication, invasive species, and land-use changes in the surrounding watershed. Furthermore, the lake has been subject to fluctuations in water quality and vegetation cover in recent years, making it a key site for monitoring and understanding spatiotemporal changes [
14].
Several recent studies have been conducted to enhance the accuracy of aquatic vegetation monitoring in shallow lakes. For instance, in the study of [
15], an automatic SAV classification algorithm was developed based on Landsat imagery, where the thresholds of two key parameters (the floating algae index (FAI) and reflectance in the shortwave-infrared (SWIR) band) are automatically determined. The algorithm was applied to four Yangtze Plain Lakes in China. The mean producer accuracy obtained was 82.9%. Moreover, ref. [
16], used Landsat and Sentinel-2 imagery to analyze the phenological characteristics and long-term spatial distribution of SAV in Baiyangdian Lake, China, from 1986 to 2021. The results showed that the analysis of NDVI time series accurately reflected SAV phenology. A decision tree based on the NDVI and MNDWI achieved 89.7% accuracy in identifying SAV. The distribution of SAV showed dramatic changes, with periods of shrinkage, expansion, degeneration, and early recovery, providing valuable insights for ecological restoration and management of shallow lake ecosystems. Accordingly, ref. [
17] presented a method to map aquatic vegetation in a large, shallow eutrophic lake in China, named Taihu Lake, using MODIS data from 2003 to 2013. Their approach involves frequency analysis of the FAI to reduce the impact of floating algae on vegetation mapping. Their method was validated against 244 in situ measurements, achieving overall classification accuracies ranging from 73% to 88% (from 2008 to 2012). The aquatic vegetation area varied from 265.94 km
2 in 2007 to 503.38 km
2 in 2008, with an average of 359.62 ± 69.20 km
2 over 11 years. Their findings highlight significant changes in aquatic vegetation distribution during the study period. Moreover, in the study of [
18], the performance of classical and modern Artificial Intelligence (AI) tools was compared, including logistic regression, random forest, and the Segment Anything Model (SAM), for mapping underwater aquatic vegetation (UVeg) using limited annotations in Polyphytos Lake, Greece. This study shows that SAM did much better than logistic regression and random forest when trained on just 40 positive and negative pixel pairs, reaching an F1 score of 86.5% (±4.1%) using airborne images with a 3–6 cm ground sampling distance. However, SAM struggled with space-borne imagery (WorldView-2, Sentinel-2) and did not surpass classical models. Finally, they highlight the challenges of AI tools for UVeg mapping. The authors of [
10] used Sentinel-2 satellite images from 2016 to 2022 to monitor spatiotemporal changes of aquatic vegetation in Futou Lake, Hubei Province, China, before and after the removal of a fence. Two vegetation indices, the NDVI and SAVI, were applied using Otsu and manual threshold methods. The results showed that the NDVI and manual division threshold method performed best, achieving 94.44% classification accuracy and a Kappa coefficient of 85.23%. They indicated that the growth of aquatic vegetation occurred in stages, i.e., limited growth in 2016–2017 and rapid growth from 2018 to 2022. The aquatic vegetation was primarily distributed around the former fence and spread to the lake’s core. Dominant species like
Potamogeton crispus L., 1753 [
19] and
Trapa L., 1753 [
19] reached a peak in 2021, covering 50.89 km
2, requiring moderate control. The significant increase in
Potamogeton crispus is attributed to sedimentation and nutrient accumulation. Furthermore, [
9] developed a phenology–pixel method to improve the accuracy of remote sensing for SAV detection in Baiyangdian Shallow Lake in China. Using Sentinel-2 images, their method identifies the distribution and growth periods of SAV, distinguishing different plant species and addressing issues like water level fluctuations and mixed-pixel problems. Their method achieved 94.8% overall accuracy, 93.3% user’s accuracy, and 87.3% producer’s accuracy. Their study results provide valuable data for lake ecosystem monitoring and restoration.
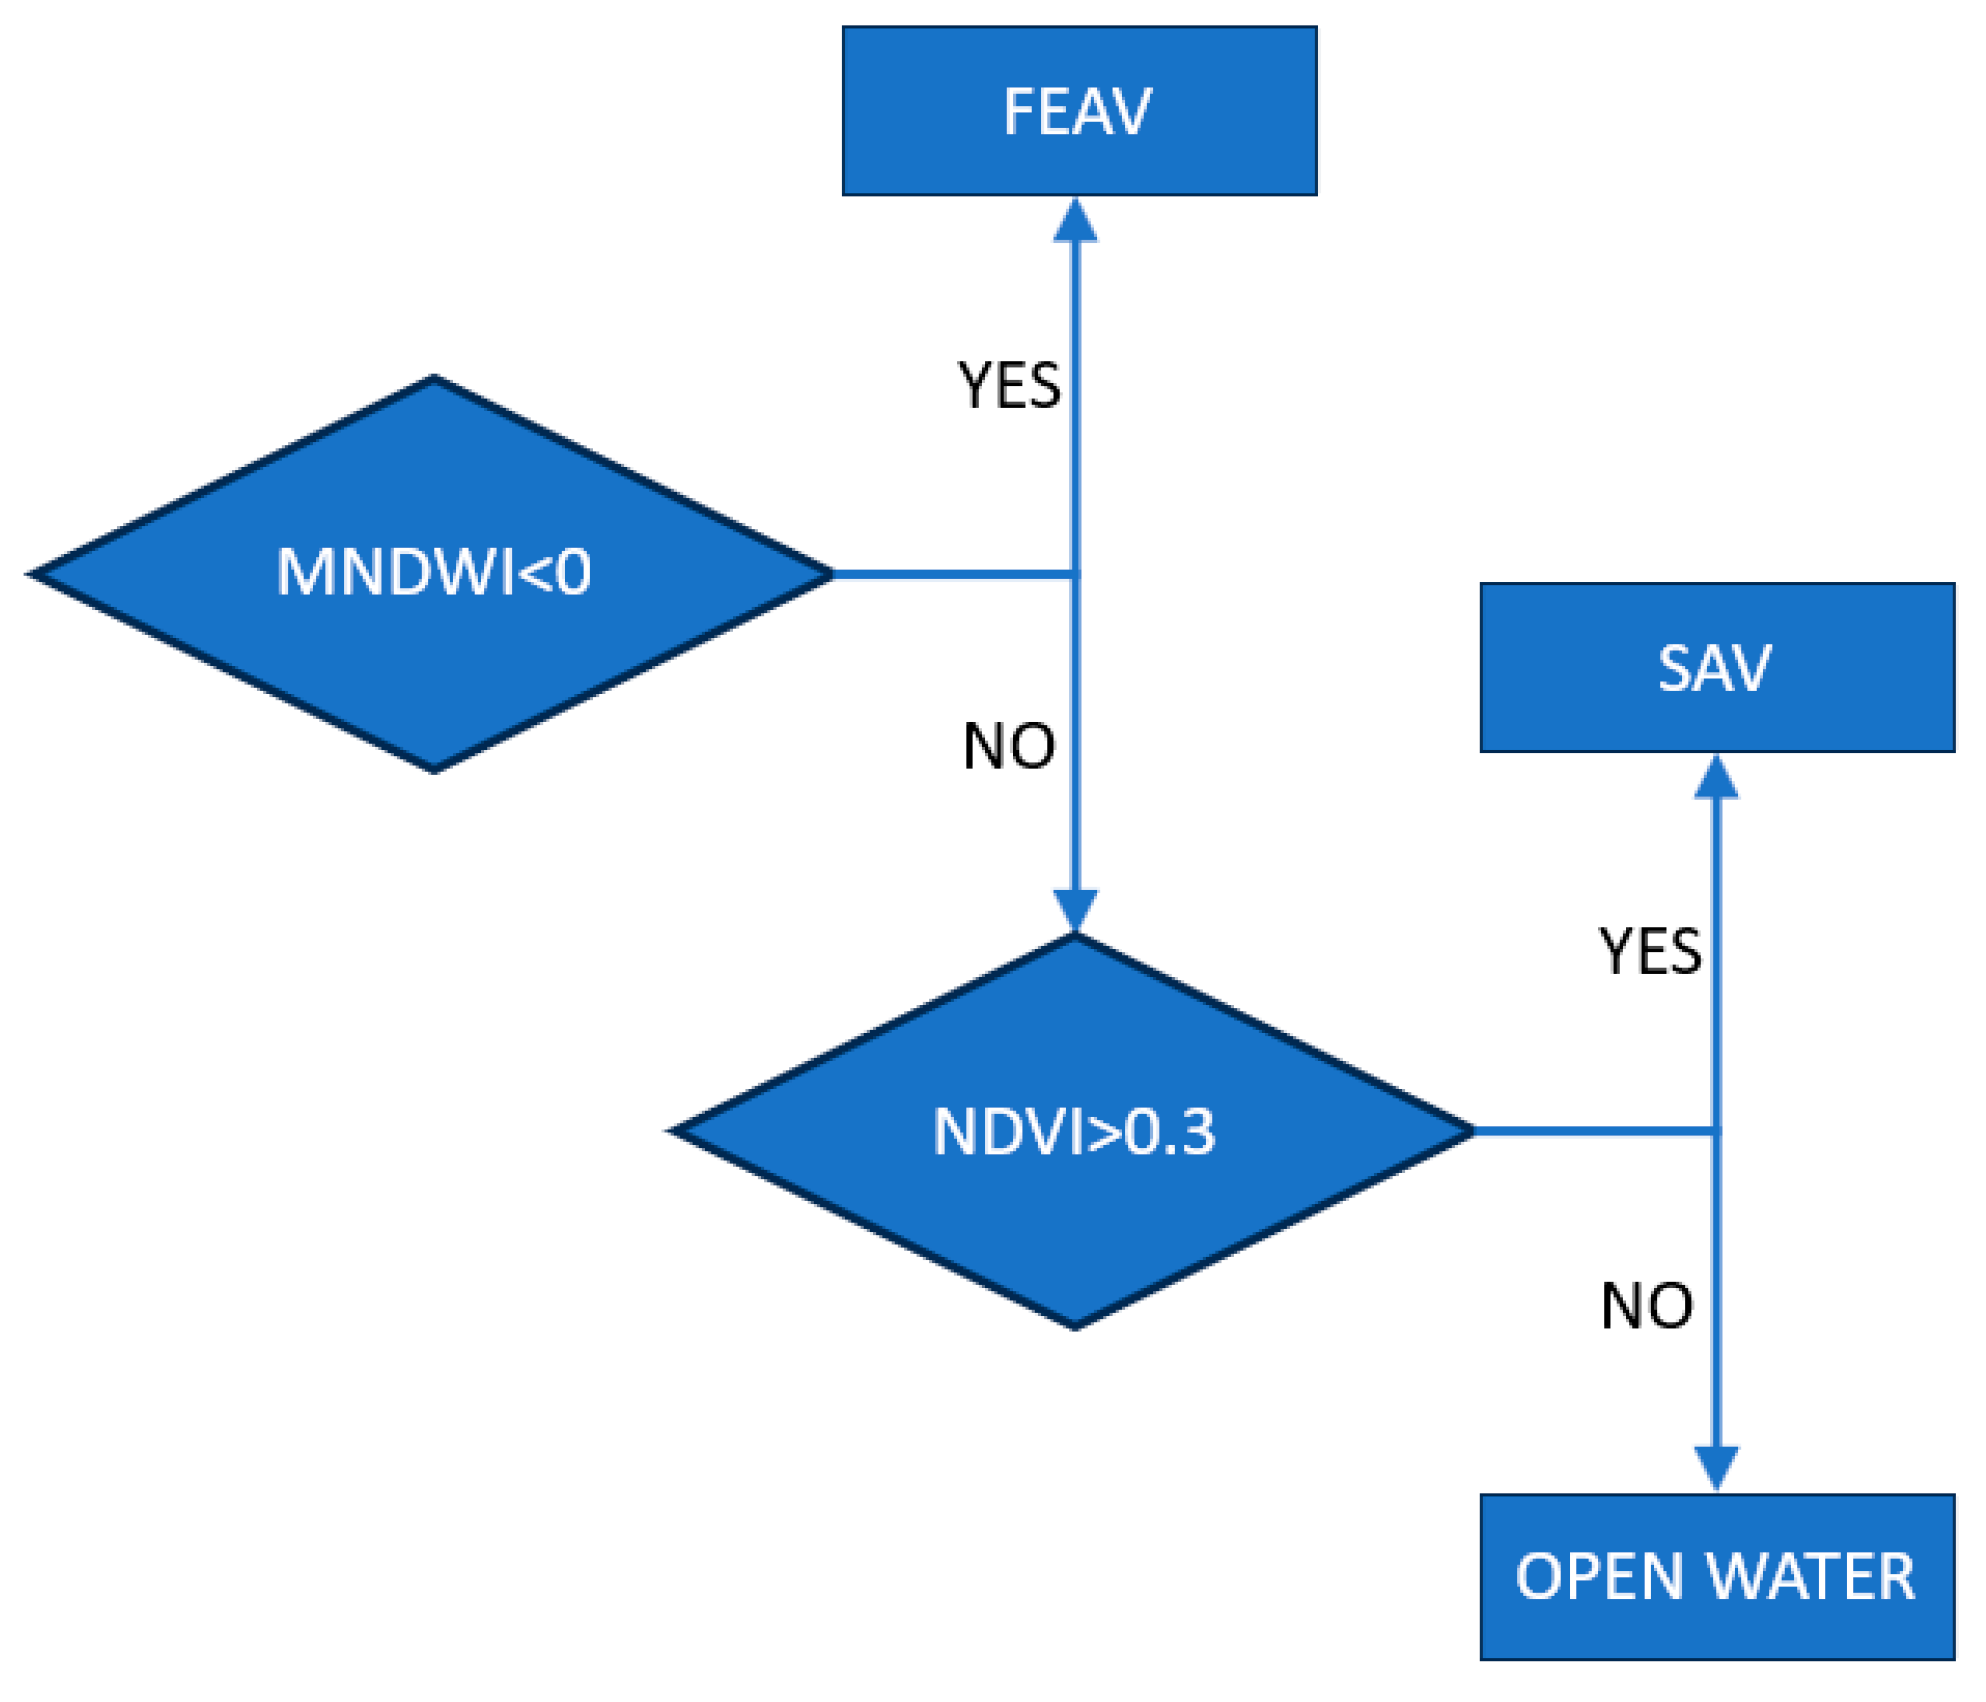
By leveraging Sentinel-2 imagery and vegetation indices at Chimaditida Shallow Lake in Greece from 1 March 2024 to 28 February 2025, this research aims to offer a comprehensive approach to monitor aquatic vegetation dynamics over time, providing valuable information on the impacts of environmental changes and human activities on the lake’s ecosystem. The aquatic vegetation of Chimaditida mainly consists of FEAV. Consequently, we developed an algorithm for the automatic monitoring of aquatic vegetation that focuses on distinguishing and mapping two primary classes commonly found in freshwater ecosystems: FEAV and open water (areas without vegetation). Several indicators, obtained through algebraic combinations of satellite bands, were utilized within a multicriteria hierarchical analysis framework, built upon a validated thresholding method. The proposed approach was validated using field measurements obtained from an aerial survey using a DJI Matrice M200 quadcopter UAS with a Parrot Sequoia multispectral camera on board (DJI, Shenzhen, China). This study could contribute to better-informed management practices for Chimaditida Lake, supporting efforts to maintain biodiversity, water quality, and overall ecosystem health. Moreover, the methodology developed in this study can be applied to other freshwater ecosystems facing similar challenges, advancing the role of remote sensing in aquatic ecosystem management and conservation.
2. Study Area
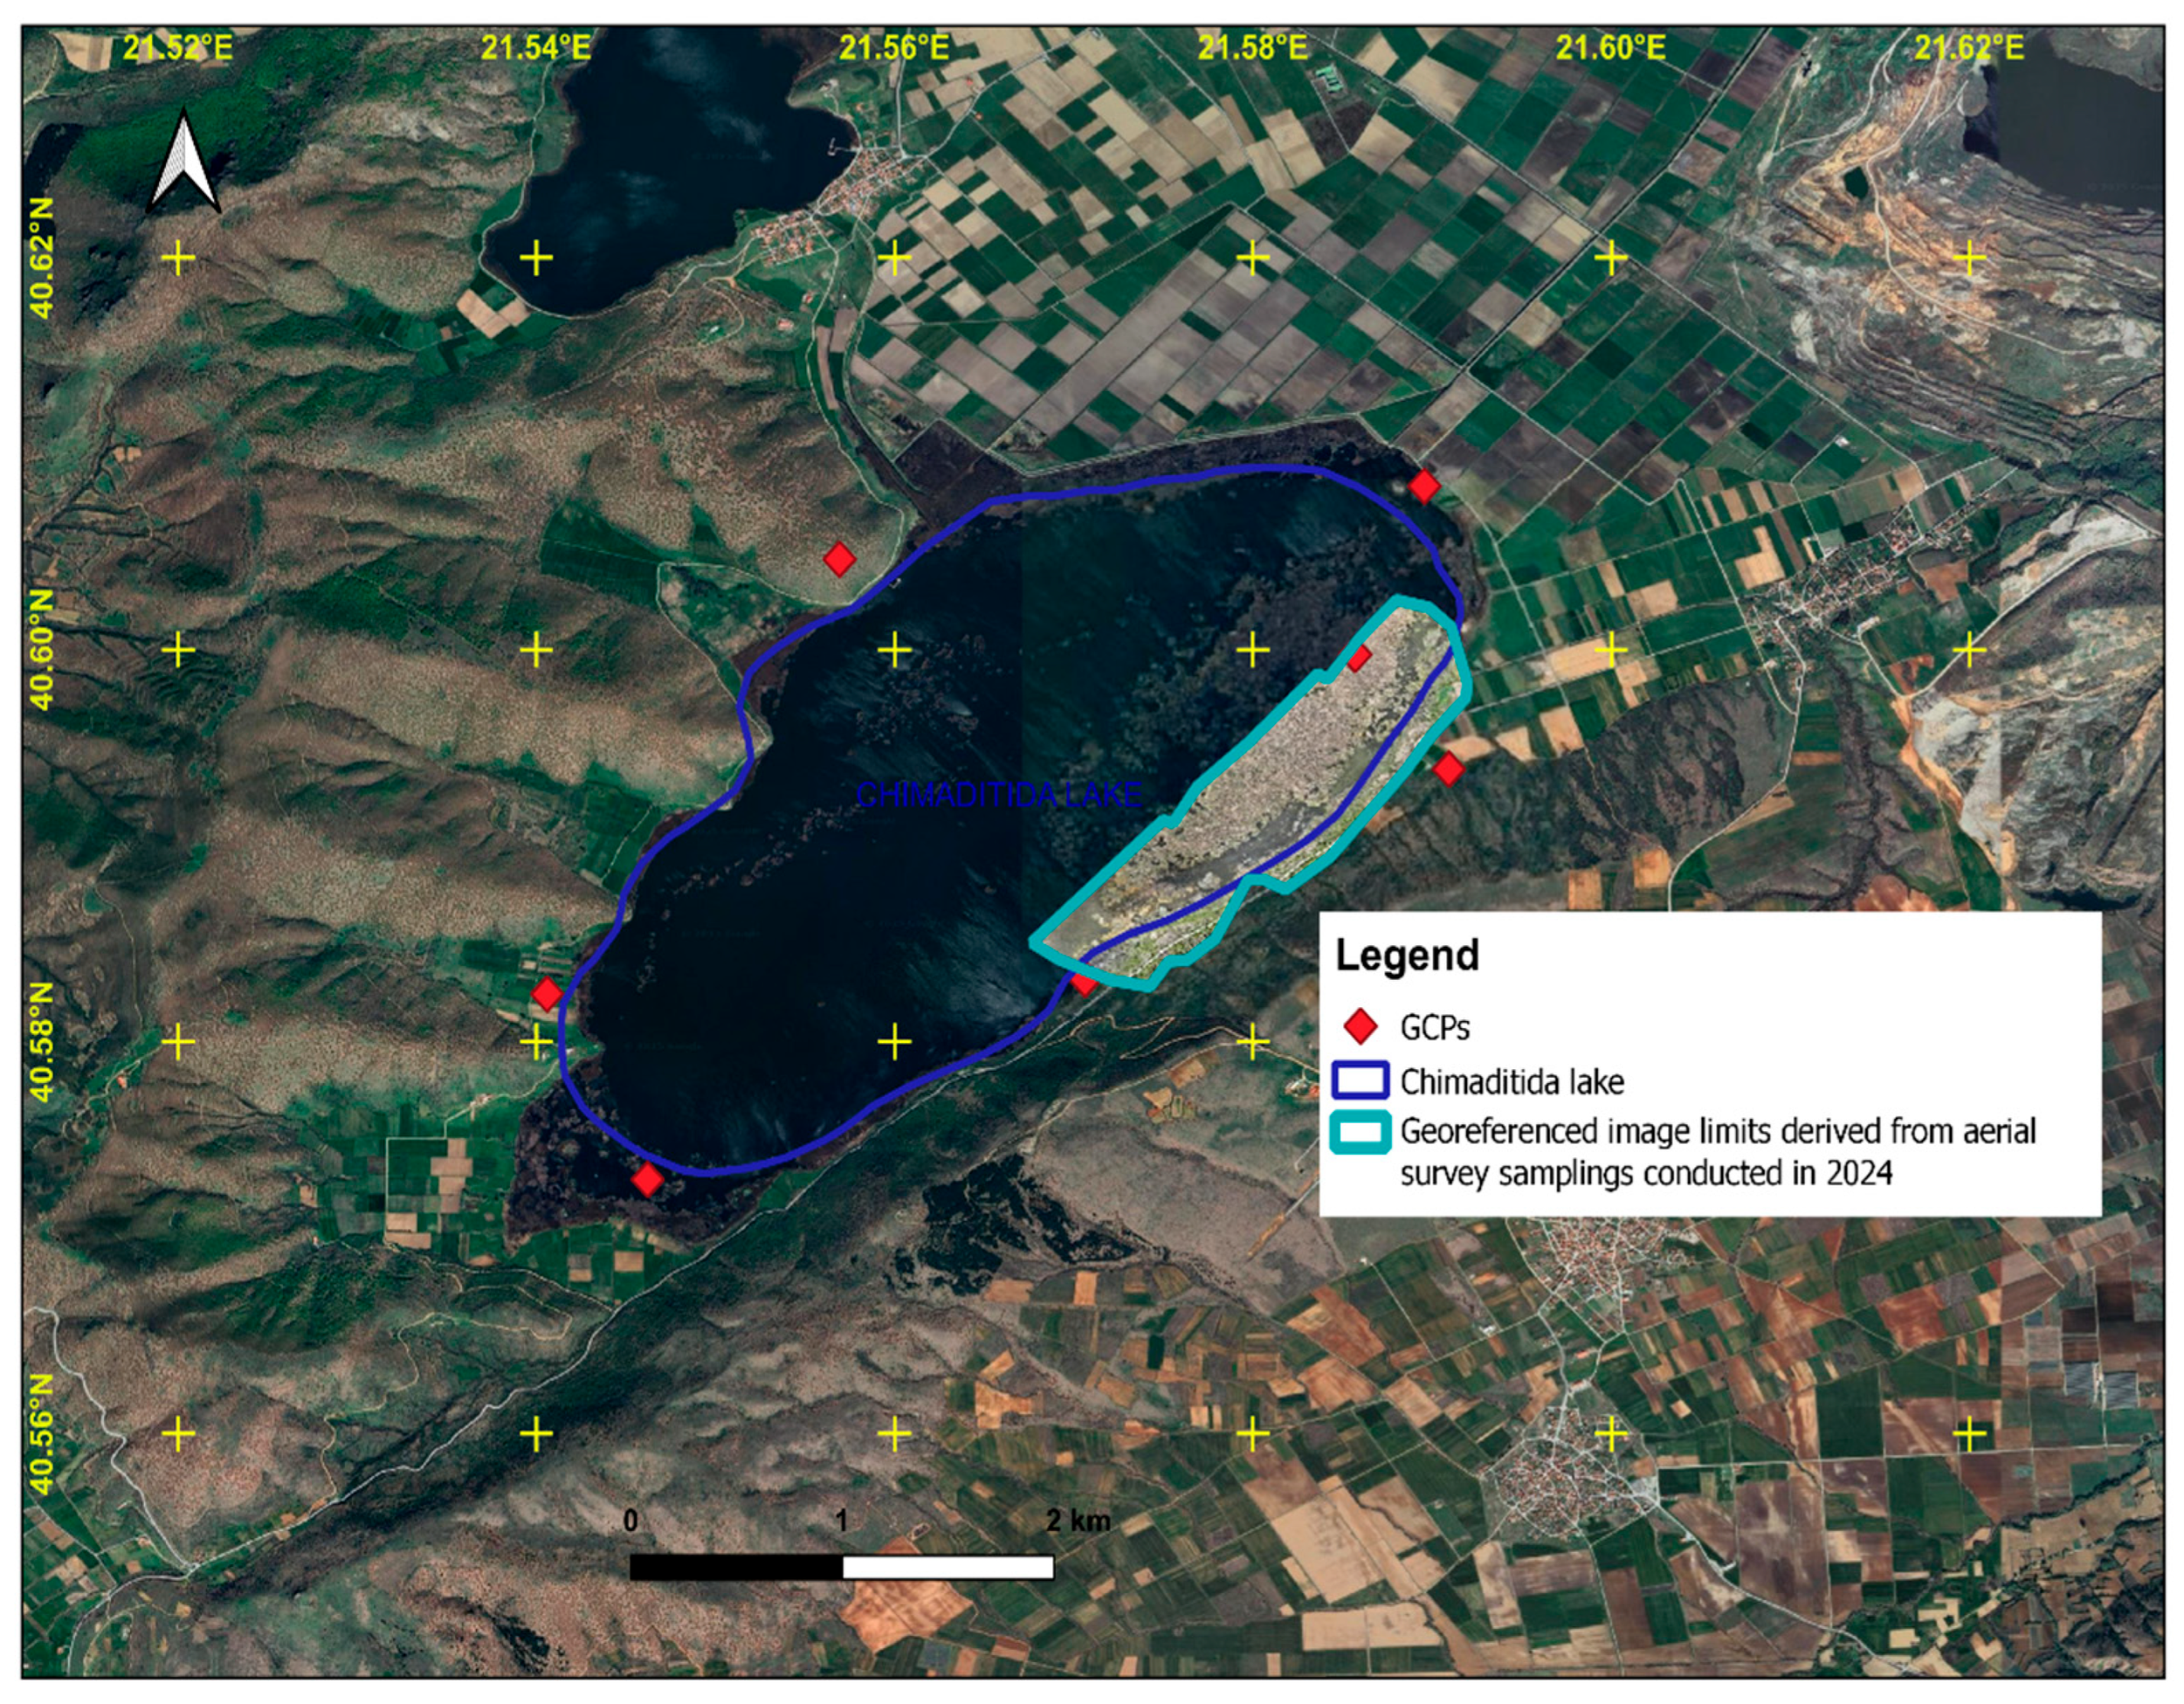
Chimaditida is a shallow lake located in Florina Regional Unit of Western Macedonia, northern Greece. Situated at an elevation of approximately 591 m above sea level, it covers an area of 9.58 km
2. The lake is shallow, with a maximum depth of around 2.50 m and an average depth of 1 m. It is part of a complex of interconnected lakes, including Zazari, Petron, and Vegoritida, all situated within the Eordea basin. Chimaditida Lake has the following geographical coordinates: Latitude, 40.595° N; Longitude, 21.567° E [
14,
20,
21].
The surrounding region is rich in biodiversity, hosting numerous plants, animal species, and aquatic organisms. Notably, Chimaditida Lake serves as a crucial breeding ground for the endangered Ferruginous Duck (
Aythya nyroca G., 1791 [
22]) and provides habitats for various bird species. The area is also recognized as an Important Bird Area (IBA), highlighting its significance for bird conservation [
23]. Its biodiversity and ecological balance are vital for local environmental health, making it an important site for monitoring vegetation dynamics and water quality. Moreover, Chimaditida Lake is designated as a Natura 2000 site (GR1340008) (ref. [
24], accessed on 7 March 2025), highlighting its importance for biodiversity conservation within the European Union.
Since the lake has fluctuated in size over time, the official shapefile of the lake was received from the Hellenic Data Service website, which was created and last updated on 23 October 2018 (ref. [
21], accessed on 7 March 2025). After long-term analysis conducted from 2018 to the present, it has been demonstrated that the shape and morphology of Chimaditida have not changed significantly since October 2018. Consequently, the aforementioned shapefile is recommended for use in this study.
Figure 1, designed in QGIS version 3.16.11, shows the location of Chimaditida Lake within Greece and provides an overview of the area of interest.
According to [
25], a distribution of Lemnetea (67%), Potamogetonion (1%), and Phragmito-Magnocaricetea (32%) aquatic vegetation existed in Chimaditida Lake during 2013–2016. General aquatic vegetation categories and dominant species taking place in Chimaditida Lake according to the research of [
25] are described in
Table 1.
As aquatic vegetation plays a key role in ecological health, supporting nutrient cycling and providing a habitat for wildlife, this study focuses on monitoring trends in aquatic vegetation using satellite data from Sentinel-2 for a one-year period, namely from 1 March 2024 to 28 February 2025, entirely covering four seasons. In conclusion, it is considered essential to study Chimaditida Lake, because, according to the website of the Hellenic Center for Habitats and Wetlands (EKBY), this lake has a poor overall status in lake classification for the 2012–2015 monitoring period of the EKBY (ref. [
36], accessed on 7 March 2025).
4. Results
This study proposes a method to classify aquatic vegetation and open water in Chimaditida Lake using all available Sentinel-2 images. In addition, the method proposed in this study considers four Sentinel-2 band histograms (i.e., B04, B08, B03, and B11), which were analyzed to classify the lake area into open water and aquatic vegetation.
To verify the accuracy of the method, approximately 210 aerial images were taken using a DJI Matrice M200 quadcopter UAS with a Parrot Sequoia multispectral camera on board. The aerial images were processed with ODM V.3.5.4 software.
The accuracy assessment was conducted using the overall accuracy (OA), user’s accuracy (UA), and producer’s accuracy (PA) metrics. The OA is determined by dividing the number of correctly classified pixels by the total number of sampled pixels. The PA, also known as precision for each class, is calculated by dividing the number of correctly classified pixels in a specific class by the total number of reference pixels for that class. The PA reflects false-negative predictions and compares the classified map to the producers’ expectations. On the other hand, the UA focuses on false-positive predictions and is calculated by dividing the number of correctly predicted pixels for each class by the total number of pixels classified into that class. The UA shows how accurately each classified pixel on the map represents the actual class on the ground. The OA resulted in a score of 89.31% (
Table 2). The classification results, represented in
Table 2, were satisfactory in terms of overall performance. In particular, the aquatic vegetation scores were higher than open water, as the producer and user accuracies of aquatic vegetation were 97.42% and 95.38%, respectively.
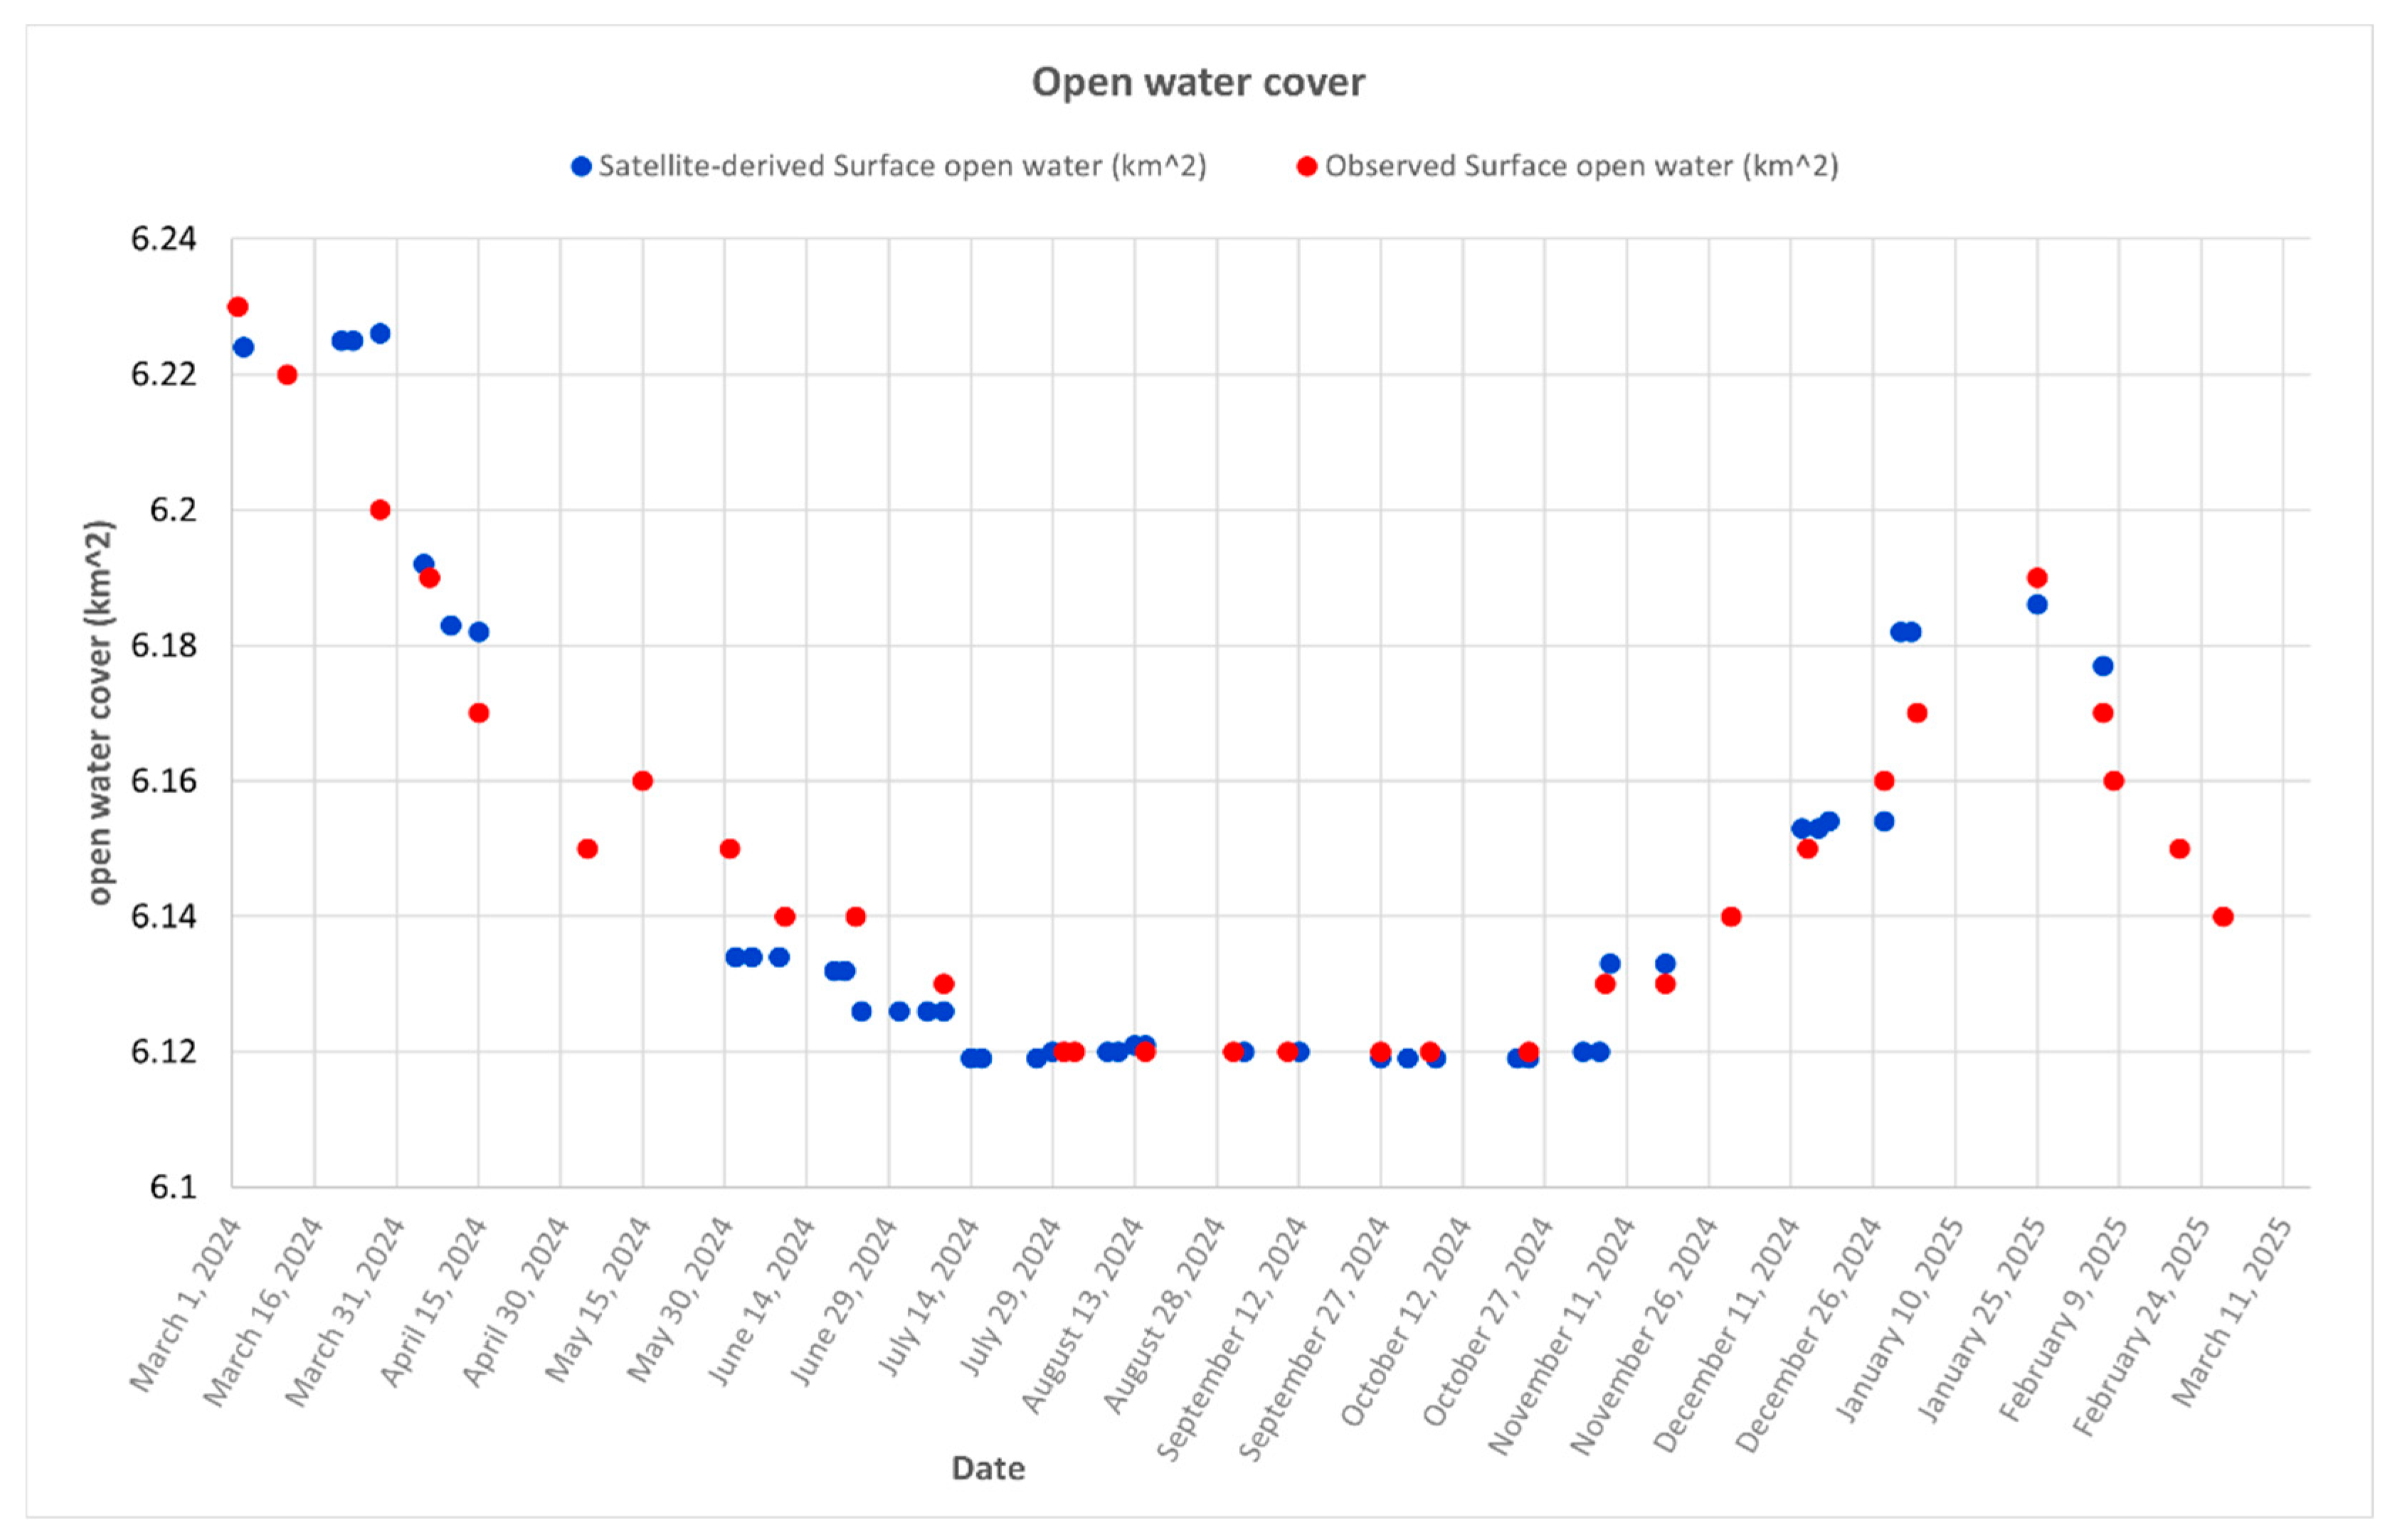
The average area of the open water class across all satellite-derived dates was 6.15 km
2, of which 0.65 km
2 was covered by aquatic vegetation. Given that the Chimaditida shapefile, as described in
Section 2, covers an area of 9.58 km
2 since 2018, it is evident that the remaining 3.43 km
2 has experienced desiccation. Aquatic vegetation peaked with a score of 2.08 km
2 on 9 September 2024, while its lowest value of 0.00067694 km
2 was recorded on 28 December 2024. A steady decline in the extent of aquatic vegetation began on 7 October 2024. Similarly, for open water, its highest extent of 6.226 km
2 occurred on 28 March 2024, while the minimum value of 6.119 km
2 was observed on multiple dates throughout July, September, and October 2024.
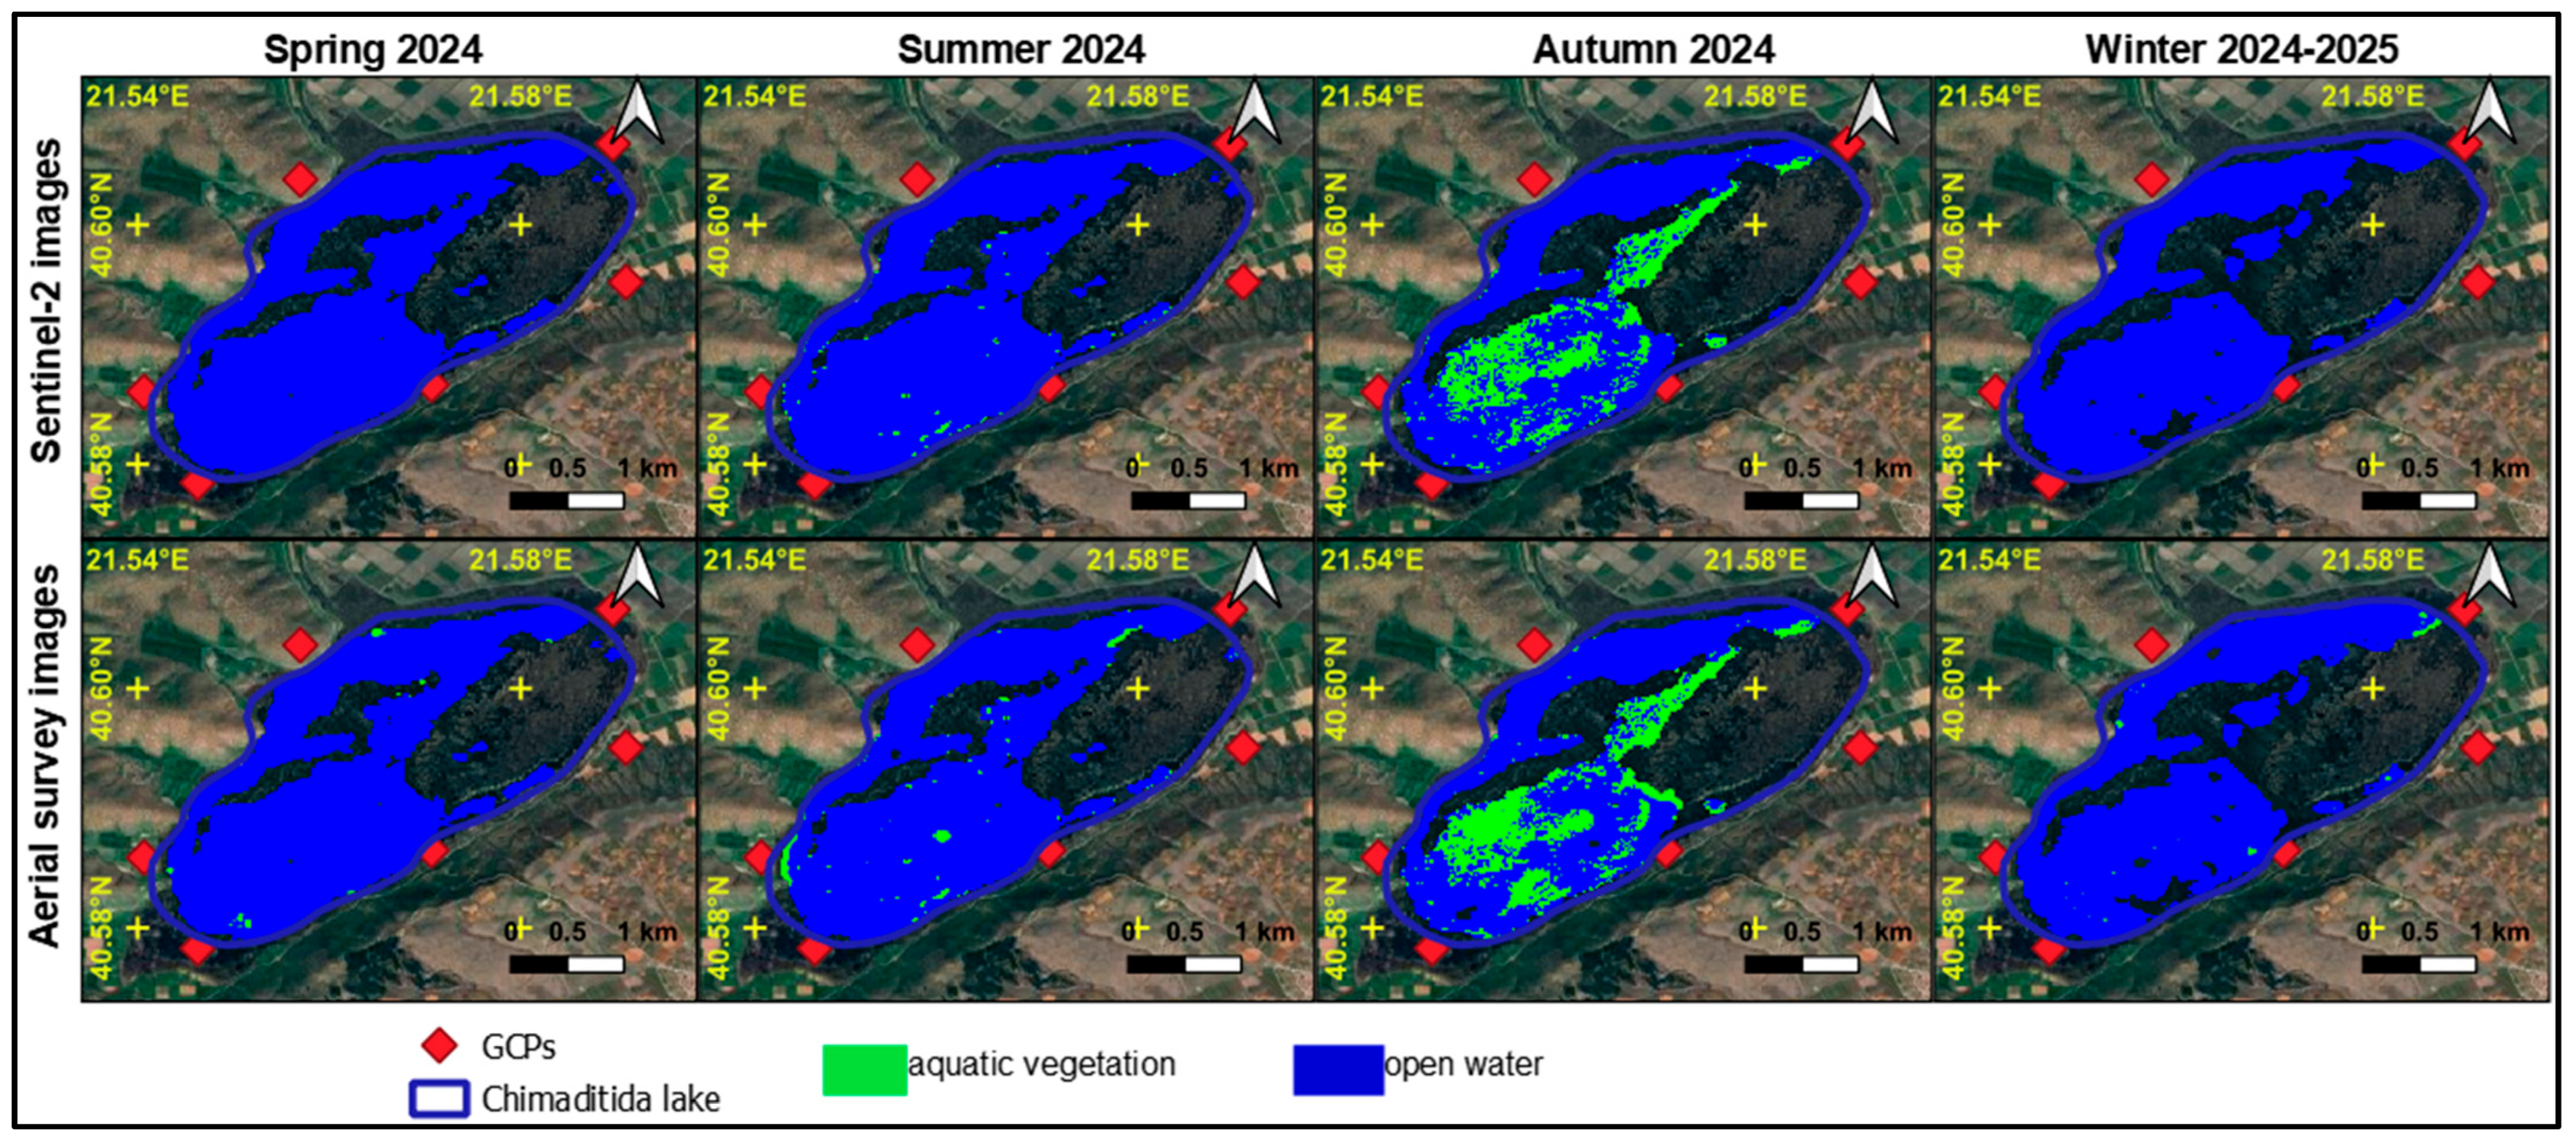
According to
Figure 6, aquatic vegetation in Chimaditida Lake is more abundant in autumn due to several factors that influence plant growth and survival in aquatic ecosystems. For instance, in autumn, temperatures typically start to cool, creating more stable conditions for aquatic plants. Warmer water temperatures in summer can sometimes cause stress for some aquatic species that exist in lakes, like
Phragmites australis (common reed),
Typha latifolia L., 1753 [
19] (broadleaf cattail),
Scirpus lacustris L., 1753 [
19], various species of
Carex L., 1753 [
19], and
Glyceria maxima (H.) H., 1925 [
42,
43]. Moreover, autumn often follows a period of increased nutrient runoff, particularly after summer rains. These nutrients (e.g., nitrogen and phosphorus) can boost plant growth, leading to a rise in aquatic vegetation. Additionally, when temperatures drop, some nutrients may become more accessible to plants due to reduced biological activity, creating favorable conditions for plant growth. Furthermore, as depicted in
Figure 7, in Chimaditida Lake, autumn represents a period when the water level stabilizes after seasonal changes (such as a summer drought or flooding), allowing aquatic vegetation to spread and thrive.
According to
Figure 7, water level in Chimaditida Lake remains almost constant, having small fluctuations throughout all seasons. This stability arises from several reasons. Chimaditida Lake has a well-balanced inflow (such as from rivers, streams, or groundwater) and outflow (like evaporation or drainage), ensuring that water level remains steady year-round. This balance prevents large fluctuations despite seasonal changes. Additionally, a hydraulic structure—specifically a sealing embankment and a controllable overflow weir at the lake’s outlet—can regulate the lake’s water management and control its water level.
5. Discussion
5.1. Description and Advantages of Classification Method Described
This study aims to assess aquatic vegetation and open water dynamics in Chimaditida Lake, in Greece, through a comprehensive remote sensing approach, integrating both satellite and UAV-based imagery. Using an equipped DJI Matrice M200 quadcopter, this study sought to classify and monitor the extent of aquatic vegetation and open water over one year, from March 2024 to February 2025. The integration of satellite-derived data (via Sentinel-2) and high-resolution aerial imagery allowed the accurate classification and phenological analysis of the aquatic vegetation, with a focus on both SAV and FEAV.
Our findings demonstrate a high degree of accuracy in classifying aquatic vegetation and open water, as evidenced by the OA of 89.31%, with the UA and PA for aquatic vegetation reaching 95.38% and 97.42%, respectively. This method, based on the combination of Sentinel-2 imagery and UAV-derived orthomosaics, showed a strong agreement (R
2 = 0.88) between Satellite-Derived and Observed Surface aquatic vegetation, which aligns well with similar studies in the literature [
3,
8,
9]. However, the specific nature of Chimaditida Lake, with its shallow waters and clear visibility of the lake bottom, presents a unique aspect for remote sensing applications, which will be discussed in comparison with other studies.
Among these study benefits is the higher spatial resolution provided by Sentinel-2 data (10 m), which allows a more precise classification of both aquatic vegetation and open water, particularly in small, shallow lakes. This enhanced resolution improves the detection and delineation of smaller patches of aquatic vegetation and subtle changes in the water body, addressing challenges that satellite imagery with coarser resolution, such as Landsat, might not handle as effectively. While the approach of [
15] was promising in classifying SAV, the spatial resolution of Landsat data (30 m) often reduces the accuracy for finer-scale vegetation mapping in shallow lakes. Similarly, in the study of [
17] the lower spatial resolution of MODIS (250–500 m) might limit their approach ability to detect fine-scale changes in vegetation. Moreover, in the context of this study, it was observed that aquatic vegetation reached its highest value during the autumn months, coinciding with stable temperatures and increased nutrient availability following summer rains. These findings align with those of [
16], who emphasized the role of nutrient influx in promoting vegetation growth. Among this study’s advantages is the focus on a smaller, shallow lake, where high-frequency UAV surveys in combination with Sentinel-2 satellite data allowed for high-resolution, detailed mapping of aquatic vegetation dynamics, while refs. [
9,
18] provided an approach more suitable for larger lakes. Finally, in this research, the spatiotemporal dynamics of aquatic vegetation in Chimaditida Lake were explored, focusing on natural seasonal changes and water area/level fluctuations. Furthermore, this analysis provides valuable insights into the seasonal patterns of aquatic vegetation, with significant peaks observed during the autumn months, which were attributed to stable environmental conditions such as water temperature and nutrient availability in contrast with other similar studies, i.e., ref. [
10], who examined the effects of external management interventions, such as the removal of a fence, on aquatic vegetation in Lake Futou.
In summary, these study results demonstrated seasonal variations in the extent of aquatic vegetation. The highest extent of aquatic vegetation occurred in autumn, a time when temperatures stabilize and nutrient availability is high due to runoff. This seasonal peak in vegetation is consistent with findings from [
9,
10], which highlight autumn as a critical period for aquatic plant growth due to favorable conditions for nutrient uptake. The slight fluctuation in water levels across seasons, as observed in Chimaditida Lake, also contributes to the stability of vegetation growth, supporting the findings from [
16,
17] that water level stability plays a significant role in aquatic vegetation phenology. This research could moreover provide valuable insights for Greek and European water and environment management authorities, as it addresses a gap in the existing knowledge. To date, there has been a lack of studies focusing on the dynamics of aquatic vegetation in Mediterranean and European freshwater systems, particularly on the monitoring of SAV and FEAV. By offering a detailed analysis of vegetation patterns, water quality dynamics, and the drivers influencing these systems, this study would contribute to the development of more effective and sustainable water management strategies. Additionally, the findings might inform policy decisions and support the conservation of aquatic biodiversity in the region.
5.2. Uncertainties, Limitations, and Future Recommendations
Despite the promising results, several uncertainties and limitations in this study should be acknowledged. One of the key challenges is the reliance on satellite-derived imagery and aerial surveys, both of which are influenced by environmental conditions such as cloud cover, lighting variations, and atmospheric interference. Although efforts were made to correct these issues (e.g., using the sunshine sensor for radiometric calibration), inaccuracies in atmospheric corrections and image quality still affect the final vegetation classification results. For instance, during cloudy or overcast days, the sensor data may be obscured, potentially leading to misclassification or the underrepresentation of aquatic vegetation.
Another limitation of this study is the spatial resolution of Sentinel-2 imagery (10 m), which, although higher than Landsat imagery, might still miss finer-scale details such as small patches of vegetation or subtle changes in vegetation density, especially in areas with complex aquatic vegetation patterns or high spatial heterogeneity. UAV-based data, although more precise, is limited by flight time and operational constraints, including battery life and weather conditions, which might restrict the frequency of image acquisition in some seasons or environmental conditions.
Regarding future recommendations, it would be valuable to integrate socio-economic and management-related factors, such as water management policies, human activities (e.g., agricultural runoff), and conservation efforts, to better understand the drivers behind aquatic vegetation dynamics. Combining ecological, hydrological, and socio-economic data would contribute to more-effective management strategies for preserving aquatic ecosystems and their biodiversity. Moreover, in future studies, it is recommended to expand the algorithm of this study to deeper or varying-depth lakes containing SAV alongside FEAV. Incorporating a broader classification system that includes both submerged and surface-level vegetation would provide a more comprehensive understanding of aquatic ecosystems. This would not only enhance the insights into overall lake health and biodiversity but also improve the generalizability of the findings to lakes with deeper waters or different types of aquatic vegetation. Such an approach could offer a more holistic view of the ecological dynamics in aquatic environments.
6. Conclusions
This study provides a comprehensive analysis of the spatiotemporal dynamics of aquatic vegetation in Chimaditida Lake, northern Greece, using Sentinel-2 satellite imagery and field validation via aerial surveys. The method applied focused on distinguishing FEAV from open water, utilizing key vegetation indices such as the MNDWI and NDVI. The utility of Otsu’s algorithm for automatic threshold extraction facilitated the accurate classification of FEAV and open water, with high overall classification accuracy (89.31%), and impressive user and producer accuracies for aquatic vegetation (95.38% and 97.42%, respectively).
The analysis revealed that aquatic vegetation in Chimaditida Lake is most abundant in autumn, with a peak of 2.08 km2 recorded in September 2024. This increase is attributed to more favorable environmental conditions, including stable water temperatures, nutrient availability following summer rains, and the stabilization of water levels after seasonal fluctuations. Despite seasonal changes, the lake’s water level remained relatively stable, with small fluctuations observed across the year. This stability, supported by regulated water management and the balanced inflow and outflow of water, has likely contributed to the consistent spread of aquatic vegetation.
These findings highlight the utility of satellite-based monitoring for large-scale, cost-effective tracking of aquatic vegetation dynamics, providing valuable insights for lake management and conservation. The methodology developed in this study contributes to the effective monitoring of Chimaditida Lake’s ecological health and is also applicable to other shallow freshwater ecosystems experiencing similar environmental challenges. Finally, this research contributes to the ongoing efforts to preserve biodiversity, water quality, and ecosystem health in Chimaditida Lake and beyond.


