Article

Impact of Phenol on Membranes during Bipolar Membrane Electrodialysis for High Salinity Pesticide Wastewater Treatment

1
College of Chemistry and Environmental Engineering, China University of Mining and Technology, Beijing 100083, China
2
Beijing Key Laboratory of Membrane Materials and Engineering, State Key Laboratory of Chemical Engineering, Department of Chemical Engineering, Tsinghua University, Beijing 100084, China
3
Sinochem Lantian Fluoro Materials Co., Ltd., Shaoxing 312369, China
4
Zhenjiang Tsing Membrane Technology Co., Ltd., Zhenjiang 212141, China
*
Author to whom correspondence should be addressed.
Separations 2022, 9(9), 241; https://doi.org/10.3390/separations9090241
Submission received: 1 August 2022 / Revised: 30 August 2022 / Accepted: 31 August 2022 / Published: 3 September 2022
(This article belongs to the Section Materials in Separation Science)

Abstract

:
To achieve a cleaner production, pesticide wastewater with concentrated NaCl can be treated by using a bipolar membrane electrodialysis (BMED) and converted to NaOH and HCl, which minimizes acid and alkali consumption in a pesticide production process. However, ion-exchange membranes (IEMs) are vulnerable to fouling by phenolic substances present in the concentrated NaCl solutions. This work aimed to understand the performance and fouling mechanism of BMED from phenol during the desalination of NaCl and explore an effective cleaning method. The results firstly showed that for the NaCl solutions with higher phenol concentrations, the selectivity of the IEMs was reduced after processing six successive batches of BMED, which led to reverse migration of ions, organics leakage, and an obvious increase in the energy consumption and the concentration of generated acid and alkali. Secondly, IEMs characterization analysis detected that the structure of the IEMs was deformed, while phenol fouling deposits were observed on the surface and interior of the IEMs, especially for the anion exchange membranes (AEMs). Then, the results of soaking tests proved that the phenol could bring about swelling-like degradation to the AEMs and 0.1 wt.% NaOH solution was studied to be the optimized cleaning agent since the performance of the fouled IEMs in the short-running process could be recovered after 5 h of in situ cleaning that removed the phenol fouling deposits efficiently. Finally, the results of a long-running BMED operation treating NaCl solution containing 10 g/L phenol concentration showed that the IEMs were severely fouled, and the fouling was firstly due to the swelling-like mechanism during the initial 12 successive batches, and then should belong to the blockage-like mechanism during the following 20 successive batches. The seriously fouled IEMs could no longer be recovered even after a deep in situ cleaning. This research proves that under appropriate pretreatment or operating conditions, the BMED process is an alternative way of treating wastewater with high salinity and the presence of phenol molecules.

1. Introduction

It was reported that with an increasing demand for food supply due to a rising population, the pesticide industry across the globe will witness a growth rate of 5.5% through 2031 [1]. In addition, according to a comment article published recently, China is currently the leading producer and exporter of pesticides globally, holding almost 75% of the global pesticide exportation, which inevitably leads to a huge emission of pesticide wastewater [2]. The pesticide wastewater normally contains a high level of chemical oxygen demand (COD), a high salinity (e.g., ~36 wt.% NaCl) due to the large addition of acid and alkali for the reaction of producing pesticide, and a certain amount of pesticides [3], which would threaten ecosystems, including birds, wildlife, domestic animals, fish, and livestock [4]. As a result in 2015, the Chinese government issued the “Action Plan for Prevention and Control of Water Pollution” to propose strict supervision of pesticide industrial wastewater for limiting the total emission of pollutants in wastewater, to achieve recycling of the wastewater, and to push to realize near-zero-emission as soon as possible [5].
Considering the high salinity and high COD level of pesticide wastewater, there are various treatment techniques to treat pesticide wastewater, involving a combination of physical, chemical, and biological methods [6]. The treatment process of pesticide wastewater can be generally divided into a pretreatment stage and an advanced treatment stage [7]. In the pretreatment stage, the heterogeneous components of the wastewater, i.e., suspended solids, immiscible liquids, the organic substance content, heavy metal concentration, chroma, and turbidity, are reduced significantly by mechanical and physicochemical approaches, i.e., filtration, precipitation, adsorption, evaporation, and oxidation [8]. After the pretreatment, the wastewater still contains high salinity and residual organic matter, which has to be dealt with in the advanced treatment stage [8]. Several techniques, including membrane separation, evaporation, and advanced oxidation, can be considered to be advanced treatment methods [3]. Among them, the most widely used process is to reduce the content of organic matter by oxidation first and then achieve the separation of salt by membrane separation method or evaporation method to realize the recovery of salt and achieve near-zero pollution emission [9,10], whereas whether for the membrane-based separation or the evaporation, they cannot eliminate the salts, but have to produce brine or solid salts containing organic impurities, which are difficult to be recycled [11]. Therefore, the sustainable management of pesticide wastewater with high salinity strongly requires an indispensable paradigm shift to effective resource recycling, apart from contaminant removal [10,11].
Electromembrane technologies, which are based on ion exchange membranes (IEMs) and electric fields, such as electrodialysis (ED) and bipolar membrane electrodialysis (BMED), have been widely proposed for the treatment of concentrated saline water and brines [5,12]. The ED is used to transport salt ions from one solution through IEMs to another solution under the influence of the applied electric potential difference, while the BMED is composed of the bipolar membrane (BPM) [13], anion exchange membrane (AEM), and cation exchange membrane (CEM), which can be regarded as a combination of electrodialysis for salt separation with electrodialysis water splitting for the conversion of salt into its corresponding acid and base. The BMED creates a new pathway to extract resources from high-salinity wastewaters by converting salt into acid and alkali to close the loop of the raw materials [14], which has been applied in different fields, such as clean production [14,15], resource utilization [16,17], and zero pollution emission [17]. For example, Lin et al. employed BMED technology to effectively separate glyphosate from NaCl in a highly saline glyphosate neutralization stream and regenerate HCl and NaOH [11]. Ye et al. adopted a hybrid ultrafiltration and BMED process to recover resources (i.e., dye extraction, acid/alkali generation, and pure water recovery) from highly saline textile wastewater [18]. Considering that adding acid or alkali is always necessary for pesticide production, adopting BMED to deal with the highly saline pesticide wastewater and generate acid/alkali can not only help to realize a near-zero emission of pollution but also achieve the resource utilization of wastewater.
Since ED is also based on IEMs and electric potential differences, it is reasonable that ED-related studies can be valuable references for the BMED processes, especially for the fouling study of IEMs. During ED and BMED operation, the presence of organic matters (such as surfactants [19], phenols [12,20], dyes [18], acids [15], and alcohols [9]) in the wastewater would potentially accumulate onto the surface or pore structure of IEMs and thus induce membrane fouling under the direct current field, possibly even deteriorating the performance of the BMED stack with increasing energy consumption. Some research was conducted to study the mechanism and cleaning methods of organic fouling: Nikonenko et al. studied the fouling mechanism and cleaning of IEMs during their use in the ED operation of food industry solutions containing polyphenols (PPs) of 5 g/L [20]. The research confirmed that the PPs should be responsible for the fouling due to their accumulation on the surface and within the membrane pores because of hydrophilic and hydrophobic interactions. Dammak et al. identified that the interactions between phenolic compounds and polymer matrix, which were mainly governed by the CH-π and π-π stacking of aromatic rings, electrostatic interactions with charged functional sites of the IEMs, and the establishment of hydrogen bonds between linked water in the membrane matrix and hydroxide or acid functions of the foulants is the primary cause of the membrane fouling [12]. Higa’s group compared the ED processes of five organic substances and suggested three fouling factors of the organic substances on AEMs, including electrostatic interaction, affinity interaction, and geometrical factor [21].
As mentioned above, after some pre-treatment processes, some organic substances, (such as alcohols, phenols, and other organic compounds) and high salinity (such as NaCl) would remain in the pesticide wastewater and need further advanced treatment in view of a near-zero-emission. If adopting BMED to treat the residual hypersaline wastewater to generate acid and alkali to close the loop of the raw materials, the existence of organic matter, especially phenolic substances, would lead to IEM fouling, while there are few articles related to the specific influence of the phenolic substances on the performance of IEM stack in the BMED process, the fouling mechanism as well as the corresponding cleaning scheme of the fouled membranes. Moreover, no complete evaluation system has been established for the influence of organic matter on the performance of membrane stack in the BMED process. Therefore, this work chose a concentrated NaCl solution containing phenol with different concentrations to simulate pesticide wastewater, and the phenol was regarded as the representative phenolic organic substance. Based on this, BMED experiments with different operation periods were conducted to deal with the NaCl solution to identify the fouling mechanism of the phenol on the IEMs and select an appropriate cleaning method.

2. Materials and Experimental Methods

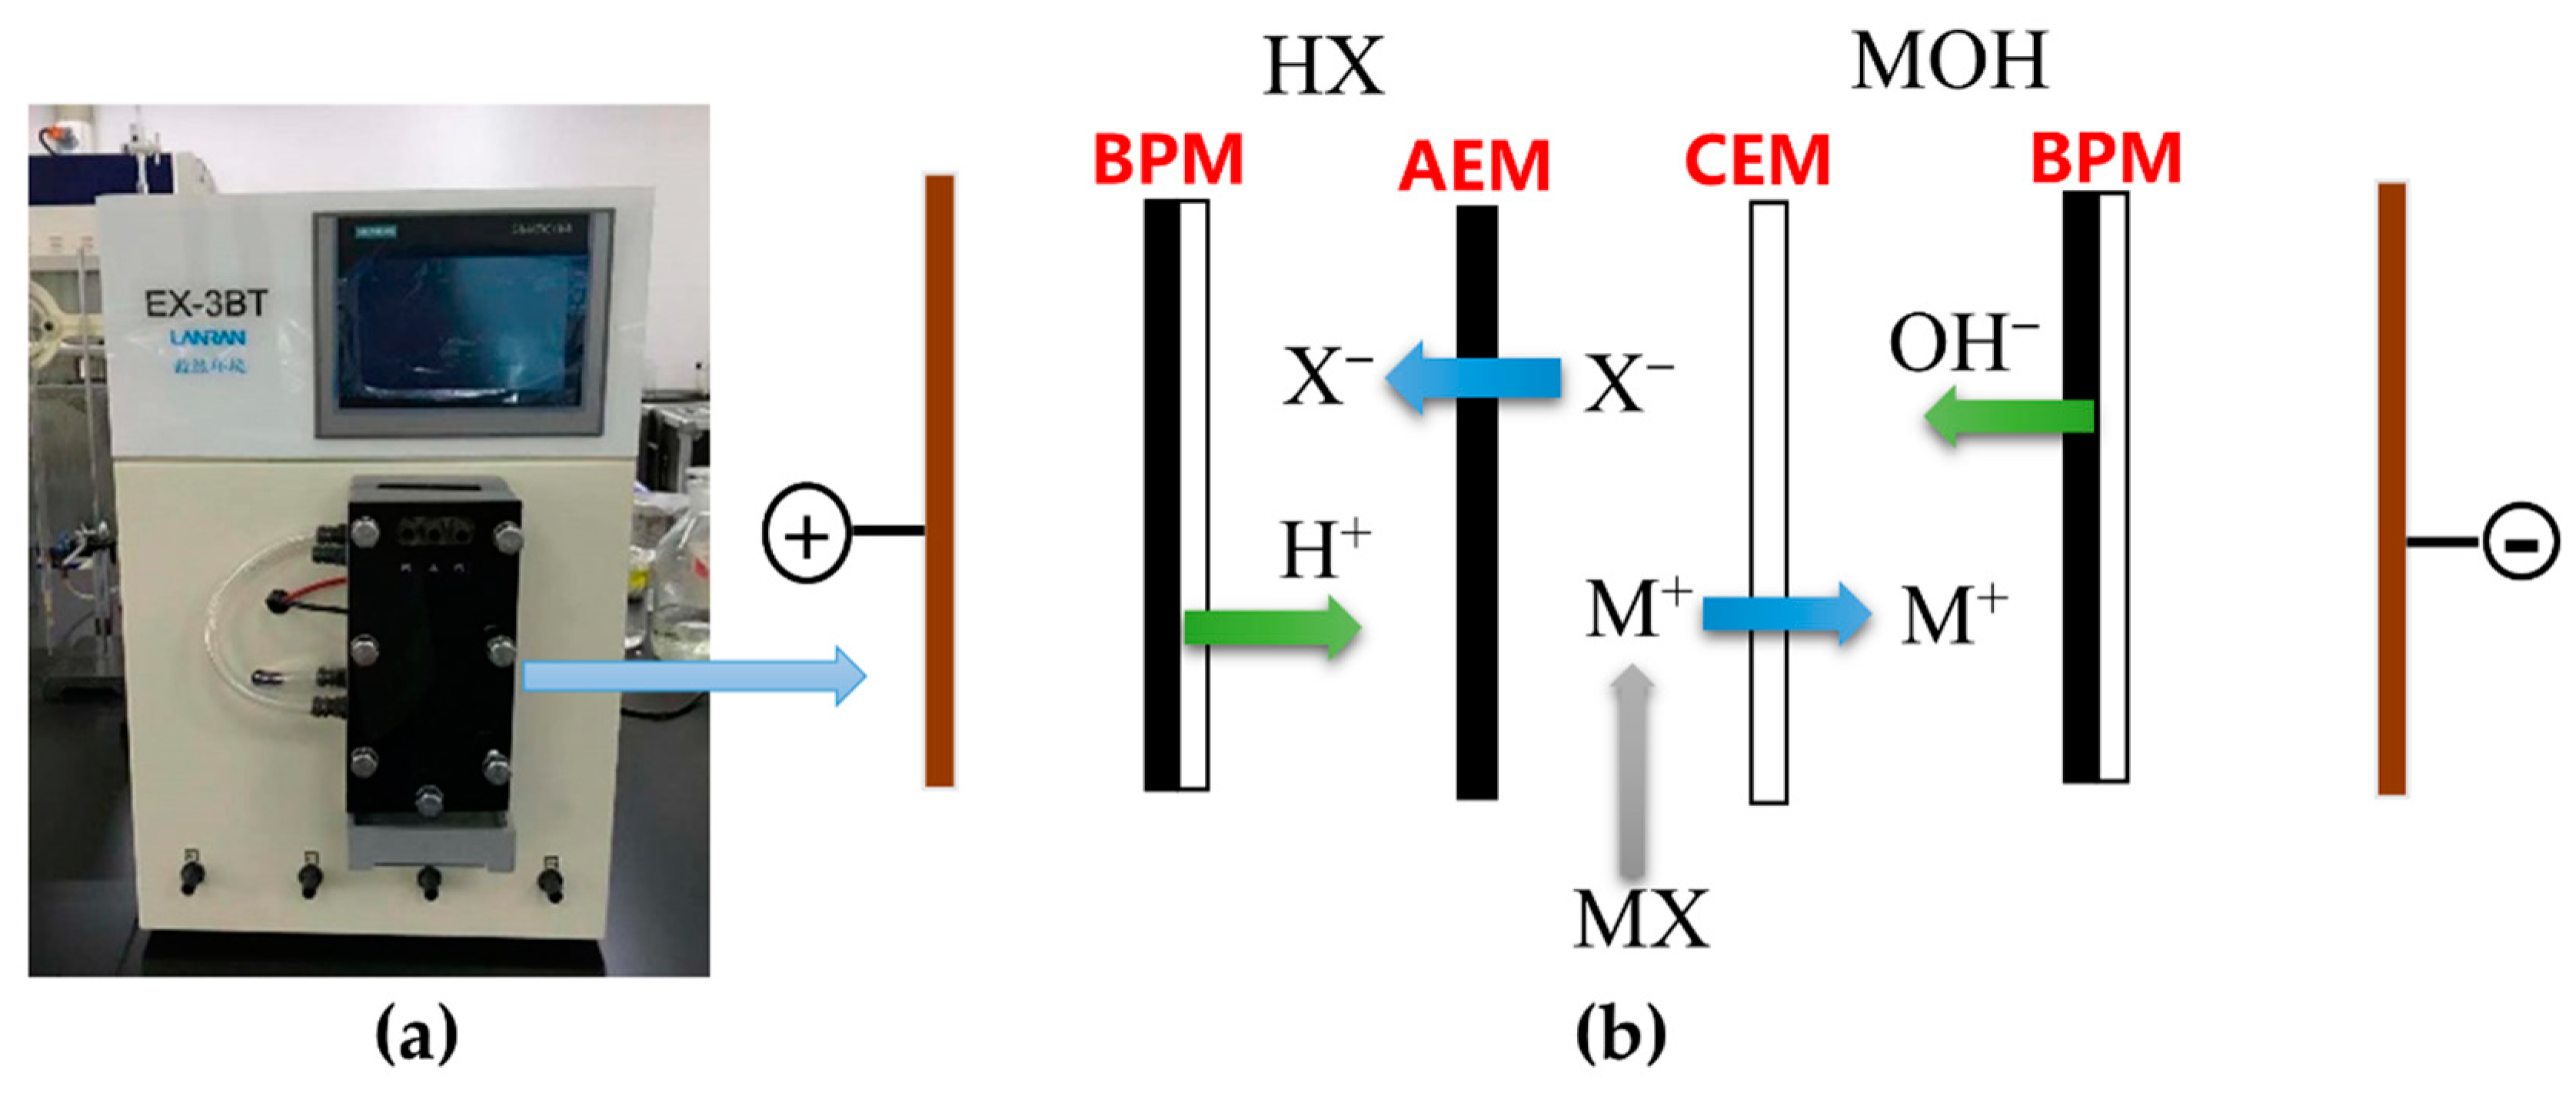
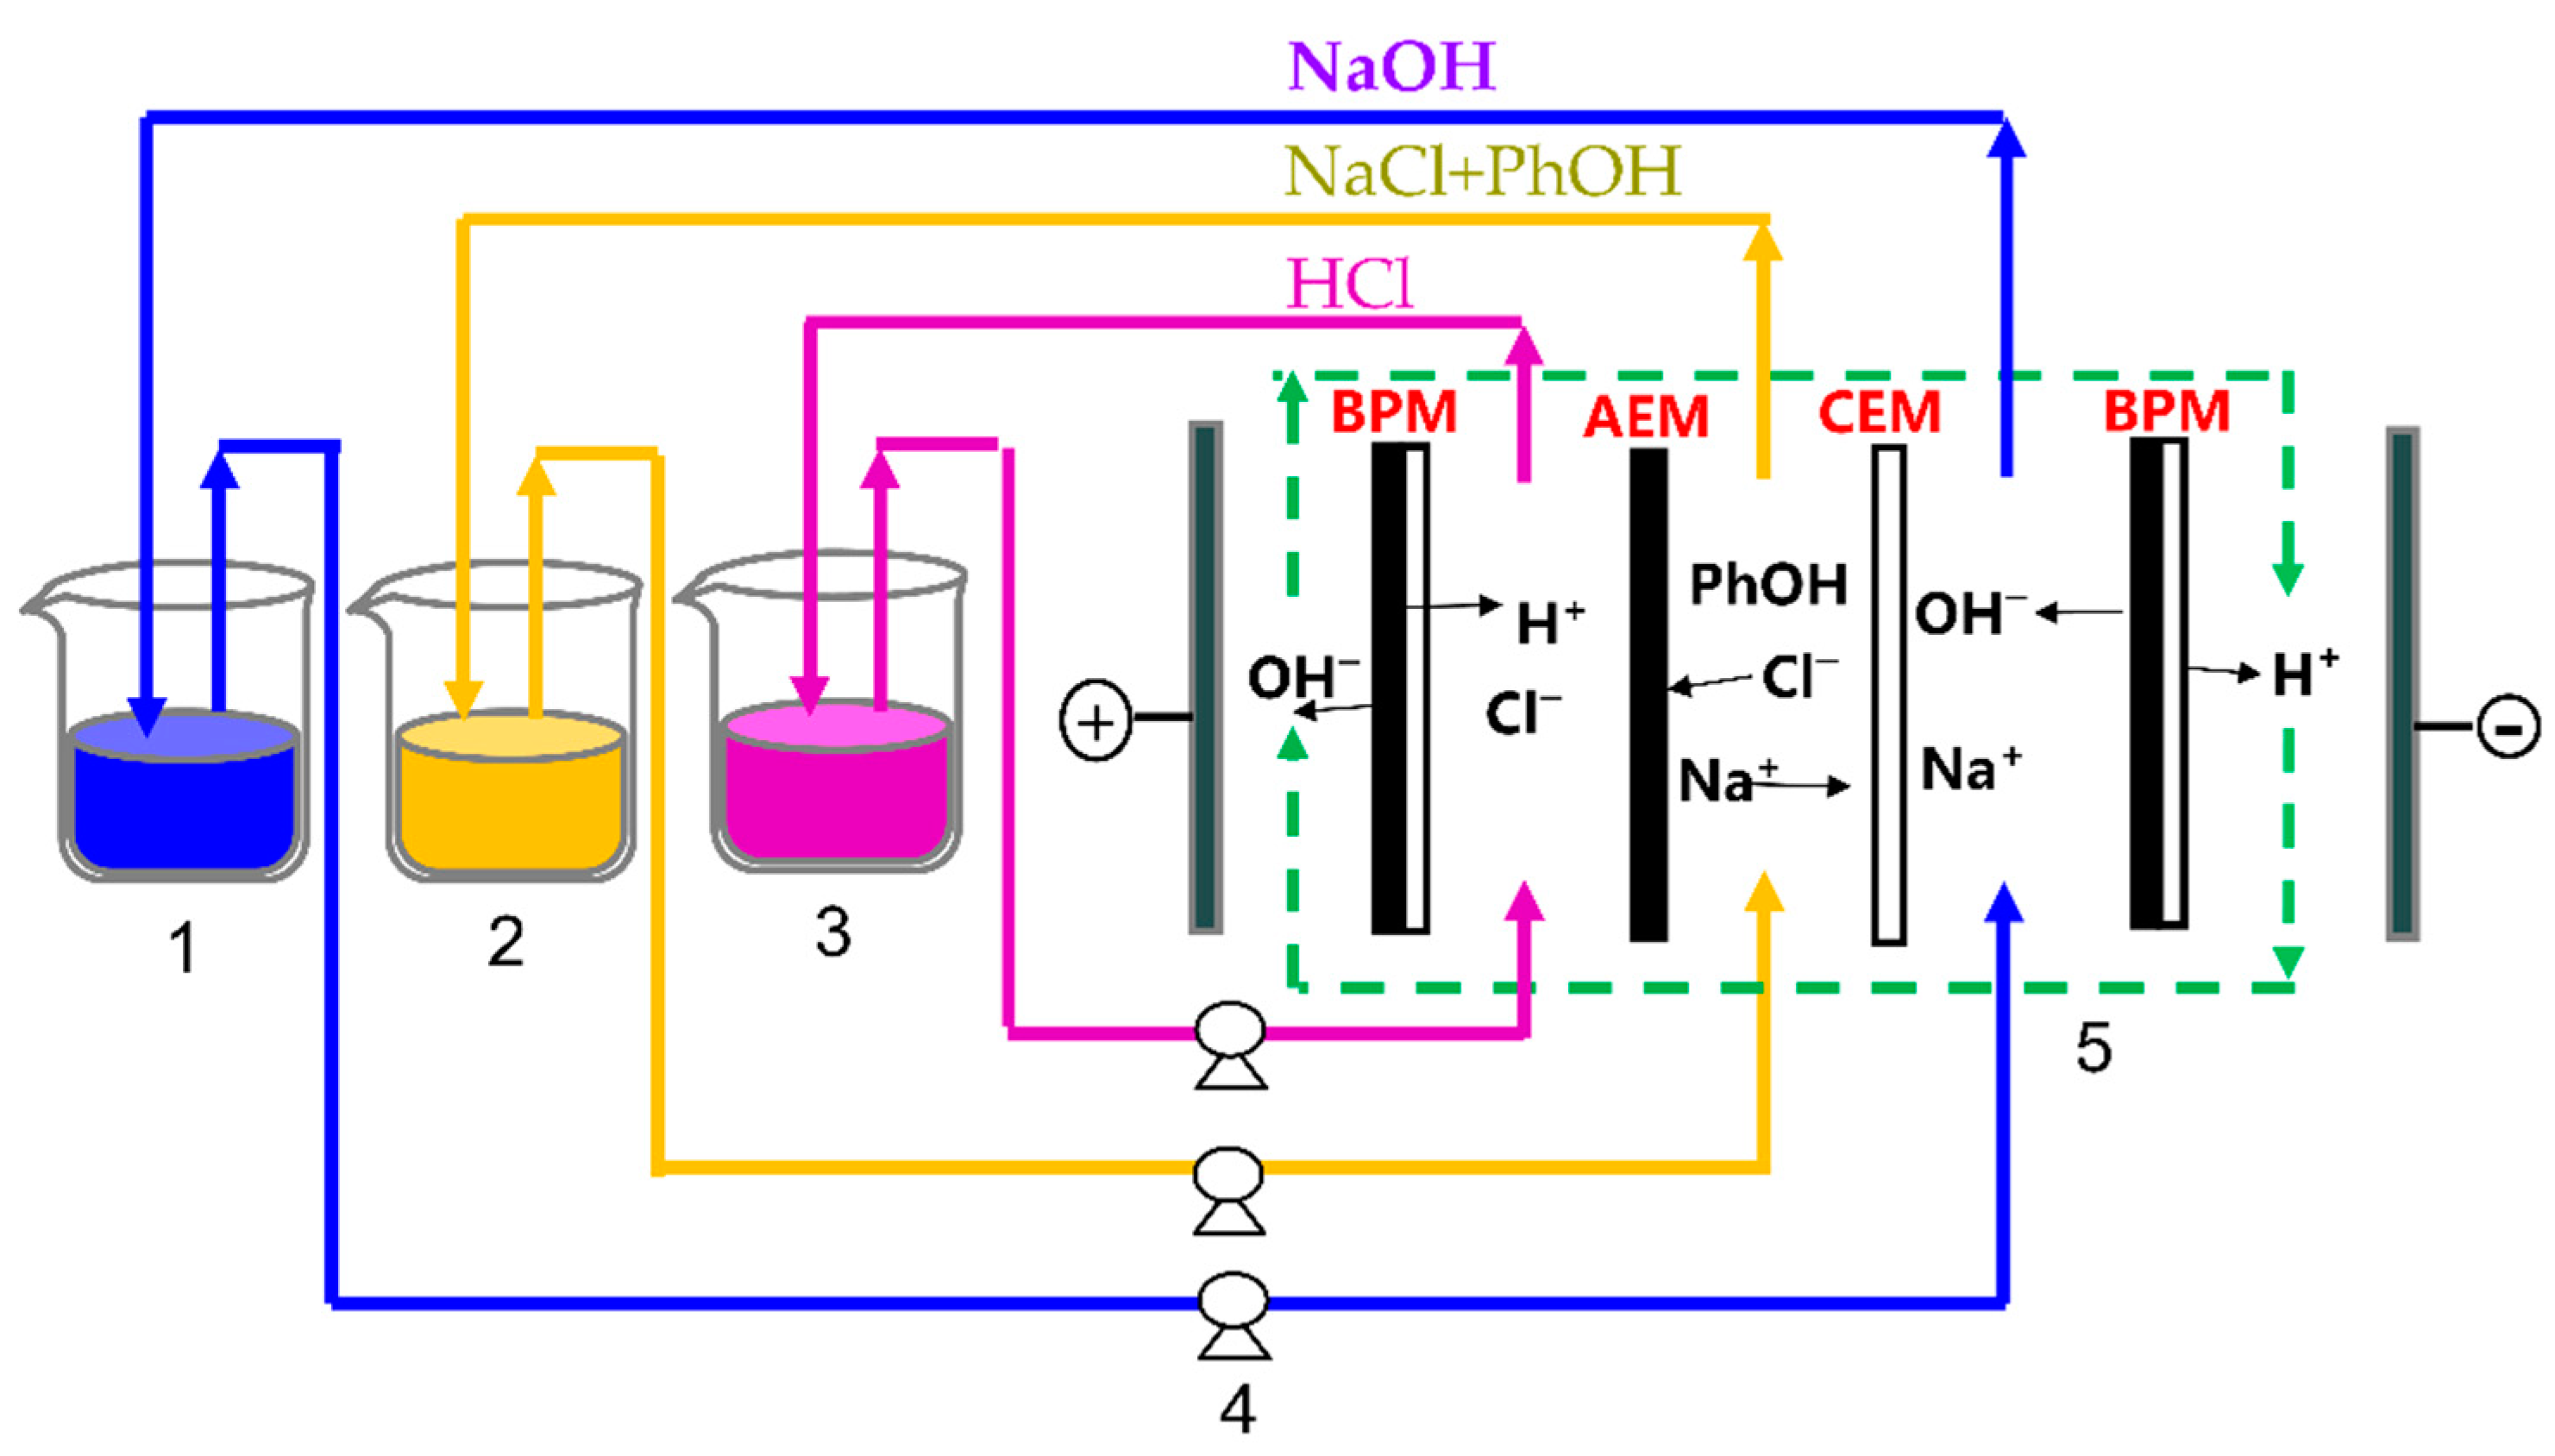
2.1. Chemicals and BMED Membrane Setup

Basic information (molecular weight, purity, and suppliers) of all the reagents used in this work are listed in Table 1. Milli-Q ultrapure water was applied throughout the study. Concentrations of the feed solution and corresponding operation parameters are listed in Table 2 based on our previous research [9]. In the previous work, various operation parameters including the NaCl concentration of the feed solution, current density, and the initial concentration of acid and alkali compartment have been analyzed and optimized. Thus, in this work, the NaCl concentration, current density, and the initial acid-alkali chamber concentration were set to be 160 g/L, 70 mA/cm2, and 0.075 mol/L. The phenol with different concentrations was of analytical grade and regarded as the simulated membrane foulant. It should be noted that the phenol concentrations adopted in this work are high compared to the actual common situation, and this is because we wanted to realize accelerated pollution to the IEMs to evaluate the fouling effect of the phenol on the membranes.
All the BMED experiments were conducted on lab-scale BMED desktop equipment (Moel: EX-3BT) which was supplied by Hangzhou LANRAN Co., Ltd., Hangzhou, China (http://www.lanran.com.cn/?list_17/119.html (accessed on 1 August 2022). Figure 1 shows a picture and a schematic configuration of the BMED membrane stack of the BMED equipment. The applied membrane stack contained ten repeat units, and a three-compartment BPM-AEM-CEM-BPM membrane stack configuration was preferred in view of obtaining pure acid (HX) and alkali (MOH) from salts (MX) of feed solution. The IEMs were also from Hangzhou LANRAN Co., Ltd., the types of these membranes were Model ATG-10 (AEM), Model CTG-10 (CEM), and Model BP-2 (BPM), and the detailed information can be found on the website of Hangzhou LANRAN Co., Ltd., Hangzhou, China (http://www.lanran.com.cn/?list_1/ (accessed on 1 August 2022)). Each applied membrane had an effective active surface equal to 0.0055 m2. The BPM and the CEM which were near the anode constituted the alkali chamber, and the BPM and the AEM which were near the cathode constituted the acid chamber. The AEM and CEM in the middle constituted the feed solution chamber, while the BPM and the electrodes constituted electrode chambers. A 40 g/L NaOH solution was used as the electrolyte media in the electrode chambers. The compartments for acid, alkali, and feed solution were isolated by spacers and connected to a peristaltic pump, and the three solutions were placed in a beaker with a volume of 500 mL.

2.2. BMED Experimental Procedure and Membrane Soaking Experiments

2.2.1. BMED Experimental Procedure

Figure 2 shows a schematic diagram of the BMED experimental apparatus. The electrodes of the membrane stack were made of titanium coated with ruthenium and iridium, and a direct electric field was added to the membrane stack. The compartment for acid, alkali, and feed solutions, respectively, was connected to a 500 mL container with a peristaltic pump to form an external circulation. For all the experiments, the temperature was set to be 25 °C. Other detailed information about the feed solution and corresponding operation parameters is shown in Table 2.
The initial conductivity of the feed NaCl solution with the initial concentration of 160 g/L was shown about 200 mS/cm. During the different single batch BMED operations, as a direct current was applied across the membrane stack, the cations (mainly Na+) in the feed solution were transported through the CEM into the alkali compartment where they could combine with the OH ions produced by the BPM to form alkali NaOH. Meanwhile, the anions (mainly Cl) in the feed solution passed through the AEM into the acid compartment and combined with H+ ions hydrolyzed from the water molecule to form acid HCl. H+ and OH generated by the hydrolysis of the water at the interface of BPM were combined to form water in the electrode liquid compartment [22]. As a result, the NaCl concentration in the feed solution would gradually decline, while the concentration of HCl and NaOH in the acid and alkali chamber would gradually increase. When the NaCl concentration of the feed solution was decreased and the conductivity of the feed solution was changed to about 30–90 mS/cm, which would lead to an obvious increase in the electrical resistance of the whole membrane stack, the BMED experiment was stopped to change the feed solution, which can be regarded as a single batch and the operation time for one single batch was about 90–100 min. It should be mentioned that the decreasing degree in the conductivity of the feed solution was influenced severely by the feed composition and the addition of phenol. Meanwhile, with an initial volume of 500 mL, the volumes of the feed, acid, and alkali solutions were also changed during the single batch operation. At the end of the operation, due to the ion transfer and water splitting, the volumes of the feed NaCl solution, acid solution, and alkali solution were around 270–300 mL, 590–610 mL, and 580–600 mL, and the volume changes were strongly affected by feed composition and the operation parameters.
To understand the fouling effect of the existence of phenol on the IEMs, during the BMED operation, multiple batches were conducted successively and continuously for one BMED operation process, and at the beginning of each batch experiment, the same feed, alkali, and acid solutions were still added to the corresponding chamber, which means that one BMED operation process would be regarded as a continuous process for the membrane stack, although actually, it consisted of several independent batches.

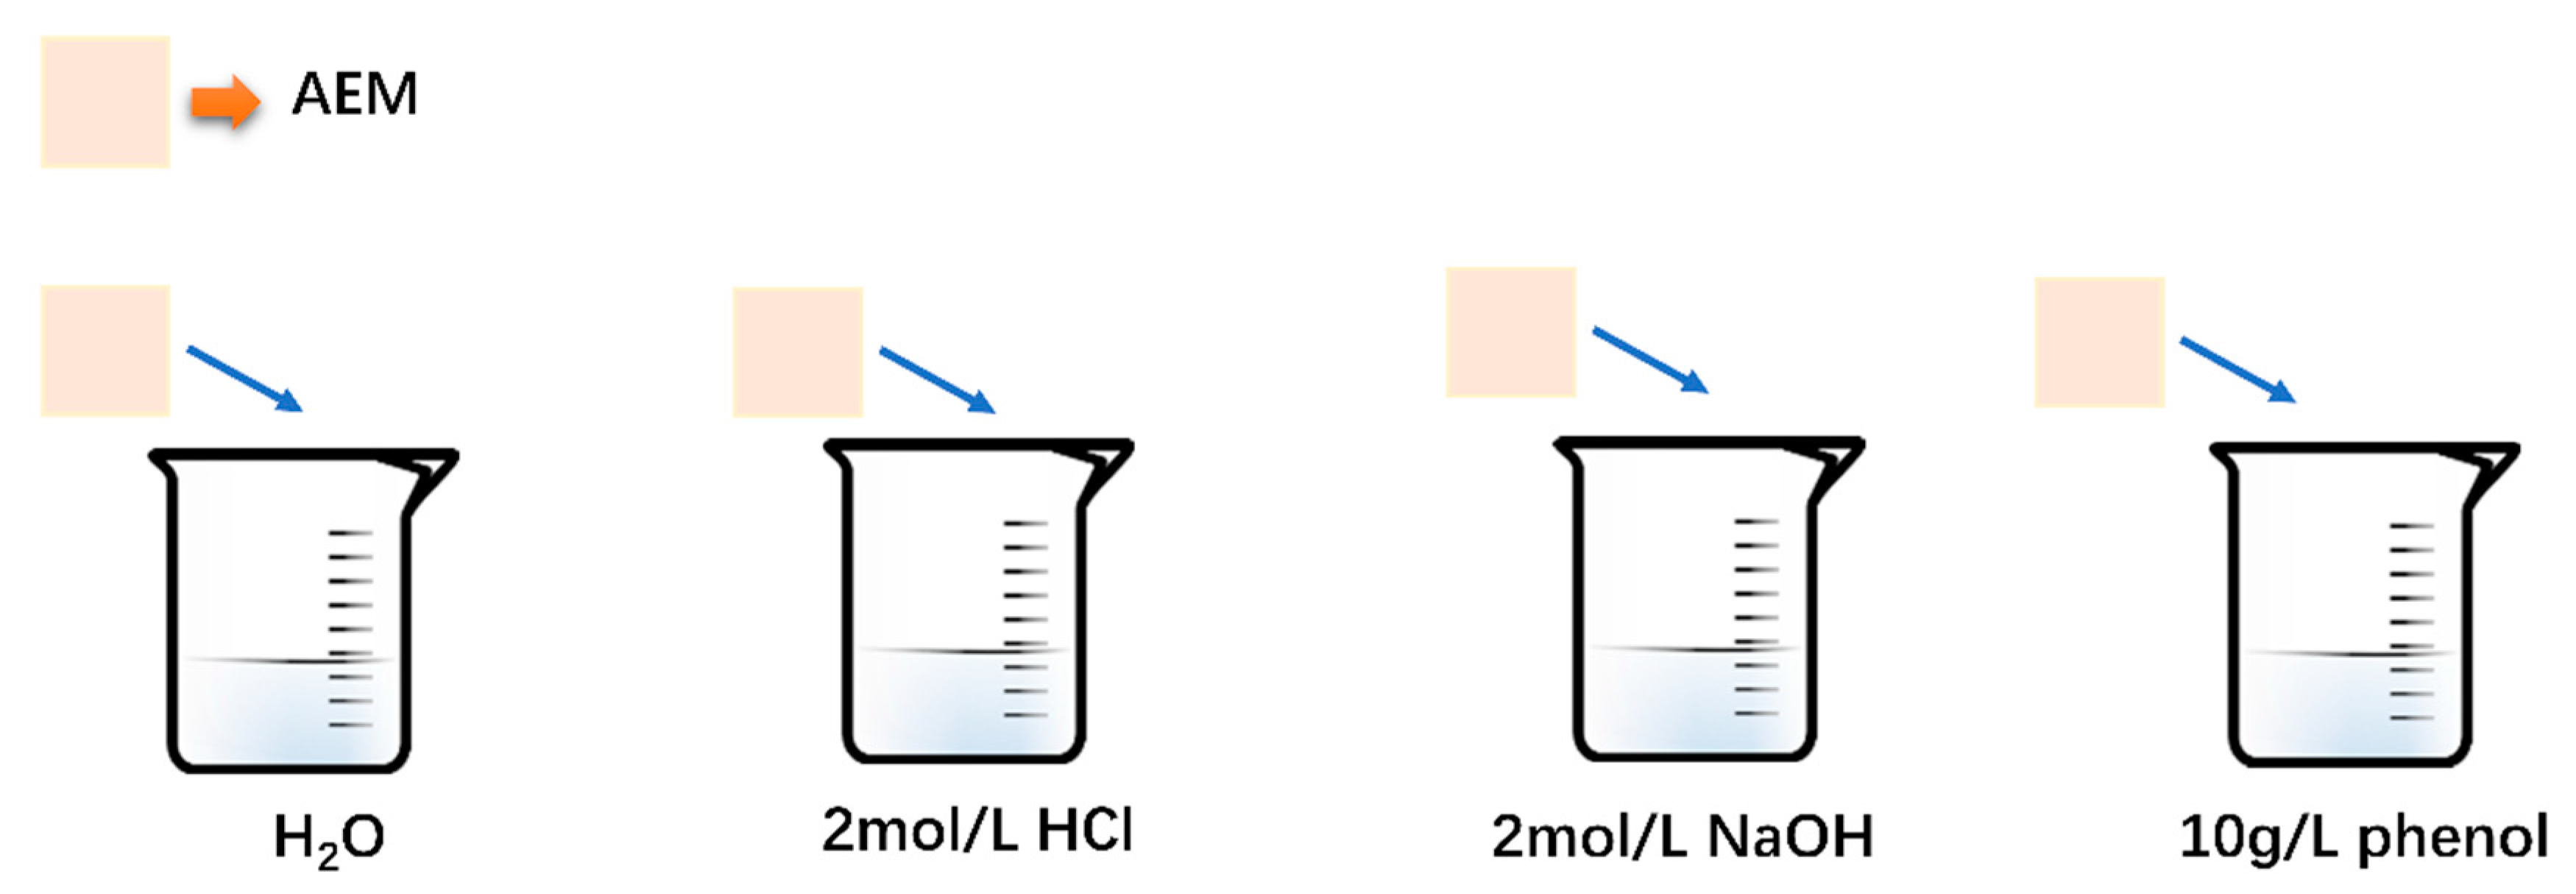
2.2.2. Membrane Soaking Tests

Because the solution environment in the BMED experimental system was relatively complex, including HCl solution, NaOH solution, phenol solution, etc., to eliminate the interference of strong acid and alkali solution environment, a membrane soaking test was developed to explore the fouling mechanism of the polluted IEMs. Figure 3 shows the schematic diagram of the operation: 10 g/L phenol solution, 2 mol/L HCl solution, 2 mol/L NaOH solution, and water was chosen to add to the four beakers with a volume of 200 mL, and the unpolluted membranes (2 × 2 cm) was soaked into the solution at 25 °C for a week. The beakers were sealed and kept shaking to maintain a stable and uniform situation. A week later, the membranes were taken out for characterization after a simple rinse with pure water.

2.3. Analytical Methods and IEMs Characterization

2.3.1. Analytical Methods of the BMED Processes

During the experiments, the samples were taken from the acid, alkali, and feed solution chamber every 10 min to record the concentration evolution. The voltage and current across the BMED stack were directly recorded by the BMED equipment (EX-3BT). The concentration of organic substances such as phenol in the solutions was determined with a total organic carbon analyzer (TOC, TOC-L, SHIMADZU, Kyoto, Japan). The resulting concentration of NaOH produced by the BMED process was determined by titration with a 0.02 mol/L hydrogen potassium phthalate standard solution and an indicator of phenolphthalein. The concentration of HCl solution was determined by titration with a 0.02 mol/L sodium carbonate standard solution and an indicator of methyl orange. Anions (mainly Cl) in alkali solutions were determined by ion chromatography (LC-20AD, SHIMADZU, Kyoto, Japan). Cations such as Na+ were determined by an inductively coupled plasma optical emission spectrometer (ICP, iCAP 6000, Thermo Fisher Scientific, Waltham, MA, USA). To ensure the stability and rationality of the results and reduce any potential error, the concentration of at least three consecutive samples was required to have an average deviation of less than 2%.
The overall performance of the BMED stack during the experiments was mainly evaluated by the current efficiency η and energy consumption E (Wh/g) [23], which are defined by Equations (1) and (2),
η = ( C t × V t C 0 × V 0 ) × F n × I × Δ t
E = 0 t U × I × d t ( C t × V t C 0 × V 0 ) × M
where C 0 (mol/L) and C t (mol/L) are the concentration of NaOH in the alkali compartment at times 0 and t, respectively; V t (L) and V 0 (L) are the circulated volume of NaOH solution at time t and the initial volume of NaOH solution at time 0; t (min) is the duration of cell operation; F is Faraday’s number (96,500 C/mol); I (A) is the constant current, and N (10) is the number of repeating membrane units; U (V) is the voltage drop across the BMED stack; and M is the molecular weight of NaOH (40.00 g/mol).

2.3.2. Characterization of the Ion Exchange Membranes

The morphology of the fresh and fouled IEMs was firstly observed visually under an optical microscope (Olympus BX51, Tokyo, Japan). The small pieces of the samples were placed between a pair of microscope coverslips. Moreover, the microstructure morphology of the IEMs was further examined using a scanning electron microscope equipped with EDS spectrometers (SEM, JEOL JSM-7401, Tokyo, Japan). The piece membrane samples were fractured in liquid nitrogen and coated with platinum. The SEM with the accelerating voltage of 3 kV was used to examine the cross-section and surface morphologies of the membranes. Attenuated total reflectance-Fourier transform infrared spectroscopy (ATR-FTIR, Nicolet 6700, Thermo Fisher, Waltham, MA, USA) was utilized to analyze the surface functional groups and chemical compositions of the fresh and fouled IEMs.

3. Results and Discussion

3.1. The Fouling Effect of Phenol Concentration on the BMED Stack for a Short-Running Process

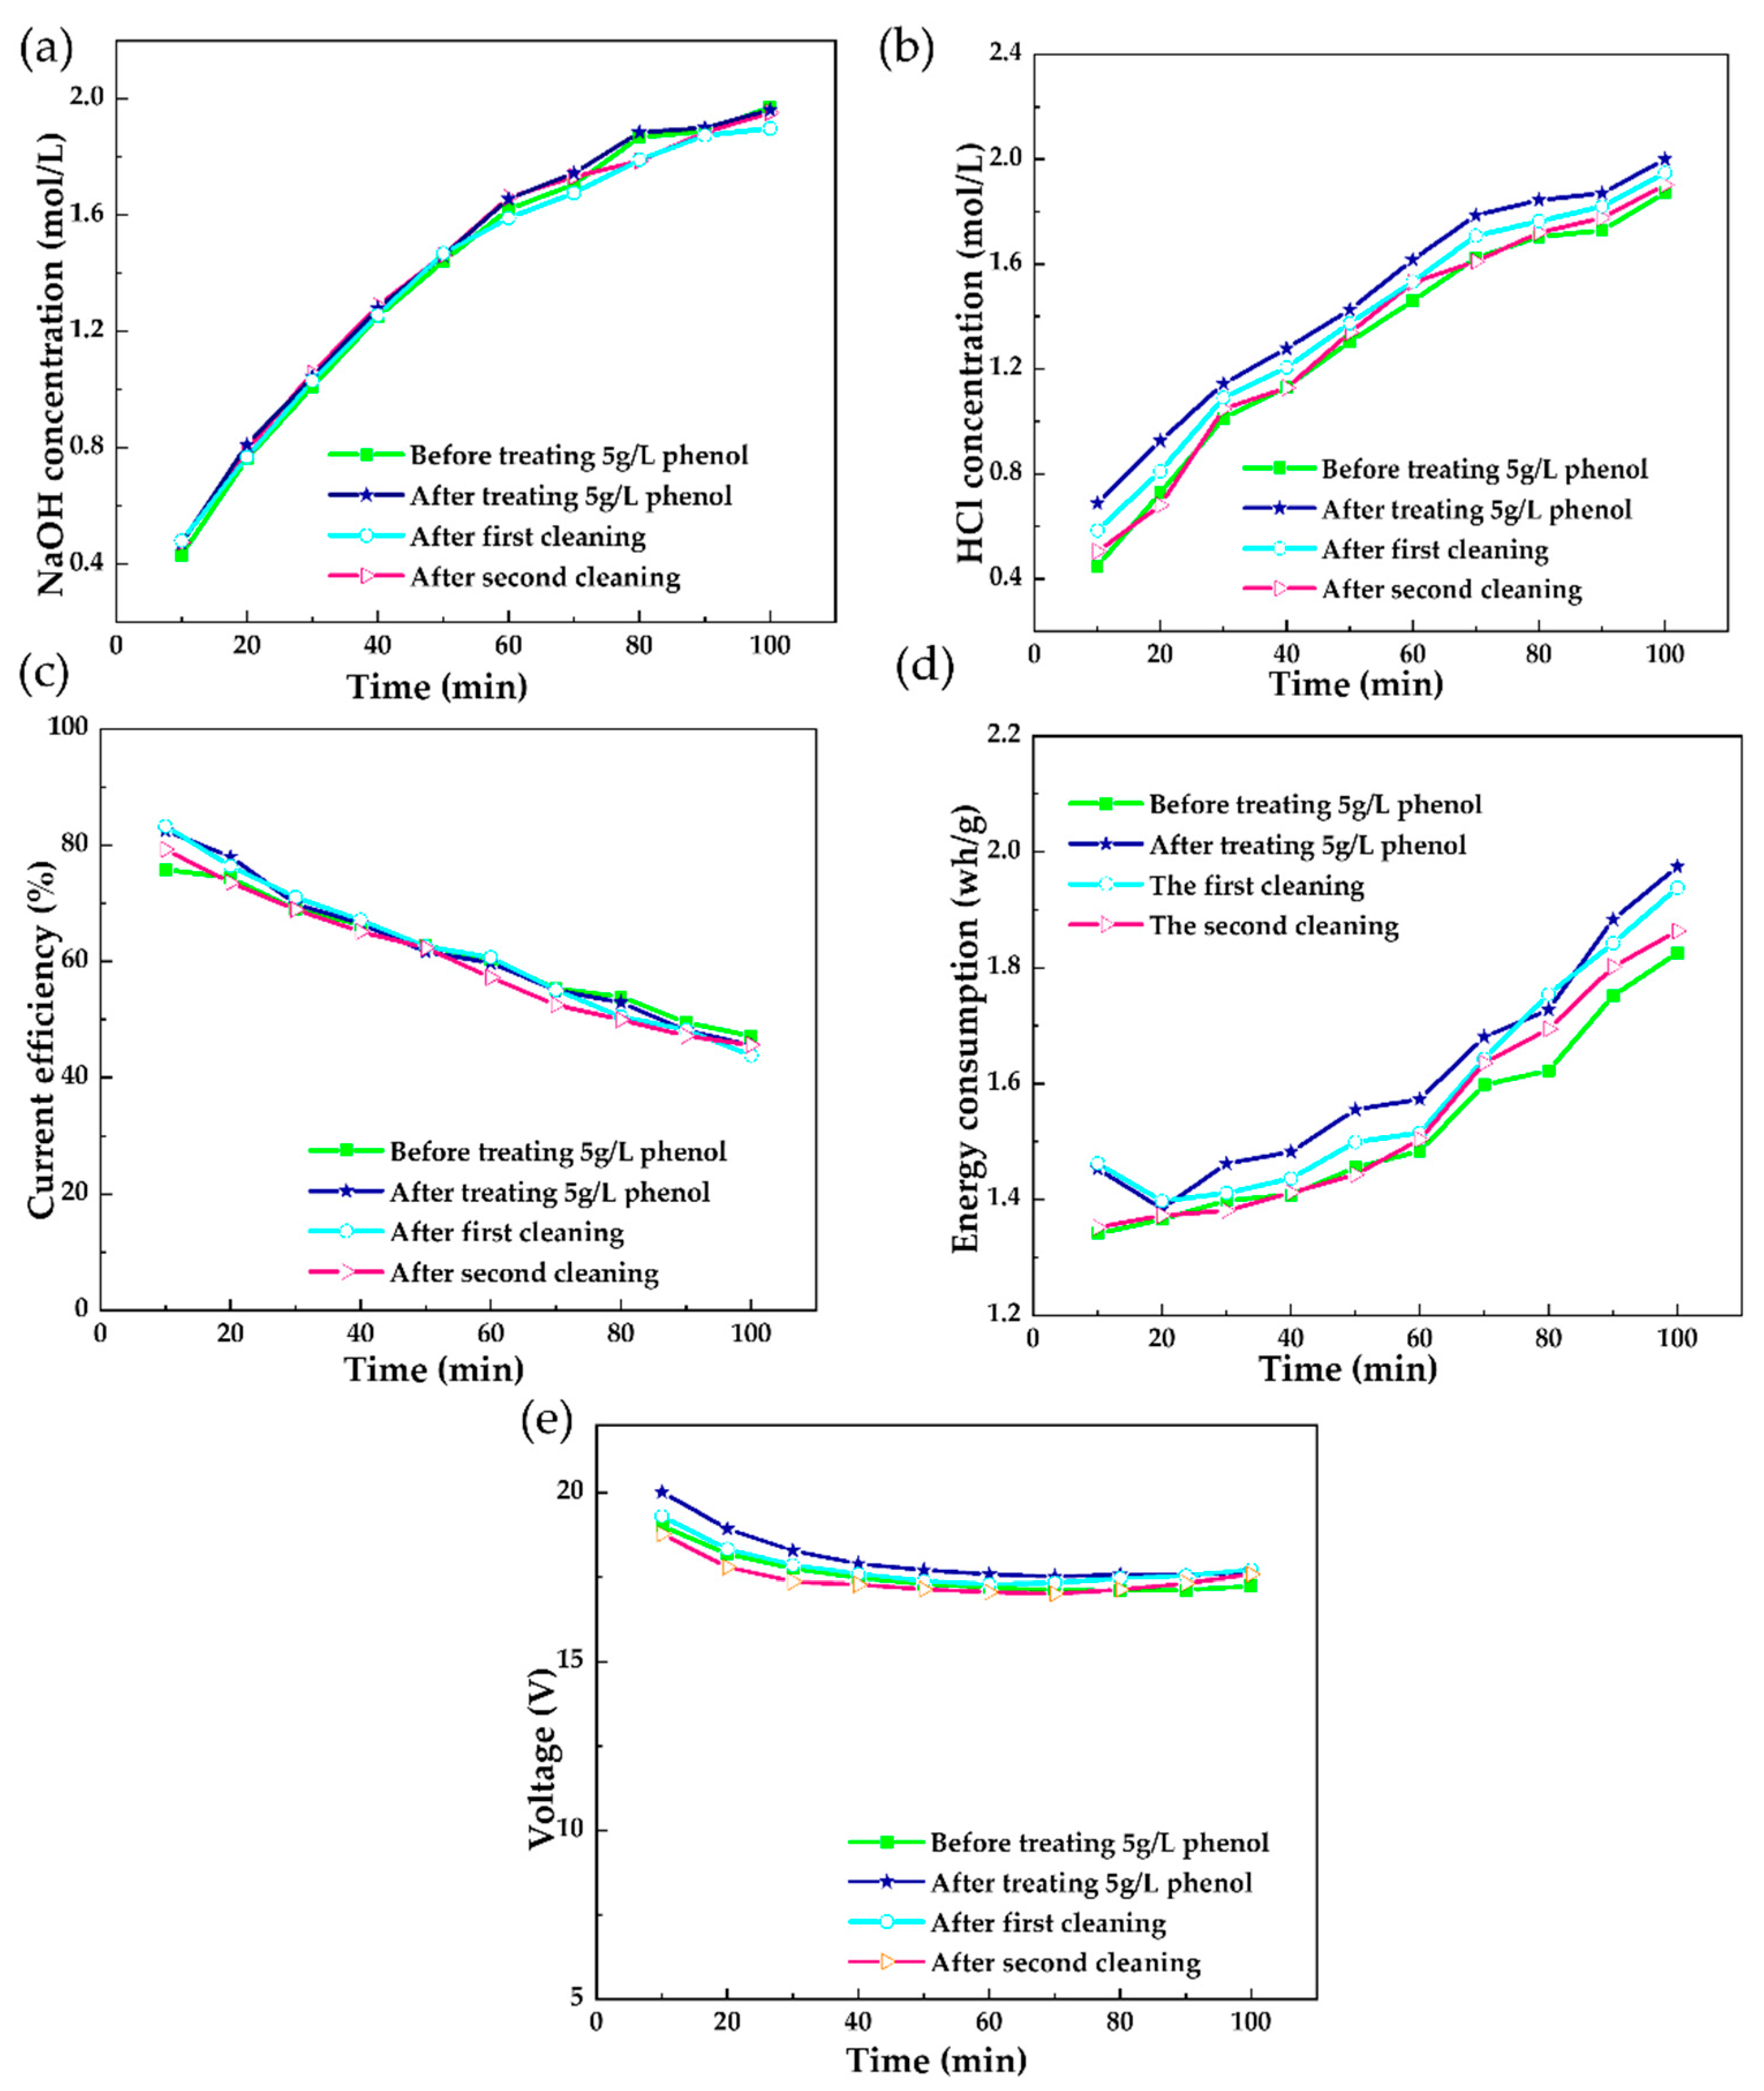
3.1.1. The Effect of Phenol Concentration on the BMED Performance

In this section, different concentrations of phenol, including 1 g/L, 5 g/L, and 10 g/L, were added to the 160 g/L NaCl solution to simulate the pesticide wastewater containing high salinity and phenolic substances. Six successive batches of BMED processes were conducted for each feed solution. Since each batch that ran 100 min was operated intermittently, the total operation time (6 batches) was 600 min. The evolution of resultant alkali and acid concentration, current efficiency, energy consumption, and voltage are shown in Figure 4, Figure 5 and Figure 6.
As shown in Figure 4, Figure 5 and Figure 6, the performance of the membrane stack treating the NaCl solution showed an obvious change with an increase in the phenol concentrations. When the phenol concentration was 1 g/L, in the six batches, no significant changes could be found in the evolution of the concentration of acid HCl and alkali NaOH, current efficiency, energy consumption, and voltage compared to the performance of the fresh membrane stack, which means that the addition of 1 g/L phenol in the concentrated NaCl solution would not affect the performance of the membrane during a short period.
As shown in Figure 5 and Figure 6, when the phenol concentration was increased to 5 g/L and 10 g/L, the performance of the membrane stack gradually presented obvious degradation compared to the fresh membrane stack. For the first batch, the curves of the concentration of acid HCl and alkali NaOH were a little lower than that obtained by the fresh membrane, which resulted in a descent in the curves of current efficiency, energy consumption, and voltage. This may be because the phenol started to accumulate on the membrane surface to impede the ions to pass through the IEMs. Then, from Batch 2 to Batch 6, the curves of the concentration of acid HCl and alkali NaOH, current efficiency, energy consumption, and voltage gradually rose, especially for the sample of 10 g/L phenol concentration, although the evolution trend was mainly similar. It can be speculated that when more phenol was deposited on the IEMs, the phenol enlarged the permeability of IEMs and permitted more ions to pass due to a swelling-like effect, which resulted in a rise in the acid and alkali concentration. Moreover, according to Equation (1), the rise in the alkali concentration C t would lead to a slight increase trend of the current efficiency in Figure 5 and Figure 6 during the BMED process and more ions passed through the IEMs, bringing about a prompt in the voltage under a stable direct current field, when the phenol concentration was higher such as 5 g/L or even 10 g/L. The increase in energy consumption was also consistent with the phenomena above since the presence of phenol increased the overall resistance of the membrane stack so the ion migration required more energy.
It should be mentioned that when the phenol concentration was 10 g/L, at the end of the six batches, there was an abrupt rise in the voltage evolution, and this is because the existence of phenol caused swelling-like fouling of the IEMs, which resulted in more Na+ and Cl in the feed solution chamber migrated to acid and alkali chambers. Correspondingly, the concentration of acid and alkali was increased but the concentration of NaCl in the feed solution chamber decreased to a very low value, which led to an abrupt increase in the electrical resistance of the BMED stack.
Since the membrane fouling phenomenon is more evident in the sample of 5 g/L and 10 g/L, the effects of adding phenol on the selectivity of the BMED stack, including the evolution of the TOC content in the acid chamber and alkali chamber, the content of Na+ in the acid chamber, the content of Cl in the alkali chamber changed from Batch 1 to Batch 6, were investigated further for the higher phenol concentration samples, as shown in Figure 7. It can be seen from Figure 7a,b that, during the BMED process, the phenol (COD) could pass through the AEMs and CEMs and gradually accumulated in the acid and alkali chamber, and the phenol was much easier to travel through the AEMs, which may be due to the fact that PhOH can be converted into PhO that can be easier to pass the AEMs. When there was no phenol in the NaCl feed solution, ions migrated directionally under the direct-current electric field. Anions such as Cl migrated to the positive pole and passed through the AEMs to generate the acid HCl in the acid chamber, while cations like Na+ passed through the CEMs to generate the alkali NaOH. During the migration, due to a decline in the selective permeability of the IEMs and concentration polarization in the system, reverse ion migration can be found. It could be seen from Figure 7c,d that due to the addition of phenol, Na+ reversely passed through the AEMs to gradually accumulate in the acid chamber and the same thing happened to Cl, and the reverse migration of the ions was intensified with an increase in the phenol concentration, which signified that the addition of phenol resulted in the membrane pores becoming larger and a decline in the selectivity of IEM. The influence of the addition of phenol on AEMs was more serious than that on CEMs considering the Na+ content in the acid chamber was higher than the Cl content in the alkali chamber.
Generally, based on the performance change of the BMED stack in a comparatively short period (6 batches, 600 min), the higher the phenol concentration was, the more serious the deformation of the membrane would be. The effect of phenol on the IEMs was gradually accumulated during the BMED operation process, so it could be speculated that if the sample of 1 g/L phenol could run for a pretty long period, the membrane deformation would still be inevitable, and the sample of a higher phenol concentration just accelerated the deformation process.

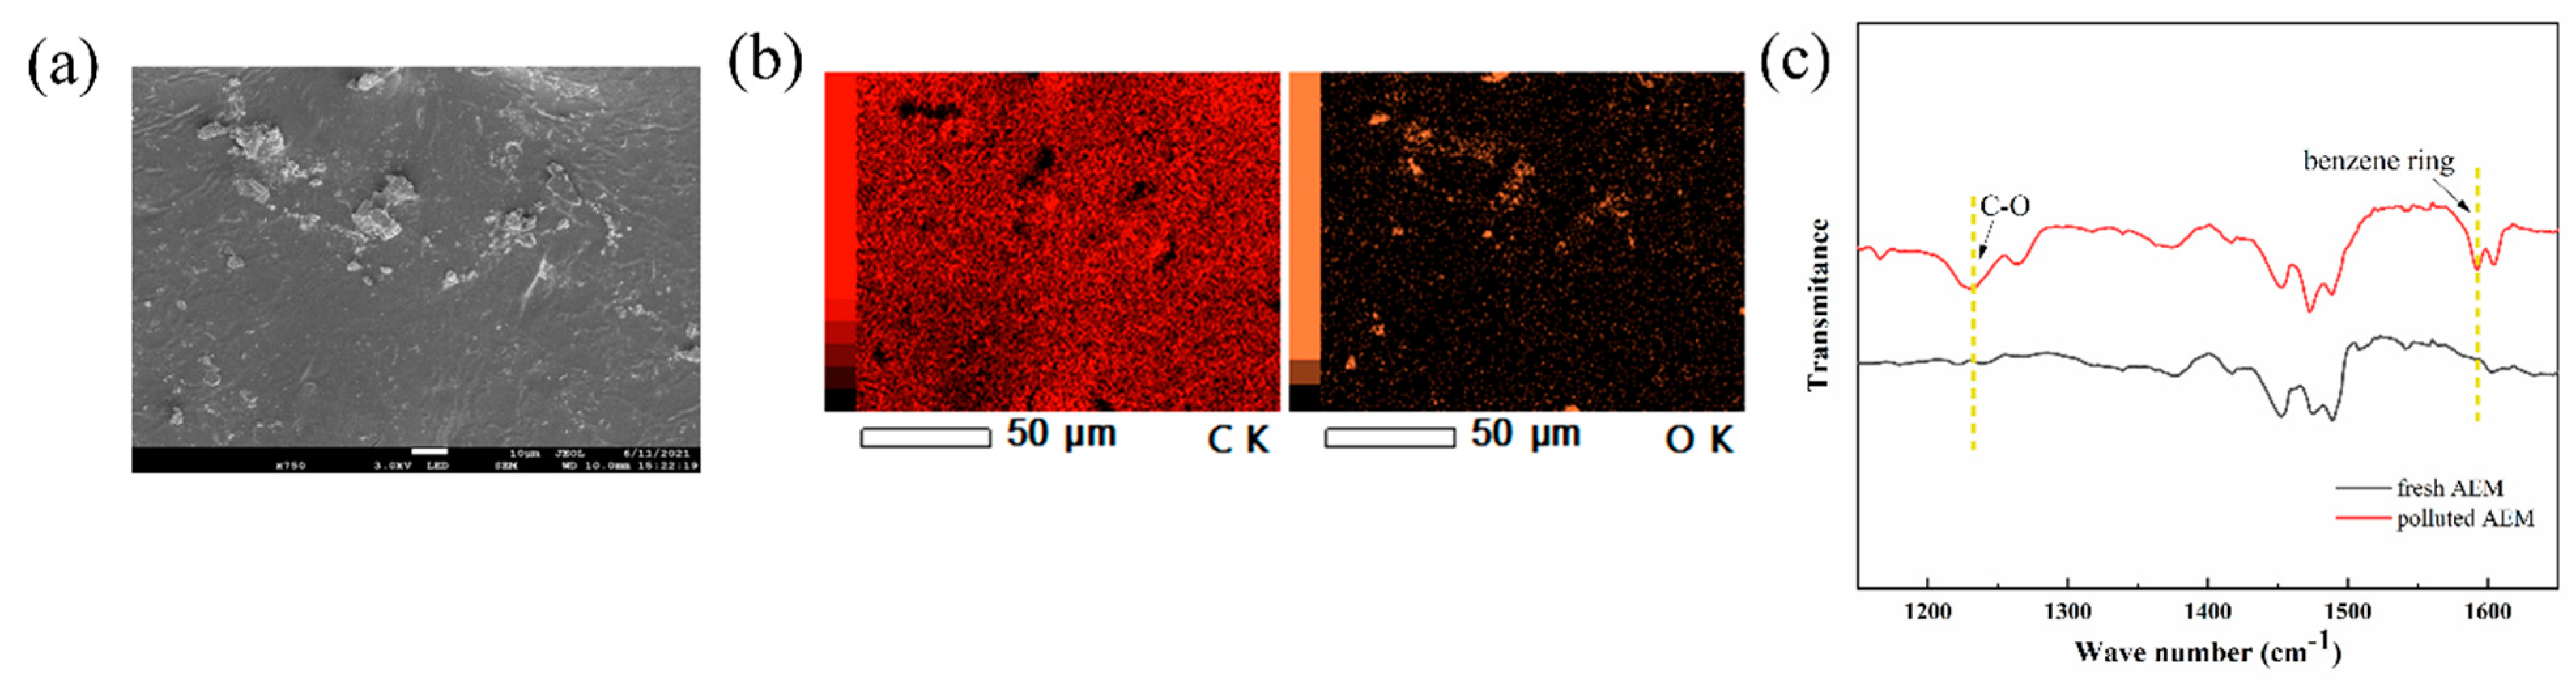
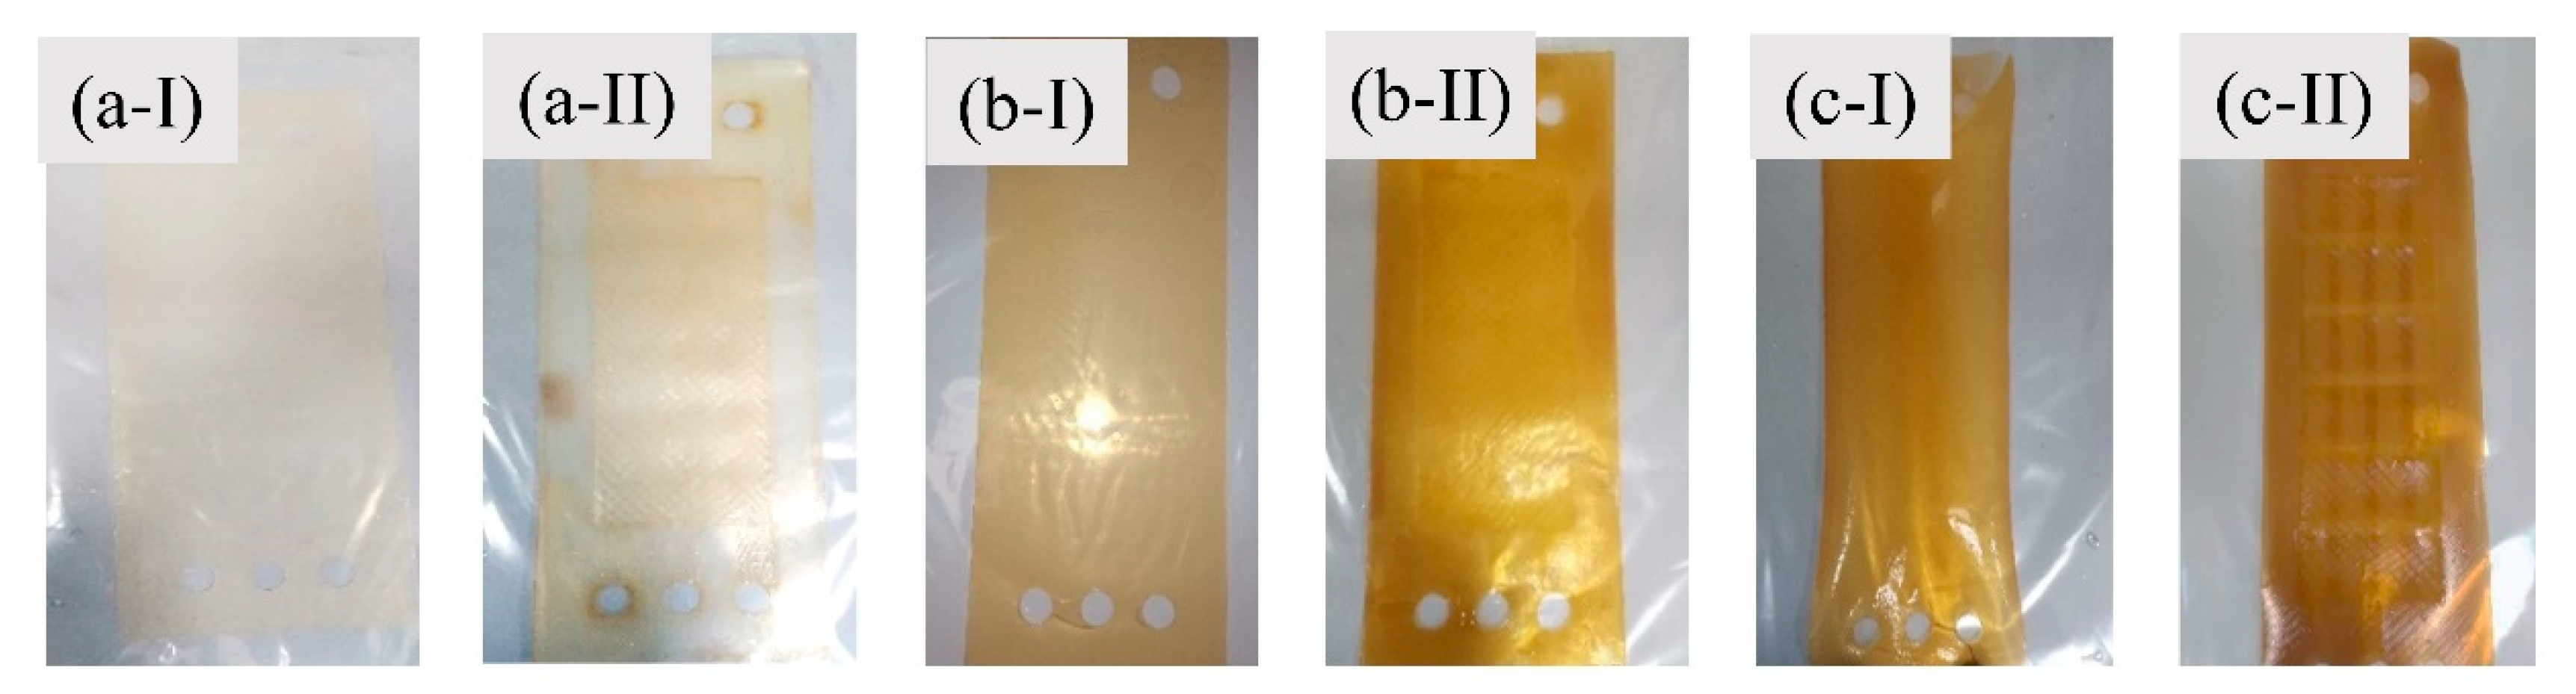
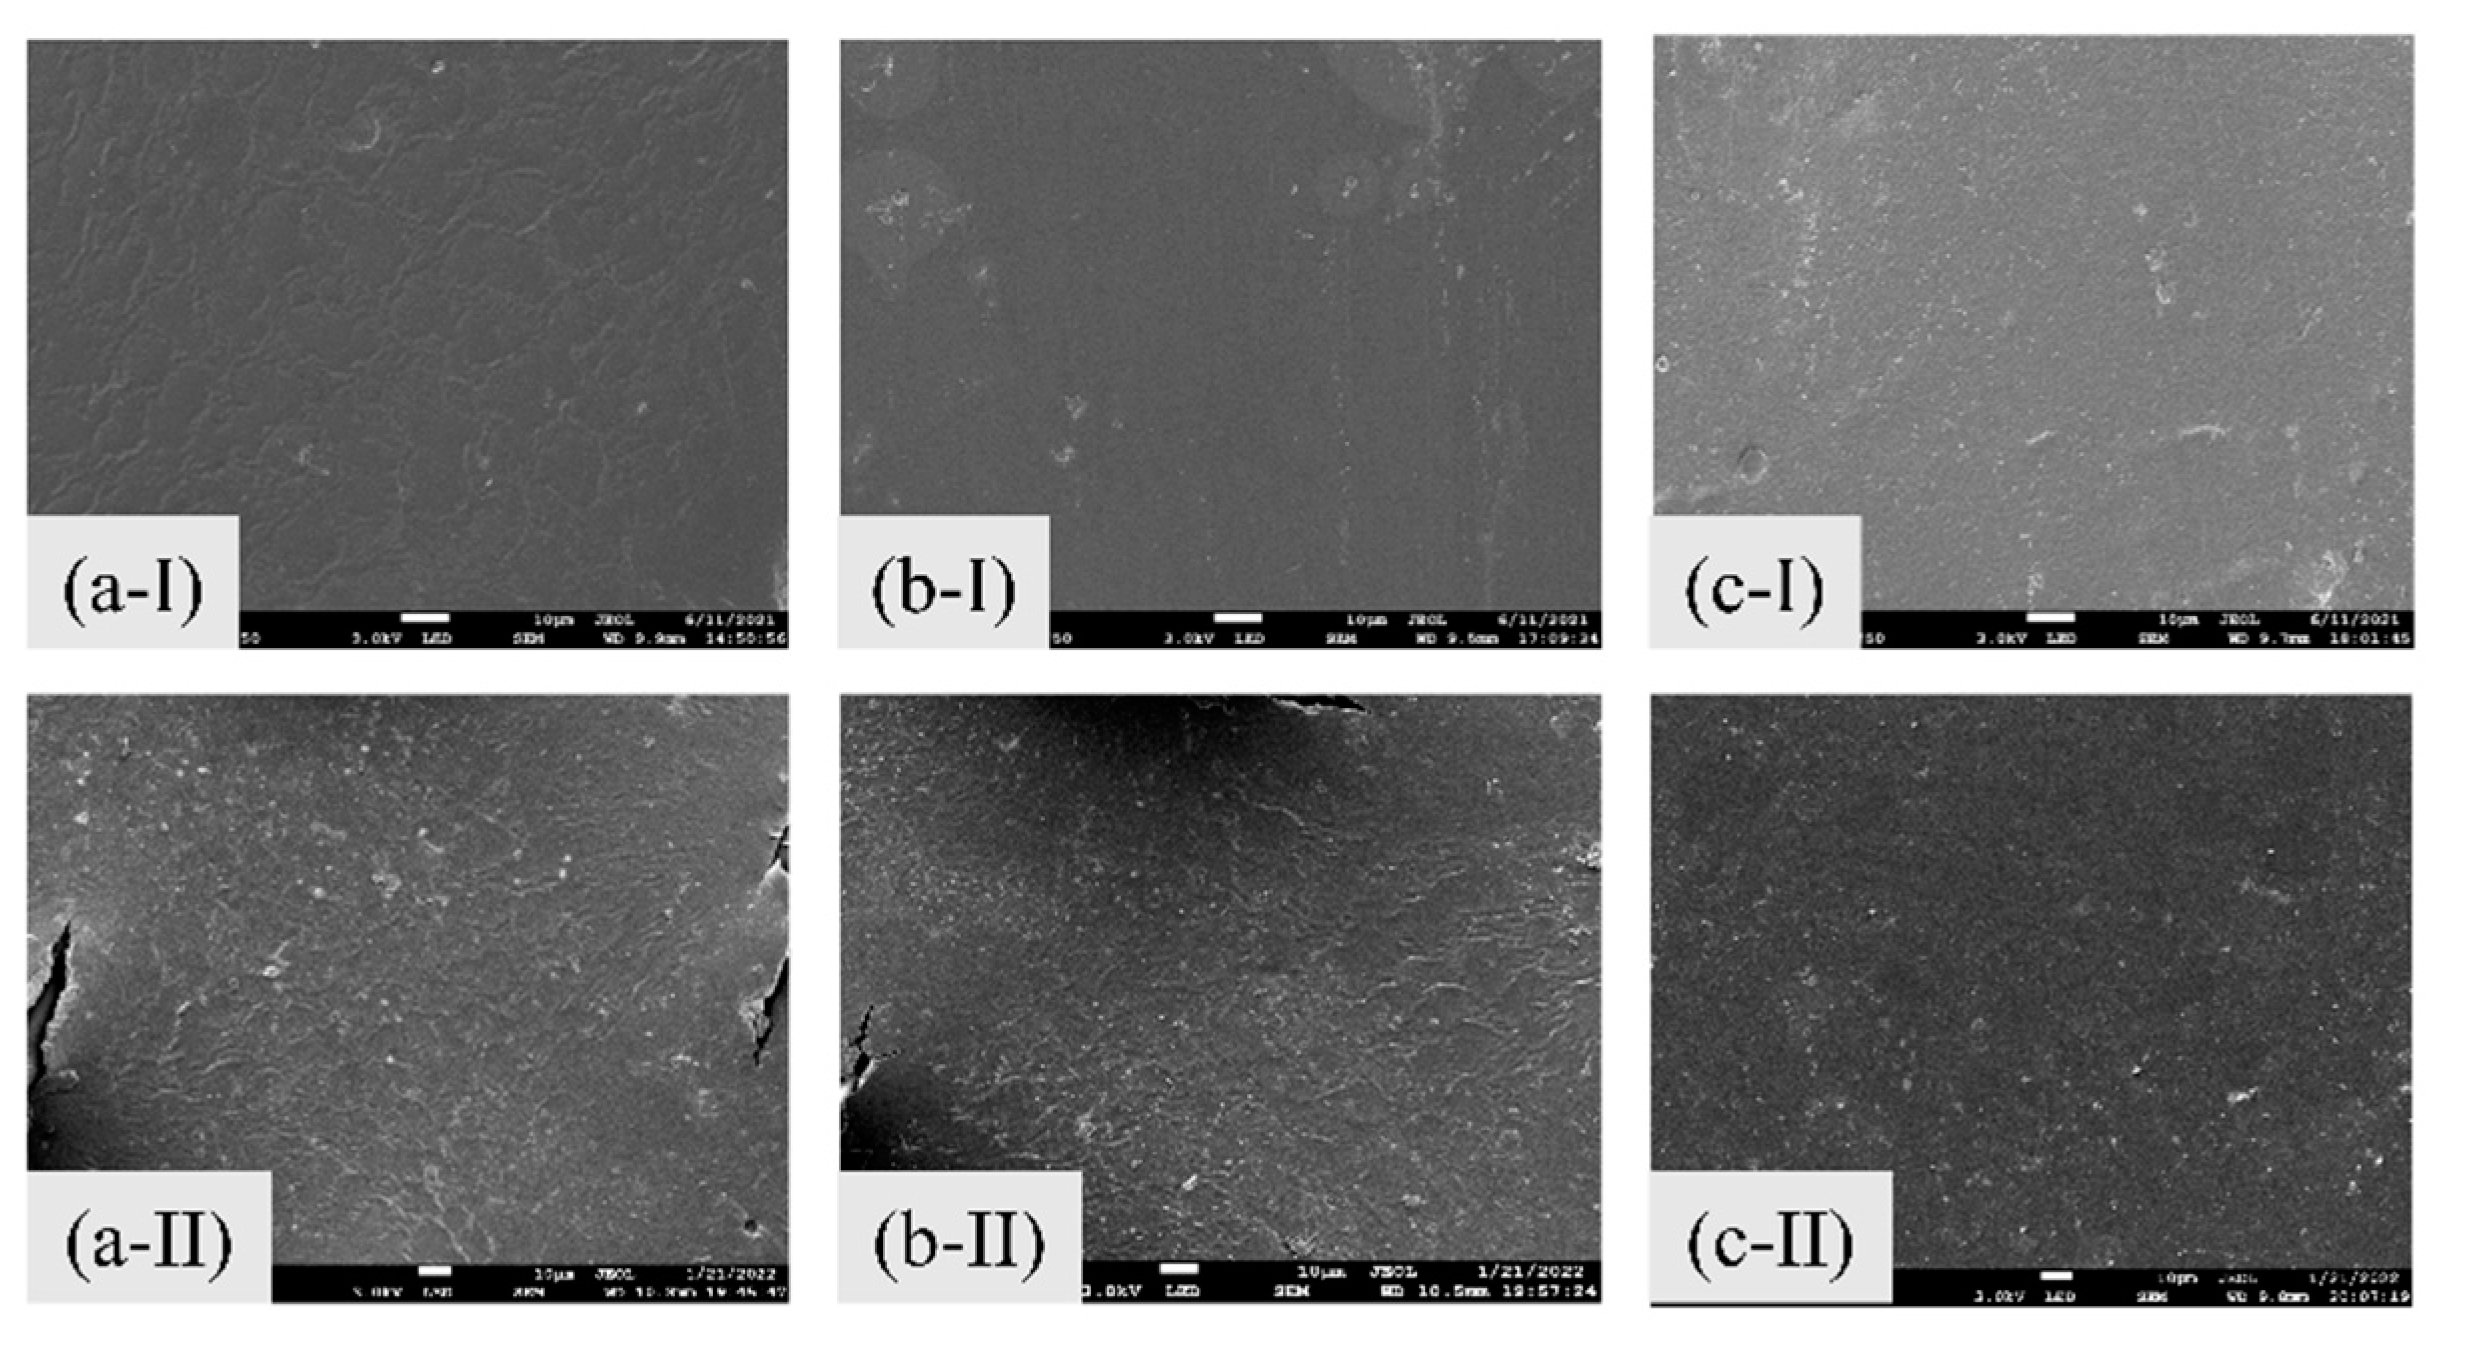
3.1.2. The Effect of Phenol Concentration on the IEMs

In this section, to further study the effect of treating concentrated NaCl solution containing phenol on the structure of IEMs, the membrane stack that was used in the short-running BMED process as shown in Figure 6 was disassembled. The polluted AEMs, CEMs, and BPMs were all characterized and compared to fresh membranes.
Figure 8 shows SEM images of the surface morphology of the polluted AEMs, CEMs, and BPMs in comparison to the fresh membranes. It should be mentioned that the BPM was composed of an anion exchange layer (smooth side) and a cation exchange layer (rough side). The SEM images of fresh and fouled IEMs were taken to present the differences in the morphologies and structures of the membranes used. The SEM images showed obvious contaminants deposited on the surface of IEMs, especially for the AEM (Figure 8b) and the anion exchange layer of BPM (Figure 8d), and the order of pollution degree was the AEM > the smooth side of BPM > the CEM > the rough side of BPM.
The EDS analysis was taken to determine the elemental composition of the fouling layer deposited on the surface of the IEMs presented in Figure 8 and the results are listed in Table 3. Here, considering the IEMs were mainly composed of carbon elements and the functional group of phenol was hydroxyl, EDS analysis of the carbon and oxygen element content on the surface of IEMs was tested to study the pollution caused by phenol. In line with the SEM image results, the oxygen element content on the surface of AEM showed a comparatively obvious rise, while the increases of oxygen element content on the surface of CEM and BPM were small. In addition, according to Figure 9a,b, the contaminant attached to the surface of the membrane presented a higher oxygen element content compared to the other area of the surface, which suggested that the contaminant should be phenol. Moreover, Figure 9c shows the ATR-FTIR spectra of the surface of polluted AEM compared to the fresh AEM. The polluted AEM surface presented the characteristic phenol bands (1230 cm−1 of the carbon-oxygen bond of phenol, 1600 cm−1 of the benzene ring), which also indicated that phenols should be responsible for the membrane pollution.

3.1.3. The Study of Fouling Mechanism by Soaking Membranes

In the two sections above, the presence of phenol in the 160 g/L NaCl solution was proven to be a pollutant with accumulation problems to IEMs, especially for the AEMs during the BMED operation. To further understand the membrane fouling mechanism and explore some feasible cleaning approaches, in this section, as the most easily infected membrane, AEM was selected as the study object of membrane soaking tests.
The membrane soaking test procedure was described in Section 2.2.2, and Figure 10 shows the microscope photos and SEM images of the surfaces of AEMs after the soaking test. According to Figure 10, immersed in water, acid solution, and the alkali solution did not change the surface morphology of the AEM significantly, while the AEM was slightly deformed after being soaked in the phenol solution and obvious pollutants were also found on the membrane surface. Here, it can be speculated that acid and alkali are friendly and mild for IEMs, while the phenol was able to be attached and deposited on the surface of the membrane due to some adhesion interaction, which may be electrostatic interaction, affinity interaction, or geometrical factor according to the reference [12,21,24].
The EDS analysis of the surface and cross-section of AEMs were also conducted to analyze pollutants and the results are listed in Table 4. Firstly, the AEMs soaked in water, acid, and alkali solution presented similarly, which is consistent with the morphology analysis and suggests that they have no effects on the IEMs. In contrast, the oxygen element content on the surface of AEM soaked in phenol solution increased distinctly, and soaking in the phenol solution also altered the cross-section compared to that in water. The results suggested that phenol could not only be attached to the surface of AEM but also adhered to the inside parts of the membrane, which cannot be removed easily by a simple rinse with pure water.
Based on the results of soaking tests, phenol pollutants could be attached to the surface and interior of the AEMs. Related references [12,24] reported a possible fouling mechanism between the IEMs and phenols, which is the hydroxyl functional groups of phenol could react with the functional groups of the quaternary ammonium resins which constituted the IEMs due to the π-π stacking reaction between the benzene ring of phenol and the aromatic ring in the IEMs; In addition, the electrostatic interaction between PhO in the solution and the positive charge points of the AEMs would bring out the adsorption of PhOH on the surface and interior of the membrane. Mainly negative charge points existed on the CEMs, and this may be the reason why the CEM and cation exchange layer of BPM were not severely polluted during the BMED processes.
Generally, for the short-running process of NaCl solution containing phenol, the results of the BMED performance, the microstructure of IEMs, and the AEM soaking experiments all confirmed that the presence of phenol would cause IEMs fouling and deformation, which would decrease the selectivity of the membrane and enlarge the permeability during the short running period. Moreover, phenol could be deposited and accumulated on the surface and interior of the membranes, which may also lead to a decline in permeability due to blockage-like fouling of the membrane pores for a longer running time.

3.1.4. Membrane Cleaning Exploration

To recover the performance of the membrane stack, according to previous research [20,25,26], chemical reagents can be selected to clean the polluted membrane. Before conducting in situ chemical cleaning, the membrane soaking tests were firstly carried out to determine a suitable cleaning reagent and its concentration. Herein, different kinds of reagents with different concentrations were selected [20] to conduct the soaking experiments and the procedure was similar to that described in Section 2.2.2: 0.1 wt.% HCl solution, 0.1 wt.% NaOH solution, pure water, and 1 wt.% NaOH solution was tested. The AEMs which had been soaked in 10 g/L phenol solution for one week and stored at 25 °C for one week were considered as the study object. Then, according to the soaking test procedure, the polluted AEMs and the different solutions were put in the beaker (sealed) and ensured uniform mixing by continuous shaking. A week later, the AEMs were taken out to characterize after a simple rinse with pure water.
Figure 11 shows the microscope photos and SEM images of the polluted membrane surfaces after the cleaning. It could be seen that water barely had any effects on the pollutants, while the pollutants on the surface of the membrane began to decrease after cleaning with chemical reagents. The membrane cleaned with the 0.1 wt.% NaOH solution was cleaner than that cleaned with the 0.1 wt.% HCl solution, because NaOH could react with phenol and dissolve phenol from the membranes. Furthermore, comparing the cleaning effect of the 0.1 wt.% NaOH solution with that of 1 wt.% NaOH solution, no significant change could be found; as a result, 0.1 wt.% NaOH solution would be regarded as a suitable chemical reagent for membrane fouling cleaning.
EDS analysis was also used to confirm the suitable cleaning reagent and its concentration, and the results could be found in Table 5. Table 5 presented that the oxygen content on the surface of the membrane soaked in 0.1 wt.% NaOH solution was decreased by almost 6 wt.% compared to the uncleaned membrane (9.93 wt.% as listed in Table 4), and the oxygen content on the cross-section of the membrane was decreased by nearly 3 wt.% (8.86 wt.% as listed in Table 4). While cleaning with the HCl solution was able to decrease the oxygen content on the surface of the membrane by only almost 1 wt.%, and barely decrease the oxygen content in the membrane interior. Pure water was even worse than the HCl solution, which agreed with the morphology analysis. Moreover, there is no significant difference between the cleaning effect of 0.1 wt.% NaOH solution and that of 1 wt.% NaOH solution based on the decreases in the oxygen content. Considering material consumption and potential influence on the IEMs, 0.1 wt.% NaOH solution would be desirable for the optimized cleaning reagent.

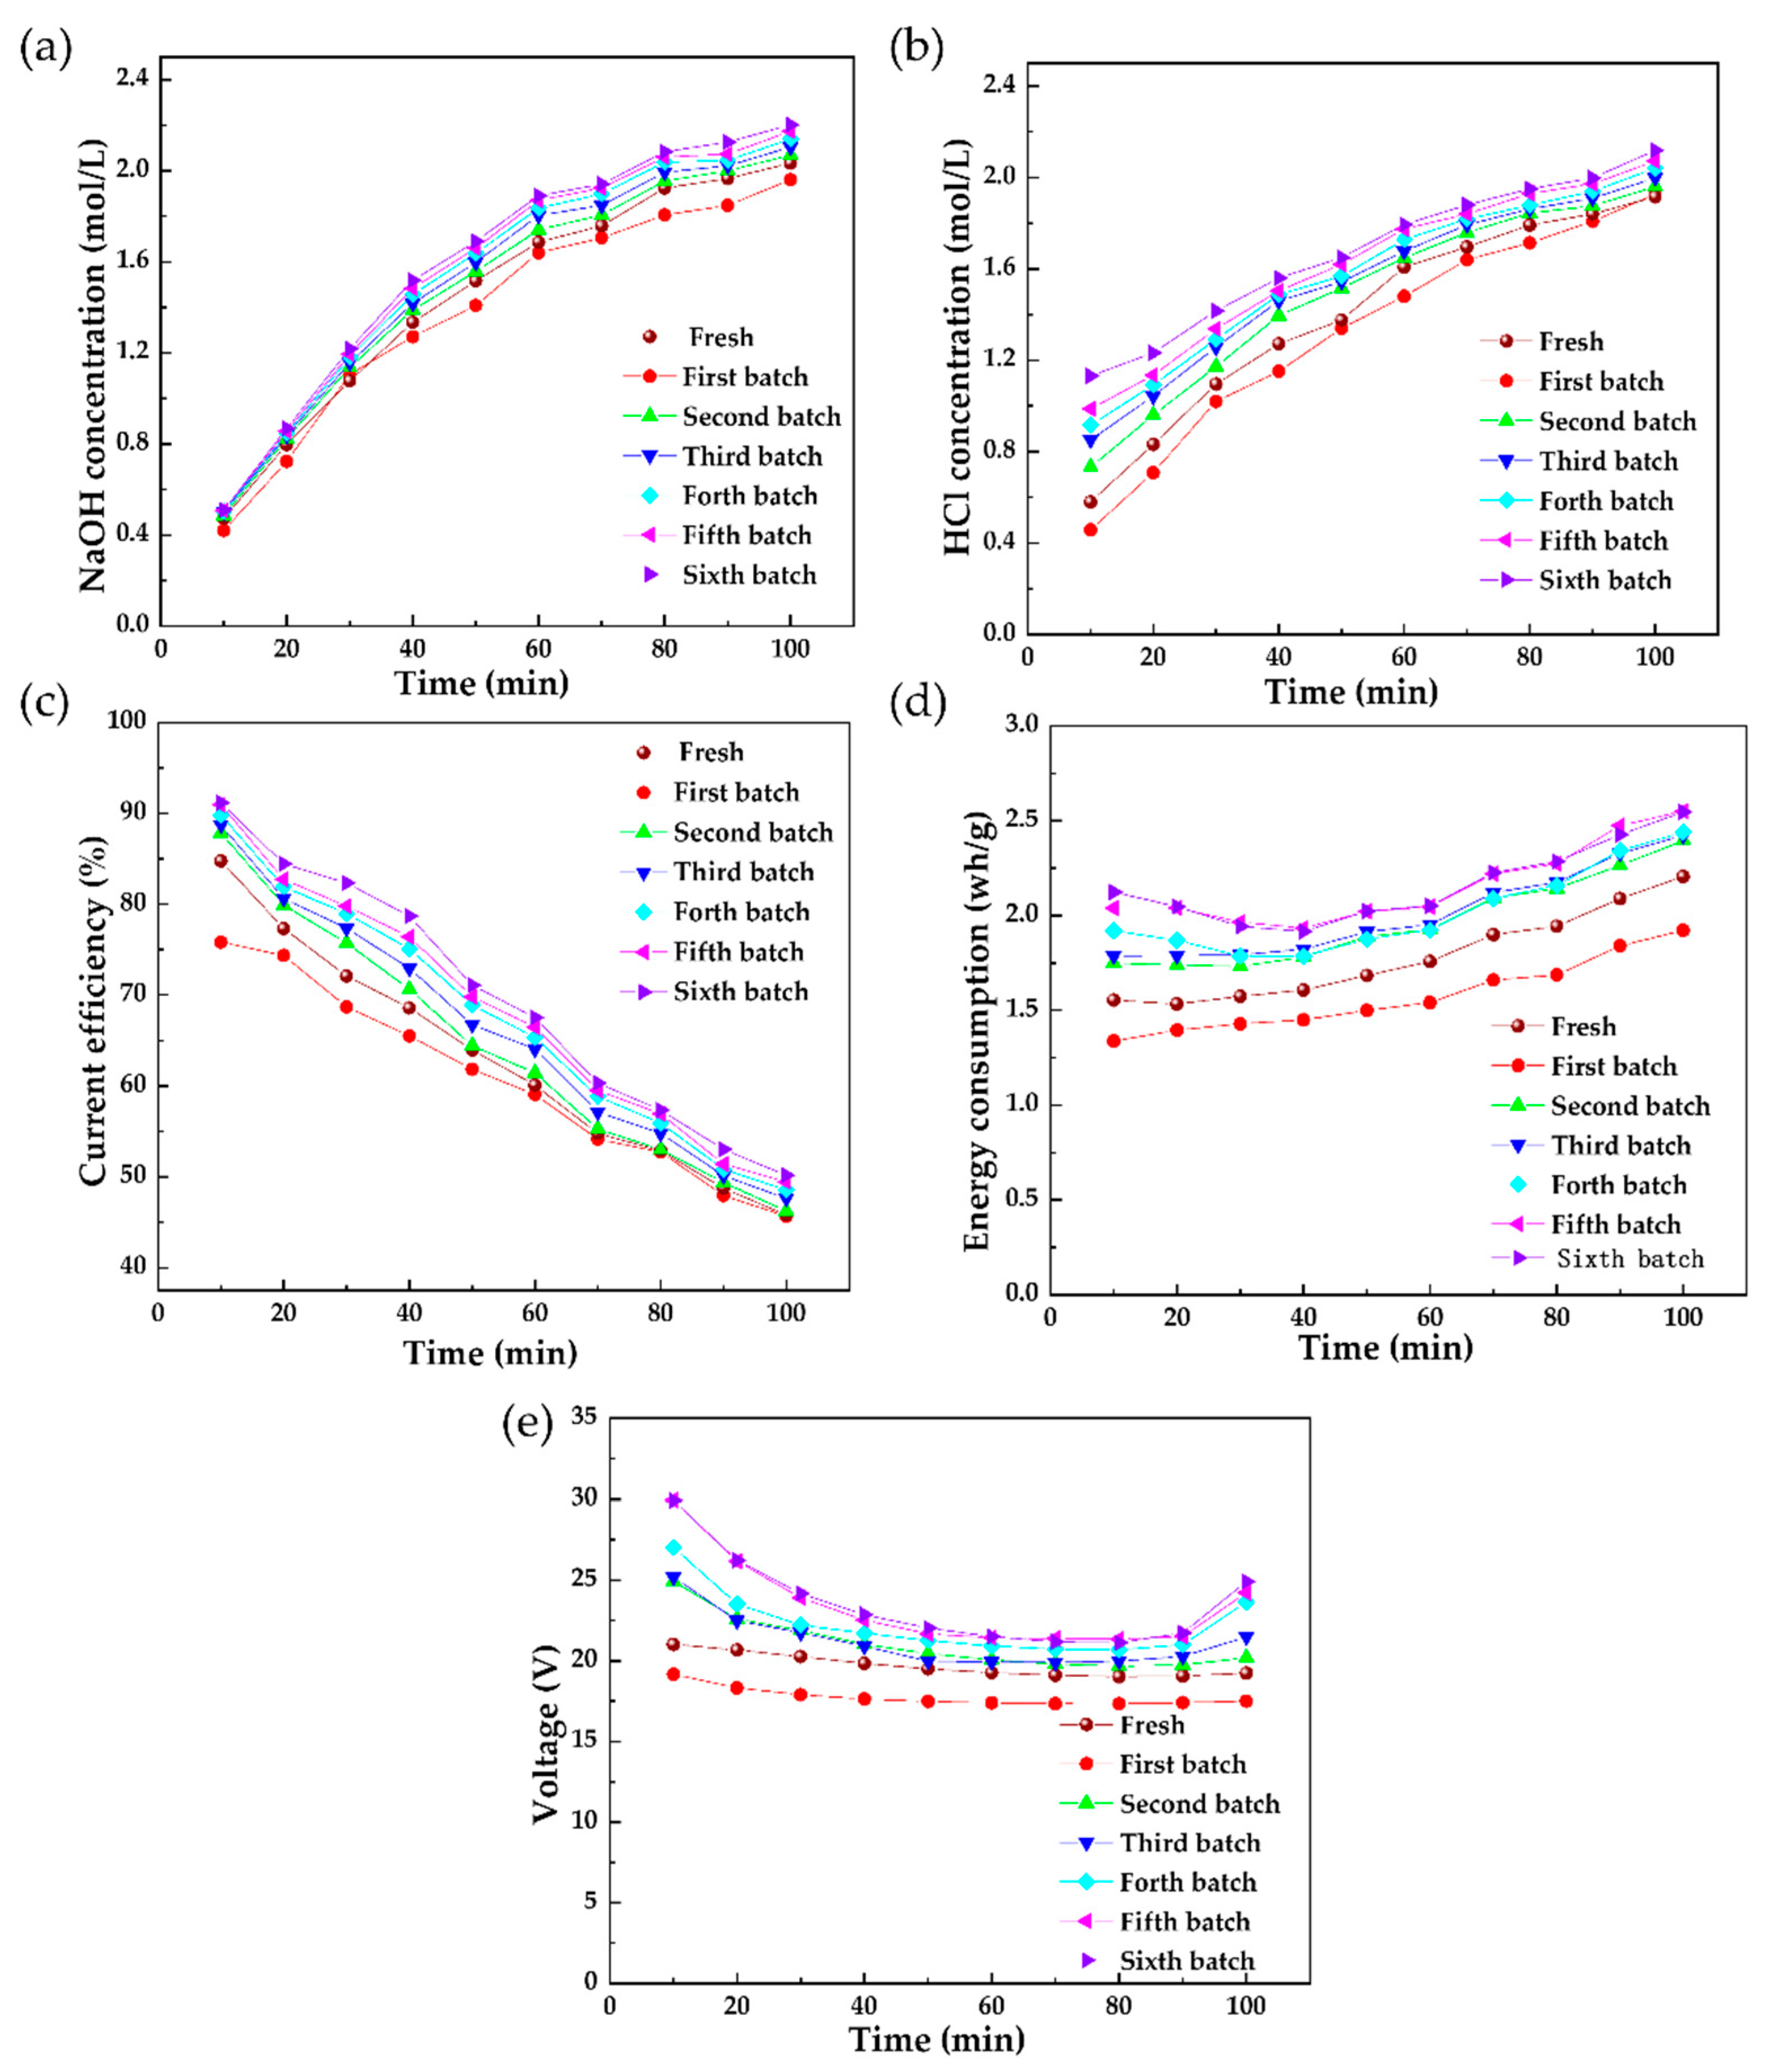
3.1.5. In Situ Chemical Cleaning on the Polluted Membrane Stack after Short-Running Processes

In this section, the membrane stacks that treated the solution containing 5 g/L and 10 g/L phenol are taken as the cleaning objects to carry out the in situ cleaning experiments. The in situ cleaning experimental procedure is that the membrane stack was still installed on the BMED platform, and the 0.1 wt.% NaOH solution was put in the feed, acid, and alkali chamber to conduct a flowing cleaning without the direct current field. The solution in the electrode chamber was pure water. The NaOH solution was first recycled for 120 min in each chamber, then replaced by pure water for another 30 min, which was considered to be one complete cleaning cycle (150 min). In this section, the two polluted membrane stacks were both cleaned by two cycles (300 min). Furthermore, at the end of each cleaning cycle, the membrane stack was used to treat a 160 g/L NaCl solution by the BMED operation, according to Section 2.2.1. By comparing the performance of the membrane stack with that of the unpolluted membranes, the recovery of the performance of the polluted membrane stack was evaluated to confirm the reversibility of the membrane fouling caused by phenol during the short operation period. The effect of the cleaning on the evolution of resultant alkali and acid concentration, current efficiency, energy consumption, and voltage are shown in Figure 12 and Figure 13.
As shown in Figure 5 and Figure 6, after treating the 160 g/L NaCl solution containing a phenol solution system, the curves of the concentration of acid and alkali, current efficiency, energy consumption, and voltage were all higher due to the pollution caused by phenol in the membrane stack compared to that of the unpolluted systems, especially for the membrane stack that was fouled by the 10 g/L phenol, whereas, as shown in Figure 12 and Figure 13, after the first cycle of the cleaning experiment, it was found that the curves of concentration of acid and alkali, current efficiency, energy consumption, and voltage were decreased to a certain extent because the NaOH solution made the phenol fall off due to the reaction between them or the flow force. Moreover, after the second cycle, the performance of the two membrane stacks basically returned to the original state that was presented by the unpolluted systems, which suggested that the two cycles should be enough for the membrane cleaning.
Figure 14 shows the effect of the cleaning cycles on the selectivity of the BMED stack. The TOC contents in the acid chamber and alkali chamber were still high after the first cleaning cycle, which indicated that the phenol was not removed completely, and after the second cycle, the TOC content in the acid and alkali chambers was removed a lot, indicating an ideal cleaning effect. Moreover, after the two cleaning cycles, the Na+ content of the acid chamber and the Cl content of the alkali chamber were almost similar compared to the migration level of the unpolluted membrane stack (red line in Figure 14). In conclusion, in the short operation period (600 min), the NaCl solution containing a high concentration of phenol would cause swelling-like fouling and degradation of the IEMs, but the performance of the membrane stack could be recovered after in situ chemical cleaning with 0.1 wt.% NaOH solution, which indicated that the membrane fouling in the short-running process was reversible. This should be attributed to the operation time of the short-running process which was not very long so that the deformation of the IEMs can be reversible and recovered after the phenol contaminants deposited inner the IEMs were removed by the flowing NaOH solution.

3.2. The Effect of Concentrated Phenol in 160 g/L NaCl Solution on the BMED Stack for a Long-Running Process

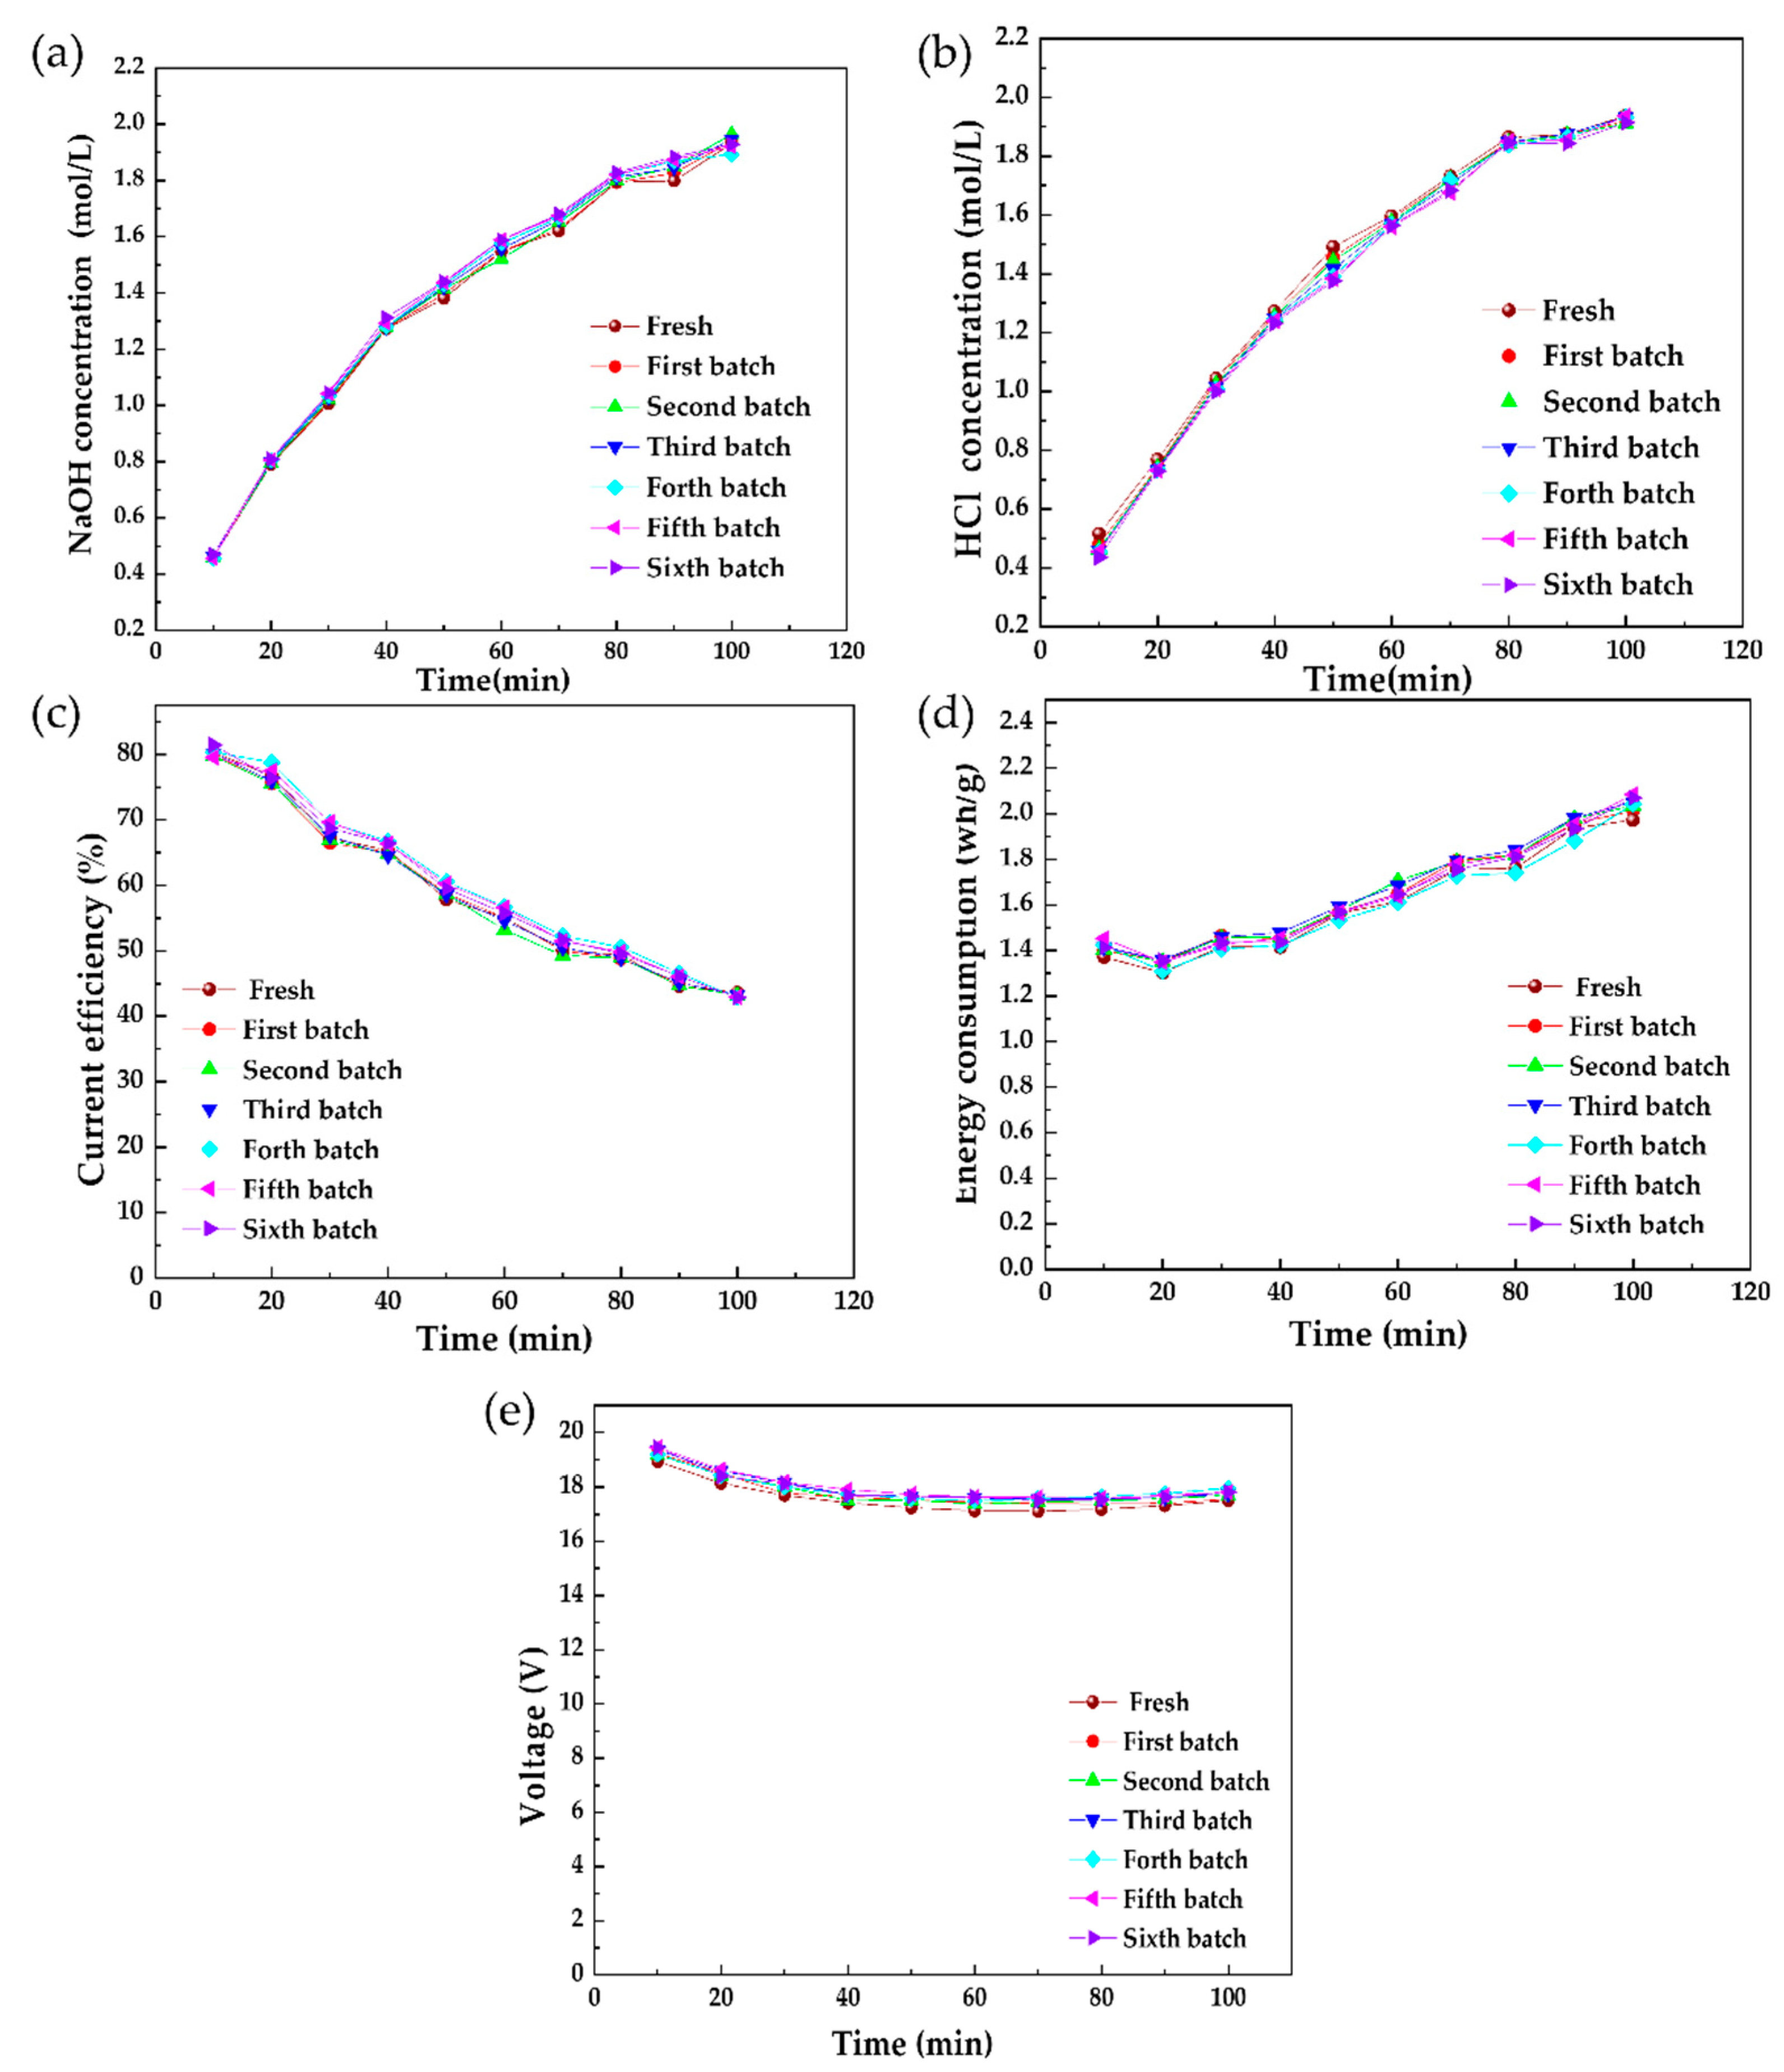
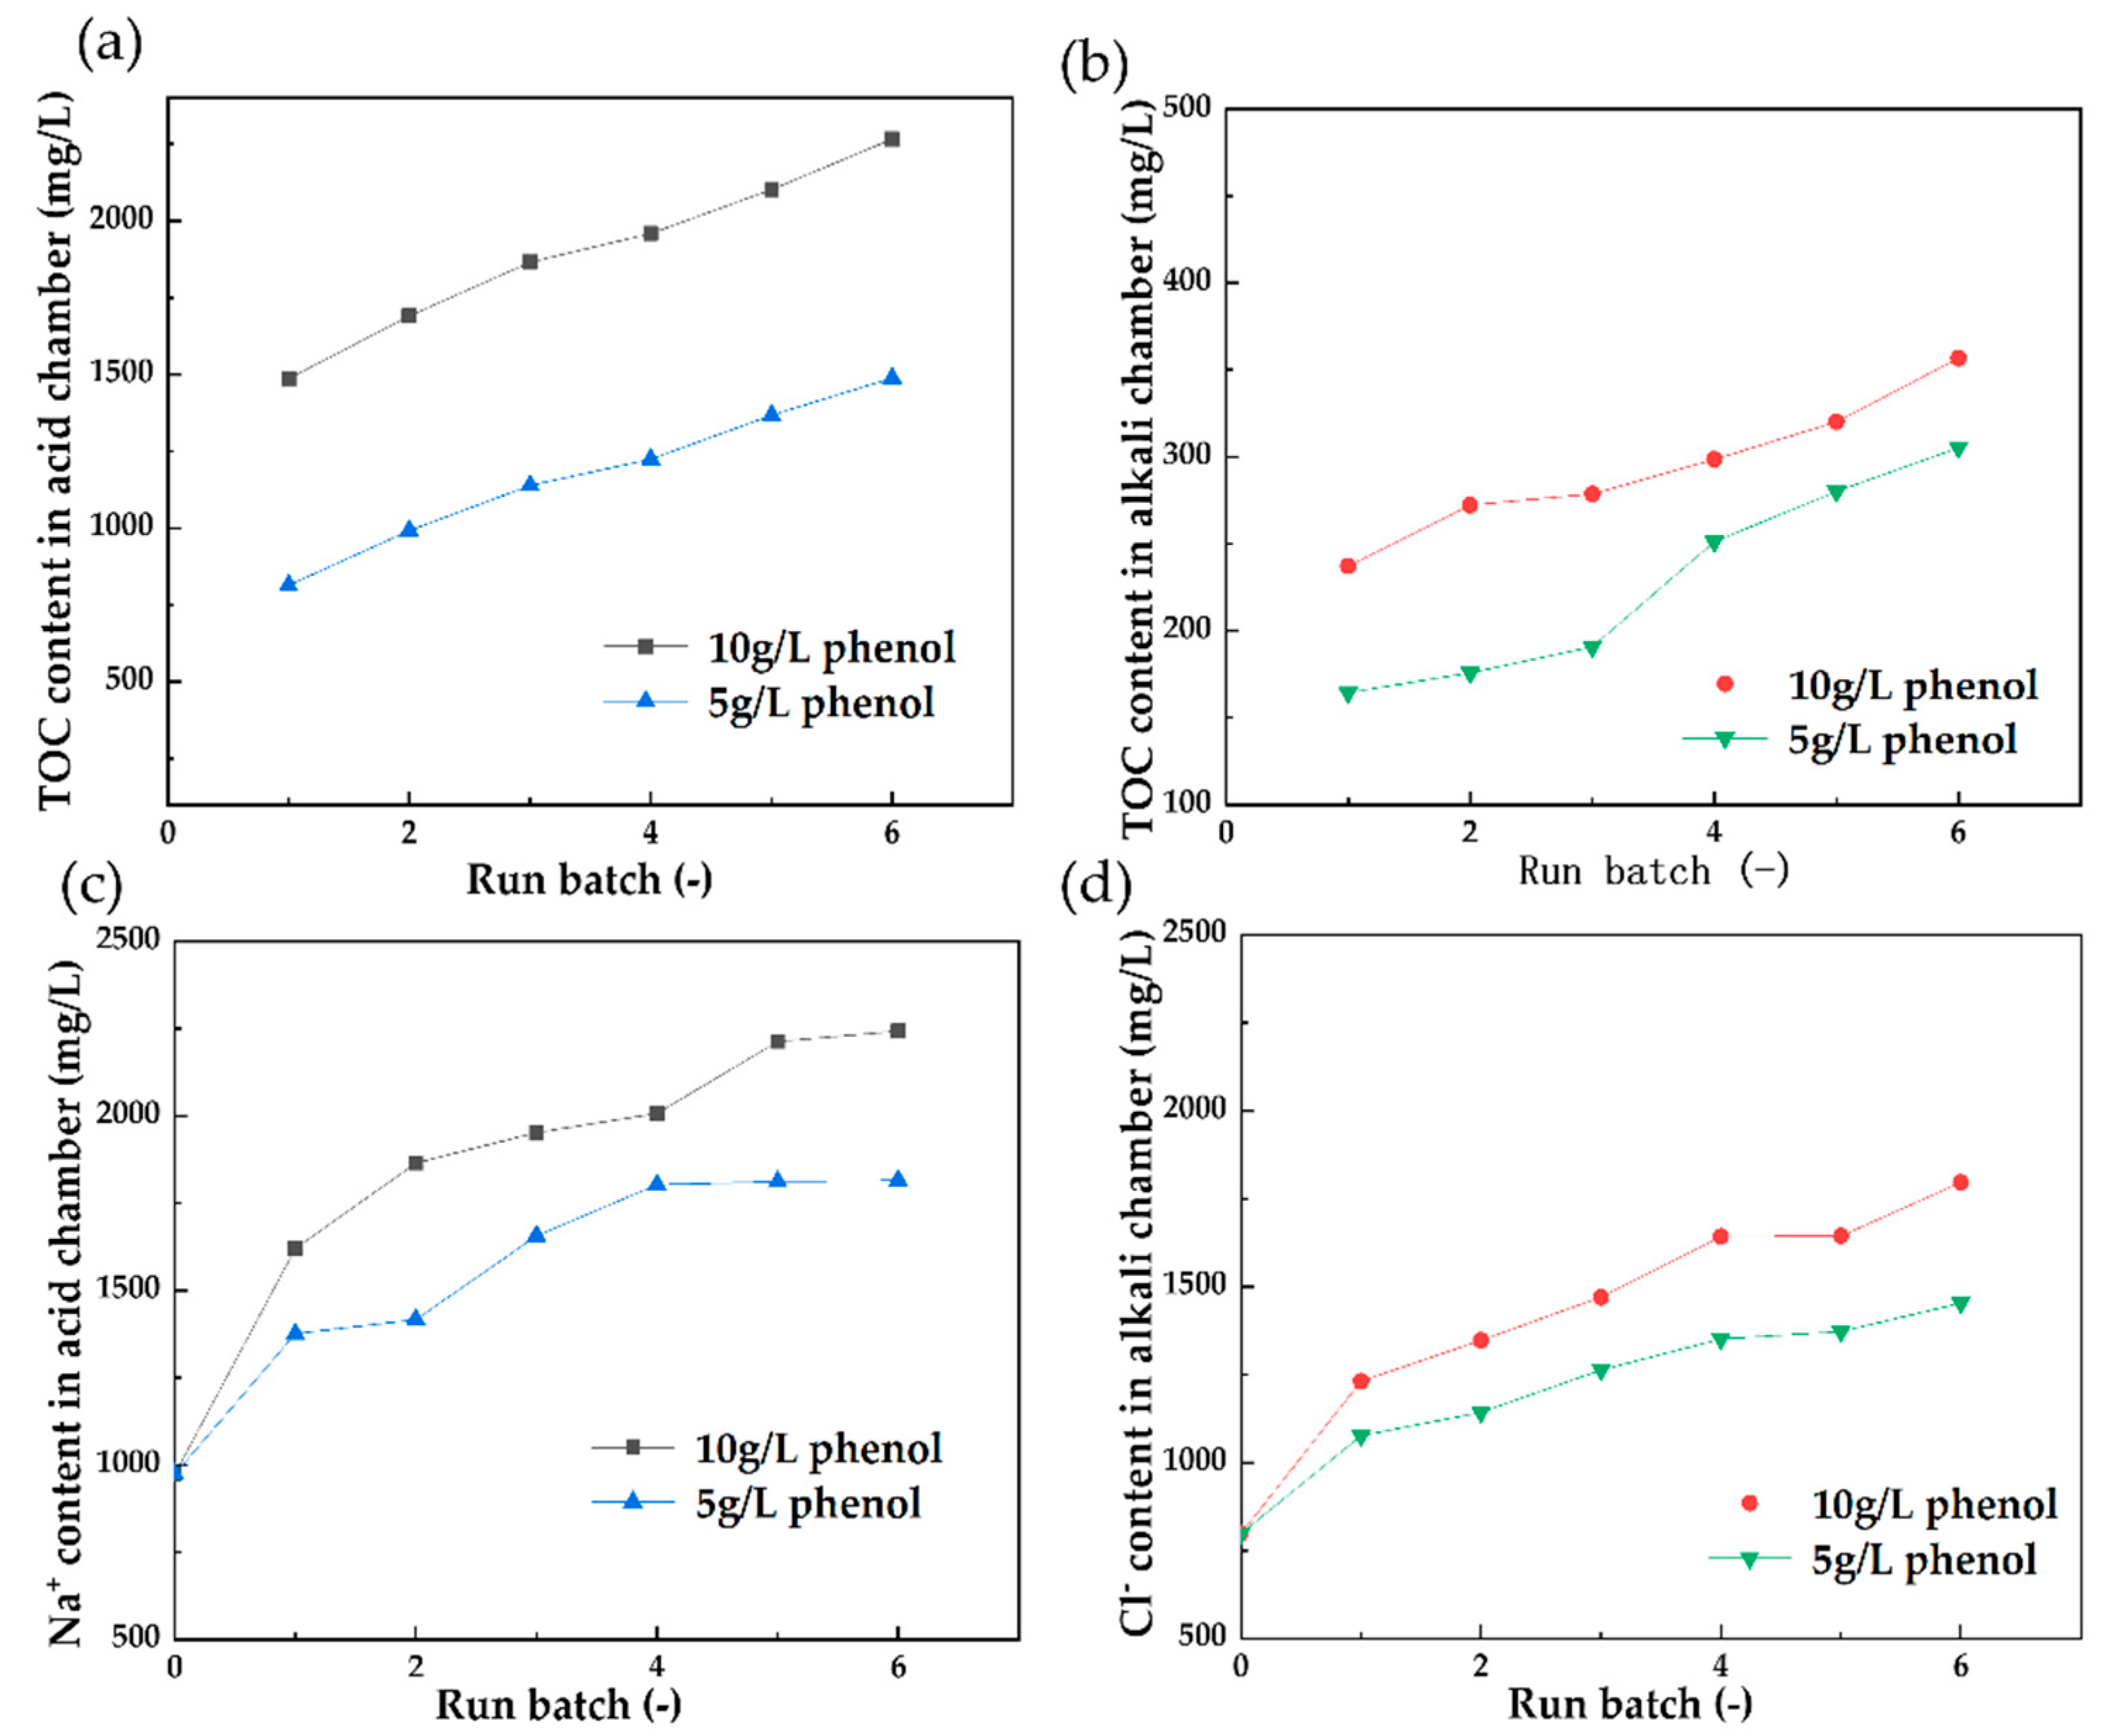
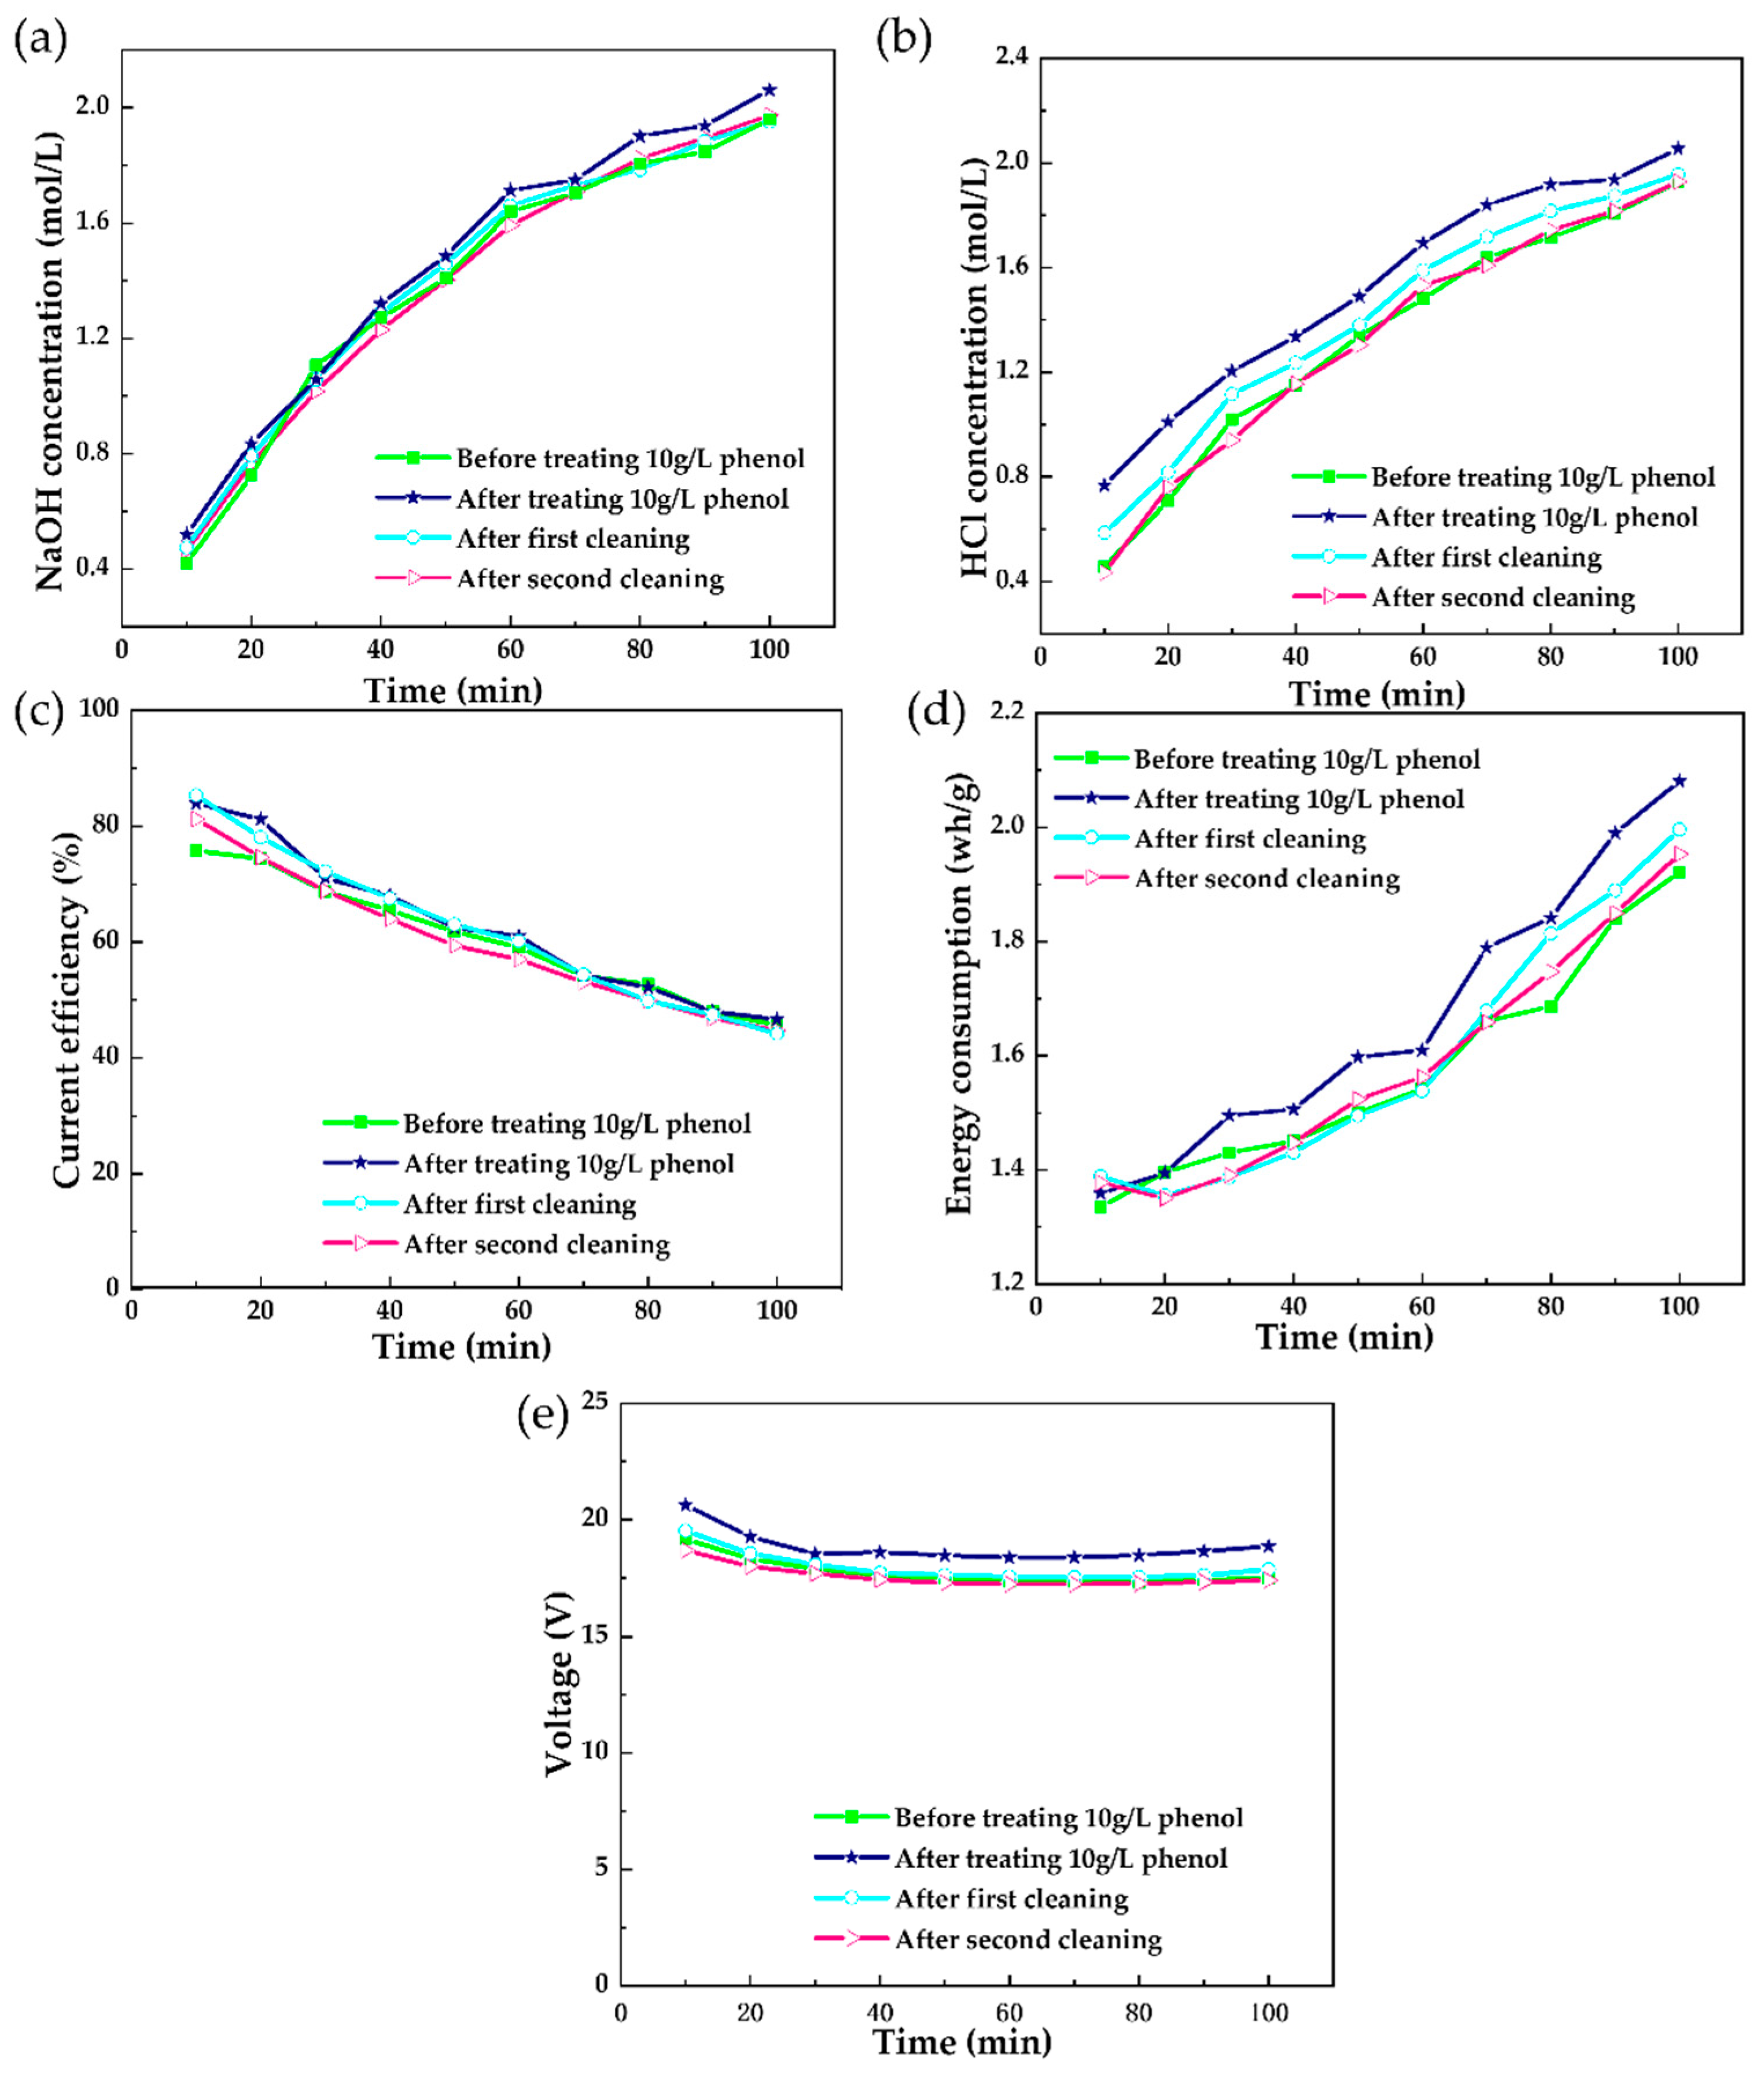
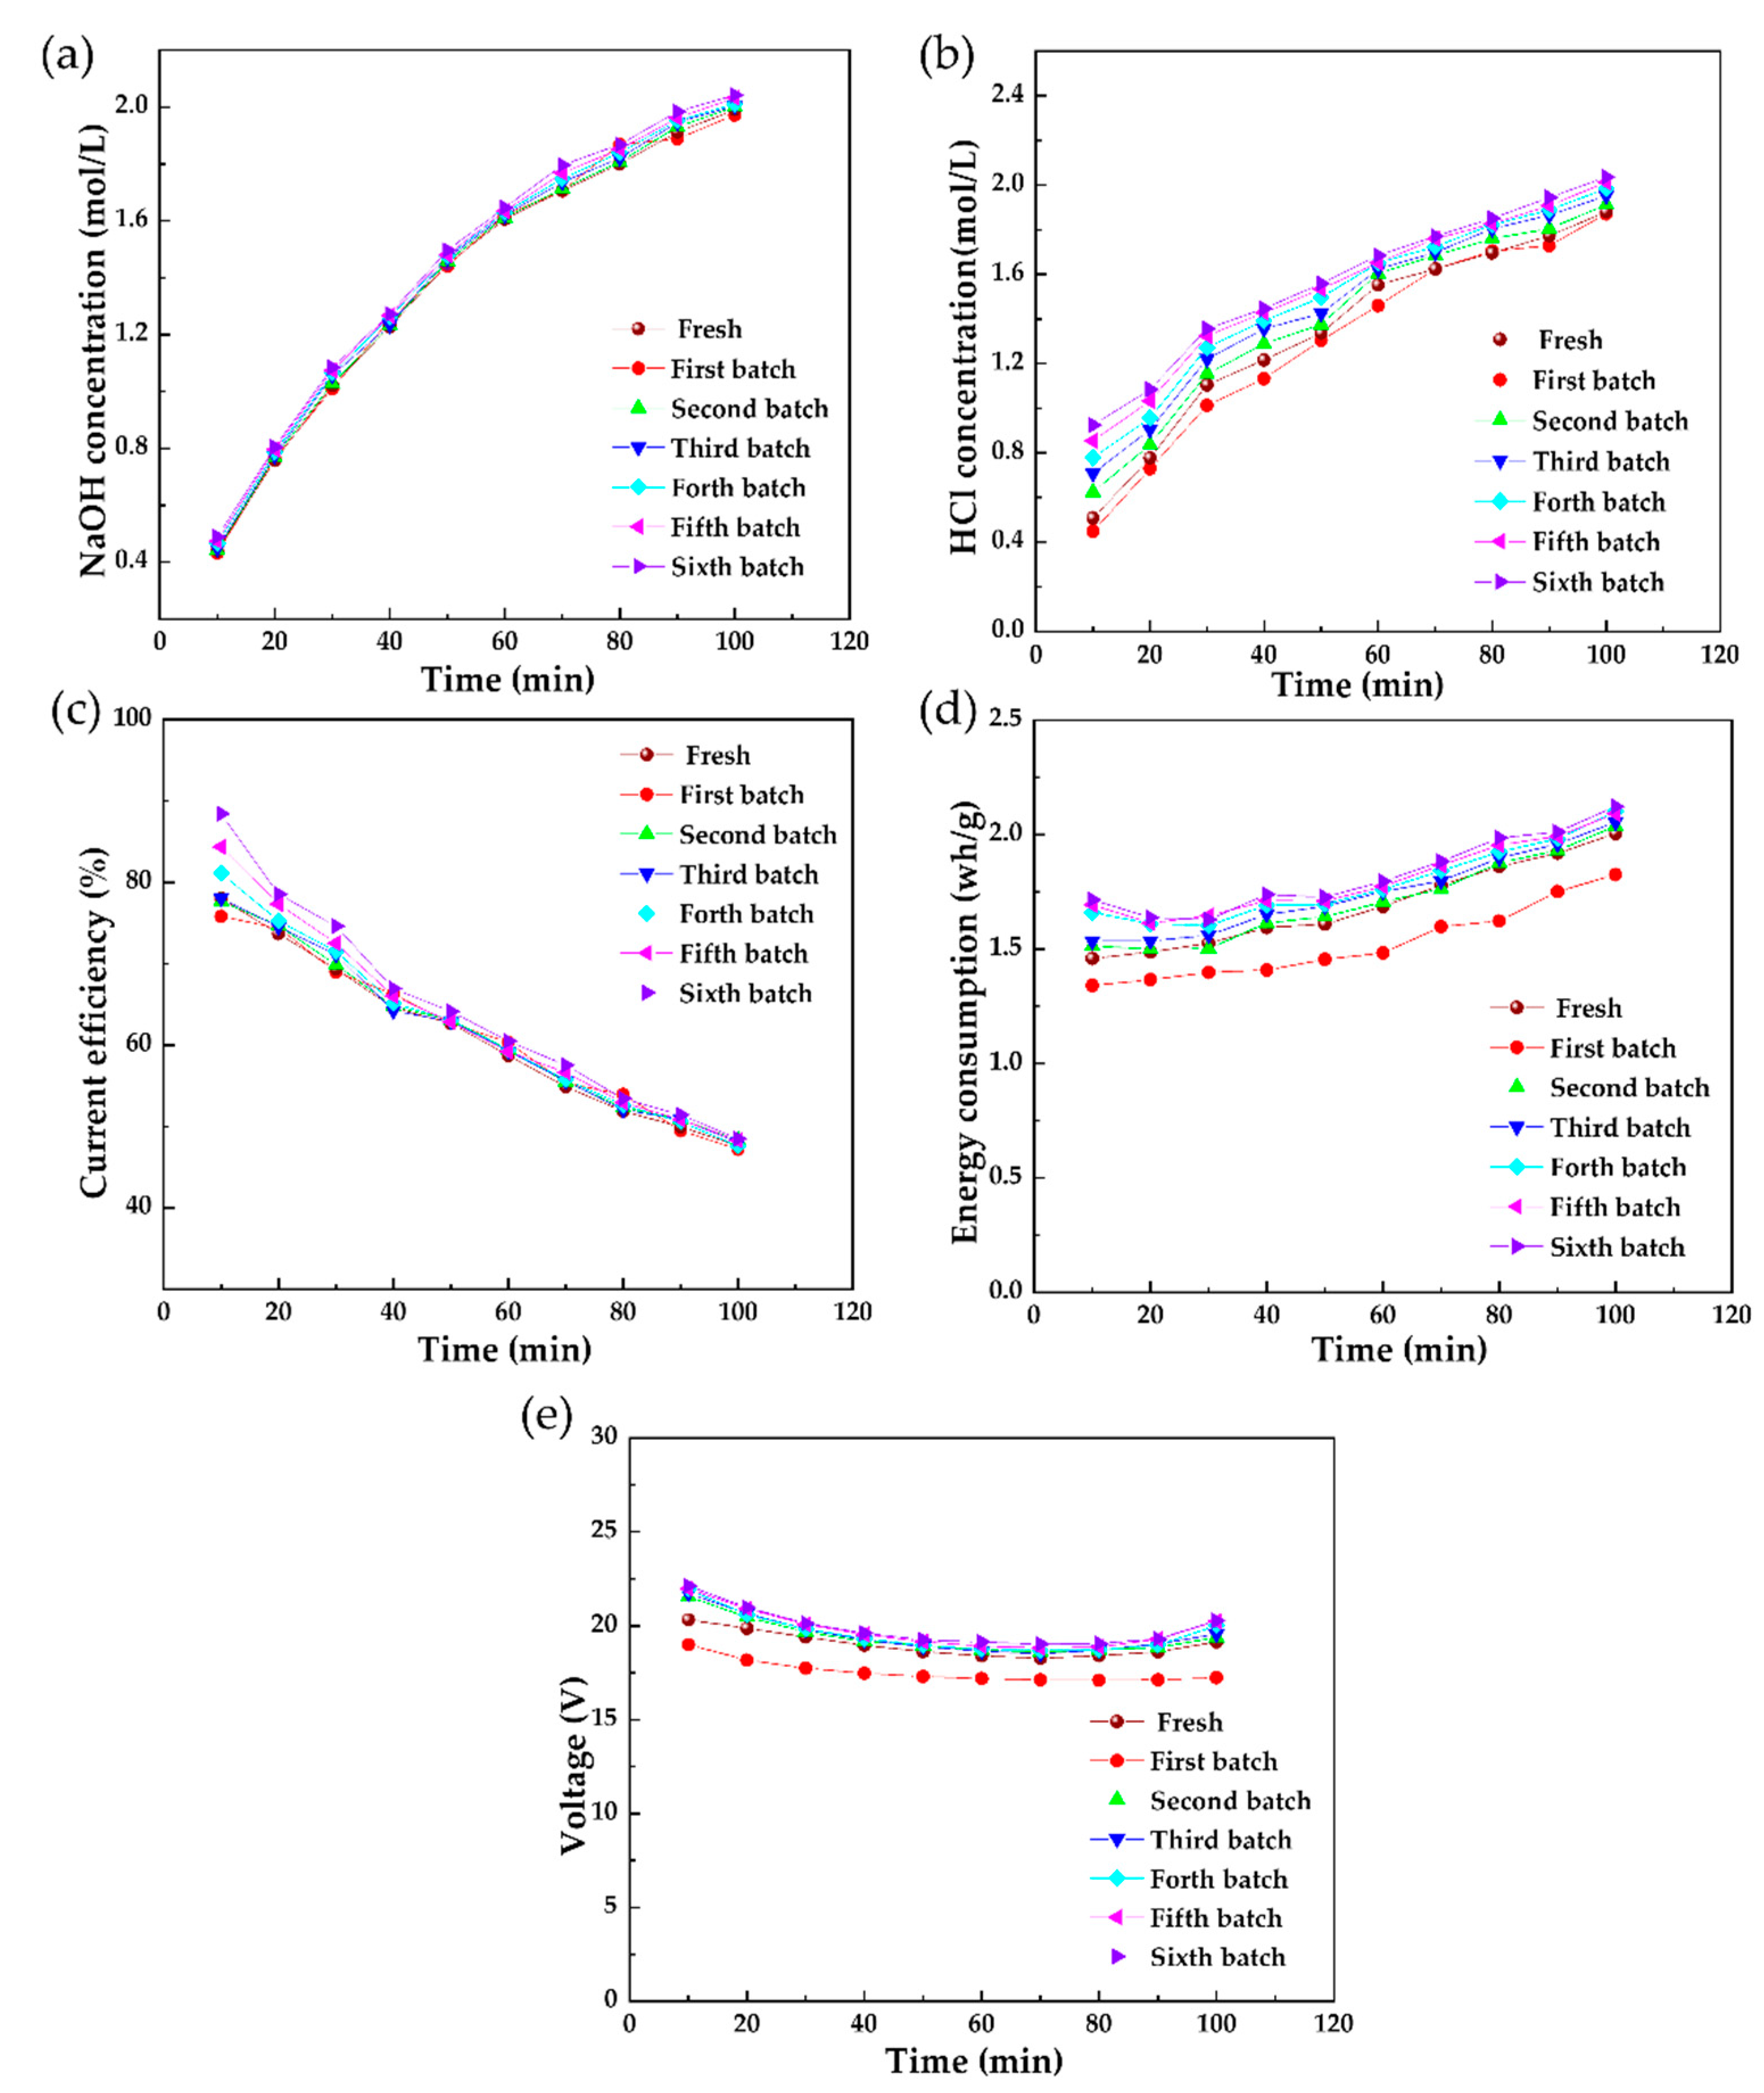
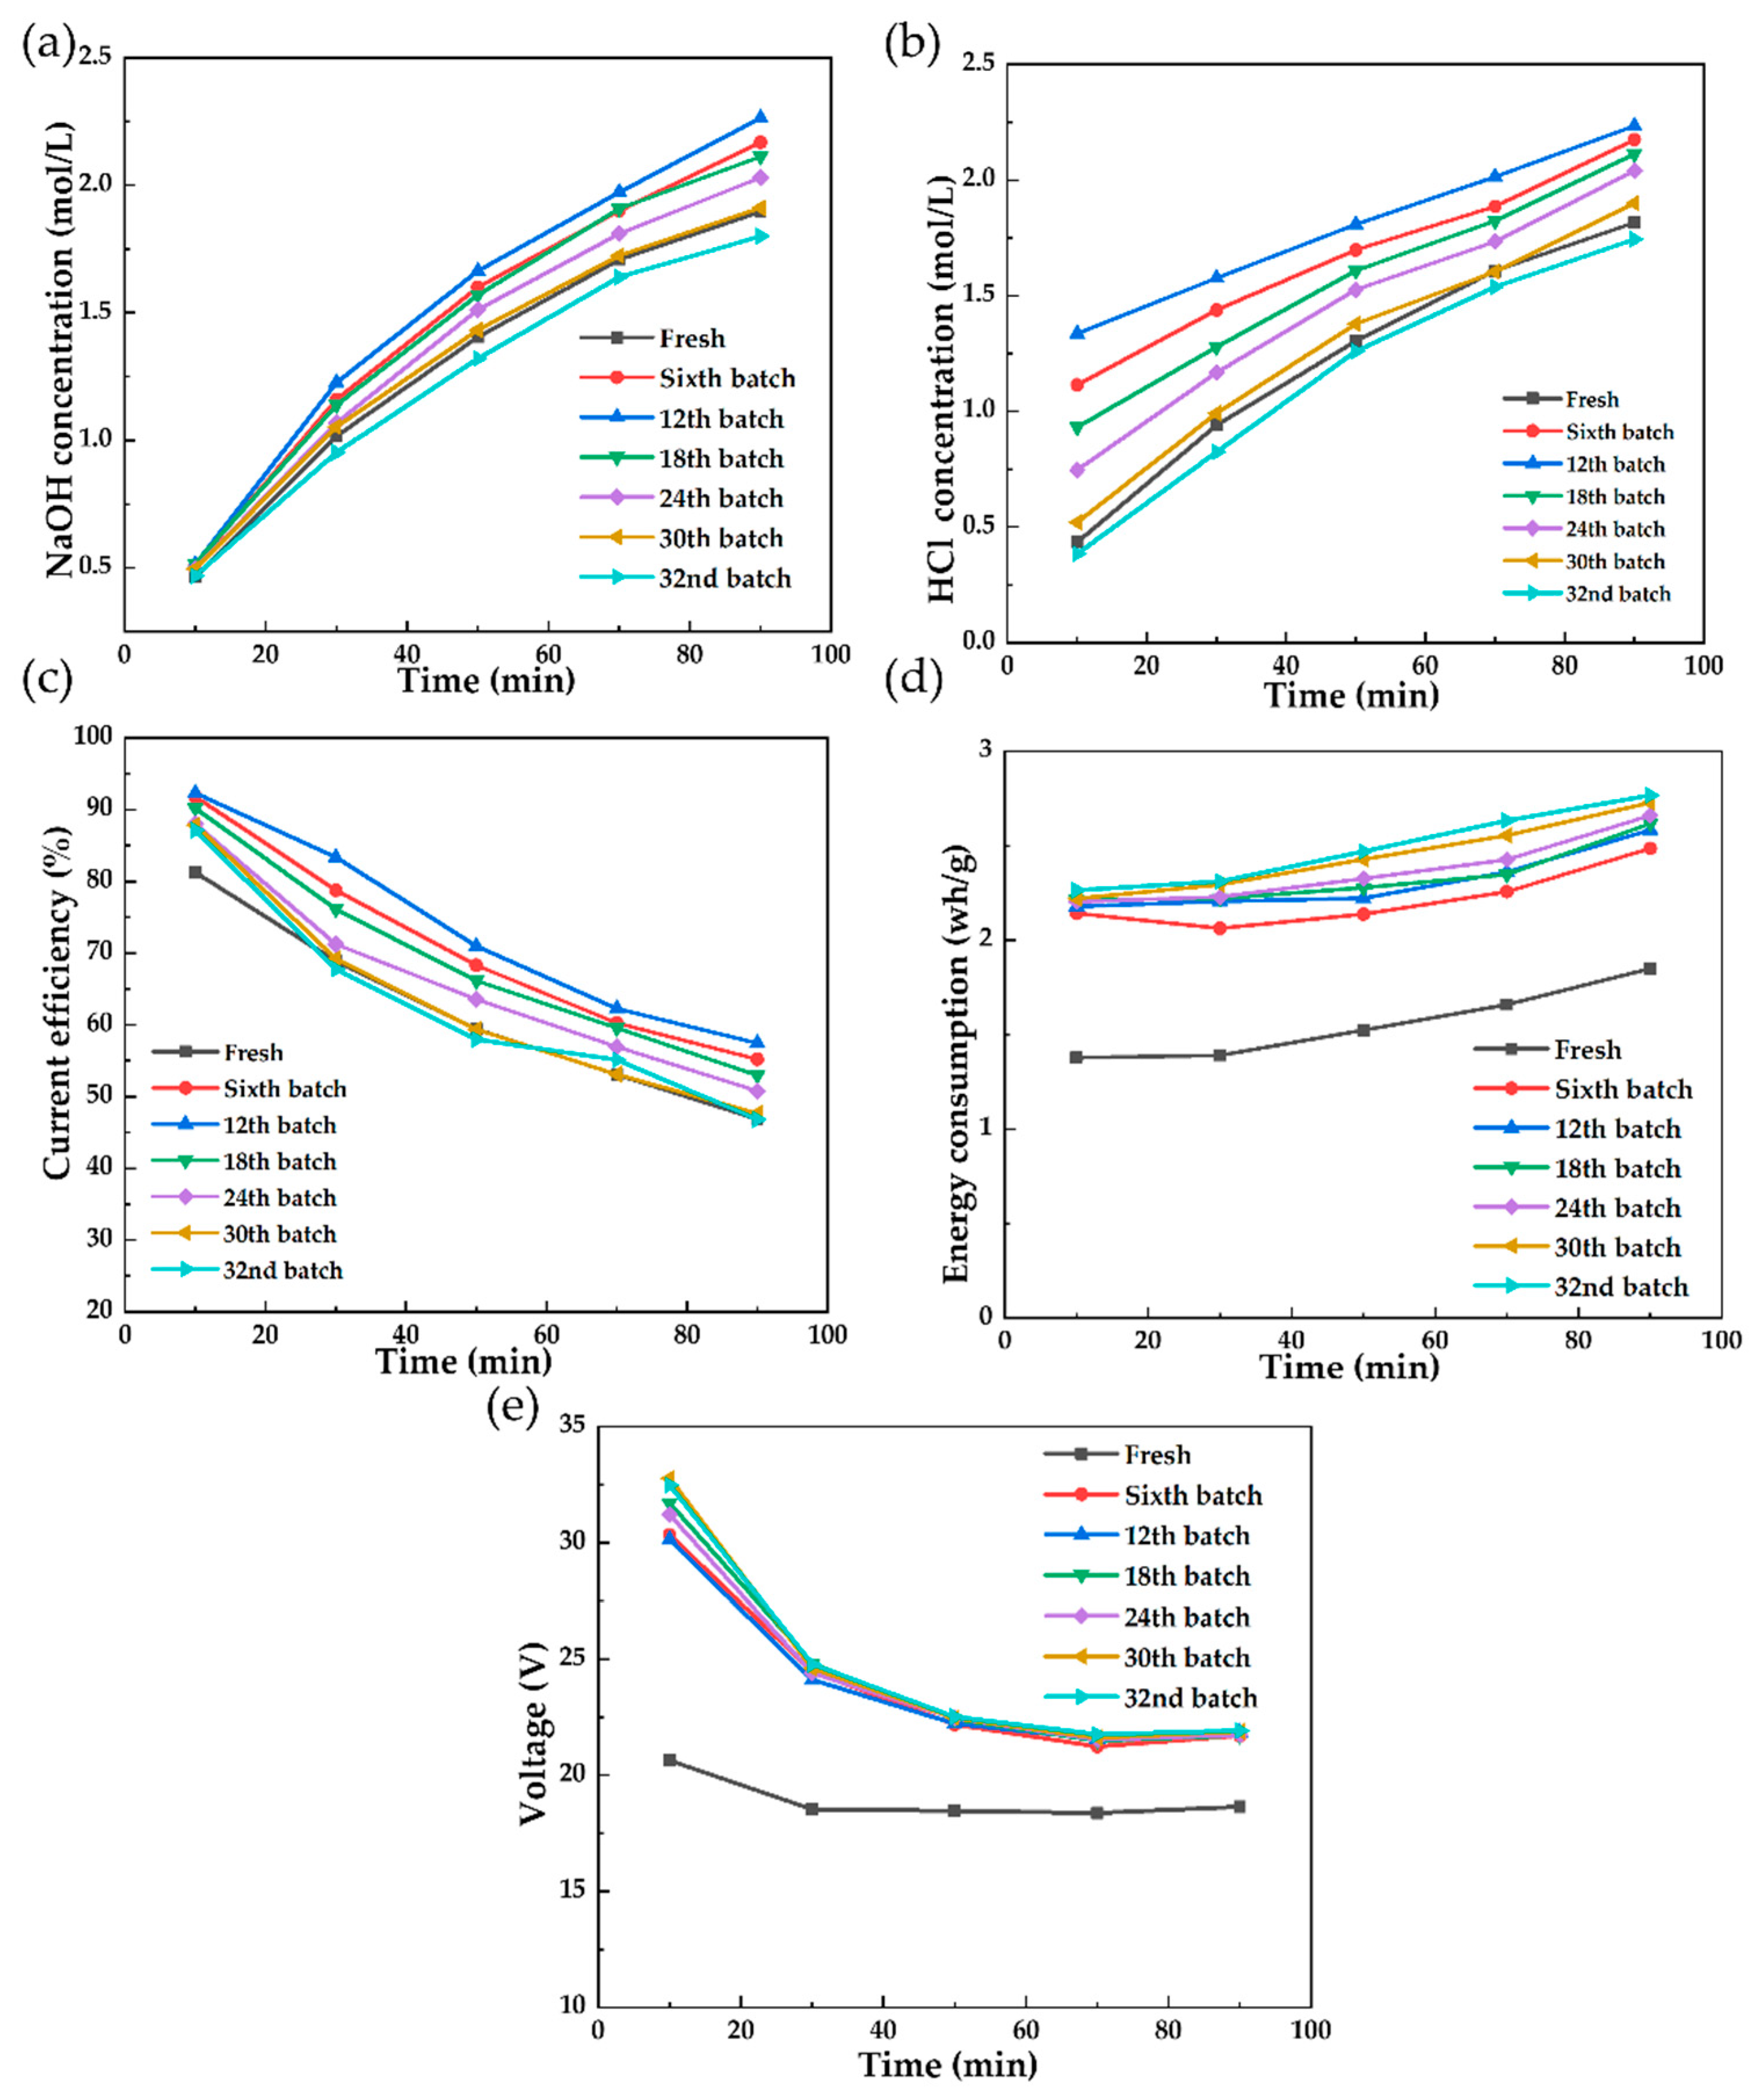
3.2.1. The Effect of 10 g/L Phenol on the BMED Performance

In this section, 160 g/L NaCl solution containing 10 g/L phenol was selected to be the feed solution, and successive multiple batches of BMED processes were carried out to treat the feed solution. Here, the idea is that the multiple batches would continue until the BMED stack was completely polluted and failed to run anymore. It was found that when the 33rd batch was running for 10 min, an unexpected increase in the voltage and an obvious decline in the current were found in the BMED system, indicating the system could not hold on to operate any further, according to the provider of the BMED equipment. Consider that herein each batch ran 90 min and was operated intermittently, so the total operation time for the 32 batches was 2880 min. Therefore, data obtained from the running time of 2880 min were collected to show the effect of 160 g/L NaCl solution containing 10 g/L phenol on the BMED performance. The evolution of resultant alkali and acid concentration, current efficiency, energy consumption, and voltage are shown in Figure 15.
As shown in Figure 15, for the initial 12 successive batches (0–1080 min), the curves of the acid concentration, alkali concentration, current efficiency, and energy consumption rose gradually, which agreed with the phenomena observed in Section 3.1.1 that the permeability of the IEMs was enlarged and the reason should be attributed to the swelling of the IEMs induced by the phenol, whereas for the remainign 20 successive batches (from 1080 min to 2880 min), the curves of acid concentration, alkali concentration, and current efficiency began to decrease, and even lower than that of the unpolluted membrane stack, which suggested a further degradation of the IEMs, and this may due to blockage-like fouling of the IEMs induced by the accumulation of phenol. Meanwhile, it was found that the curves of energy consumption and voltage kept rising during the 32 batches because the IEMs were continuously fouled during this period, resulting in a continuous rise in the electrical resistance of the membrane stack.
Figure 16 presents the influence of the phenol on the selectivity of the BMED stack. In the first 12 batches (0–1080 min), the situation was similar to Figure 7 in that the phenol (COD) could pass through the AEMs and CEMs and gradually accumulated in the acid and alkali chamber, and Na+, Cl, and H+ reversely passed through the IEMs to gradually accumulate in the acid, alkali, and feed solution chamber, which was also consistent with the results of Figure 15 that the permeability of the IEMs was enlarged due to swelling-like fouling caused by the phenol. In contrast, for the rest batches (from 1080 min to 2880 min), the content of TOC, Na+, Cl, and H+ started to decrease gradually, which may indicate that the membrane ‘swelling’ reached the maximum degree and a kind of membrane blockage-like phenomena occurred due to the accumulation of phenol and further degradation of the IEMs.

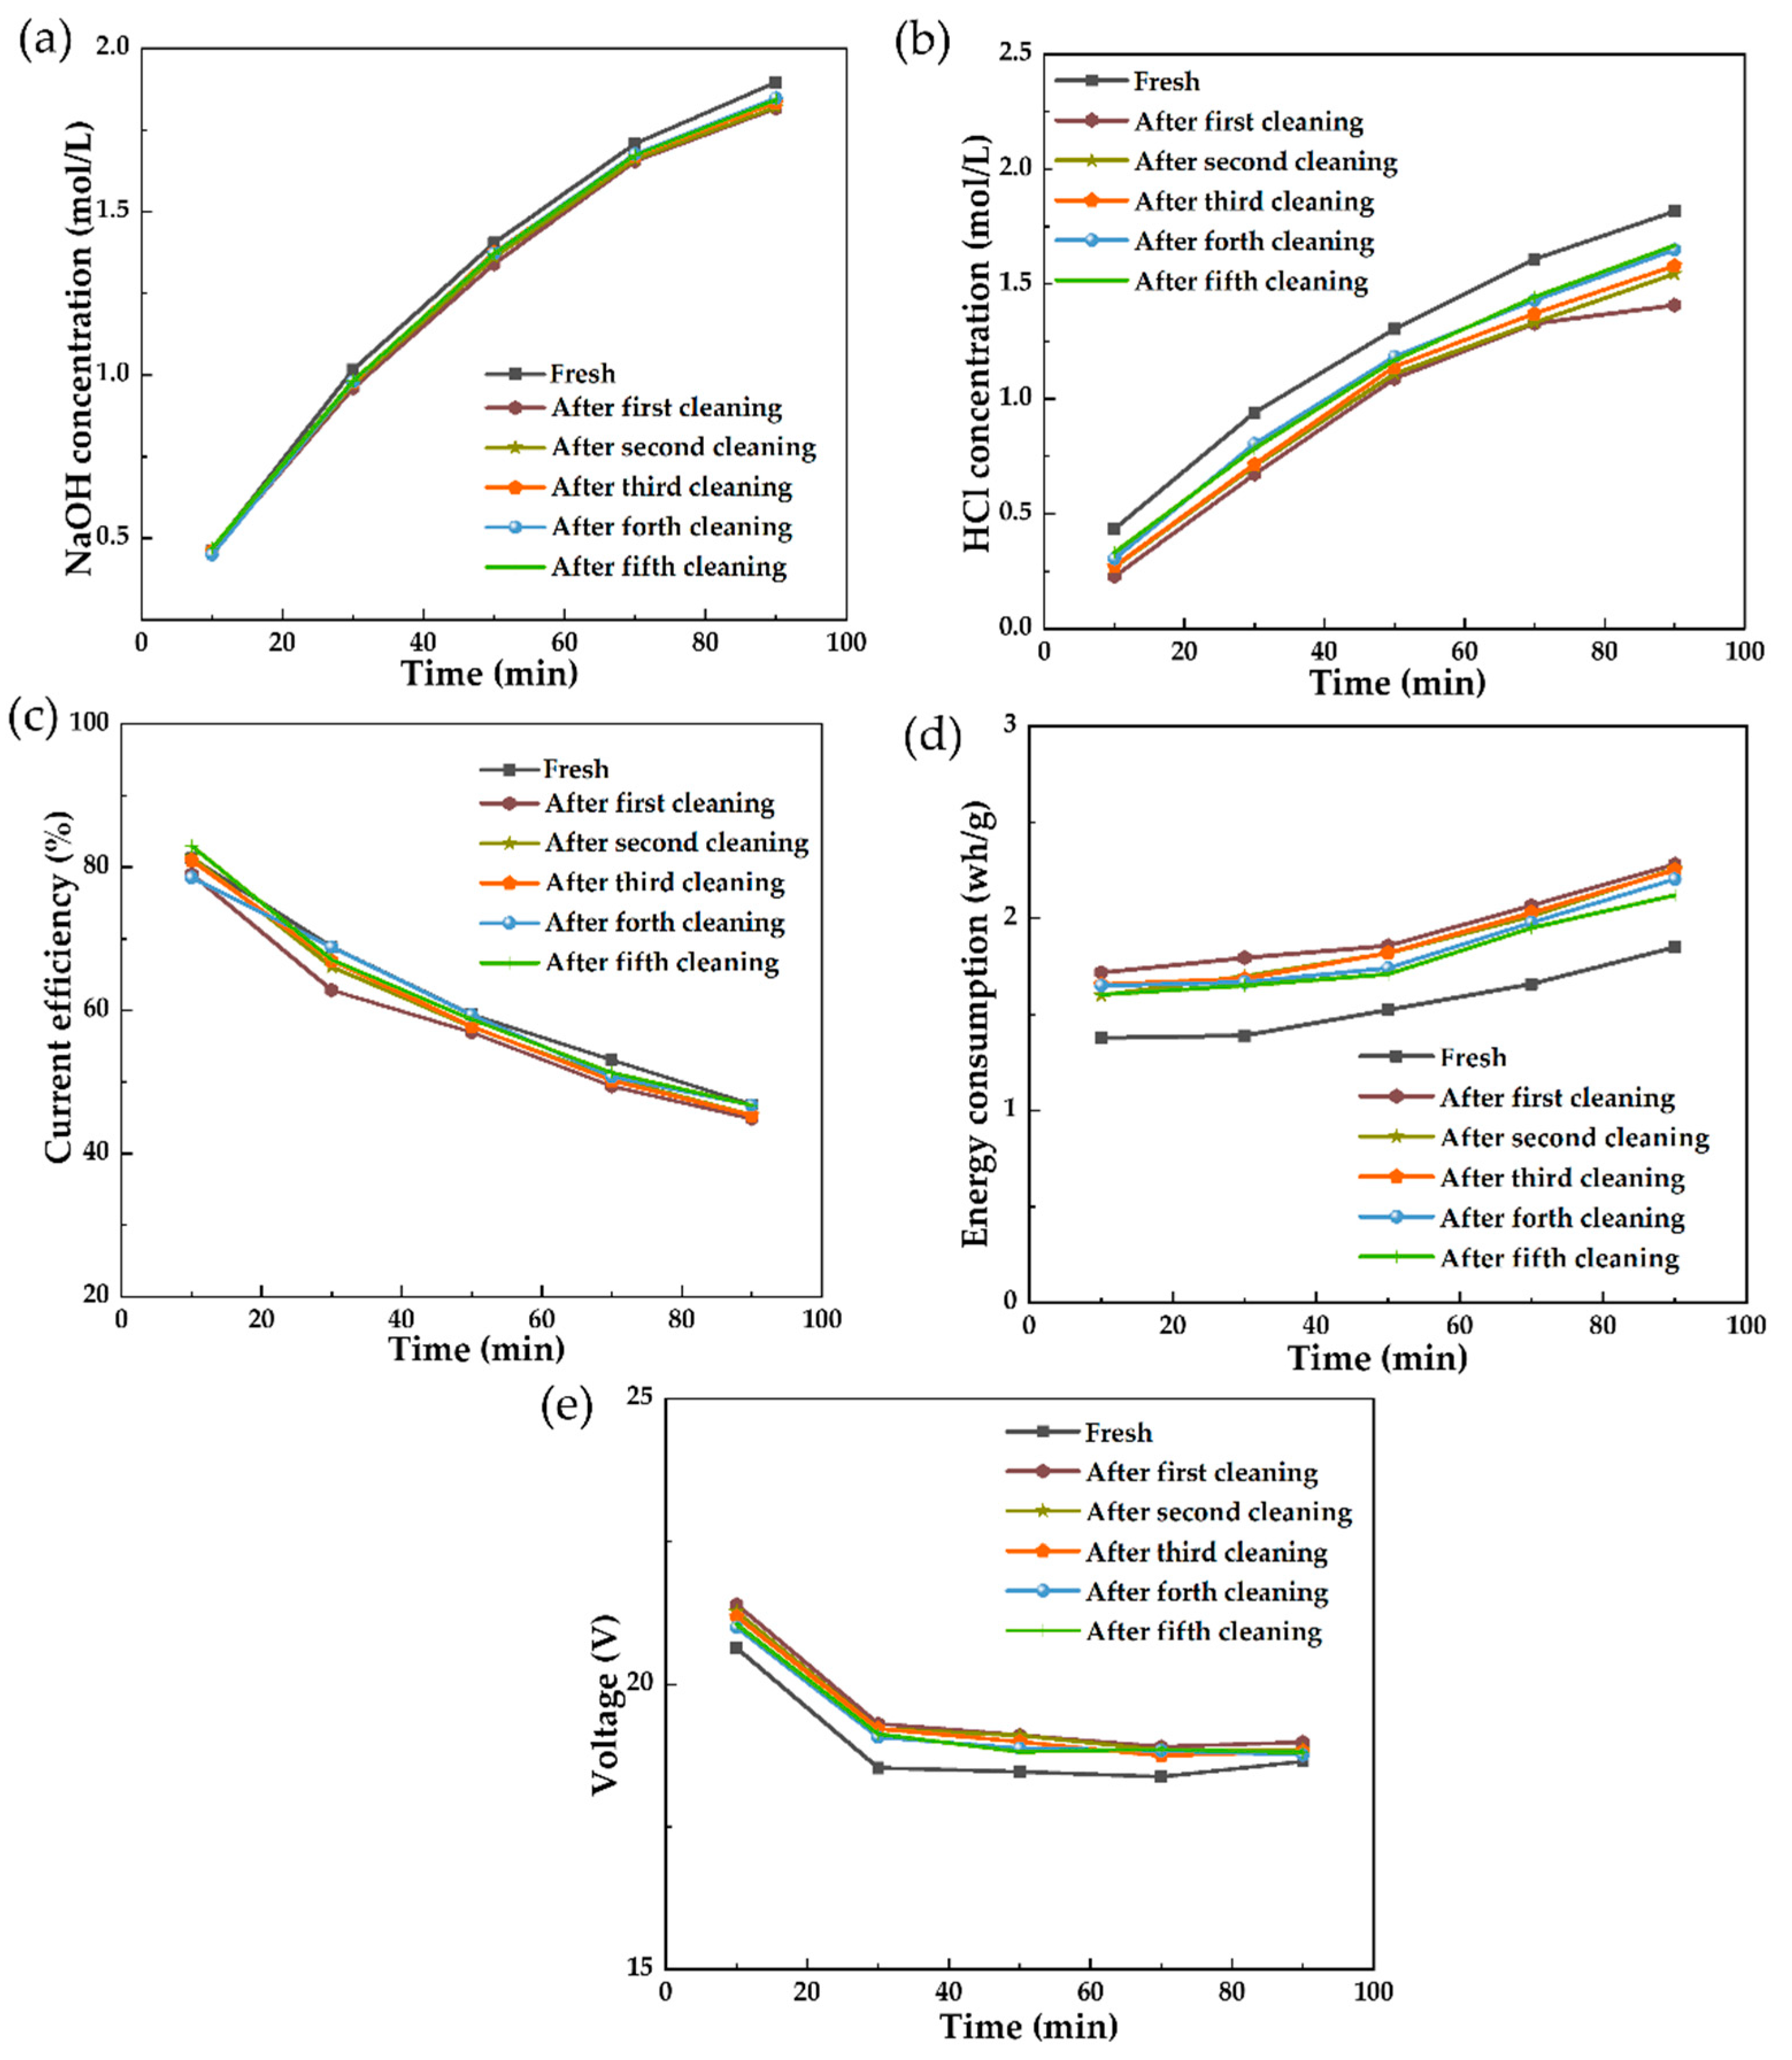
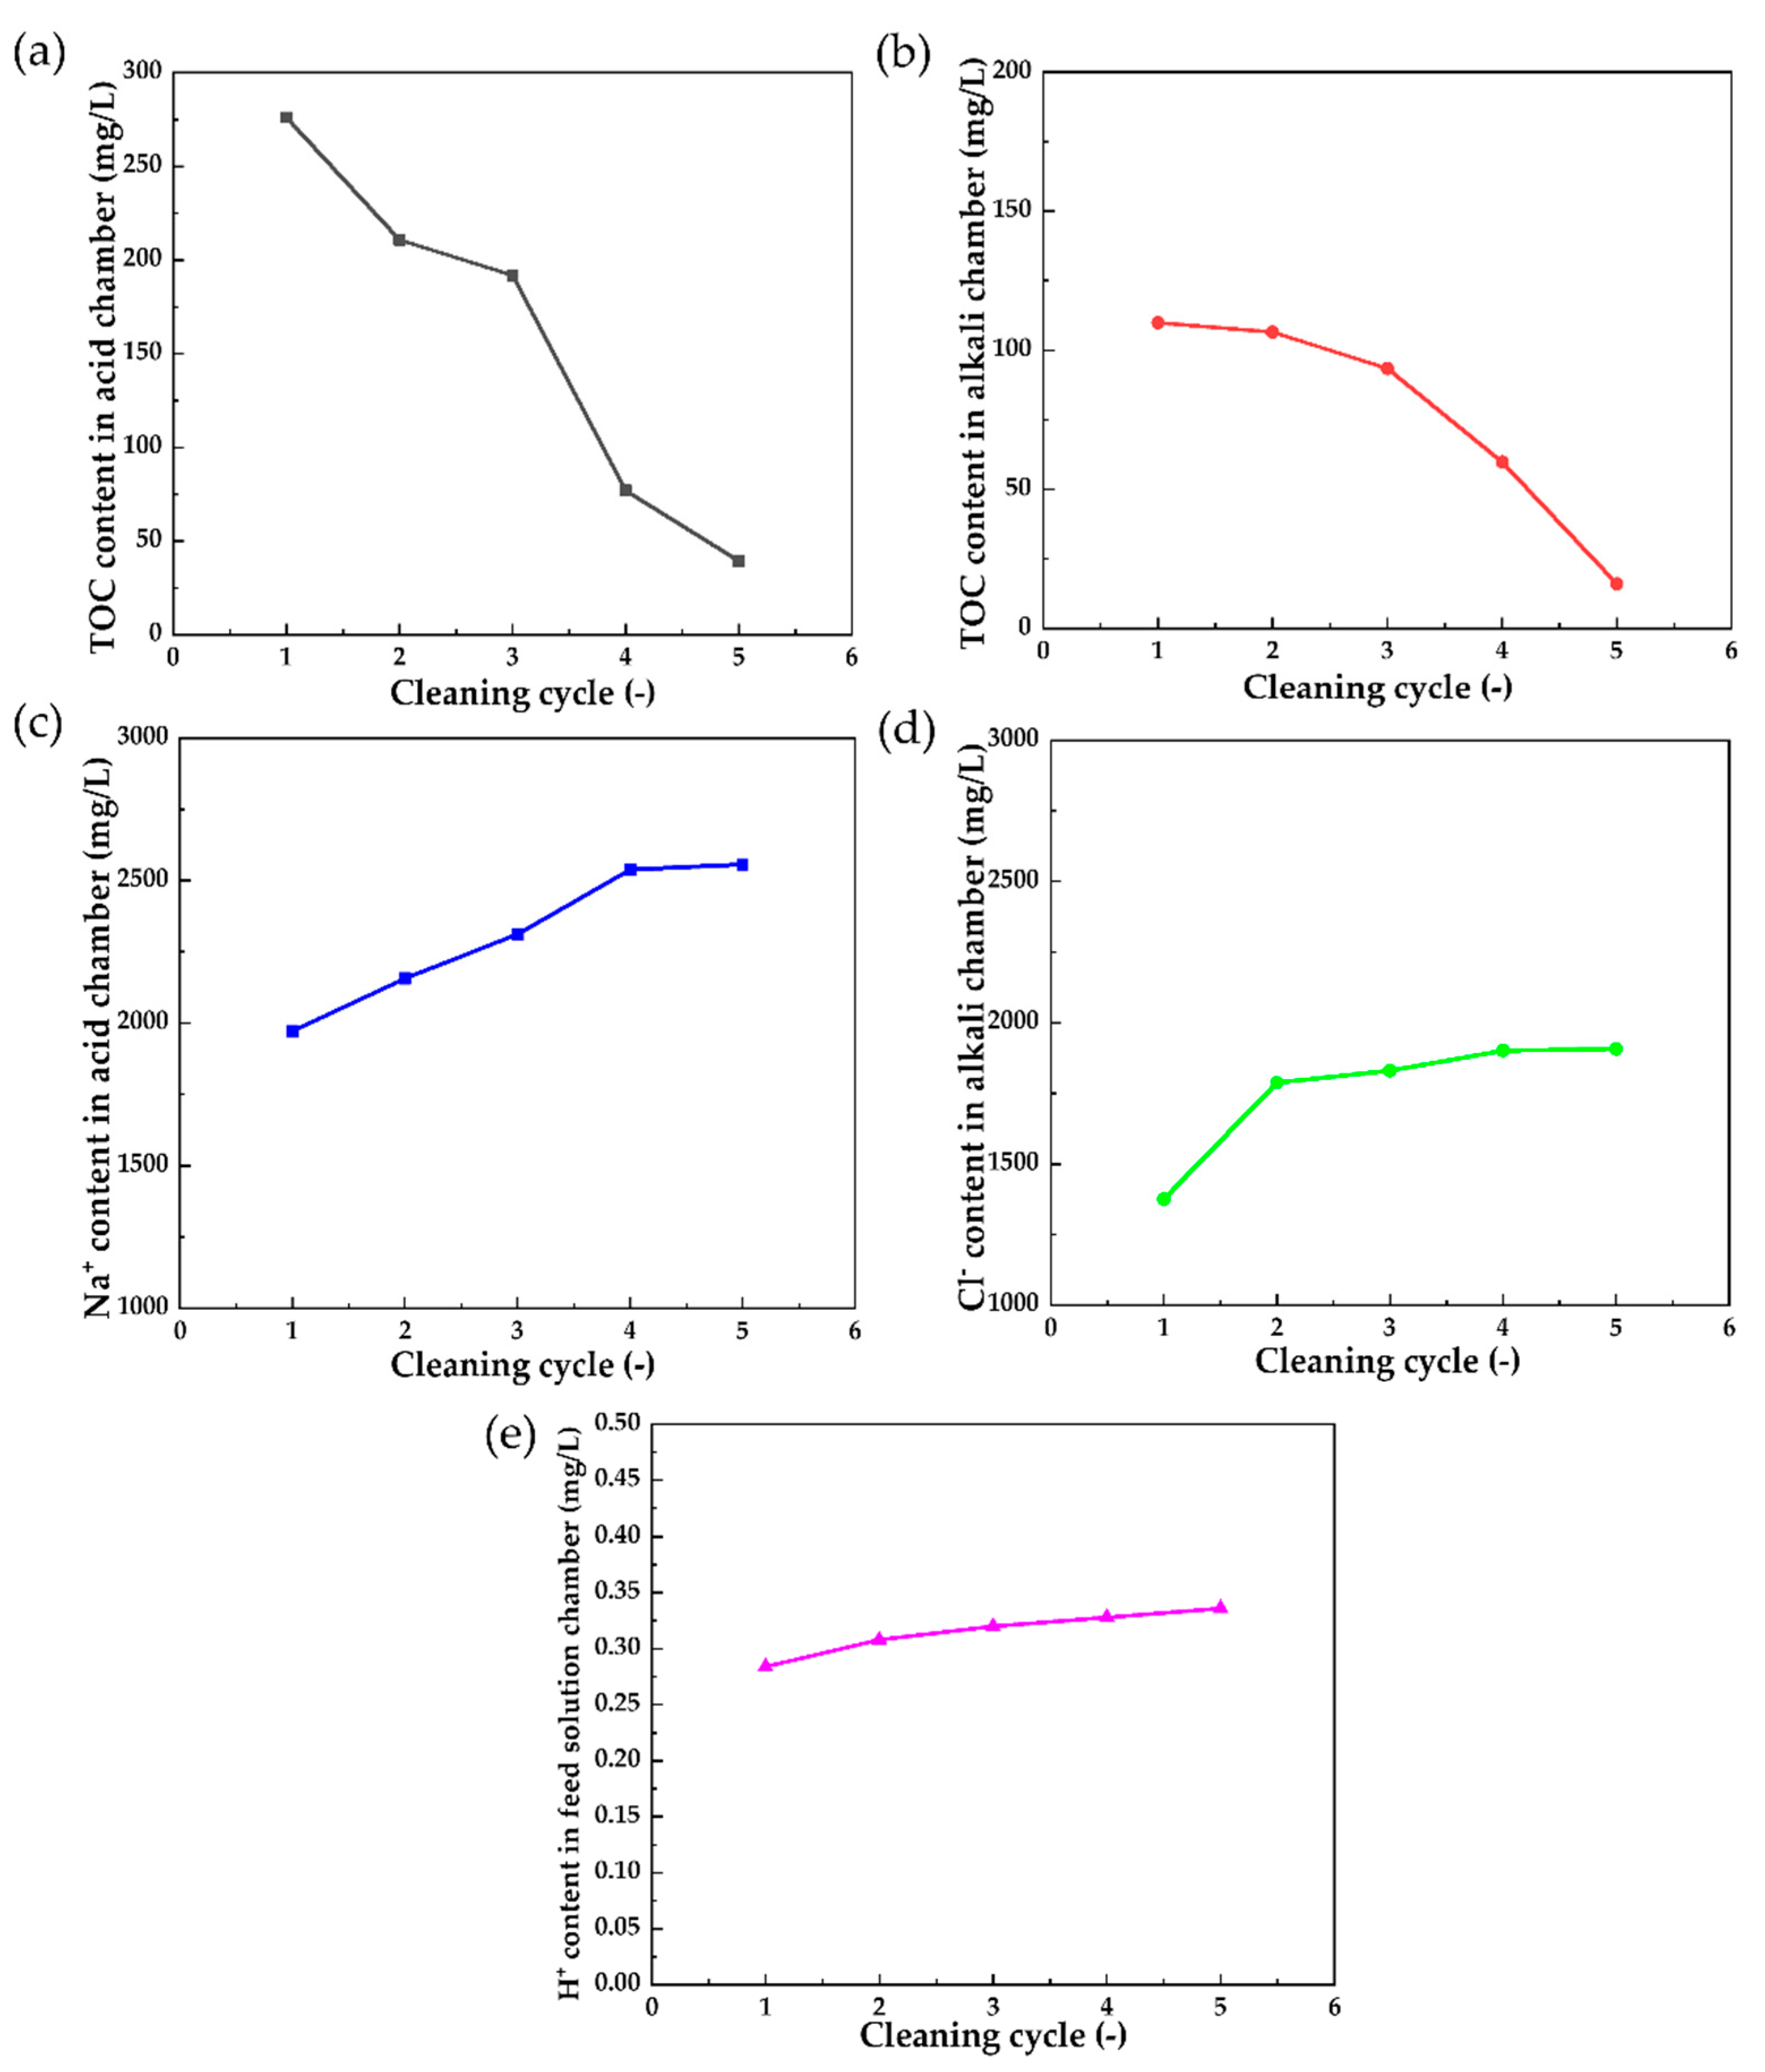
3.2.2. In Situ Chemical Cleaning on the Polluted Membrane Stack

Based on the in situ chemical cleaning of the polluted membrane stack after the short-running process, in this section, the polluted membrane stack after the long-running operation was also cleaned by the BMED platform. Considering the serious pollution problem of the membrane stack, the in situ chemical cleaning procedure was changed. The specific operation was: the NaOH solution was first recycled for 240 min in each chamber, then was replaced by pure water for another 30 min, which was considered to be one complete cleaning cycle (270 min). In this section, the polluted membrane stack was cleaned by 5 cycles, which meant 1350 min. Moreover, at the end of each cleaning cycle, the membrane stack was used to treat a 160 g/L NaCl solution system by the BMED operation to compare to the unpolluted membranes. The effect of the cleaning on the evolution of resultant alkali and acid concentration, current efficiency, energy consumption, and voltage is shown in Figure 17.
According to Figure 17, after the chemical cleaning, it was found that the curves of acid concentration, alkali concentration, and current efficiency rose gradually with the increase in the cycle times but were still lower than the performance of the unpolluted membrane stack even after five cleaning cycles. Similarly, the curves of energy consumption and voltage were depressed a little but were still higher than the performance on the unpolluted membrane stack., which indicated that the membrane performance could not be recovered by the chemical cleaning.
In addition, Figure 18 showed the effect of the long-time cleaning on the recovery of the selectivity of IEMs. Compared to Figure 14, here, the cleaning could hardly improve the selectivity of the IEMs, although the TOC content had been mostly removed (Figure 18a,b). The Na+ content of the acid chamber, the Cl content of the alkali chamber, and the H+ content of the feed solution still presented a rise with the increase of the cleaning cycle. It could be reasonably speculated that after even the long-time cleaning, the selectivity of the membrane stack could not be recovered anymore and the long-running BMED operation had degraded the IEMs and resulted in unreversible fouling.

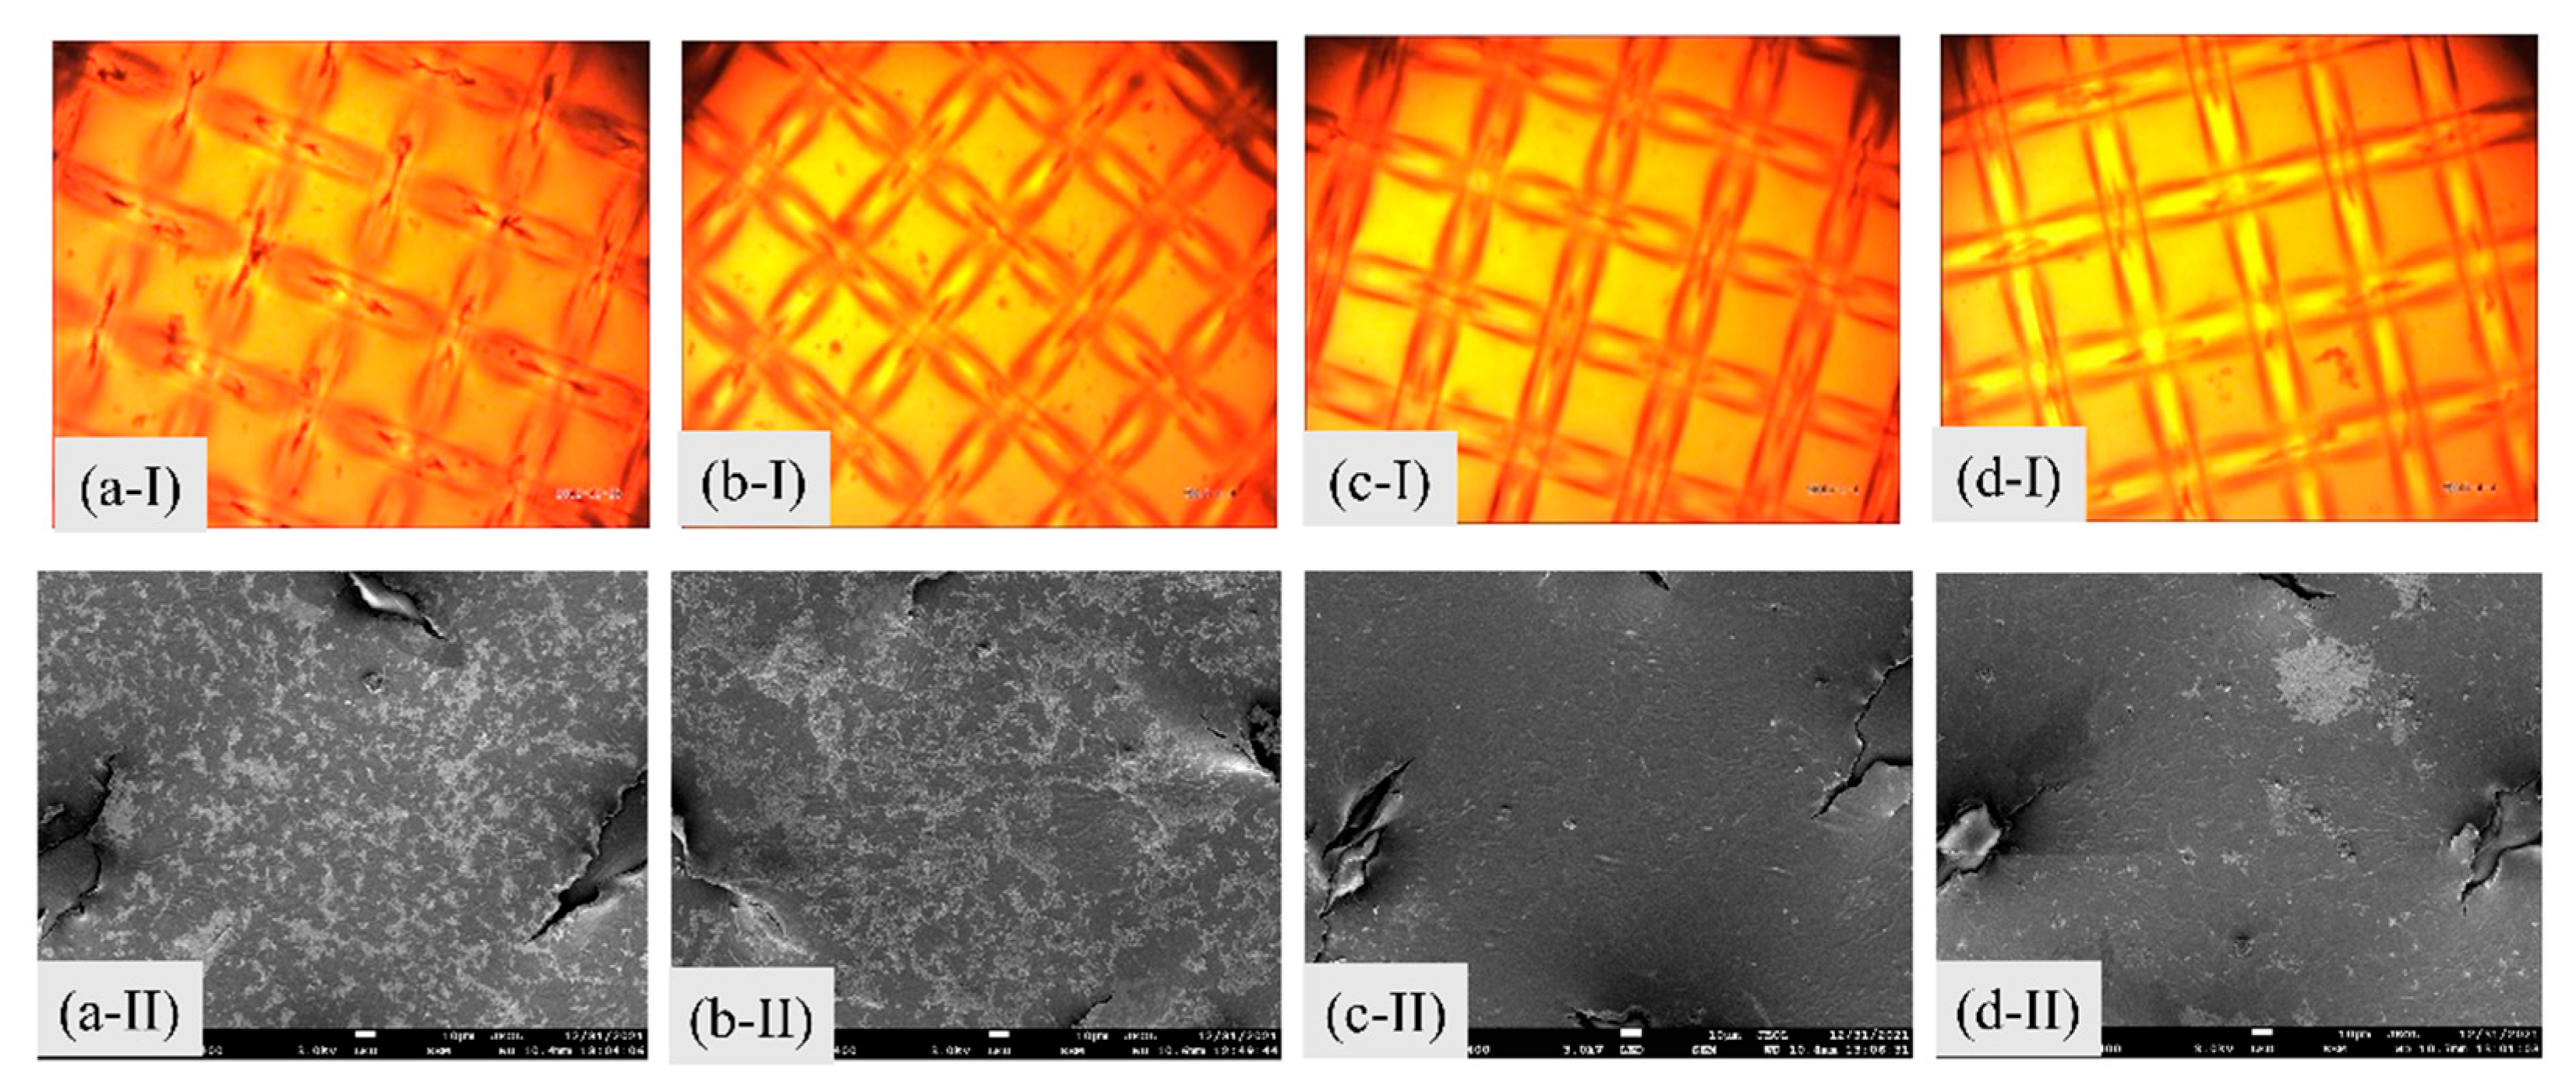
3.2.3. Analysis of the IEMs after Cleaning

In this section, the BMED stack that had the unreversible fouling was disassembled to conduct detailed membrane characterization after five cleaning cycles, and the AEM, CEM, and the smooth surface (anion exchange side) of BPM were observed and analyzed.
Figure 19 and Figure 20 present the pictures and SEM images of the fresh membrane and the polluted membranes after cleaning. It is clear that, compared to the uniform and flat surfaces of the fresh membranes, the surface of IEMs showed obvious deformation and some grid-like ridges could be found, which were said to be supporting layers that used to be inside of the IEMs. This phenomenon reflected that contact with phenol for quite a long time may damage the polymer layer to make the supporting layer be seen. Moreover, the deformation of the AEM surface was the most serious, and CEM and BPM were less affected comparatively. The SEM images showed that the surfaces of IEMs were relatively clean because of the long-time cleaning and basically little pollutants could be found. However, the surface was uneven and not uniform anymore, which agreed with the results above that the membranes cannot be recovered anymore.
To confirm the cleaning effect, EDS analysis was conducted to analyze the surface and cross-section of the IEMs, and the results were listed in Table 6. The content of the oxygen element on the surface and inside of the cleaned membranes was similar to that of the fresh membranes, which indicated that the pollutants attached and accumulated on the surface and inside of the membranes had been effectively removed by the long-time cleaning. The results also proved that the long-time in situ cleaning with 0.1 wt.% NaOH solution was very effective to wipe off all the contaminants.

4. Conclusions

Taking the NaCl concentrated solution containing phenol as the simulated pesticide wastewater with high salinity and phenolic substances to be the study object, this work investigated the performance and fouling of IEMs induced by phenol during the desalination of NaCl via BMED and explored an effective cleaning method. The results firstly showed that compared to the low concentration of phenol solution, a higher concentration of phenol (5 g/L and 10 g/L) solution could reduce the selective permeability of the membrane in a short-running period, leading to severe reverse migration, leakage of ions, and organic matter, and significantly increased acid and alkali concentration, current density, energy consumption, and voltage due to swelling-like fouling. Secondly, the membrane characterization analysis presented that the structure of the IEMs was deformed and phenol fouling deposits were observed both on the surface and inner parts of the membranes, especially for the AEMs. Then, the results of soaking tests proved that phenol could bring about degradation of the AEMs and 0.1 wt.% NaOH solution was selected as the best cleaning agent and the performance of the fouled IEMs for the short-running operation could be recovered by 300 min of in situ chemical cleaning with 0.1 wt.% NaOH solution, which removed the phenol fouling deposited on the surface and in the interior membranes efficiently.
Finally, the results of the long-running operation test treating the NaCl solution with 10 g/L phenol concentration showed that contact with the contaminants for a quite long period, an irreversible degradation and deformation was induced in the IEMs, and the membrane performance could not be recovered even after a very long time of chemical cleaning, although the pollutants had been removed. During this step, a possible initial swelling-like and subsequent blockage-like fouling mechanism based on the previous literature was proposed. This research proves that although the BMED process is effective to treat wastewater with high salinity, the phenols in the wastewater should be removed by some pretreatment methods such as adsorption and advanced oxidation to avoid irreversible membrane fouling and membrane degradation in the industrial application of BMED.

Author Contributions

Conceptualization, X.W., L.Y. and Y.T.; methodology, W.S. and Y.T.; software, Y.T.; validation, W.S.; investigation, L.W. and H.C.; resources, Y.L.; data curation, H.W.; writing—original draft preparation, W.S.; writing—review and editing, Y.T.; supervision, Y.L.; project administration, Y.L.; funding acquisition, Y.L. and X.W. All authors have read and agreed to the published version of the manuscript.

Funding

This work was funded by Tsinghua University Spring Breeze Fund (2020Z99CFY041 and 2021Z99CFY024), a horizontal project of Tsinghua University and Sinopec Beijing Yanshan Company (20212000432 and 20212910094), and supported by the Fundamental Research Funds for the Central Universities (2022YJSHH14, 2022YQHH04).

Data Availability Statement

Not applicable.

Conflicts of Interest

The authors declare no conflict of interest.

References

  1. Research, P.M. Market Study on Pesticides: Popularity of Bio-Pesticides to Rise Rapidly over Coming Years. 2021. Available online: https://www.reportlinker.com/p06194129/Market-Study-on-Pesticides-Popularity-of-Bio-pesticides-to-Rise-Rapidly-Over-Coming-Years.html (accessed on 1 August 2022).
  2. Shan, M. China pesticide industry watch 2021: Shouldering the responsibility as ‘Manufacturing Giant’. China Pestic. Ind. Watch. 2022, 1, 26–37. [Google Scholar]
  3. Saleh, I.A.; Zouari, N.; Al-Ghouti, M.A. Removal of pesticides from water and wastewater: Chemical, physical and biological treatment approaches. Environ. Technol. Innov. 2020, 19, 101026. [Google Scholar] [CrossRef]
  4. Devault, D.A.; Karolak, S. Wastewater-based epidemiology approach to assess population exposure to pesticides: A review of a pesticide pharmacokinetic dataset. Environ. Sci. Pollut. Res. 2020, 27, 4695–4702. [Google Scholar] [CrossRef] [PubMed]
  5. Herrero-Gonzalez, M.; Diaz-Guridi, P.; Dominguez-Ramos, A.; Irabien, A.; Ibañez, R. Highly concentrated HCl and NaOH from brines using electrodialysis with bipolar membranes. Sep. Purif. Technol. 2020, 242, 116785. [Google Scholar] [CrossRef]
  6. Ahmed, M.B.; Zhou, J.L.; Ngo, H.H.; Guo, W.; Thomaidis, N.S.; Xu, J. Progress in the biological and chemical treatment technologies for emerging contaminant removal from wastewater: A critical review. J. Hazard. Mater. 2017, 323, 274–298. [Google Scholar] [CrossRef]
  7. Ahmad, T.; Rafatullah, M.; Ghazali, A.; Sulaiman, O.; Hashim, R.; Ahmad, A. Removal of pesticides from water and wastewater by different adsorbents: A review. J. Environ. Sci. Health C 2010, 28, 231–271. [Google Scholar] [CrossRef]
  8. Diya’uddeen, B.H.; Daud, W.M.A.W.; Abdul Aziz, A.R. Treatment technologies for petroleum refinery effluents: A review. Process Saf. Environ. Prot. 2011, 89, 95–105. [Google Scholar] [CrossRef]
  9. Yuanhui, T.; Wenwen, S.; Taiyu, L.; Peng, M.; Yifan, J.; Lin, W.; Yakai, L.; Xiaolin, W. Reuse of wastewater from dicamba production by bipolar membrane electrodialysis. CIESC J. 2021, 72, 6328–6339. [Google Scholar]
  10. Xu, T. Electrodialysis processes with bipolar membranes (EDBM) in environmental protection—A review. Resour. Conserv. Recycl. 2002, 37, 1–22. [Google Scholar]
  11. Ye, W.; Huang, J.; Lin, J.; Zhang, X.; Shen, J.; Luis, P.; Van der Bruggen, B. Environmental evaluation of bipolar membrane electrodialysis for NaOH production from wastewater: Conditioning NaOH as a CO2 absorbent. Sep. Purif. Technol. 2015, 144, 206–214. [Google Scholar] [CrossRef]
  12. Bdiri, M.; Perreault, V.; Mikhaylin, S.; Larchet, C.; Hellal, F.; Bazinet, L.; Dammak, L. Identification of phenolic compounds and their fouling mechanisms in ion-exchange membranes used at an industrial scale for wine tartaric stabilization by electrodialysis. Sep. Purif. Technol. 2020, 233, 115995. [Google Scholar] [CrossRef]
  13. Frilet, V.J. Preparation and characterization of bipolar ion exchange membranes. J. Phys. Chem. 1956, 60, 435–439. [Google Scholar] [CrossRef]
  14. Xia, M. An Innovative Beneficial Reclamation of Flue Gas Desulfurization Brine Using Bipolar Membrane Electrodialysis Technique. Int. J. Electrochem. Sci. 2018, 13, 5382–5395. [Google Scholar] [CrossRef]
  15. Szczygiełda, M.; Prochaska, K. Effective separation of bio-based alpha-ketoglutaric acid from post-fermentation broth using bipolar membrane electrodialysis (EDBM) and fouling analysis. Biochem. Eng. J. 2021, 166, 107883. [Google Scholar] [CrossRef]
  16. Ilhan, F.; Kabuk, H.A.; Kurt, U.; Avsar, Y.; Gonullu, M.T. Recovery of mixed acid and base from wastewater with bipolar membrane electrodialysis—A case study. Desalination Water Treat. 2015, 57, 5165–5173. [Google Scholar] [CrossRef]
  17. Wang, X.-X.; Wang, M.; Jia, Y.-X.; Yao, T.-T. The feasible study on the reclamation of the glyphosate neutralization liquor by bipolar membrane electrodialysis. Desalination 2012, 300, 58–63. [Google Scholar] [CrossRef]
  18. Lin, J.; Lin, F.; Chen, X.; Ye, W.; Li, X.; Zeng, H.; Van der Bruggen, B. Sustainable Management of Textile Wastewater: A Hybrid Tight Ultrafiltration/Bipolar-Membrane Electrodialysis Process for Resource Recovery and Zero Liquid Discharge. Ind. Eng. Chem. Res. 2019, 58, 11003–11012. [Google Scholar] [CrossRef]
  19. Vaselbehagh, M.; Karkhanechi, H.; Mulyati, S.; Takagi, R.; Matsuyama, H. Improved antifouling of anion-exchange membrane by polydopamine coating in electrodialysis process. Desalination 2014, 332, 126–133. [Google Scholar] [CrossRef]
  20. Bdiri, M.; Dammak, L.; Larchet, C.; Hellal, F.; Porozhnyy, M.; Nevakshenova, E.; Pismenskaya, N.; Nikonenko, V. Characterization and cleaning of anion-exchange membranes used in electrodialysis of polyphenol-containing food industry solutions; comparison with cation-exchange membranes. Sep. Purif. Technol. 2019, 210, 636–650. [Google Scholar] [CrossRef]
  21. Tanaka, N.; Nagase, M.; Higa, M. Organic fouling behavior of commercially available hydrocarbon-based anion-exchange membranes by various organic-fouling substances. Desalination 2012, 296, 81–86. [Google Scholar] [CrossRef]
  22. Lv, Y.; Yan, H.; Yang, B.; Wu, C.; Zhang, X.; Wang, X. Bipolar membrane electrodialysis for the recycling of ammonium chloride wastewater: Membrane selection and process optimization. Chem. Eng. Res. Des. 2018, 138, 105–115. [Google Scholar] [CrossRef]
  23. Shen, J.; Huang, J.; Liu, L.; Ye, W.; Lin, J.; Van der Bruggen, B. The use of BMED for glyphosate recovery from glyphosate neutralization liquor in view of zero discharge. J. Hazard. Mater. 2013, 260, 660–667. [Google Scholar] [CrossRef] [PubMed]
  24. Sarapulova, V.; Nevakshenova, E.; Nebavskaya, X.; Kozmai, A.; Aleshkina, D.; Pourcelly, G.; Nikonenko, V.; Pismenskaya, N. Characterization of bulk and surface properties of anion-exchange membranes in initial stages of fouling by red wine. J. Membr. Sci. 2018, 559, 170–182. [Google Scholar] [CrossRef]
  25. Garcia-Vasquez, W.; Dammak, L.; Larchet, C.; Nikonenko, V.; Grande, D. Effects of acid–base cleaning procedure on structure and properties of anion-exchange membranes used in electrodialysis. J. Membr. Sci. 2016, 507, 12–23. [Google Scholar] [CrossRef]
  26. Wang, Q.; Yang, P.; Cong, W. Cation-exchange membrane fouling and cleaning in bipolar membrane electrodialysis of industrial glutamate production wastewater. Sep. Purif. Technol. 2011, 79, 103–113. [Google Scholar] [CrossRef]
Figure 1. (a) A picture and (b) a schematic configuration of the BMED membrane stack adopted in the study.
Separations 09 00241 g001
Figure 2. A schematic diagram of the BMED experimental apparatus: 1: Alkali compartment; 2: feed solution compartment; 3: acid compartment; 4: peristaltic pump; 5: electrode solution circulation.
Separations 09 00241 g002
Figure 3. Schematic diagram of the membrane soaking tests.
Separations 09 00241 g003
Figure 4. Influence of the addition of 1 g/L phenol on the performance of BMED stack, and (ae) represent the evolution of resultant alkali and acid concentration, current efficiency, energy consumption, and voltage, respectively.
Separations 09 00241 g004
Figure 5. Influence of the addition of 5 g/L phenol on the performance of BMED stack, and (ae) represent the evolution of resultant alkali and acid concentration, current efficiency, energy consumption, and voltage, respectively.
Separations 09 00241 g005
Figure 6. Influence of the addition of 10 g/L phenol on the performance of BMED stack, and (ae) represent the evolution of resultant alkali and acid concentration, current efficiency, energy consumption, and voltage, respectively.
Separations 09 00241 g006
Figure 7. Influence of the phenol concentration on the selectivity of the BMED stack, and (ad) represent the evolution of the TOC content in the acid and alkali chamber, the content of Na+ in the acid chamber, and the content of Cl in the alkali chamber changed from Batch 1 to Batch 6, respectively.
Separations 09 00241 g007
Figure 8. The SEM analysis on the surface morphology of the fresh AEM (a), the polluted AEM (b), the fresh smooth side of BPM (c), the polluted smooth side of BPM (d), the fresh rough side of BPM (e), the polluted rough side of BPM (f), the fresh CEM (g), and the polluted CEM (h) (magnification 500×; scale bar represents 10 μm).
Separations 09 00241 g008
Figure 9. The SEM image (a), energy spectrum analysis image (b), and the ATR-FTIR spectra (c) of the surface of polluted AEM.
Separations 09 00241 g009
Figure 10. Microscope photos and SEM images of the soaked AEM surfaces: I refers to the microscope photos (magnification 10×), while II refers to the SEM images (magnification 500×; scale bar represents 10 μm); (ad) represent the membrane soaked in water, the membrane soaked in 2 mol/L HCl solution, the membrane soaked in water 2 mol/L NaOH solution, and the membrane soaked in 10 g/L phenol solution, respectively.
Separations 09 00241 g010
Figure 11. Microscope photos and SEM images of the polluted AEM surfaces after soaking cleaning tests: I refers to the microscope photos (magnification 10×), while II refers to the SEM images (magnification 500×; scale bar represents 10 μm); (ad) represent the membrane soaked in water, the membrane soaked in 0.1 wt.% HCl solution, the membrane soaked in water 0.1 wt.% NaOH solution, and the membrane soaked in 1 wt.% NaOH solution, respectively.
Separations 09 00241 g011
Figure 12. Influence of the cleaning on the membrane stack that treated 5 g/L phenol solution, and (ae) represent the evolution of resultant alkali and acid concentration, current efficiency, energy consumption, and voltage, respectively.
Separations 09 00241 g012
Figure 13. Influence of the cleaning on membrane stack containing 10 g/L phenol solution on the operation of BMED, (ae) represent the evolution of resultant alkali and acid concentration, current efficiency, energy consumption, and voltage, respectively.
Separations 09 00241 g013
Figure 14. Influence of the membrane cleaning on the selectivity of the BMED stack, and (ad) represent the variation of TOC content in the acid chamber and alkali chamber, the content of Na+ in the acid chamber, and the content of Cl in the alkali chamber, respectively.
Separations 09 00241 g014
Figure 15. Influence of the NaCl solution containing 10 g/L phenol on the performance of BMED stack, and (ae) represent the evolution of resultant alkali and acid concentration, current efficiency, energy consumption, and voltage, respectively.
Separations 09 00241 g015
Figure 16. Influence of the phenol on the selectivity of the BMED stack, and (ae) represent the evolution of the TOC content in the acid and alkali chamber, the content of Na+ in the acid chamber, the content of Cl in the alkali chamber, and the content of H+ in the feed solution chamber changed from Batch 1 to Batch 32, respectively.
Separations 09 00241 g016
Figure 17. Influence of cleaning on the polluted membrane stack after the long-running operation, and (ae) represent the evolution of resultant alkali and acid concentration, current efficiency, energy consumption, and voltage, respectively.
Separations 09 00241 g017
Figure 18. Influence of the membrane cleaning on the selectivity of BMED performance, and (ae) represent the evolution of the TOC content in the acid chamber and alkali chamber, the Na+ content of the acid chamber, the Cl content of the alkali chamber, and the H+ content of the feed solution, respectively.
Separations 09 00241 g018
Figure 19. Pictures of the fresh membrane and the polluted membranes after cleaning, and (ac) refer to the AEM, CEM, and the smooth surface (anion exchange side) of BPM, respectively; ‘I’ refers to the fresh membrane and ‘II’ refers to the polluted membrane.
Separations 09 00241 g019
Figure 20. SEM images of the fresh membrane and the polluted membranes after cleaning, and (ac) refer to the AEM, CEM, and the smooth surface (anion exchange side) of BPM, respectively; ‘I’ refers to the fresh membrane and ‘II’ refers to the polluted membrane. (Magnification 500×; scale bar represents 10 μm).
Separations 09 00241 g020
Table 1. Basic information of the reagents adopted in this work.
Reagent NameMolecular WeightPurityProvider
Sodium chloride58.5ARShanghai Titan Scientific Co., Ltd., Shanghai, China
Phenol (PhOH)94.11ARShanghai Aladdin Bio-Chem Technology Co., Ltd., Shanghai, China
Sodium hydroxide40ARShanghai Titan Scientific Co., Ltd., Shanghai, China
Sodium carbonate105.99ARShanghai Titan Scientific Co., Ltd., Shanghai, China
Hydrogen potassium phthalate204.22ARShanghai Aladdin Bio-Chem Technology Co., Ltd., Shanghai, China
Phenolphthalein318.32ARShanghai Meryer Chemical Technology Co., Ltd., Shanghai, China
Methyl orange327.33ARShanghai Meryer Chemical Technology Co., Ltd., Shanghai, China
Hydrochloric acid36.5ARBeijing Modern Oriental Fine Chemicals Co., Ltd., Beijing, China
Table 2. Concentrations of the feed solution and corresponding operation parameters.
NumberComposition of the Feed SolutionOperation Parameters
NaCl
(g/L)
Phenol
(g/L)
Current Density
(mA/cm2)
Initial Acid/Alkali Compartment Concentration
(mol/L)
11601700.075
21605700.075
316010700.075
Table 3. EDS analysis of element content on the surface of the IEMs.
MembraneCarbon Content (wt.%)Oxygen Content (wt.%)
AEM (fresh)94.142.5
AEM (polluted)87.838.52
CEM (fresh)66.3817.91
CEM (polluted)63.7219.99
The smooth side of BPM (fresh)94.402.59
The smooth side of BPM (polluted)93.493.82
The rough side of BPM (fresh)66.3815.53
The rough side of BPM (polluted)65.8615.20
Table 4. EDS analysis of element content on the surface and cross-section of AEMs after soaking experiments.
MembraneCarbon Content (wt.%)Oxygen Content (wt.%)
The surface of AEM soaked in water85.063.34
The surface of AEM soaked in 2 mol/L HCl solution85.543.26
The surface of AEM soaked in 2 mol/L NaOH solution85.873.59
The surface of AEM soaked in 10 g/L phenol solution81.239.93
The cross-section of AEM soaked in water84.245.17
The cross-section of AEM soaked in 10 g/L phenol solution83.828.66
Table 5. EDS analysis of element content on the surface and cross-section of AEMs after soaking cleaning tests.
MembraneCarbon Content (wt.%)Oxygen Content (wt.%)
The surface of AEM soaked in water81.309.66
The surface of AEM soaked in 0.1 wt.% HCl solution82.848.69
The surface of AEM soaked in 0.1 wt.% NaOH solution83.174.33
The surface of AEM soaked in 1 wt.% NaOH solution82.586.91
The cross-section of AEM soaked in water82.828.56
The cross-section of AEM soaked in 0.1 wt.% HCl solution82.758.54
The cross-section of AEM soaked in 0.1 wt.% NaOH solution83.266.12
The cross-section of AEM soaked in 1 wt.% NaOH solution83.077.08
Table 6. EDS analysis of element content on the surface and cross-section of the IEMs for the long-running process.
MembraneCarbon Content (wt.%)Oxygen Content (wt.%)
The surface of AEM (fresh)94.142.5
The surface of AEM (after cleaning)93.682.63
The surface of CEM (fresh)66.3817.91
the surface of CEM (after cleaning)65.6518.11
The smooth side of BPM (fresh)94.402.59
The smooth side of BPM (after cleaning)93.413.3
The cross-section of AEM (fresh)75.9913.57
The cross-section of AEM (after cleaning)76.5113.82
The cross-section of CEM (fresh)79.4512.78
The cross-section of CEM (after cleaning)78.1713.05
The cross-section of the smooth side of BPM (fresh)83.069.63
The cross-section of the smooth side of BPM (after cleaning)82.8410.16
Publisher’s Note: MDPI stays neutral with regard to jurisdictional claims in published maps and institutional affiliations.

