Article

Development and Validation of a Sensitive HPLC Assay for Determination of Sparfloxacin According to the European Medicines Agency Guideline

Pharmacology, Institute of Biomedicine (IBIOMED), University of León, 24071 Leon, Spain
*
Author to whom correspondence should be addressed.
Separations 2022, 9(8), 223; https://doi.org/10.3390/separations9080223
Submission received: 22 July 2022 / Revised: 12 August 2022 / Accepted: 14 August 2022 / Published: 17 August 2022

Abstract

:
Sparfloxacin, a synthetic antibiotic belonging to the third-generation fluoroquinolones, has numerous pharmacokinetic and microbiological advantages which can make it an excellent candidate for the treatment of infections in sheep. The objective of this study was to develop and validate an analytical HPLC method to quantify sparfloxacin in sheep plasma, following the recommendations set out in the Guideline on Bioanalytical Method Validation of the European Union (EMEA/CHMP/EWP/192217/2009). The HPLC mobile phase consisted of acetonitrile and monopotassium phosphate buffer (1.36 g/L) 49:51 (v/v). Genabilic acid was used as internal standard. Mean retention times for sparfloxacin and genabilic acid were 2.6 and 5.8 min, respectively. The method met all specifications of the EMA guideline, being selective and linear in the range of 0.2–10 µg/mL (R2 ≥ 0.99). Within-run precision ranged between 0.00 and 0.88%, with an accuracy of 90.3–118.0% for the lower limit of quantitation (LLOQ). The LLOQ was 0.2 µg/mL, and no interference from the biological matrix was found. The stability of sparfloxacin in the biological matrix was demonstrated under different storage conditions. Therefore, the method can be used to determine sparfloxacin concentrations in sheep plasma in different types of studies.

1. Introduction

Sparfloxacin (SPAR), 5-amino-1-cyclopropyl-7-[(3R,5S)-3,5-dimethylpiperazin-1-yl]-6,8-difluoro-4-oxoquinoline-3-carboxylic acid (IUPAC), is a synthetic bactericidal antibiotic belonging to the third-generation fluoroquinolones (Figure 1) [1].
SPAR is a difluorinated quinolone active against a wide range of common and atypical Gram-negative and Gram-positive pathogenic microorganisms, and its spectrum embraces anaerobes, Chlamydia spp., Mycoplasma spp. and Mycobacterium spp. [2,3]. Methicillin-resistant Staphylococcus aureus (MRSA) is also susceptible to SPAR [4]. The molecular target of SPAR is considered the inhibition of DNA gyrase or topoisomerase II and topoisomerase IV. Both are essential enzymes that control DNA topology and assist in DNA replication, repair, deactivation and transcription [2,5,6].
This fluoroquinolone exhibits very good bioavailability following oral administration, with values of about 61.7 to 80% for broiler chicken [7], rats [8,9] and humans [10,11]. SPAR binds weakly to plasma protein (mainly albumin) (37–46%) and exhibits excellent tissue distribution, with the exception of the central nervous system and adipose tissue, and a long elimination half-life. Furthermore, it shows an effective penetration into extracellular fluids in all species tested, including humans. Concentrations of the drug in most tissues are similar to, or higher than, concomitant plasma concentrations. SPAR is distributed slightly into the cerebrospinal fluid, and only one inactive metabolite, the acylglucuronide of SPAR, has been found [4,8,12]. SPAR and its metabolite are excreted by renal and extrarenal processes including biliary excretion and probably transintestinal secretion [10].
According to a literature survey, there are few methodologies for determining SPAR in various liquids, plasma and dosage forms in humans [13,14,15,16]. In addition, there are few reports regarding pharmacokinetic analysis of SPAR in animals [2,3,8,17,18], and none of them have been carried out in sheep, although an HPLC method using it as an internal standard was validated in sheep plasma [19]. The numerous microbiological and pharmacokinetic advantages of SPAR compared to other members of its group could make it an excellent candidate to treat infections caused by susceptible pathogenic species in sheep.
SPAR has been temporarily used in human medicine with good results; however, its application in human health is currently banned in Europe due to phototoxicity problems, making its use in veterinary medicine a valuable market. Following the recommendations of the regulatory agencies, its exclusive use in veterinary medicine would contribute to reducing the risk of the development of bacterial resistance.
Thus, the objective of this study was to develop and validate an analytical HPLC method to quantify SPAR in sheep plasma, following the recommendations set out in the Guideline on Bioanalytical Method Validation of the European Union (EMEA/CHMP/EWP/192217/2009) [20].

2. Materials and Methods

2.1. Chemicals and Reagents

SPAR was purchased from Sigma-Aldrich (Schenelldorf, Germany) with a purity of 98%. The internal standard (IS) used was genabilic acid (purity 98.5%, Sigma-Aldrich, Schenelldof, Germany). All reagents and solvents used were of HPLC grade: methanol (LiChrosolv. Merck, Madrid, Spain), acetonitrile (HiPerSolv CHROMANORM, Radnor, PA, USA), sodium hydroxide 1N (Panreac. Quimica S.A., Barcelona, Spain), monopotassium phosphate (AnalaR NORMAPUR, Radnor, PA, USA) and acetic acid 10% (Chromanorm VWR Chemicals, Radnor, PA, USA). HPLC-grade water was used for the extraction and quantification procedures. This was produced in our laboratory by using an Ultramatic system by Wasserlab. For the solid-phase extraction process, a Manifold with 20 positions (Waters Corporation, Milford, MA, USA) and Oasis HLB 1cc 30 mg cartridge (Waters Corporation, Milford, MA, USA) were employed.

2.2. Animals and Experimental Procedures

Six non-lactating healthy female Spanish Churra sheep (4–5 years old) weighing 70 ± 7 kg were used. The study was carried out in the experimental farm of the Veterinary Faculty of the University of Leon. Animals’ health was closely monitored before and throughout the experimental period by a veterinarian. Sheep were allowed to acclimatize to their environment before the experiment was started, and they were maintained in an adequately ventilated building. They were provided a diet of hay and pelleted feed concentrate twice a day with water and saltlick ad libitum. The study was approved by the Ethics Committee of the University of León (OEBA-ULE-004-2019).
Blood samples were collected from the jugular veins into heparinized tubes (Vacutainer, BD, Plymouth, UK). Samples were centrifuged at 1500 rpm for 20 min, and plasma was stored at −20 °C until analysis.

2.3. Preparations of Stock, Calibration and Quality Working Solutions

Stock solutions, calibration working solutions and quality control working solutions (QC) were prepared daily.
  • Stock solution (1 mg/mL) was prepared in HPLC-grade water, also adding 100 µL NaOH 1N. IS (1 mg/mL) was also dissolved in HPLC-grade water and 100 µL NaOH 1N.
  • Calibration working solutions containing both SPAR (2, 5, 10, 20, 50 and 100 µg/mL) and IS (20 µg/mL) were then prepared by diluting an appropriate volume of the stock solution in 10 mL of HPLC-grade water.
  • Quality control working solutions (QC) were obtained by adding an aliquot of each stock solution to obtain final concentrations of 0.2 µg/mL (QC1: LLOQ, lower limit of quantitation), 0.6 µg/mL (QC2: LOW, three times the LLOQ), 3 µg/mL (QC3: MED, between 30 and 50% of the calibration curve range) and 8 µg/mL (QC4: HIGH, 75% of the upper calibration curve range).

2.4. Preparation of Analysis Samples

  • Blank samples: biological matrix without SPAR and IS (1 mL).
  • Zero samples: biological matrix (0.9 mL) with 0.1 mL IS (20 µg/mL).
  • Calibration standards: 0.9 mL plasma was spiked with 100 µL of each calibration working solution to obtain calibration curves. Thus, concentrations of calibration samples were 0.2, 0.5, 1, 2, 5 and 10 µg/mL for SPAR and 2 µg/mL for IS.
  • Quality control samples were also prepared in plasma (0.9 mL) at concentrations of 0.2, 0.6, 3 and 8 µg/mL for SPAR (0.1 mL) and 2 µg/mL for IS (0.1 mL).
  • All samples were fully thawed at room temperature.

2.5. Extraction Method

Plasma samples were deproteinized with 1 mL 10% acetic acid, shaken for 1 min and centrifuged at 1620 g for 10 min. The supernatant was then transferred into the SPE cartridge. Cartridges were previously conditioned with 1 mL methanol and then with 1 mL HPLC-grade water. After washing twice with 1 mL HPLC-grade water, the cartridge was properly dried and eluted with 1 mL mobile phase. Finally, 20 µL of eluate was injected into the HPLC system. All procedures were performed at room temperature.

2.6. HPLC System and Conditions

The samples were analyzed by reverse-phase high-performance liquid chromatography (HPLC) in a Waters Alliance e2695 HPLC system equipped with a photodiode array detector (model 2998) (Waters Corporation, Milford, MA, USA).
Chromatographic separation was performed at room temperature (21 °C) with an Xbridge BEH C18 column (5 µm, 4.6 × 250 mm) (Waters Corporation, Milford, MA, USA). The mobile phase consisted of a mixture of acetonitrile and monopotassium phosphate buffer (1.36 g/L) 49:51 (v/v). The flow rate was 1 mL/min, and the wavelength was set at 236 and 298 nm. The injection volume was 10 µL. Genabilic acid was used as internal standard. The limit of detection (LOD) was estimated by integrating the baseline noise of the HPLC system in the height covering the mean retention time of SPAR in six plasma samples spiked with the IS and defined as the mean baseline noise/IS peak height ratio plus three standard derivations.
Photodiode array detectors provide three-dimensional information that allows an accurate assessment of peak identification, purity and quantitation in a single run. We used our spectral library to establish peaks’ homogeneity and identity. The study was conducted under the Good Laboratory Practice (GLP) regulations at our GLP-compliant laboratory LAFARLE (University of Leon, Leon, Spain), certified by the Spanish Agency of Medicines and Medical Devices (AEMPS) [21].

2.7. Method Validation Procedure

The validation of the method was carried out by using the following parameters: selectivity, carry-over, lower limit of quantification, calibration curve, precision, accuracy and stability, in accordance with the Guideline on Bioanalytical Method Validation of the European Medicines Agency (EMA/CHMP/EWP/192217/2009) [20].

2.8. Method Application

SPAR concentrations were measured in plasma samples obtained from 2 sheep to explore the applicability of the method in clinical practice. SPAR was administered intravenously at a dose of 5 mg/kg. Blood samples were alternately collected from the jugular veins into heparinized tubes (Vacutainer, BD, Plymouth, UK) at 15 and 30 min and 2, 4, 8, 12 and 24 h. Samples were centrifuged for 20 min at 406 g, and then plasma was stored at −20 °C until analysis. Before analysis, plasma samples (1 mL) were spiked with 20 µL IS.
Animal procedures and management protocols were authorized in advance by both the Ethics Committee of the University of Leon and the regional authorities (OEBA-ULE-004-2019). No invasive procedure was involved beyond blood sampling.

2.9. Data Analysis

For data acquisition and processing, HPLC Empower 3 (Waters Corporation, USA) software was employed. A descriptive statistical analysis (mean and standard deviation) was carried out on data values using SPSS Statistical Software V. 26.0 (IBM Corporation, Armonk, NY, USA).

3. Results and Discussion
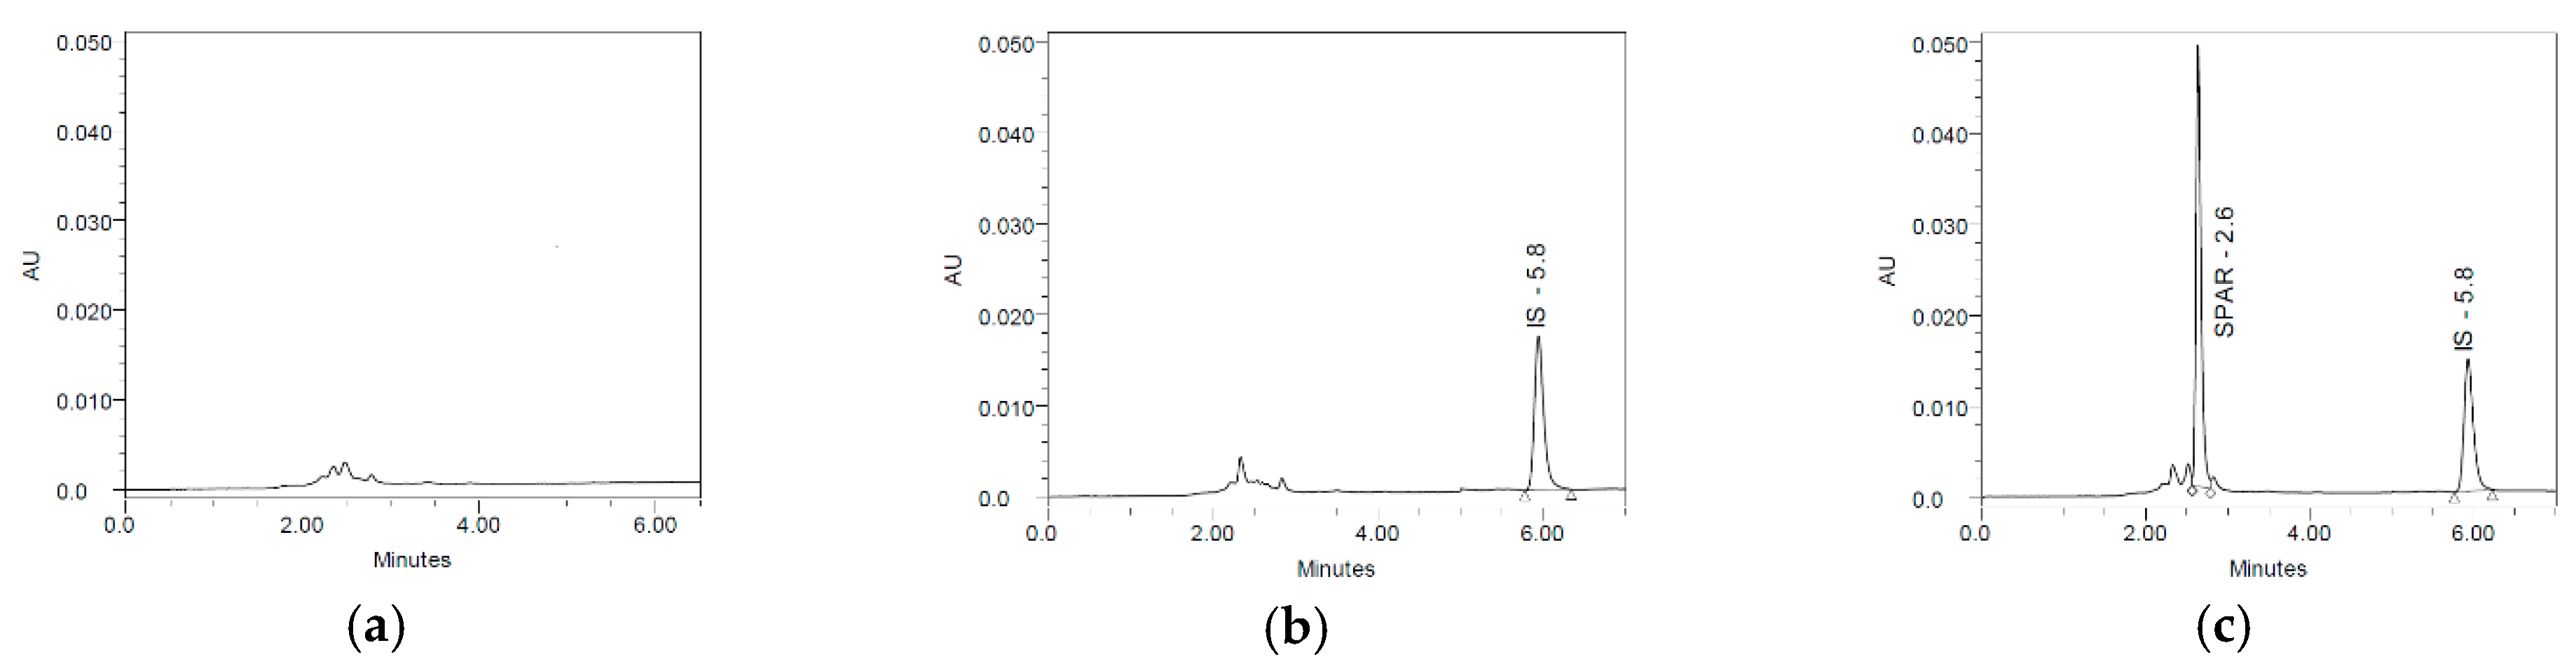
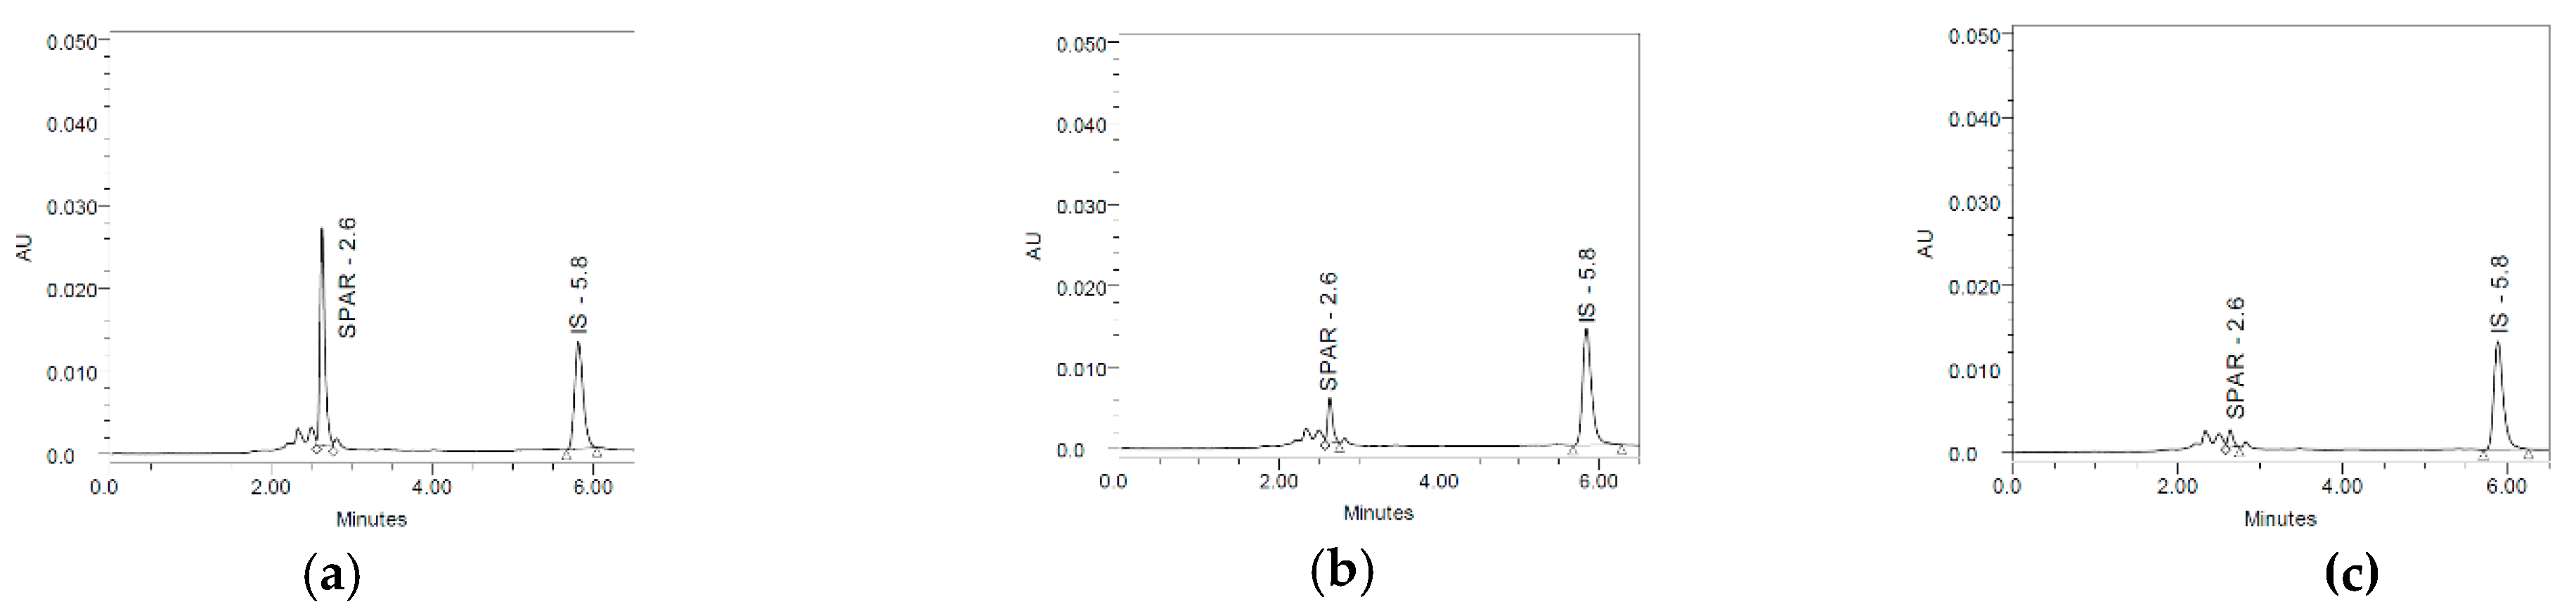
3.1. Selectivity

Selectivity was evaluated by comparing the chromatograms of the blank plasma samples from six different individual sources of this blank matrix, zero sample (biological matrix with IS) and biological matrix with SPAR and IS. No endogenous interferences were observed in SPAR and IS retention times, as shown in Figure 2. Mean retention times of SPAR and IS were 2.6 min (λ = 298 nm) and 5.8 min (λ = 236 nm), respectively. Therefore, the method used meets the selectivity criterion indicated by the European validation guideline [20]. Moreover, the LOD calculated was 0.084 µg/mL.

3.2. Carry-Over

Carry-over was assessed by injecting a mobile phase sample after a high concentration calibration standard sample (10 μg/mL) a high concentration QC (8 μg/mL), and the two highest concentrations in working solutions (calibration and quality control) dissolved in mobile phase. No signal was observed at the retention times of SPAR and IS. The quality parameter was also met, according to the European validation guideline [20].

3.3. Lower Limit of Quantification (LLOQ)

LLOQ was defined by analyzing blank samples spiked with the lowest calibration concentration (0.2 µg/mL). According to the guideline [20], to define this concentration as LLOQ, precision and accuracy conditions must be met (precision as coefficient of variation (CV) not exceeding ±20% and accuracy between 80 and 120%). Inter-day precision (CV) of the assay was 12.9% and accuracy was 106.8% (Table 1). So, the precision (CV) and accuracy in the inter-day runs were within the criteria established [20].

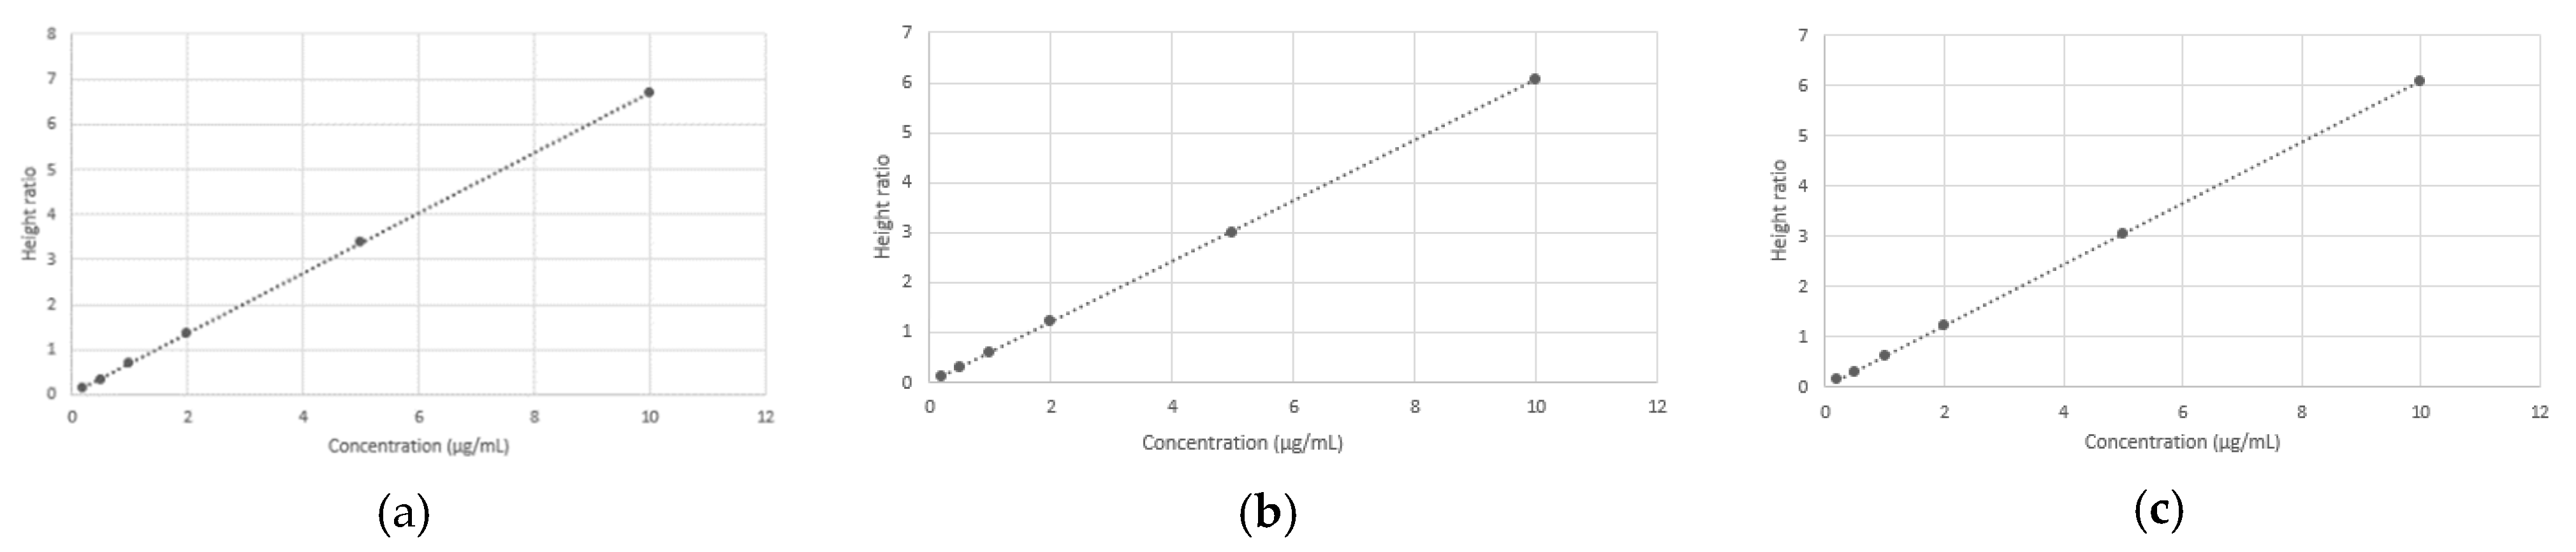
3.4. Calibration Curve

Calibration curves included a blank sample, a zero sample and seven calibration samples from 0.2 μg/mL (LLOQ) to 10 μg/mL for SPAR and 2 μg/mL IS. These samples were analyzed in three different runs carried out in duplicate on three different days. The linear regression analysis was carried out on known concentrations of SPAR against the ratio of the height of SPAR vs. IS. The blank and zero samples were not considered to calculate the calibration curve parameters. Calibration curves were linear within the range of 0.2–10 µg/mL. Table 2 summarizes the results of the regression analysis with respect to the linearity of the method between 0.2 and 10 µg/mL (SPAR: 0.2, 0.5, 1, 2, 5 and 10 µg/mL; IS: 2 µg/mL), showing a good linearity and high coefficients of determination (R2 > 0.999). Figure 3 shows the calibration curves obtained.
Back-calculated values of SPAR concentration in calibration samples are presented in Table 3. All samples in each analytical run fulfilled the criterion of being within ±15% of the nominal value, and ±20% for LLOQ. On the other hand, the mean recovery of SPAR was 92.44 ± 5.47%.

3.5. Accuracy and Precision

Intra-day and inter-day accuracy (ratio between mean found and nominal concentrations) and precision were evaluated through the four QC levels (QC1 or LLOQ; QC2 or LOW; QC3 or MED; QC4 or HIGH). For the intraday (within-run) assay, five replicates of each QC level were processed the same day. For the inter-day (between-run) assay, each QC level was processed five times on three different days. Precision was expressed as the coefficient of variation (CV).
Table 4 and Table 5 show the intra-day and inter-day precision and accuracy of the method. Within-run precision ranged from 0.00 to 0.88%, with an accuracy from 90.3 to 118.0% for LLOQ. On the other hand, precision ranged for LOW, MED and HIGH from 0.01 to 2.51%, with an accuracy from 87.0 to 114.2%. Between-run precision ranged from 0.24 to 0.77%, and the accuracy from 96.4 ± 7.0 to 103.2 ± 8.8%. Therefore, the method used meets the accuracy and precision criteria described in the European Guideline on Bioanalytical Method Validation [20].

3.6. Stability

The stability of SPAR and IS in plasma was evaluated using QC2 (LOW) and QC4 (HIGH) quality control concentrations (0.6 µg/mL and 8 µg/mL, respectively) at different storage conditions (Table 6). Concentrations were calculated by using the calibration curve obtained on the day of the analysis. According to the guideline [20], three freeze–thaw cycles from −20 ºC to room temperature were carried out. In all cases, the acceptance criteria were fulfilled, with an accuracy ranging from 90.4 to 110.7%.

3.7. Method Application

The application of the method was tested by analyzing plasma samples obtained from two sheep after intravenous administration of SPAR. The drug was detected in all samples without interferences, as shown in Figure 4.

4. Conclusions

A new, sensitive, simple and fast HPLC method for sparfloxacin quantification in sheep plasma was successfully developed. It was validated according to the Guideline on Bioanalytical Method Validation of the European Union (EMEA/CHMP/EWP/192217/2009) [20]. This method can be used to perform pharmacokinetic studies with sparfloxacin in this animal species.
Selectivity, carry-over, lower limit of quantification (LLOQ), calibration range, accuracy, precision and stability always fulfilled the criteria established. Its low cost, the low volume of sample needed and the simple instrumentation required should also be considered as advantages of this method. Moreover, the chromatographic runtime is about 6 min, which allows a large number of samples to be processed in a short time.

Author Contributions

Conceptualization, M.S. and J.J.G.; methodology, C.L., J.M.R. and A.M.S.; software, R.D.; validation, M.J.D.; formal analysis, R.D. and N.F.; investigation, C.L., R.D., J.M.R., N.F. and A.M.S.; resources, R.D.; data curation, N.F.; writing—original draft preparation, C.L.; writing—review and editing, M.S. and J.J.G.; visualization, A.M.S.; supervision, M.J.D.; project administration, A.M.S.; funding acquisition, A.M.S. All authors have read and agreed to the published version of the manuscript.

Funding

This research received no external funding.

Institutional Review Board Statement

The study was approved by the Ethics Committee of the University of León (OEBA-ULE-004-2019).

Informed Consent Statement

Not applicable.

Data Availability Statement

Not applicable.

Conflicts of Interest

The authors declare no conflict of interest.

References

  1. O´Neil, M. The Merck Index, 15th ed.; Royal Society Chemistry: Whitehouse Station, NJ, USA, 2013; ISBN 9781849736701. [Google Scholar]
  2. Ravisankar, P.; Rao, G.D.; Rao, M.N.; Devadasu, C.A. Validated RP-HPLC method for the determination of sparfloxacin in bulk and pharmaceutical dosage form. Asian J. Pharm. Clin. Res. 2014, 7, 135–140. [Google Scholar]
  3. Bhar, M.K.; Khargharia, S.; Chakraborty, A.K.; Mandal, T.K. Disposition kinetics of sparfloxacin in healthy, hepatopathic, and nephropathic conditions in chicken after single intravenous administration. Indian J. Pharmacol. 2009, 41, 106–110. [Google Scholar] [CrossRef] [PubMed]
  4. Shimada, J.; Nogita, T.; Ishibashi, Y. Clinical Pharmacokinetics of Sparfloxacin. Clin. Pharmacokinet. 1993, 25, 358–369. [Google Scholar] [CrossRef] [PubMed]
  5. Alós, J. Quinolonas. Enferm. Infecc. Microbiol. Clin. 2009, 27, 290–297. [Google Scholar] [CrossRef]
  6. Oliphant, C.; Green, G. Quinolones: A comprehensive review. Am. Fam. Physician 2002, 65, 455–464. [Google Scholar] [PubMed]
  7. Sriranjani, D.; Kalaiselvi, L.; Ramesh, S.; Mathuram, L.N.; Sriram, P. Pharmacokinetics of sparfloxacin in broiler chicken. Br. Poult. Sci. 2006, 47, 720–725. [Google Scholar] [CrossRef] [PubMed]
  8. Suraj, S.S.; Suresh, N.N.; Sanis, J.; Sanjay, B.M.; Saranya, C.; Asaf, M.; Shijin, M.S.; Nisha, A.R.; Anoopraj, R. Single dose oral pharmacokinetics of sparfloxacin in rats. Pharma Innov. J. 2019, 8, 317–322. [Google Scholar]
  9. Matsunaga, Y.; Miyazaki, H.; Oh-e, Y.; Nambu, K.; Furukawa, H.; Yoshida, K.; Hashimoto, M. Disposition and metabolism of [14C] sparfloxacin in the rat. Arzneimittelforschung 1991, 41, 747–759. [Google Scholar] [PubMed]
  10. Montay, G. Pharmacokinetics of sparfloxacin in healthy volunteers and patiensts: A review. J. Antimicrob. Chemother. 1996, 37, 27–39. [Google Scholar] [CrossRef] [PubMed]
  11. Montay, G.; Bruno, R.; Vergniol, J.C.; Ebmeier, M.; Roux, Y.L.; Guimart, C.; Frydman, A.; Chassard, D.; Thebault, J.J. Pharmacokinetics of Sparfioxacin in Humans After Single Oral Administration at Doses of 200, 400, 600, and 800 mg. J. Clin. Pharmacol. 1994, 34, 1071–1076. [Google Scholar] [CrossRef] [PubMed]
  12. Mody, V.D.; Pandya, K.K.; Satia, M.C.; Modi, I.A.; Modi, R.I.; Gandhi, T.P. High performance thin-layer chromatographic method for the determination of sparfloxacin in human plasma and its use in pharmacokinetic studies. J. Pharm. Biomed. Anal. 1998, 16, 1289–1294. [Google Scholar] [CrossRef]
  13. Cho, H.-Y.; Park, S.-A.; Lee, Y.-B. Improvement and validation of an HPLC method for examining the effects of the MDR1 gene polymorphism on sparfloxacin pharmacokinetics. J. Chromatogr. B 2006, 834, 84–92. [Google Scholar] [CrossRef] [PubMed]
  14. Prakash, K.; Sireesha, K. HPLC-UV method for simultaneous determination of sparfloxacin and dexamethasone sodium phosphate in eye drops. Pak. J. Pharm. Sci. 2019, 32, 1057–1061. [Google Scholar] [PubMed]
  15. Srinivas, N.; Narasu, L.; Shankar, B.; Mullangi, R. Development and validation of a HPLC method for simultaneous quantitation of gatifloxacin, sparfloxacin and moxifloxacin using levofloxacin as internal standard in human plasma: Application to a clinical pharmacokinetic study. Biomed. Chromatogr. 2008, 22, 1288–1295. [Google Scholar] [CrossRef] [PubMed]
  16. Shah, J.; Jan, M.; Khan, I.; Khan, M. Quantification of sparfloxacin in pharmaceutical dosages and biological samples. Pak. J. Pharm. Sci. 2012, 25, 823–829. [Google Scholar] [PubMed]
  17. Hn, O.; Cj, M. Spectrophotometric determination of sparfloxacin in bulk and dosage forms. Int. J. Curr. Res. Rev. 2010, 2, 27–33. [Google Scholar]
  18. Stahlmann, R.; Zippel, U.T.A.; Fo, C.; Schwabe, R.; Shakibaei, M.; Merker, H.; Borner, K. Chondrotoxicity and Toxicokinetics of Sparfloxacin in Juvenile Rats. Antimicrob. Agents Chemother. 1998, 42, 1470–1475. [Google Scholar] [CrossRef] [PubMed]
  19. López, C.; Díez, R.; Rodríguez, J.; Sierra, M.; García, J.; Fernández, N.; Diez, M.; Sahagún, A. Determination of Menbutone: Development and Validation of a Sensitive HPLC Assay according to the European Medicines Agency Guideline. Separations 2022, 9, 84. [Google Scholar] [CrossRef]
  20. European Medicines Agency (EMA). Guideline on Bioanalytical Method Validation (EMEA/CHMP/EWP/192217/2009). Available online: http://www.ema.europa.eu/ema/index.jsp?curl=pages/includes/document/document_detail.jsp?webContentId=WC500109686%26mid=WC0b01ac058009a3dc (accessed on 22 March 2022).
  21. Spanish Agency of Medicines and Medical Devices (AEMPS). List of Laboratories Certified for Good Laboratory Practice Compliance [Listado de Laboratorios Certificados para el Cumplimiento de Buenas Prácticas de Laboratorio]. Available online: https://www.aemps.gob.es/industria-farmaceutica/buenas-practicas-de-laboratorio/listadolab-bpl/ (accessed on 18 April 2022).
Figure 1. Structure of sparfloxacin.
Separations 09 00223 g001
Figure 2. Representative HPLC chromatogram of: (a) blank plasma sample; (b) zero sample (IS, 2 µg/mL); (c) plasma sample fortified with SPAR (5 µg/mL) and IS (2 µg/mL).
Separations 09 00223 g002
Figure 3. Representation of the three calibration curves obtained. (a) curve 1; (b) curve 2; (c) curve 3.
Separations 09 00223 g003
Figure 4. Representative HPLC chromatograms of sheep plasma samples after intravenous SPAR administration (5 mg/kg) at sampling times of (a) 15 min, (b) 4 h and (c) 24 h.
Separations 09 00223 g004
Table 1. Accuracy and precision for LLOQ (nominal concentration: 0.2 µg/mL).
Intra-DayCV (%)Accuracy (%)
Batch 119.7103.1
Batch 23.7112.3
Batch 315.4105.0
Inter-Day12.9106.8
Table 2. Linear regression analysis of calibration curves.
Equation of the LineR2p
Calibration curve 1y = 0.6694x + 0.02260.999<0.001
Calibration curve 2y = 0.6068x + 0.00760.999
Calibration curve 3y = 0.6081x + 0.01260.999
Table 3. Back-calculated values of SPAR in calibration samples.
Nominal Concentration (µg/mL)
0.20.512510
Accuracy (%)Calibration curve 1103.193.5101.4100.1100.499.9
Calibration curve 2112.3101.499.0100.399.0100.3
Calibration curve 3105.098.698.7100.2100.2100.0
Table 4. Intra-day and inter-day precision (CV %) for the quality controls.
LLOQLOW
Nominal Concentration (µg/mL)0.20.6
Sample Number1234512345
Intra-Day
Batch 10.001.160.180.130.650.350.810.220.330.82
Batch 20.400.430.880.710.240.870.100.180.631.03
Batch 30.080.040.420.820.170.630.232.160.582.51
Inter-Day 0.42 0.77
MEDHIGH
Nominal Concentration (µg/mL)38
Sample Number1234512345
Intra-Day
Batch 10.120.210.210.040.100.160.080.050.330.22
Batch 20.250.320.320.500.470.010.220.150.450.16
Batch 30.070.470.780.280.760.630.400.200.050.45
Inter-Day 0.33 0.24
Table 5. Intra-day and inter-day accuracy (%) for the quality controls.
LLOQLOW
Nominal Concentration (µg/mL)0.20.6
Sample Number1234512345
Intra-Day
Batch 190.392.896.395.397.787.087.688.587.887.2
Batch 2113.0115.6118.0110.4105.1101.9103.0104.0106.3104.2
Batch 396.499.2101.9104.8112.093.697.0100.198.199.9
Inter-Day103.2 ± 8.896.4 ± 7.1
MEDHIGH
Nominal Concentration (µg/mL)0.20.6
Sample Number1234512345
Intra-Day
Batch 194.3100.097.798.998.497.996.496.096.996.9
Batch 2101.5100.0103.1114.2100.897.898.399.3100.899.4
Batch 396.694.897.493.096.292.392.593.395.294.6
Inter-Day99.1 ± 5.096.5 ± 2.5
Table 6. Stability of QC2 and QC4 at different storage conditions.
Temperature (°C)TimeQC2QC4
CV (%)Accuracy (%)CV (%)Accuracy (%)
−2024 h2.34107.31.88107.1
48 h3.0897.51.32107.4
72 h1.5891.33.5996.0
424 h0.72109.28.05104.2
48 h4.3999.03.39108.4
72 h3.3190.42.15102.7
2524 h0.86102.70.40110.7
−207 days2.39105.42.2095.6
1 month0.87107.01.2494.8
2 months2.58105.62.50110.1
47 days1.11109.00.60103.2
424 h after extraction4.00108.73.80107.8
2524 h after extraction0.80102.86.99104.9
Publisher’s Note: MDPI stays neutral with regard to jurisdictional claims in published maps and institutional affiliations.

