Abstract
An environmentally friendly unreported rapid and simple reverse-phase high-performance thin-layer chromatography (RP-HPTLC) has been designed for the simultaneous determination of bioactive sesquiterpene coumarins feselol and samarcandin in the methanol extract of five Ferula species. The method was developed using glass plates coated with RP-18 silica gel 60 F254S and a green solvent system of ethanol–water mixture (8:2 v/v) as mobile phase. After development, the plates were quantified densitometrically at 254 for feselol and samarcandin. Feselol and samarcandin peaks from methanol extract of five Ferula species were identified by comparing their single band at Rf = 0.43 ± 0.02 and Rf = 0.60 ± 0.01, respectively. Valid linear relationships between the peak areas and concentrations of feselol and samarcandin in the range of 1000–7000 ng/band respectively were obtained. The method was subjected to the validation criteria of the international conference on harmonization (ICH) for precision, accuracy, and robustness. The new method provides an analytical tool to enumerate the therapeutic doses of feselol and samarcandin in herbal formulations and/or crude drugs. The obtained results indicated that F. drudeana was the richest species in the more active samarcandin, with 0.573% w/w, while F. duranii had the largest quantity of the less active feselol, 0.813% w/w. F. drudeana was superior to the other species in the sum of the two active compounds, 1.4552% w/w, and was consequently expected to be the most active aphrodisiac among the five studied species.
1. Introduction
The family Apiaceae is one of the largest families of flowering plants, with approximately 450 genera and 3700 species, growing in the northern temperate regions [1]. The family members are economically important as food, flavoring agents, and ornamental plants [2]. One of the important genera in the family is Ferula L., which contains 180–185 species found in Central and Southwest Asia [1]. In Turkey, more than 130 species were recognized. About 100 of these species are endemic [3]. Ferula species members are generally tall perennials or biennials characterized by stout stems and finely divided leaves with inflated sheaths [4]. Plants belonging to the Ferula genus are well-documented for their therapeutic value in the Middle East area’s traditional medicine. Among the reported traditional medicinal uses of Ferula species are for treating rheumatism, inflammation, pain, convulsion, neurological disorders, and diabetes [5]. Many members of the genus have been used in Chinese traditional medicine for stomach disorders and rheumatoid arthritis. Recent pharmacological investigations have proved the antibacterial, antioxidant, antiulcerative, immunopharmacological, and hypotensive activities of the genus [6,7,8]. The antihyperlipidemic and antihyperglycemic effects of F. assa-foetida, F. tenuissima, F. drudeana, and F. huber-morathii were demonstrated [9,10].
The most common traditional use of Ferula species members is as an aphrodisiac [11]; for example, F. hermonis is commonly used in Syria and Lebanon [12]. F. narthex is used for its aphrodisiac properties in Ayurvedic medicine [13]. In the USA [14] and Brazil [15] F. assa-foetida extracts have been applied for the treatment of erectile dysfunction. Other Ferula members such as F. elaeochytris and F. communis are listed as aphrodisiacs in the Turkish traditional medicine [16].
Ferula species are the source of important biologically active secondary metabolites as sesquiterpene coumarin derivatives and sulphur compounds [17]. The biological activities of the plants’ genus are partially attributed to the volatile oil contents [18].
Our investigation of the aphrodisiac effect of F. drudeana listed in Turkish traditional medicine and phytochemical study resulted in the isolation of two active sesquiterpene coumarins, feselol and samarcandin [19]. In this investigation, we designed a validated RP-HPTLC method for the analyses of feselol and samarcandin biomarker in five Ferula spices, utilizing RP18 silica gel plates. The proposed method was proved to be precise, accurate, and compliant with all the ICH guidelines [20].
2. Materials and Methods
2.1. Standard and Chemicals
Standard feselol and samarcandin (Figure 1) were previously purified and characterized from of F. drudeana [19]. All the used solvents were of HPLC grade and other chemicals were of analytical reagent (AR) grade.
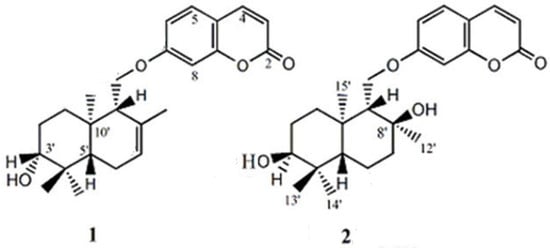
Figure 1.
Structures of feselol (1) and samarcandin (2).
2.2. Preparation of Standard Solutions
Accurately weighed 10 mg of the standard feselol and samarcandin were separately dissolved in the green solvent ethanol and the volume was completed to 10 mL volumetric flasks to obtain 1000 μg/mL concentration. From this working standard, 1, 2, 3, 4, 5, 6 and 7 μL equivalent to 1000, 2000, 3000, 4000, 5000, 6000, and 7000 ng, respectively, were applied as bands on the RP 18-TLC. Two calibration curves for feselol and samarcandin were plotted in the range of 1000–7000 ng/band, correlating peak areas with the corresponding concentrations of the analytes per band. This solution was used as a reference solution.
2.3. Plant Material
The plants of F. drudeana, F. tenuissima, F. Huber-morathii, F. duranii, and F. assa-foetida were collected from the Turkey and were previously described in [9,10,19].
2.4. Extractions Procedure
The dried powdered parts of different plant species (10 g) were extracted by percolation at room temperature with ethanol (4 × 70 mL) until exhaustion. The combined solvents were evaporated using rotary vacuum evaporator and the left extracts were dissolved in 50 mL volumetric flask with ethanol. These test solutions were used in the TLC (Thin Layer Chromatography)densitometric analysis.
2.5. Chromatographic Conditions
Glass-backed plates 10 × 20 cm coated with 0.2 mm layers of RP18 silica gel 60 F254S (E-Merck, Darmstadt, Germany) were used for densitometric analysis. Samples were applied as 6 mm bands using a Camag Automatic TLC Sampler 4 (ATS4) sample applicator (Muttenz, Switzerland) integrated with a Camag microlitre syringe. The application rate was adjusted to 150 nL/s. The plates were developed to 80 mm distance using ethanol/water 8:2 (%, v/v) as mobile phase in a Camag Automatic Developing Chamber 2 (ADC2). Saturation of the camber with mobile phase was allowed for 30 min at 22 °C.
2.6. Method Validation
The designed HPTLC method was subjected to validation according to the ICH guidelines [20]. Linearity of the method for feselol and samarcandin were checked between 1000–7000 and peak area was plotted against concentration.
2.6.1. Accuracy
Accuracy was determined using the standard addition method. Preanalyzed samples of feselol and samarcandin (2000 ng/band) were spiked with extra amounts of the analytes (0, 50, 100, and 150%) and the mixtures were reanalyzed. Both percentage recovery and relative standard deviation (RSD, %) were obtained for each concentration level as indication for accuracy.
2.6.2. Precision
Precision was determined as repeatability and intermediate precision. Repeatability of sample was determined as intraday variation, while intermediate precision was proved from the interday variation for analysis of feselol and samarcandin at three different dilutions (300, 400, and 500 ng/band) in six replicates.
2.6.3. Robustness
Robustness was used to evaluate the influence of small deliberate changes in the chromatographic conditions on the new designed method. Small changes to duration of mobile-phase saturation, mobile-phase composition, mobile-phase volume, and activation of HPTLC plates during the analyses of feselol and samarcandin could be applied.
2.6.4. Limit of Detection (LOD) and Limit of Quantification (LOQ)
The two values known as limit of detection (LOD) and limit of quantification (LOQ) were obtained, applying the standard deviation (SD) method. The two were calculated using the slope of the calibration (S) curve, SD of the blank sample, and applying the following formulas:
LOD = 3.3 × SD/S
LOQ = 10 × SD/S
The standard deviation of the response was determined using the y-intercepts of regression lines’ standard deviation.
2.6.5. Quantification of Feselol and Samarcandin in Ethanol Extract of Ferula Species
Different Ferula species samples were applied on the RP18-TLC plates, and same conditions for analysis of standard feselol and samarcandin were used to obtain test samples’ chromatograms. The area of the peak corresponding to the Rf value of feselol and samarcandin standard were observed and the amounts present were obtained using the regression equation obtained from the calibration plot.
3. Results
3.1. Method Development
The densitometric HPTLC method for analysis of feselol and samarcandin was achieved by optimizing the mobile-phase composition. The mobile phase composed of ethanol–water 8:2 (%, v/v) resulted in a compact, symmetrical, and well-resolved peak at Rf value of 0.43 ± 0.02 and 0.60 ± 0.01 for feselol and samarcandin, respectively (Figure 2). UV spectra showed λmax absorbance at 254 nm for both feselol and samarcandin bands.
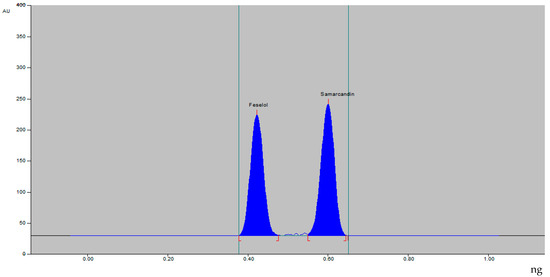
Figure 2.
HPTLC densitogram of standard feselol and samarcandin.
3.2. Method Validation
The calibration plot of the peak area against the concentrations of feselol (Figure 3A) and samarcandin (Figure 3B) showed linearity in the range of 1000–7000 ng/band. Linear regression data obtained from the plot indicated a good linear relationship (Table 1).
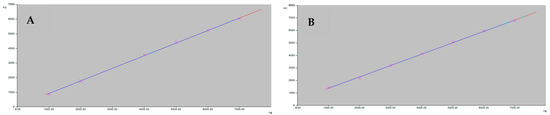
Figure 3.
The linearity graph of feselol (A) and samarcandin (B).

Table 1.
Linear regression data for the calibration curve of feselol and samarcandin (n = 6).
The accuracy of the method expressed as recovery is shown in Table 2. In Table 3, the results of repeatability and intermediate precision, expressed as SD (%), are presented. Robustness of the presented new HPTLC method explored by introducing a small deliberate change into the densitometric TLC procedure. Results of robustness are presented in Table 4. LOD and LOQ of the proposed method were found to be 12.34 and 38.45 as well as 14.03 and 56.12 ng/band for feselol and samarcandin, respectively.
Table 2.
Accuracy of the proposed method (n = 6).
Table 3.
Precision of the proposed method of feselol and samarcandin.
Table 4.
Robustness of the proposed HPTLC method of feselol and samarcandin.
4. Discussion
Sesquiterepene coumarins are unique secondary metabolites of limited distribution in the plant kingdom. They were reported from the genera Ferula, Daucus, Heptaptera and Dorema (Apiaceae); Achillea, Artemisia, Anthemis, Brocchia, and Tanacetum (Asteraceae), Euphorbia and Jatropha (Euphorbiaceae) and Aegle (Rutaceae). However, most of the isolated sesquiterpene coumarins came from herbs from the Ferula genus. According to Li et al. [21], 181 sesquiterpene coumarins have been reported, among which 135 were identified from Ferula species. For example, the study of F. samarkandica led to the isolation of 22 sesquiterpene coumarins [22]. Sesquiterpene coumarins can be considered as biomarkers for the genus Ferula. Most of the genus bioactivities were attributed to sesquiterpene coumarins. The aphrodisiac effect of F. drudeana was traced to feselol and samarcandin [19]. Quantification of these two compounds in the genus member can give an indication to their aphrodisiac potential.
The developed method was challenged against all parameters required by the ICH [20] for validation. The linearity of both feselol and samarcandin were observed in the range of 1000–7000 ng (Figure 3A,B). The correlation coefficient (R2) was highly significant (p < 0.0001), and values were 0.9996 and 0.9995 for feselol and samarcandin, respectively (Table 1). The obtained R2 values gave indication about the strength of the correlations between the two variables. The % recoveries of 98.42–99.77 and 98.78–99.87 for feselol and samarcandin (Table 2) after standard addition of 0, 50, 100, and 150% to preanalyzed sample with 2000 ng/band of both feselol and samarcandin indicated that the method is accurate for the determination of the two standards.
Repeatability and intermediate precision were determined as intraday precision and interday variation (n = 6) (Table 3). The obtained % RSD for feselol at 0.2–1.08; 0.42–1.27 in the intraday precision and interday variation as well as those for samarcandin at 0.26–0.55; 0.65–1.15 gave a firm indication regarding the method’s precision. The robustness is an important parameter for the method’s validation, as minute experimental-condition variations are expected to happen very frequently. We proved the developed method robustness by small changes in the mobile-phase composition (Table 4). The obtained % RSD for feselol at 0.46–0.75 and at 0.79–1.02 for samarcandin were within the acceptable range, with small change in the Rf values indicating that the developed method was robust.
The LOD and LOQ of the proposed method were found to be 12.34; 38.45 and 14.03, 56.12 ng/band for feselol and samarcandin, respectively, indicating the sensitivity of the method and ability to analyze ng quantities. The method was specific for the quantification of feselol and samarcandin as indicated from their corresponding Rf values at 0.43 ± 0.02 and 0.60 ± 0.01, respectively. The UV absorption curves of the corresponding bands at λmax 254 nm in the different extract were completely identical.
The amounts of feselol and samarcandin were estimated, applying the developed, validated green HPTLC method in five Ferula species (Table 5). The highest amount of festetol were found in F. duranii (0.813% w/w), while samarcandin was higher in F. drudeana (0.573% w/w). Our previous investigation indicated that samarcandin was more active than feselol [19]. Considering the sum of the two compounds in each of the studied species, F. drudeana was superior, with 1.375% w/w, followed by F. duranii, with 1.034% w/w. F. tenuissima showed the lowest concentration of both compounds (0.217% w/w). Based on available data, F. drudeana was expected to be the most active species as an aphrodisiac among the five studied species. However, further phytochemical and biological studies are need for this genus.
Table 5.
Contents of feselol and samarcandin in methanol extract of different species of Ferula.
5. Conclusions
The developed green HPTLC method designed for the simultaneous quantification of feselol and samarcandin was simple, accurate, reproducible, sensitive, and is applicable to the analysis of plant species or products containing these compounds. This proposed method was developed using green solvent (ethanol and water) and RP-HPTLC plates. Statistical data indicated that the new method is selective for the analysis of feselol and samarcandin with added advantages of short time, being environmentally friendly, and requiring minimal sample preparation, in addition to the low cost. Based on the analysis of the individual biologically active feselol and samarcandin, as well as the sum total of their concentration, the relative potency of the species as aphrodisiacs can be expected.
Author Contributions
Conceptualization, M.S.A.-K., M.H.A. and A.I.F.; methodology, P.A., M.A.A.S. and H.S.Y.; software, M.H.A., A.I.F. and P.A.; validation, M.H.A., A.I.F. and H.S.Y.; formal analysis, M.S.A.-K. and M.A.A.S.; investigation, M.A.A.S., M.H.A. and P.A.; resources, B.O., S.B. and H.S.Y.; data curation, M.H.A. and A.I.F.; writing—original draft preparation, M.H.A., P.A. and A.I.F.; writing—review and editing, M.S.A.-K.; visualization, M.S.A.-K. and M.H.A.; supervision, M.S.A.-K. All authors have read and agreed to the published version of the manuscript.
Funding
This research received no external funding.
Institutional Review Board Statement
Not applicable.
Informed Consent Statement
Not applicable.
Data Availability Statement
Not applicable.
Acknowledgments
This work was supported by Deanship of Scientific Research at Prince Sattam Bin Abdulaziz University.
Conflicts of Interest
The authors declare no conflict of interest.
References
- Pimenov, M.G.; Leonov, M.V. The Asian Umbelliferae Biodiversity Database (ASIUM) with particular reference to South-West Asian Taxa. Turk. J. Bot. 2004, 28, 139–145. [Google Scholar]
- Baser, B.; Sagıroglu, M.; Dogan, G.; Duman, H. Morphology of pollen in Ferula genus (Apiaceae). PhytoKeys 2021, 179, 111–128. [Google Scholar] [CrossRef]
- Chamberlain, D.F.; Rechinger, K.H. Ferula L. In Flora Iranica; Umbelliferae; Rechinger, K.H., Ed.; Akademische Druck und Verlagsanstalt: Graz, Austria, 1987; Volume 162, pp. 387–425. [Google Scholar]
- Kurzyna-Mlynik, R.; Oskolski, A.A.; Downie, S.R.; Kopacz, R.; Wojewódzka, A.; Spalik, K. Phylogenetic position of the genus Ferula (Apiaceae) and its placement in tribe Scandiceae as inferred from nr DNA ITS sequence variation. Plant Syst. Evol. 2008, 274, 47–66. [Google Scholar] [CrossRef]
- Asili, J.; Sahebkar, A.; Bazzaz, B.S.F.; Sharifi, S.; Iranshahi, M. Identification of essential oil components of Ferula badrakema fruits by GC-MS and 13C-NMR methods and evaluation of its antimicrobial activity. J. Essent. Oil Bear. Plants 2009, 12, 7–15. [Google Scholar] [CrossRef]
- Sahebkar, A.; Iranshahi, M. Volatile constituents of the Genus ferula (Apiaceae): A review. J. Essent. Oil Bear. Plants 2011, 14, 504–531. [Google Scholar] [CrossRef]
- Li, G.; Li, X.; Cao, L.; Shen, L.; Zhu, J.; Zhang, J.; Wang, J.; Zhang, L.; Si, J. Steroidal esters from Ferula sinkiangensis. Fitoterapia 2014, 97, 247–252. [Google Scholar] [CrossRef] [PubMed]
- Yang, J.; An, Z.; Li, Z.; Jing, S.; Qina, H. Sesquiterpene coumarins from the roots of Ferula sinkiangensis and Ferula teterrima. Chem. Pharm. Bull. 2006, 54, 1595–1598. [Google Scholar] [CrossRef] [PubMed]
- Yusufoglu, H.S.; Soliman, G.A.; Abdel-Rahman, R.F.; Abdel-Kader, M.S.; Genaie, M.A.; Bedir, E.; Baykan, S.; Oztürk, B. Antioxidant and Antihyperglycemic Effects of Ferula drudeana and Ferula huber-morathii in Experimental Diabetic Rats. Int. J. Pharmacol. 2015, 11, 738–748. [Google Scholar] [CrossRef]
- Yusufoglu, H.S.; Soliman, G.A.; Abdel-Rahman, R.F.; Abdel-Kader, M.S.; Ganaie, M.A.; Bedir, E.; Baykan, S.; Oztürk, B. Antihyperglycemic and Antihyperlipidemic Effects of Ferula assa-foetida and Ferula tenuissima Extracts in Diabetic Rats. Pak. J. Biol. Sci. 2015, 18, 314–323. [Google Scholar] [CrossRef][Green Version]
- Mohammadhosseini, M.; Venditti, A.; Sarker, S.D.; Nahar, L.; Akbarzadeh, A. The genus Ferula: Ethnobotany, phytochemistry and bioactivities—A review. Ind. Crops Prod. 2019, 129, 350–394. [Google Scholar] [CrossRef]
- Al-Ja’fari, A.; Vila, R.; Freixa, B.; Tomi, F.; Casanova, J.; Costa, J.; Cañigueral, S. Composition and antifungal activity of the essential oil from the rhizome and roots of Ferula hermonis. Phytochemistry 2011, 72, 1406–1413. [Google Scholar] [CrossRef] [PubMed]
- Achliya, G.S.; Wadodkar, S.G.; Dorle, A.K. Evaluation of sedative and anticonvulsant activities of Unmadnashak Ghrita. J. Ethnopharmacol. 2004, 94, 77–83. [Google Scholar] [CrossRef] [PubMed]
- Eli Lilly and Company. Lilly’s Handbook of Pharmacy and Therapeutics; Eli Lilly and Co.: Indianapolis, IN, USA, 1898. [Google Scholar]
- Elisabetsky, E.; Figueiredo, W.; Oliveria, G. Traditional Amazonian Nerve Tonics as Antidepressant Agent. J. Herbs Spices Med. Plants 1992, 1, 125–162. [Google Scholar] [CrossRef]
- Tufan, S.; Toplan, G.G.; Mat, A. Ethnobotanical usage of plants as aphrodisiac agents in Anatolian folk medicine. Marmara Pharm. J. 2018, 22, 142–151. [Google Scholar] [CrossRef]
- Iranshahy, M.; Iranshahi, M. Traditional uses, phytochemistry and pharmacology of asafetida (Ferula assa-foetida oleo-gum-resin): A review. J. Ethnopharmacol. 2011, 134, 1–10. [Google Scholar] [CrossRef]
- Maggi, F.; Cecchini, C.; Cresci, A.; Coman, M.M.; Tirillini, B.; Sagratini, G.; Papa, F. Chemical composition and antimicrobial activity of the essential oil from Ferula glauca L. (F. communis L. subsp. Glauca) growing in Marche (central Italy). Fitoterapia 2009, 80, 68–72. [Google Scholar] [CrossRef] [PubMed]
- Alqarni, M.H.; Soliman, G.A.; Salkini, M.A.; Alam, P.; Yusufoglu, H.S.; Baykan, S.; Oztürk, B.; Abdel-Kader, M.S. The potential aphrodisiac effect of Ferula drudeana korovin extracts and isolated sesquiterpene coumarins in male rats. Phcog. Mag. 2020, 16, 404–409. [Google Scholar]
- ICH. Q2 (R2): Validation of Analytical Procedures–Text and Methodology. In Proceedings of the International Conference on Harmonization (ICH), Geneva, Switzerland, 31 March 2022.
- Li, N.; Guo, T.; Zhou, D. Bioactive sesquiterpene coumarins from plants. In Studies in Natural Products Chemistry; ur-Rahman, A., Ed.; Elsevier: Amsterdam, The Netherlands, 2018; Volume 59, pp. 251–282. [Google Scholar]
- Kamoldinov, K.; Li, J.; Eshbakova, K.; Sagdullaev, S.; Xu, G.; Zhou, Y.; Li, J.; Aisa, H.A. Sesquiterpene coumarins from Ferula samarkandica Korovin and their bioactivity. Phytochemistry 2021, 187, 112705. [Google Scholar] [CrossRef] [PubMed]


Publisher’s Note: MDPI stays neutral with regard to jurisdictional claims in published maps and institutional affiliations. |
© 2022 by the authors. Licensee MDPI, Basel, Switzerland. This article is an open access article distributed under the terms and conditions of the Creative Commons Attribution (CC BY) license (https://creativecommons.org/licenses/by/4.0/).