Article

A Multi-Analytical Characterization of Mortars from Kathmandu (Nepal) Historical Monuments

1
HERCULES Laboratory, University of Évora, Palácio do Vimioso, Largo Marquês de Marialva, 8, 7000-809 Évora, Portugal
2
CIDEHUS—Centro Interdisciplinar de História, Culturas e Sociedades da Universidade de Évora, Palácio do Vimioso, Largo Marquês de Marialva, 8, 7000-809 Évora, Portugal
3
Chemistry and Biochemistry Department, School of Sciences and Technology, University of Évora, Rua Romão Ramalho 59, 7000-671 Évora, Portugal
4
Geosciences Department, School of Sciences and Technology, University of Évora, Rua Romão Ramalho 59, 7000-671 Évora, Portugal
*
Author to whom correspondence should be addressed.
Separations 2022, 9(8), 205; https://doi.org/10.3390/separations9080205
Submission received: 15 July 2022 / Revised: 30 July 2022 / Accepted: 30 July 2022 / Published: 7 August 2022

Abstract

:
The historical monuments of the ‘City of Temples’ (Kathmandu) represent an intrinsic component of Nepal’s cultural heritage. The 2015 devastating Gorkha earthquake, besides human casualties, has led to a widespread demolition or partial damage of monuments at UNESCO World Heritage Sites, including the ones in Durbar squares. This study, through an integrated material characterization of masonry binders, used in four case monuments from Hanuman Dhoka and Patan Durbar squares, intends to contribute to the knowledge of the technological know-how of the past in order to maintain as much as possible the original traditions and to provide appropriate conservation strategies. The analytical characterization of the ancient mortars was carried out by means of X-ray Diffraction (XRD), Attenuated Total Reflectance–Fourier Transform-Infrared Spectroscopy (ATR-FTIR), Thermogravimetric Analysis (TGA), petrographic analysis, X-ray Fluorescence spectroscopy (XRF) and Pyrolysis–Gas Chromatography–Mass Spectrometry (Py-GC-MS). The composition of the mortars has been determined and is in accordance with previous research in traditional materials used in the Nepalese architecture. Chromatographic techniques proved to be particularly important in the analysis of mortars with organic binders as they revealed the possible composition of the binding media, providing additional information valuable for the future conservation/restoration of the stone monuments of the ‘City of Temples’.

1. Introduction

Himalaya, the world’s highest orogenic belt counting 2.5 km in length, is formed by the continental collision between India and Asia [1,2]. Nepal is situated in its central part. Bordered by China and India, Nepal is a political unit that since the late 18th century AD is covering an area of 147,181 km2, of which around 83% is mountainous while the rest comprises low-hill regions and valleys [1,3,4,5]. Until very recently, the term ‘Nepal’ was only corresponding to the Kathmandu valley (Figure 1), a valley located in the foothills of the Himalayas, at a 1400 m altitude, in central Nepal [2,3,6,7]. Geologically, in ascending order, the basement of the valley and its surrounding hills are composed of Precambrian to Paleozoic (Devonian) formations. These units are overlain by Quaternary sediments and recent alluvium deposits [8]. On a bottom–up approach, the geological formations are: in the south the Tarebhir, Lukundol and Itaiti formation, in the center the Bagmati, Kalimati and Patan formation and in the north the Thimi and Gokarna formation (classification given by Sakai, quoted in 8). The lake and fluvial deposits, presenting a clay layer thicker than 200 m in the central part of the basin that gradually decreases to the edges, are composed by quartz, potassium feldspars, plagioclases and micas [8].
The Kathmandu valley is assumed to be the origin place of the modern state of Nepal, and nowadays, it hosts its national capital, namely Kathmandu [2,3,6,10]. The Kathmandu valley was already occupied since the later Middle Pleistocene, as it is confirmed archaeologically [11]. Nevertheless, our knowledge regarding the prehistory and the early history of the area is very limited, and it is mainly based on myths and legends [3]. In the prehistoric times, according to the geological record and to oral traditions, the valley was a huge lake [3,7]. At a later period, after the draining of the lake, the fertile soils of the plains enabled the inhabitation of this remote valley—primarily by the indigenous Newars—and the development of an outstanding civilization, which also served as the major trans-Himalayan cultural and trade hub [3,7,12]. Although the conventional history of the valley begins at least 2500 years ago [2,12], documented history starts only by the 4th century AD with the establishment of a centralized formation under the Lichhabi dynasty [2,3,10,12]. A succession of different dynasties (Thakhuri, Malla, Shahs and Ranas) was ruling the kingdom until the 20th century with the creation of the modern state of Nepal [2,3,6,7,13].
Kathmandu presents a rich history as demonstrated by its culture, traditions and architecture. Known as the ‘City of Temples’, its heritage embraces the peculiarity of Buddhism and Hinduism coexistence and complies with this fusion—along with animist rituals and Tantrism and the strong influence of the Newar cultural tradition [2,14,15,16]. Extraordinary architectural structures of exceptional typologies, such as the unique multi-tiered pagoda style, made of traditional adobe or fired brick masonry, timber frame structures and terracotta-tile covered roofs, with outstanding carved stone and wood ornamentation, were built in the urban settlements and sacred sites of the valley [2,3,14,16,17]. The vast heritage of the Kathmandu valley, inscribed in the UNESCO World Heritage list in 1979 consisting of seven monumental zones, displays a testimony to the highly developed traditional craftsmanship of brick, stone, timber and bronze of its civilization [14].
In the 16th century AD, the kingdom was divided into three independent principalities, namely Kathmandu, Patan (Lalitpur) and Bhaktapur—nowadays the three administrative districts of Nepal’s capital city [2,10,12,18]. Durbar squares, the social, religious and urban focal point of the city, built between the 12th and the 18th centuries by the ancient Malla kings of Nepal (UNESCO 2015, quoted in 2), with their palace complexes, temples and public places are three out of the seven monumental zones of World Heritage sites [2,6,14,18].
Continuous geodynamic processes and tectonic activities classify the region as high earthquake-prone [5]. In total, 92 fault lines were identified in the area of Nepal, while five of them lie in the Kathmandu valley [19]. Nepal’s outstanding architectural heritage had been extensively impacted by the devastating Gorkha earthquake in 2015, as it wrought major structural damages on the cultural places of the Kathmandu Valley and the surrounding regions [16,20,21]. More precisely, the Gorkha earthquake affected 745 monuments in 20 districts, based on the report of the Department of Archeology. It refers to 444 monuments within the Kathmandu Valley only, of which 83 monuments were totally collapsed [20]. Restoration initiatives and conservation projects, with the support of national and international agencies and governments and the involvement of the local community, have been undertaken immediately after the 2015 earthquake for the reconstruction of the monuments, where some of them are already completed [18,22,23,24]. The knowledge regarding the construction technology of the monuments and the original materials used in this process is of particular importance for the conservation and preservation of architectural heritage, as the primary aim is to maintain the historical authenticity and integrity of the cultural heritage [17,25,26,27,28]. According to the international standards and conservation principles, the conservation, reinforcement and restoration of architectural heritage requires a multi-disciplinary approach ([27]: article 1.1). A full understanding of the structural and material characteristics is required in conservation practice ([27]: article 2.3).
In this context, an investigation and integrated characterization of the binding media used in the construction of the Kathmandu valley architectural heritage is the initial step for their conservation and the most inclusive for the preservation of the technological traditions. In this study, we aim to provide a contribution for maintaining this vast heritage of such an outstanding universal value. Adopting a multi-analytical approach required for this type of research [26], we intend to determine construction patterns and to trace technological development in time. Optical microscopy (OM), X-ray Diffraction (XRD), Attenuated Total Reflectance–Fourier Transform-Infrared Spectroscopy (ATR-FTIR), Thermogravimetric Analysis (TGA), petrography, X-ray Fluorescence (XRF) and Pyrolysis–Gas Chromatography–Mass Spectrometry (Py-GC-MS) were performed to enable the characterization of the mortars used in the construction of these monuments. The studied materials are from four case monuments with different construction dates on Hanuman Dhoka (or Kathmandu) Durbar square and Patan Durbar square in the Kathmandu valley, which is a designated UNESCO World Heritage Site.

2. Materials and Methods
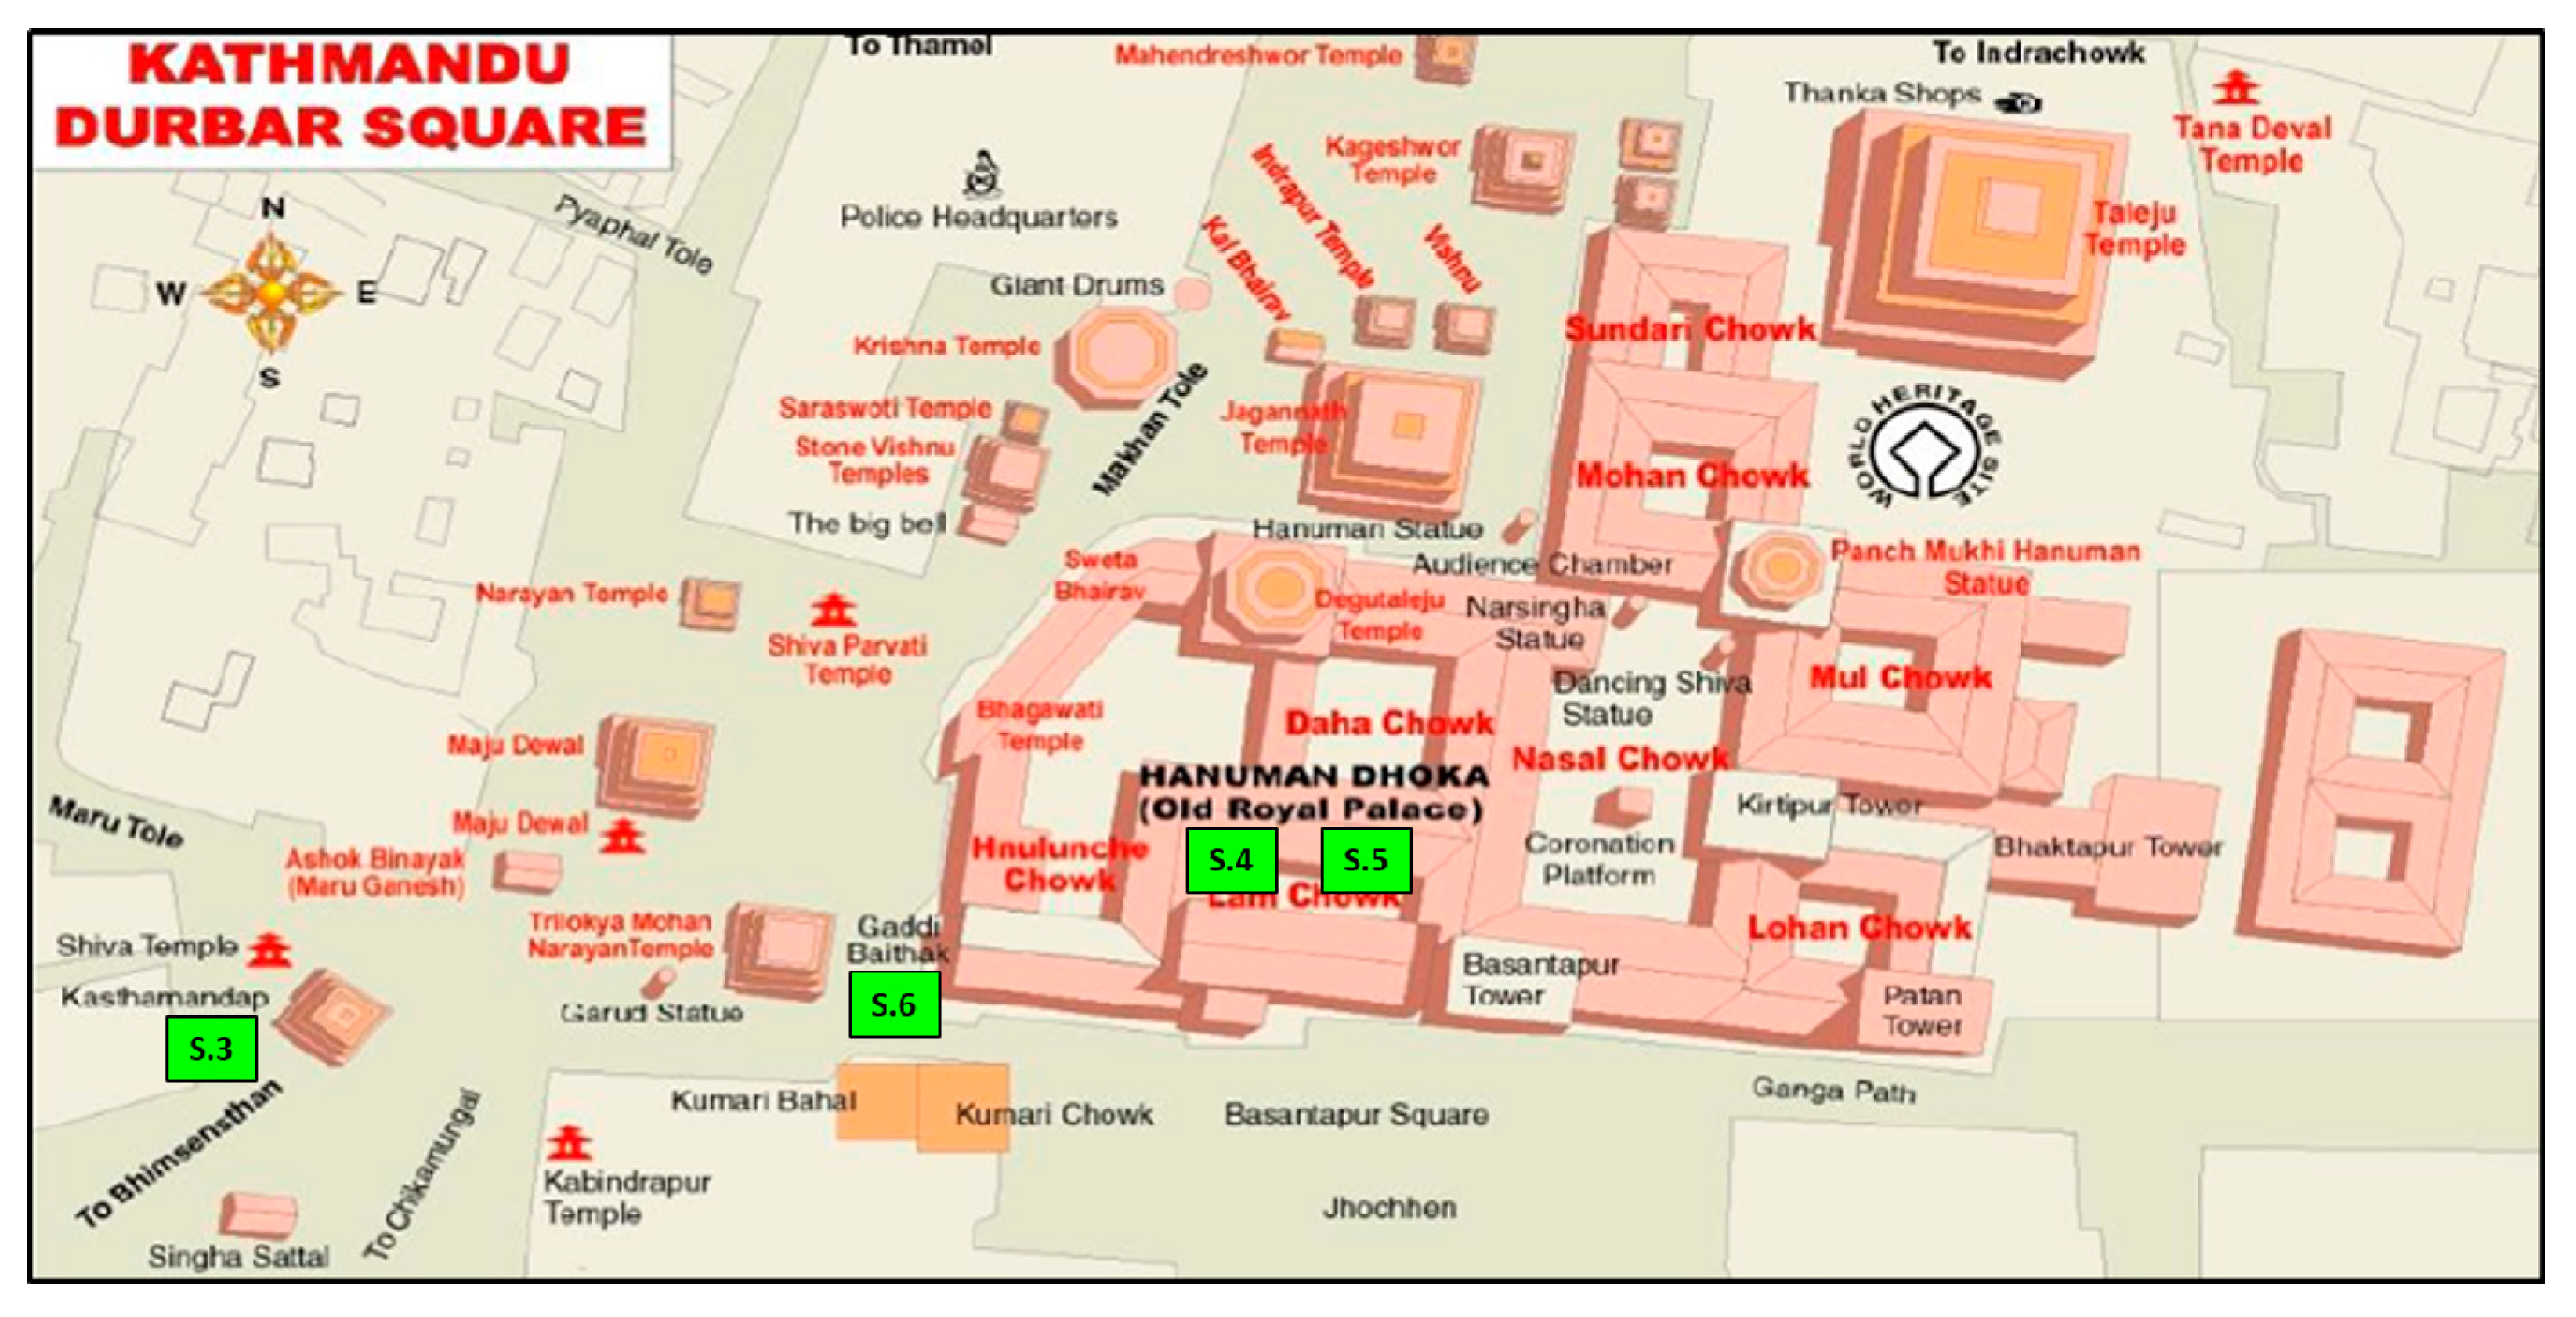
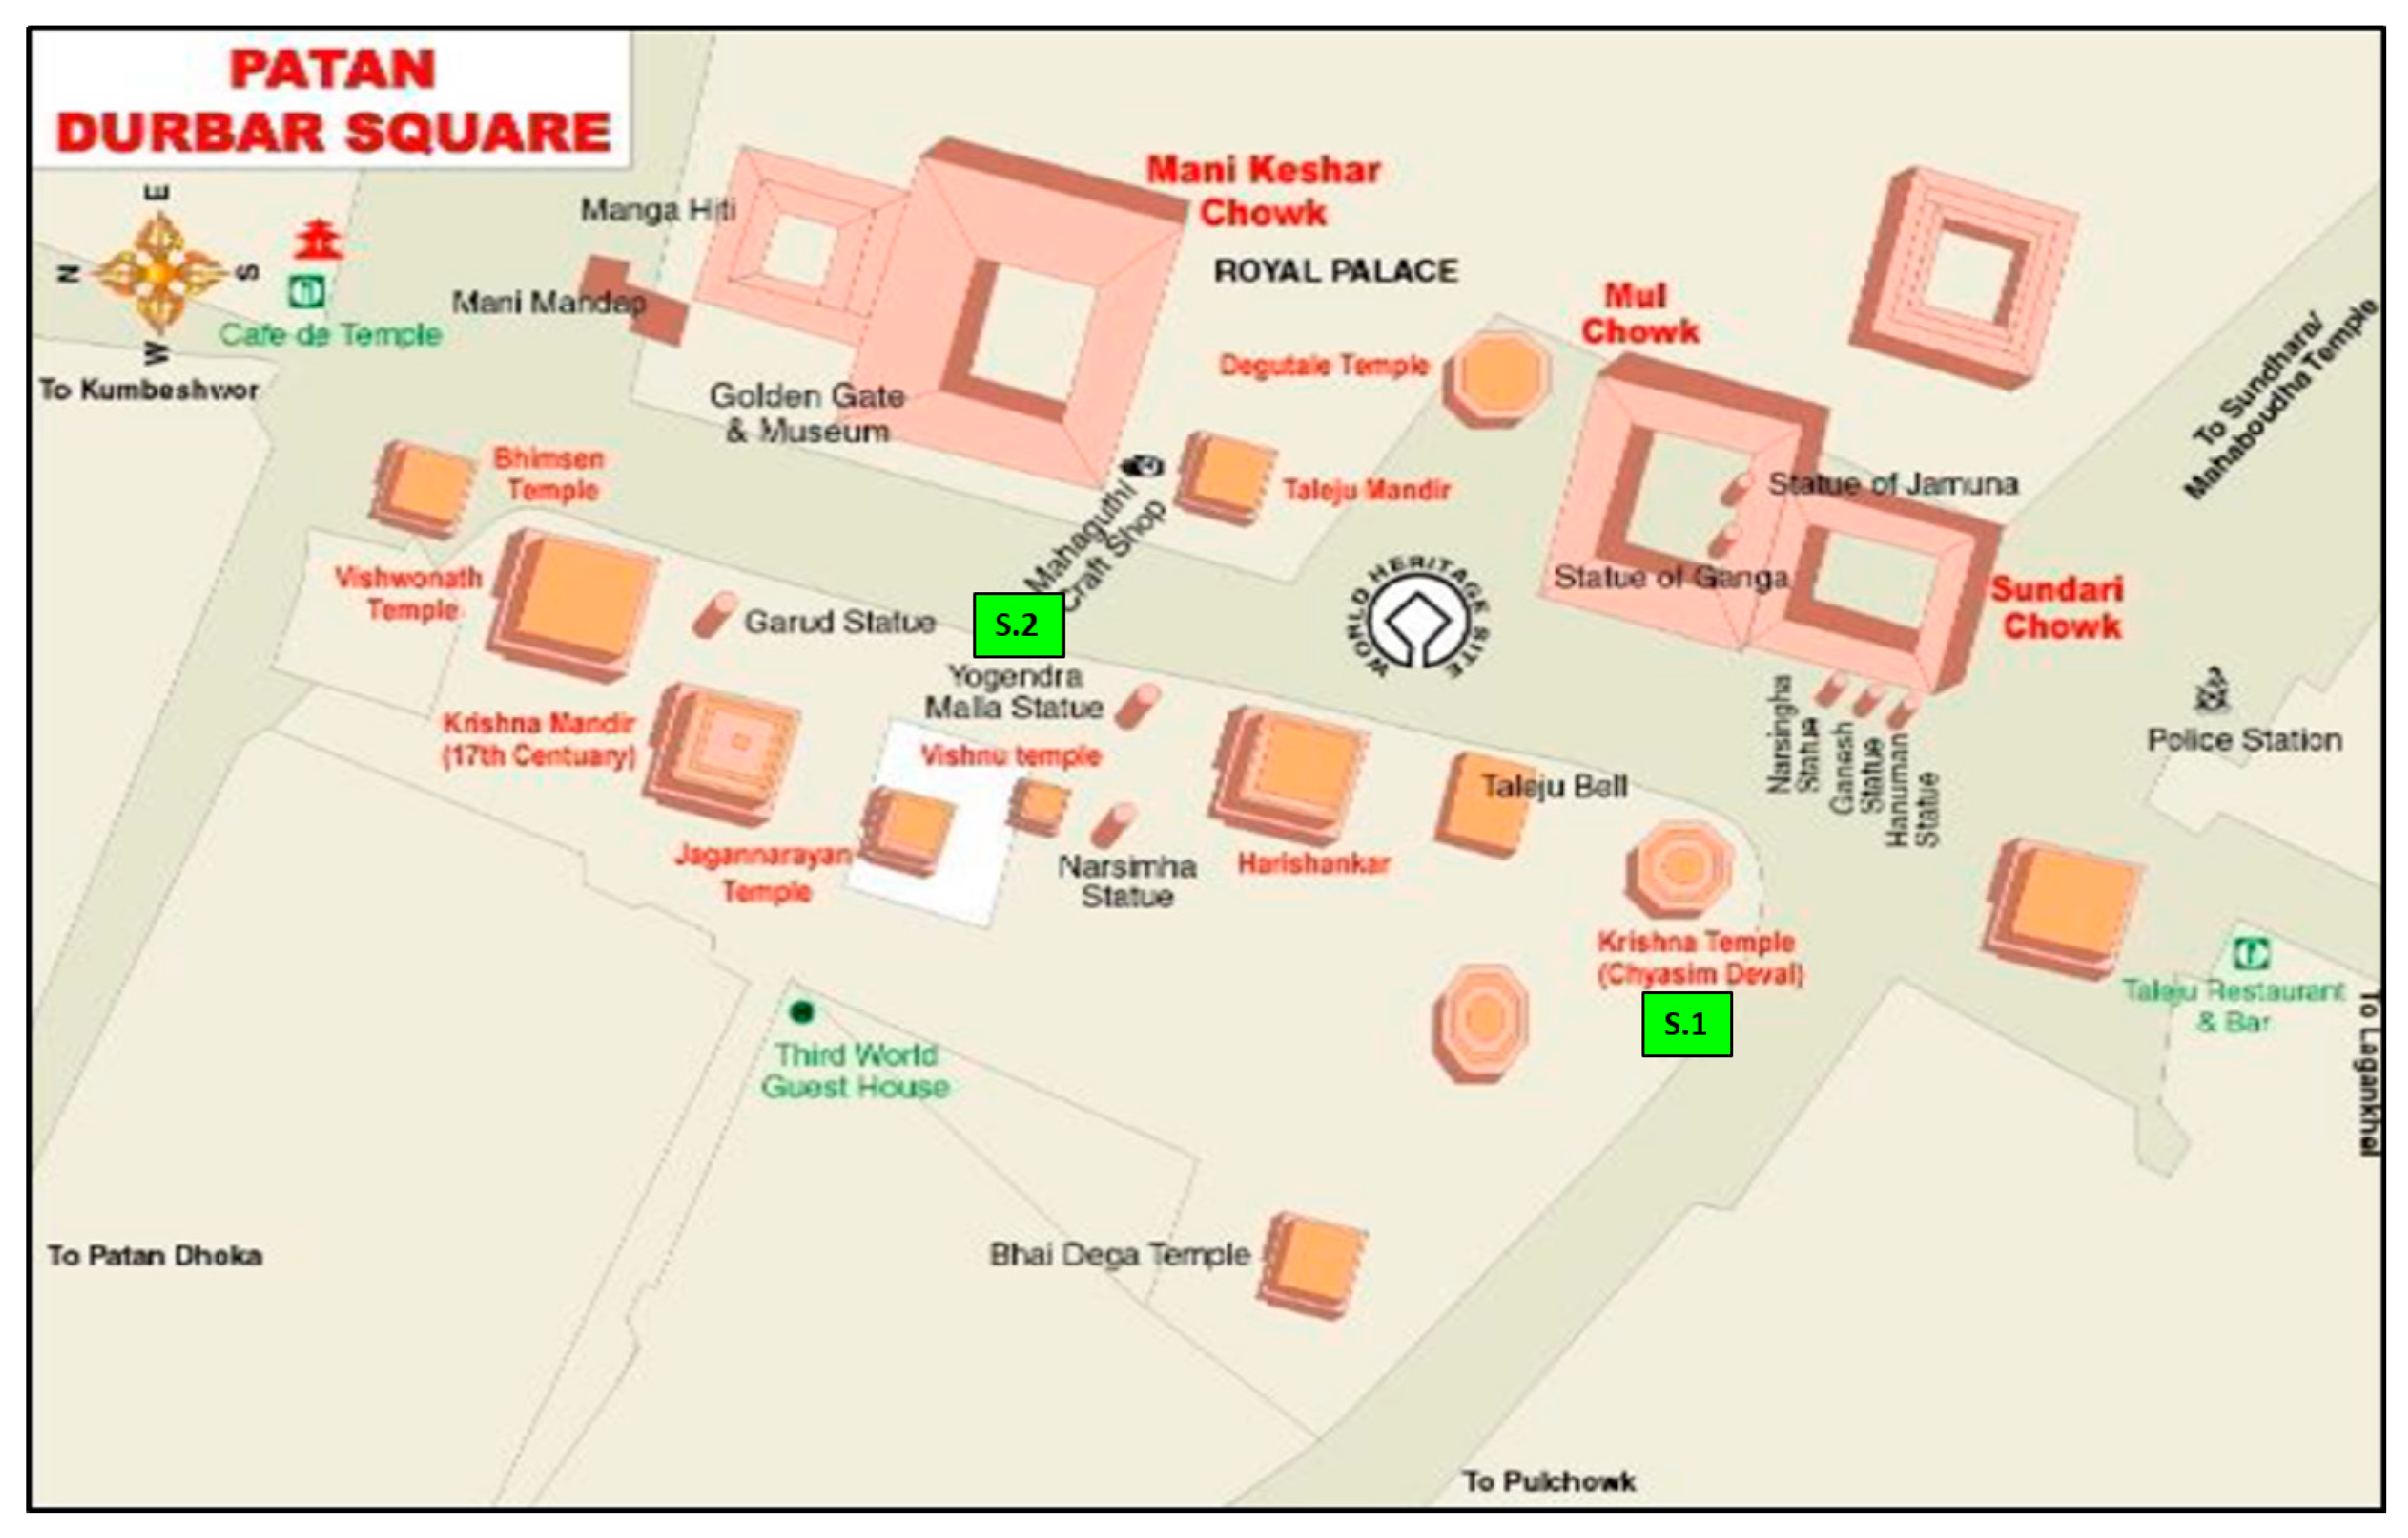
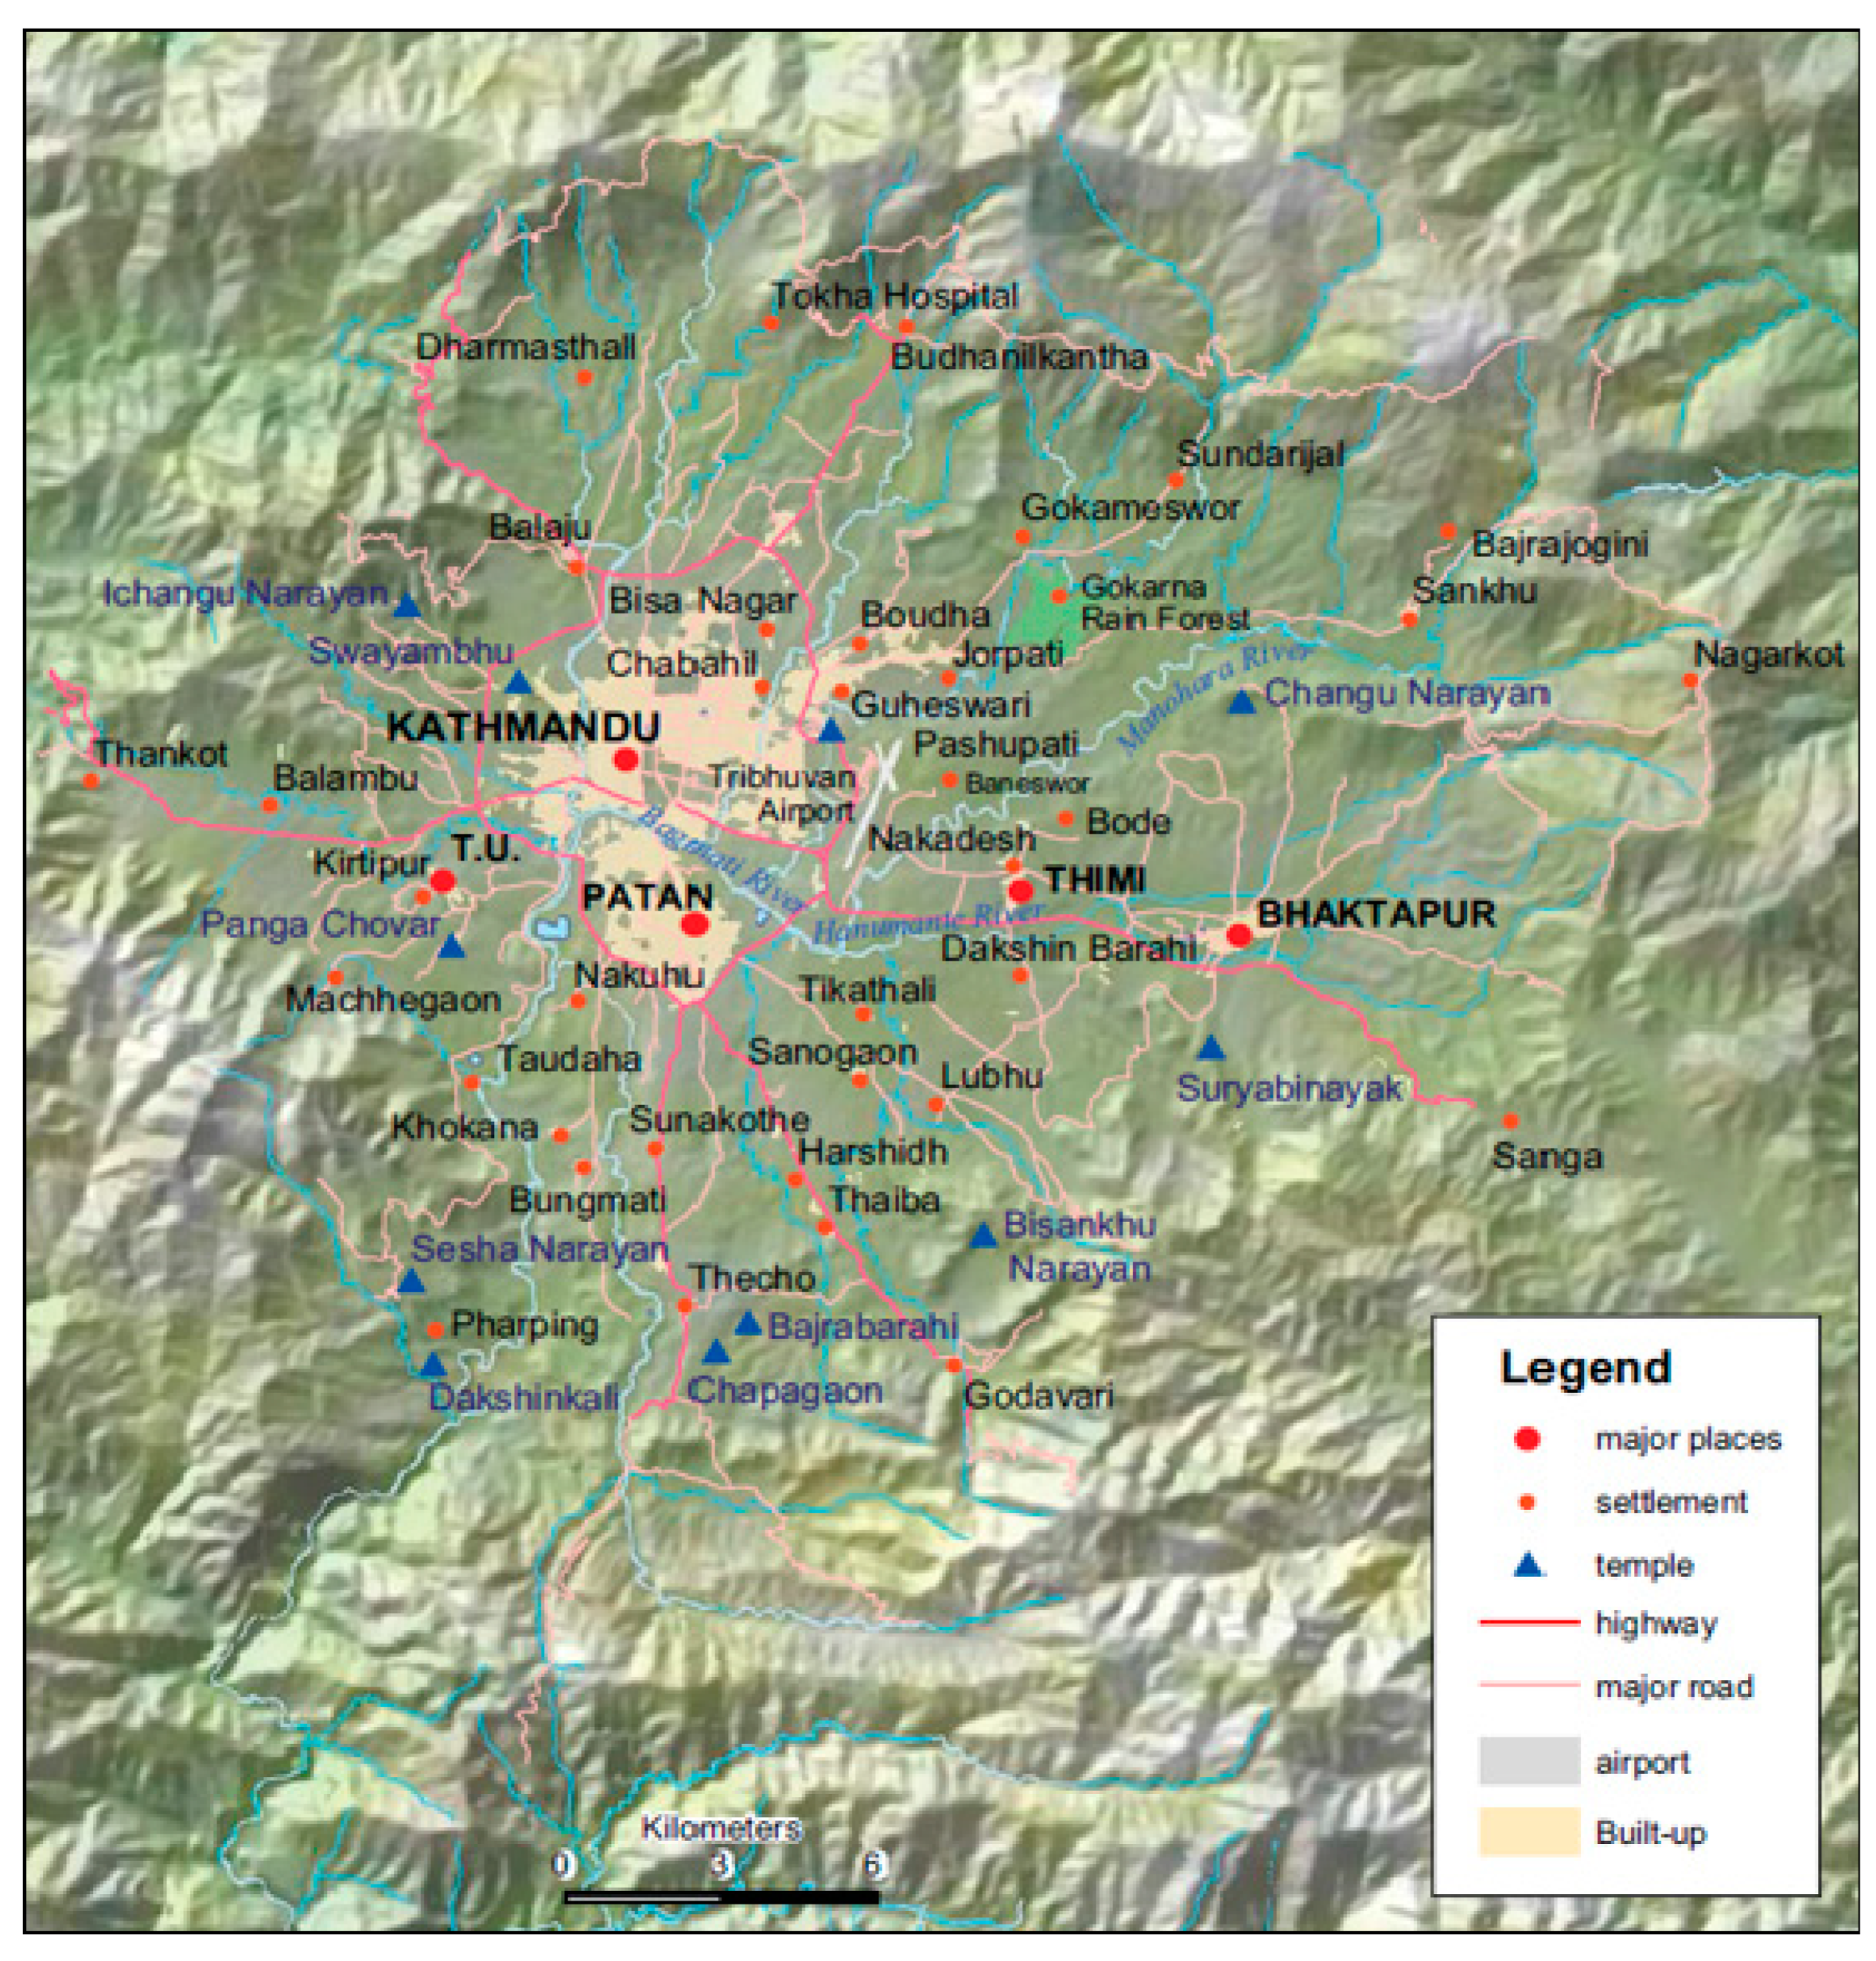
2.1. Samples

Seven mortar samples, belonging to four case monuments, were selected for this study. The mortar samples, presented in Figure 2, are from the structures of the monuments, either between the stones or the bricks (Table 1). The maps of the Durbar squares and the location of the monuments sampled are displayed in Appendix A (Figure A1 and Figure A2).
The sample S.1 is from Krishna Mandir Temple (Patan Durbar square): the inner wall of the 3rd floor. It is a three-floor building made up entirely with stone. It was built in Shikhara style (similar to pagoda style, but instead of brick, the main construction element is stone) in the 17th century AD by the King Siddhinarasimha Malla and had undergone several reconstruction interventions [2,13,29].
The sample S.2 is from the statue of Yogendra Malla (Patan Durbar square), which is placed on the top of a huge stone pillar, and it comes from between two stone components from the pillar. It was built in the 17th century AD by the King Yog Narendra Malla. It was broken into three pieces due to the 2015 earthquake and afterwards restored [2].
The sample S.3 (S.3.1 and S.3.2, collected from different points of the building) is from the Kasthamandap Temple or wood pavilion (Hanuman Dhoka Durbar square). The samples were collected from the inner part (one from the northeast corner and one from the northwest corner) of the remaining wall. It was one of the most outstanding ones in Kathmandu valley. It was restored in different timeframes, and it was completely destroyed by the 2015 earthquake. It is considered the oldest structure built in Newar style [2,6]. The first historical reference to it dates from 1143 [6], and Optically Stimulated Luminescence (OSL) measurements and radiocarbon measurements of the timbers used as architectural elements in the Temple confirmed a first phase of construction (monument foundation) in the 7th century AD and a second phase with more intense construction between the 11th and the 13th century AD [30,31].
The samples S.4, S.5 and S.6 are from different architectural structures of Hanuman Dhoka palace (Hanuman Dhoka Durbar square). The palace is composed of a complex of structures and the samples were collected from different architectural components of the complex with different construction dates. The palace was primarily founded under the Licchabi dynasty [32,33]. Nevertheless, as it stands today, it was mainly built under the Malla kings, with several additions during the Shah and Rana periods [32,33,34]. It was reconstructed several times [32]. The sample S.4 was collected from the Agamchhen monument, from its ground floor from the wall just behind the Hanuman statue. The Agamchhen monument lies on the northwestern section of the Nasal Chowk. It literally means ‘Hidden Temple’ and it defines a private place, as it was the residence of the family of the Malla rulers [34]. The sample S.5 is from the Shah Kalin-Dhukuti warehouse. Located in the Bhandarkhal Garden, the building was constructed in the 19th century AD. It was used to store the treasury of the palace during the Shah dynasty [34]. The sample S.6 is from Gaddi Baithak, from the inner wall of the first floor. It was constructed in the beginning of the 20th century AD, under the Rana kings, by the Prime Minister Chandra Shamsher [22,34]. It was built in neo-classical style, influenced by European architecture, as an addition in the Hanuman Dhoka Palace complex [22,34]. It is made up with brick masonry with lime stucco finish, where the interior lime plaster details were painted in blue, green, gold and orange [22]. The sample S.6 was subdivided, as it is composed of two layers (S.6R and S.6G).
The samples were sub-sampled and prepared according to the requirements of each analytical technique (see Appendix A).

2.2. Methodology

The characterization of the mortar samples was carried out by optical microscopy (OM), X-ray Diffraction (XRD), Attenuated Total Reflectance–Fourier Transform-Infrared Spectroscopy (ATR-FTIR), Thermogravimetric Analysis (TGA), petrographic analysis, X-ray Fluorescence spectroscopy (XRF) and Pyrolysis–Gas Chromatography–Mass Spectrometry (Py-GC-MS). XRD, ATR-FTIR, TGA and XRF analyses were performed to provide the bulk composition of the mortar samples. OM and petrographic analysis were implemented to provide compositional and textural data for the aggregates and the binder separately and Py-GC-MS was used to identify the organic nature of the binding media.
The samples were observed macroscopically and microscopically using a stereozoom microscope Leica M205C coupled with a Leica DFC 295 digital camera (software: LAS V4.8).
The mineralogical phases were identified by powder X-ray Diffraction using a Bruker D8 Discover X-ray Diffractometer with a Cu Kα source operating at 40 kV and 40 mA, and a LYNXEYE linear detector was used. The diffractograms were collected at a 2θ angular range of 3–75° with a 0.05° step size and 5 s measuring time per step (software: DIFFRAC.SUITE EVA, database: ICDD PDF-2). The semi-quantitative determination of the mineral abundance in the bulk samples was obtained by the Reference Intensity Ratio (RIR) method and is given as a percentage relative to the presumed 100% matrix of crystalline minerals
Attenuated Total Reflectance–Fourier Transform- Infrared Spectroscopy was performed using an alpha spectrometer coupled with a single-reflection diamond ATR module in order to identify the presence of organic components and further to confirm mineralogical composition from previous analysis. The spectra were acquired with a spectral resolution of 4 cm−1 and 128 scans, covering a range from 375 to 4000 cm−1 (software: OPUS/Mentor 6.5, by Bruker, Ettlingen, Germany).
Thermogravimetric analysis was performed using a NETZSCH STA 449F3 Jupiter analyzer under an inert atmosphere of nitrogen (Air Liquide Alphagaz compressed N2) with a flow rate of 70 mL/min. The heating program was set at a linear velocity with an increase of 10 °C/min starting from 40 °C and until reaching 1000 °C. The quantitative analysis in selected temperature ranges was performed by using Proteus software (by NETZSCH, Bayern, Germany).
The samples were analyzed by a Leica DM2500P polarized microscope, in the form of thin-sections, coupled with a Leica MC 170HD digital camera for images acquisition (software: LAS V4.8, by Leica, Wetzlar, Germany) for the mineralogical and textural characterization of the samples.
The major elemental composition of the samples was obtained by a Bruker S2 Puma energy-dispersive XRF (EDXRF) spectrometer equipped with a silver anode X-ray tube (software: Spectra Elements 2.0, by Bruker Karlsruhe, Germany).
In order to determine the possible organic composition of the binding media used in the mortars, samples were analyzed by Pyrolysis–Gas Chromatography–Mass Spectrometry (Py-GC-MS), which was performed as described in [35] with some adjustments. A Frontier Lab PY-3030D double-shot pyrolyzer system was used for pyrolysis. The pyrolysis interface was maintained at 280 °C. The pyrolyzer was interfaced to a Shimadzu GC2010 gas chromatographer coupled to a GCMS-QP2010 Plus Mass Spectrometer. A Phenomenex Zebron ZB-5HT capillary column (30 m length, 0.25 mm I.D., 0.50 μm film thickness) was used for the separation, with helium carrier gas set to 1.5 mL/min. The injector was set to 250 °C with 1/15 split. The GC oven temperature program was 35 °C for 1 min; then, it was ramped to 110 °C at 60 °C/min, then to 240 °C at 60 °C/min and finally to 280 °C at 6 °C/min. The ion source temperature was set at 240 °C and the interface temperature was maintained at 280 °C. The mass spectrometer was scanned from 40 to 850 m/z. Samples (<200 µg) were placed into a 50 μL stainless steel Eco cup fitted with an Eco stick, and 3 μL of a 25% methanolic solution of tetramethylammonium hydroxide (TMAH) was introduced for derivatization when required. The cup was placed into the pyrolysis interface where it was purged with helium for two minutes. Samples were pyrolyzed using a single shot method at 500 °C for 12 s. The identification of the compounds was performed using AMDIS software, NIST Library and [36].

3. Results

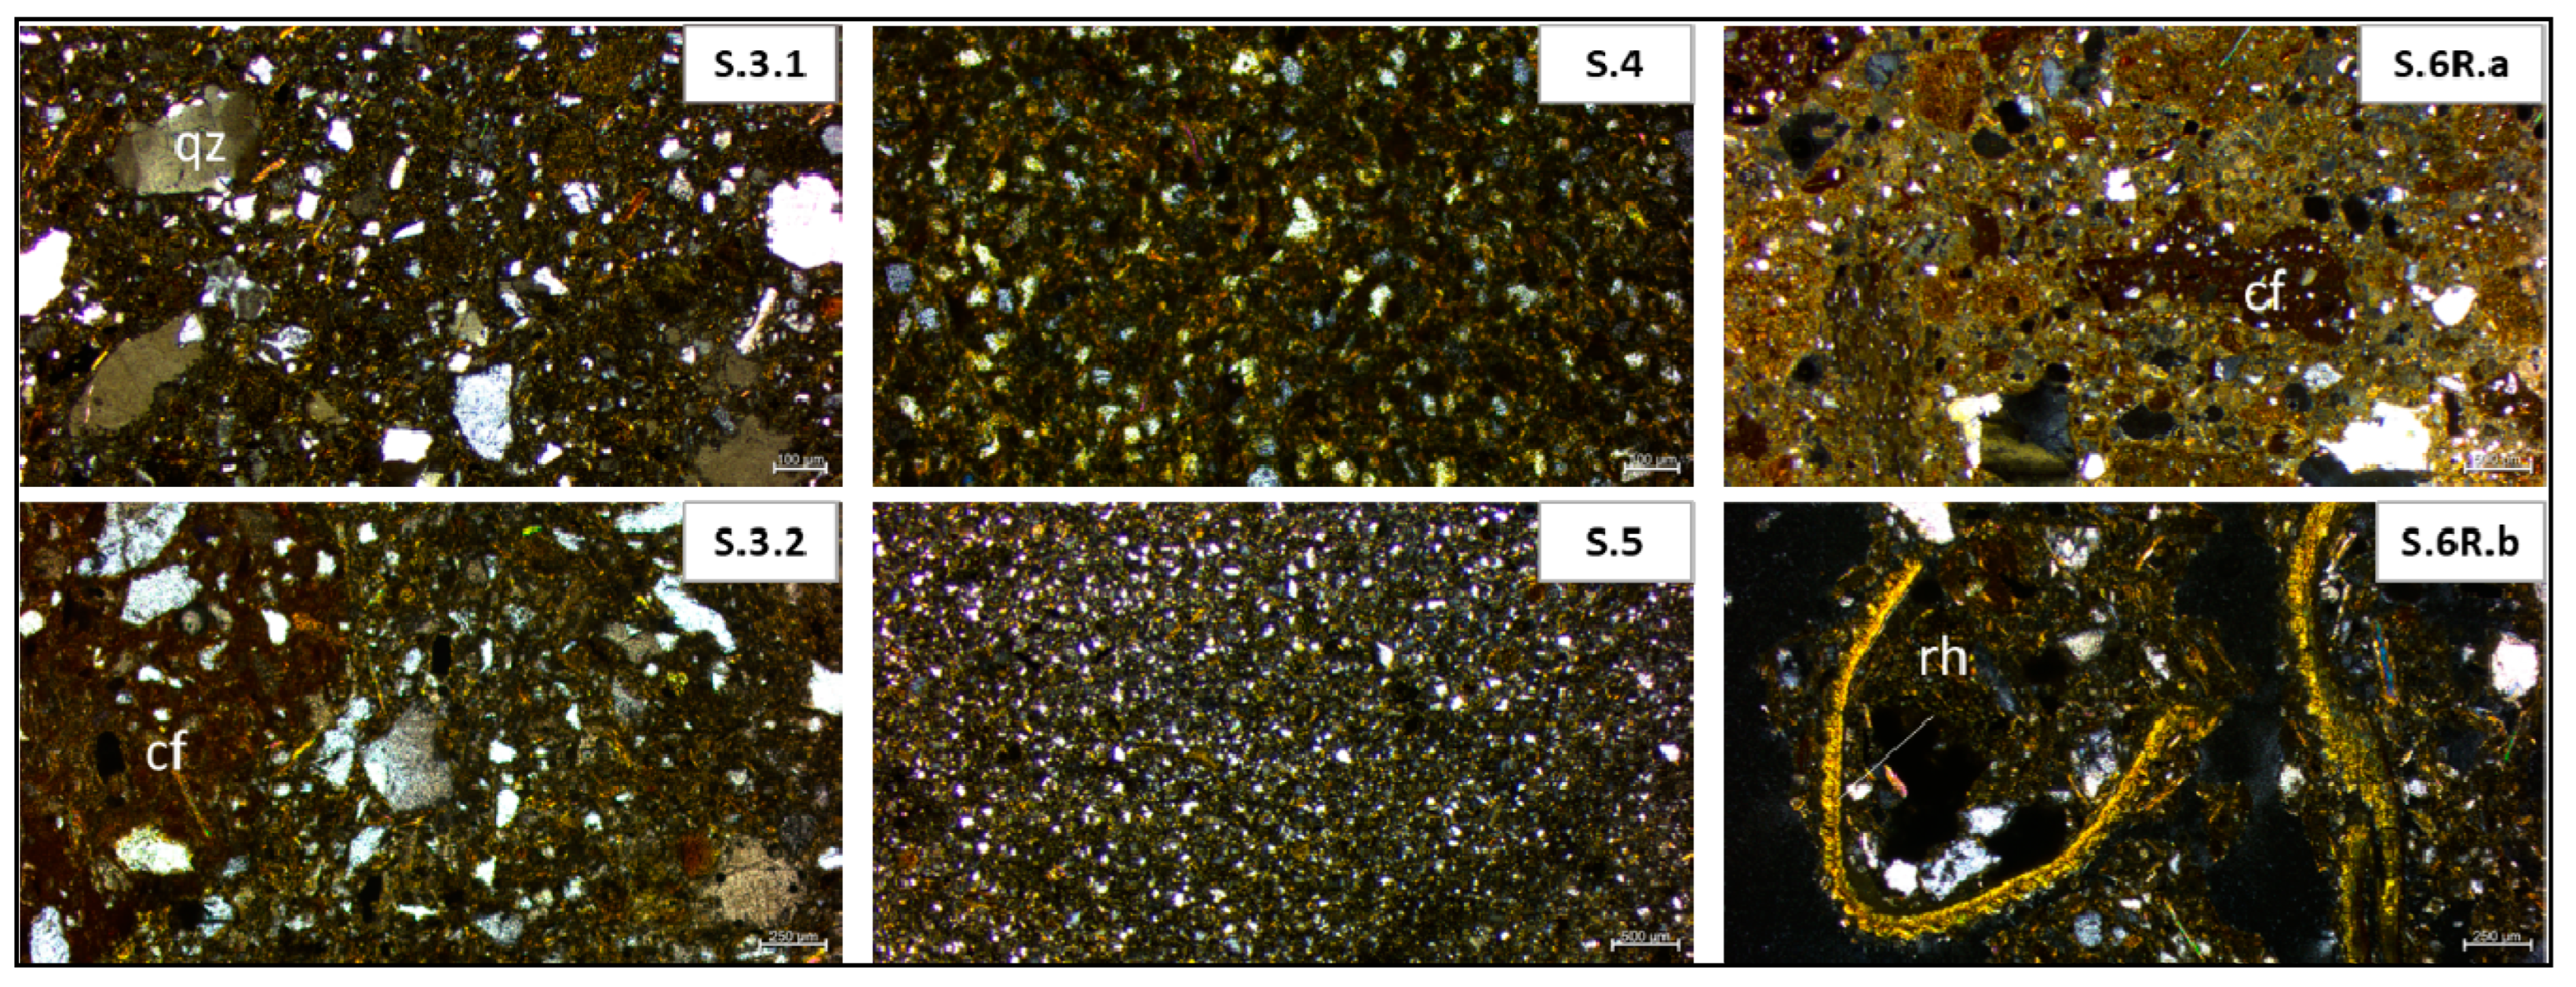
3.1. Optical Microscopy (OM)

Representative images of the polished cross-sections of the mortar samples’ global fraction under a stereozoom microscope are shown in Figure 3. Samples S1 and S2 present a glue-like texture attributed to the organic nature of the binding media. Samples S.3.1, S.3.2, S.4 and S.5 present similarities due to the high presence of micas. However, the samples S.4 and S.5 show a more fine-grain texture. Sample S.6 is composed by two layers of different size, a bigger one of reddish color with white inclusions (S.6R) and a smaller one of gray color with associated fibers (S.6G).

3.2. X-ray Diffraction (XRD)

The mineral phases present in the studied samples are displayed in Table 2. X-ray Diffraction powder patterns show that quartz and micas are the main crystalline phases of the global fraction of the mortar samples. All samples present a relative abundance of these components.
The samples S.1 and S.2 display an abundance in quartz, a high amount of micas, the presence of calcite and the characteristic bump of organic substances. Plagioclases, potassium feldspars and clay minerals are also identified in both samples. The samples S.3.1 and S.3.2 are characterized by the dominance of micas mineral phases, abundance of quartz, minor mineral phases of plagioclases, potassium feldspars and clay minerals. The sample S.3.1 presents a minor amount of gypsum. The sample S.4 shows abundance in quartz, a high amount of micas and minor crystalline phases of feldspars and clay minerals. The samples S.5 and S.6R display a relatively similar composition of quartz and micas, together with feldspars. The sample S.5 contains minor mineral phases of clay minerals. The sample S.6.R shows a specific mineralogical composition due to the absence of clay minerals and the relatively high amount of calcite. The sample S.6G is characterized by the dominance of micas mineral phase, abundance of quartz, minor mineral phases of plagioclases, potassium feldspars and clay minerals. Representative XRD patterns are presented in Figure 4.

3.3. Attenuated Τotal Reflectance–Fourier Transform-Infrared Spectroscopy (ATR-FTIR)

The ATR spectra of the powdered global fraction of the mortar samples are given in Figure 5. The ATR-FTIR results demonstrating peaks at 1030 cm1 and 920 cm1 indicate the presence of silicates in the samples S.1 and S.2 and of aluminosilicates in samples S.3.1, S.3.2, S.4, S.5 and S.6G due to the characteristic peaks at 3695 cm1 and 3620 cm1, besides the ones at 1030 cm1 and 920 cm1 [37,38,39]. Quartz (795, 777, 692 cm1) is present in all the samples. The presence of calcite is detected in the samples S.1, S.2 and S.6R by the carbonate band at around 1450–1430 cm1 [37,38,39,40]. The 2922 and 2855 cm−1 bands, attributed to hydrocarbon stretches, the 1705 cm−1 band, related to carbonyl group and the 1168 cm−1 band, attributed to carbon–oxygen vibrations, suggest the presence of organic compounds in the samples S.1 and S.2 [41,42].

3.4. Thermogravimetric Analysis (TGA)

Representative TG-DTG (thermogravimetry—TG derivative) curves of the mortar samples’ global fraction are displayed in Figure 6.
Sample S.1 presents a TG curve distinct from the other samples with one temperature range from 175 to 525 °C, where a significant weight loss occurred. This loss of weight can be attributed to the decomposition of organic compounds, which is in accordance with the results obtained by FTIR-ATR and Py-GC-MS.
Due to the high organic content of the sample S.1, after the TG analysis, its residues were glued in the crucible. As we were expecting a similar composition for the sample S.2, we decided not to analyze this sample.
The analysis of TG-DTG curves for the samples S.3.1., S.3.2, S.4, S.5 and S.6 allows us to select three temperature ranges where weight loss occurred. The weight losses at low temperatures (<120 °C) are due to dehydration of physically bound water or hygroscopic water (i.e., onto phyllosilicates), while in the temperature range from 120 to 200 °C, it can be attributed to the loss of crystallization water of any hydrated salts (e.g., gypsum) that are present in the samples. The weight losses observed in the range temperature from 200 to 600 °C are due to the loss of chemically bound water (dihydroxylation) of clay minerals [43,44,45].
For sample S.6G, is it also possible to observe a weight loss in the temperature range from 200 to 400 °C, which is probably due the presence of cellulose fibers [46]. For the sample S.6R, a significant weight loss occurs between 600 and 900 °C which corresponds to the release of carbon dioxide due to the thermal decomposition of calcite [47], which is quantified as 15.1 wt %.

3.5. Petrographic Analysis

Petrographic analysis was performed on the samples S.3.1, S.3.2, S.5 and S.6. The samples S.3.1 and S.3.2 present similar mineralogical compositions and textural features. Grains, with an angular shape, correspond to quartz, microcline, albitic plagioclases, muscovite and biotite. Granitic rock fragments with quartz and associated microcline can be observed on S.3.1. The sample S.3.2 presents inclusions of ceramic fragments. The sample S.4 is very homogeneous with fine-grained subangular quartz and micas (muscovite and biotite). The sample S.5 presents a homogenous size distribution of grains, mainly quartz grains and some plagioclases and micas. Some areas display a finer granularity. The sample S.6R displays a higher birefringence that agrees with the presence of calcitic material as a binder. Aggregates are very heterogranular with angular shapes that correspond to quartz, K-feldspar and micas. Ceramic fragments and rice husk were also encountered in this sample.
Optical microphotographs of the examined thin sections are displayed in Figure 7. Thin sections of the samples S.1 and S.2 were not prepared due to the organic nature of the material.

3.6. X-ray Fluorescence Spectroscopy (XRF)

XRF analysis was performed on the seven samples for the determination of the major elemental compositions. The SiO2-CaO diagram (Figure 8) indicates the presence of three groups. The sample S.1 and S.2 present a very low amount of silicon oxides due to the high presence of organics. The sample S.6R is enriched in calcium oxides, presenting a concentration of 11.2%. The samples S.3.1, S.3.2, S.4 and S.5 display a high concentration of silicon oxides and low concentration of calcium oxides. The sample S.6G was not analyzed by XRF due to the lack of the amount required for analysis.

3.7. Pyrolysis–Gas Chromatography–Mass Spectrometry (Py-GC-MS)

In order to determine the possible organic composition of the binding media of the two mortars, the samples S.1 and S.2 were analyzed by pyrolysis–gas chromatography–mass spectrometry (Py-GC-MS). Figure 9 and Figure 10 present the pyrograms obtained for the samples S.1 and S.2 after derivatization with TMAH.
The analysis of the pyrogram obtained for S.1 (Figure 9) allowed the identification of several protein biomarkers, namely indole and its derivatives, and several alkyl-nitriles. Indole is a protein pyrolysis by-product that indicates the presence of tryptophane, which is a characteristic amino acid of egg and casein. Alkyl-nitriles are formed upon reaction between fatty acids and amines under pyrolysis conditions and are also associated with the presence of egg [48,49,50,51]. The occurrence of different pyrole compounds in the chromatogram of the sample S.1 also indicated the presence of an animal glue [49,51], very likely fish glue. In the pyrogram displayed in Figure 9, it was also possible to identify the presence of the characteristic biomarkers of a Pinaceae resin, very probably pine, due to the detection of the oxidation products of abietic acid, which is typical of Pinaceae aged resins, and the absence of abienol. Organic markers of the yellow pigments: fustic and buckthorn and the presence of humic substances were also detected [36,52].
The data obtained for the sample S.2 (Figure 10) lead to the identification of a resin not specified, since biomarkers from Pinaceae, Elemi and Cedar oil were detected, namely the terpene compounds Beta-Amyrin, Alfa-Amyrin, Beta-Amyrin-Methyl Ether, Copaene, (-)-Calamenene, Caryophyllene and Longifolene [36,52]. The pyrogram analysis also indicated the possible presence of soot and humic substances. In this sample, the presence of protein was not confirmed, since we only detected the pyrolysis by-product of a very common amino acid, which was probably due to contaminants introduced by human sample handling.

4. Discussion

The data obtained from the different analytical techniques are compatible and complementary, where the multi-analytical approach adopted in the research proved to be particularly important [26]. The mineralogical composition of the samples is in line with the composition of the clay deposits in the region [8] and further confirms the statement that local clay, of an excellent quality as Hamilton notes (quoted in 13), was used for different purposes in the construction process of the monumental architecture in Kathmandu valley [14]. Clay, with different colors and properties, encountered in the valley was collected either from river beds or from agricultural terrains [13].
The samples S.1 and S.2, collected from two stone monuments built during the 17th century AD in Patan Durbar square, present a similar mineralogical and elemental composition, with low alumino-silicate content and a high organic content. In terms of organic materials, for the sample S.1, egg and/or casein were identified. Pinaceae aged resin, most possible pine and yellow pigments such as fustic and buckthorn were detected, and humic substances are present. The animal glue present in the sample, most likely fish glue, demonstrates a high correlation with the biomarker composition of Sturgeon Glue. Nowadays, Sturgeon Glue is mainly used for the consolidation in the restoration and in the conservation field. Traditionally, this type of glue was used as a painting medium for illuminated manuscripts, for sculpture polychromy or as a bookbinder’s glue [49,51]. For the sample S.2, a non-specified resin (Pinaceae, Elemi and Cedar oil) was identified and the possible presence of soot and humic substances was detected.
The high organic content of these two samples is attributed to a possible use of organic binders in the mortar production. A binder composition, including organic components similar to the ones identified for samples S.1 and S.2, is suggested by [13] and refers to oil, vegetal resin and red clay. These components were used for the preparation of a particular mortar, which is locally called ‘silay’ [13]. The problematic in this case is that this mixture was used to join the traditional fired bricks, also called ‘daci appa’, of the external facades of the temples and royal palaces [13,17]. Bibliographically, its use has not been encountered in the construction of stone monuments as the ones of the samples S.1 and S.2. The presence of humic substances in both samples is well correlated with the presence of peat in the lake deposits of the area and the organic matrix of the clay deposits in the center of the basin [8,20].
The samples S.3.1 and S.3.2 were selected between bricks from different areas of the same monumental structure, the Kasthamandap Temple, which was built between the 11th and 13th century AD. They present mineralogical and chemical affinity, with identified granitic minerals and a particularly high presence of micas. Differences are observed in the presence of gypsum in the sample S.3.1 and the presence of ceramic fragments in the sample S.3.2.
The samples S.4, S.5 and S.6 are collected from different structures of Hanuman Dhoka Palace (15–20th century AD) with different construction dates. The samples S.4 and S.5 show both a fine-grain texture and high micas content. The sample S.4 is collected from the Agamchhen monument, which was built in the 15–18th century AD and is more enriched in quartz. The sample S.5, collected from the Shah Kalin-Dhukuti warehouse with a construction date in the 19th century AD, is more enriched in plagioclases and clay minerals. The homogenous size distribution of the grains in the sample S.5 indicates most probably an intentional addition of aggregates and a kind of manipulation, such as crushing and/or sieving, which could suggest a chronological evolution in construction technology when correlating to the construction date of the monument.
The sample S.6 could be discriminated from the other samples, as it consists of two parts, one part the S.6R characterized by a high calcitic content and the presence of ceramic fragments and another the S.6G characterized by a fiber texture, most possibly corresponding to cellulose fibers. Husk rice was also encountered in the sample. The analytical results of the S.6 sample are in accordance with the description of [22] regarding Gaddi Baithak, who is mentioning that the entire structure is built as a load-bearing structure with brick masonry in mud mortar with intervals of lime mortar layers. Gaddi Baithak is built in neo-classical style, influenced by European interaction that was evolved only after the middle of the 19th century AD, together with the introduction of lime mortar and metal as construction elements in the Nepalese architecture [22,53,54]. The substitution of the use of mud mortar by lime mortar in the construction over time as well as the reconstruction actions could be attributed to the urbanization of the area and the inaccessibility to the local clay sources. The availability of lime in the local market could have contributed to this.
The presence of ceramic fragments in the sample S.6 is attributed to brick dust. Coarse brick powder, locally named surkhi, is commonly used as a pozzolanic component in lime mortars, combined with clay and sand, in the Nepalese architecture [13,17,54]. The addition of organic material in inorganic binders of mortars for the improvement of their properties and characteristics is well acknowledged in the history of the development of construction technology [55,56,57]. The presence of husk rice and cellulose fibers in the sample S.6 is in accordance with [13] research regarding the traditional materials and construction technologies used in the Kathmandu Valley. Several organic additives used, such as molasses (otherwise called black treacle), black lentil (or black pulse or black gram), ‘saldhup’—a resinous oil from the ‘Sal’ tree, fenugreek (encountered under the name ‘methi’ in bibliography), egg white, blood, and sticky-rice are documented [13,54]. The addition of organic fibers particularly, such as animal hair, hemp or jute fibers, as an additive in the preparation of the lime mortar is highlighted by other studies in the area [13,54]. The use of organic fibers, for the reinforcement of a calcitic mortar, is also elsewhere acknowledged [57,58], and sticky rice-lime mortar technology was extensively used in ancient construction in China [43].

5. Conclusions

Mortars have been extensively used worldwide as the binding media of masonry for thousands of years. The analytical study, applied on the mortars from the monuments of the UNESCO sites in Kathmandu valley, is an important step to enhance our knowledge regarding the past technological traditions in the area, as only few studies of this type have been executed so far. The composition of the mortars used in the monuments from Hanuman Dhoka and Patan Durbar squares were identified. Our results are in line with the historical data and the oral traditions from the local people for the mortars with inorganic binder. A change in the material use is observed over time by the replacement of the mud mortar with lime mortar.
The obtained data for the mortars with organic binding media used in the stone monuments provide new insights into the construction technology applied. Their composition is only recorded up to now in filler mortars used for brick monumental structures.
The rarity of comparative studies in the region and the small sample size of the present study set some kind of limitations in the raw data interpretation. Nevertheless, this study intends to provide a contribution into the existing dataset, by enlarging its size and thus enabling future comparative research that will strengthen or contract the above discussion and conclusions. Moreover, through the addition of chromatographic techniques into the analytical protocol for mortar characterization, we aim to prove the importance of organic components identification, which are present in the mortars either as additives or binding media.

Author Contributions

Conceptualization, A.T., M.M., A.C., C.G. and P.M.; methodology, A.T., D.T., C.G. and P.M.; validation, D.T., C.G. and P.M.; investigation, A.T., D.T., C.G. and P.M.; resources, M.M. and A.C.; writing—original draft preparation, A.T. and D.T.; writing—review and editing, A.T., M.M., D.T., C.G. and P.M.; visualization, A.T. and D.T.; supervision, C.G. and P.M.; funding acquisition, A.C. All authors have read and agreed to the published version of the manuscript.

Funding

This research was financially supported by the Portuguese Foundation for Science and Technology under the projects HERCULES Laboratory (UIDP/04449/2020 and UIDB/04449/2020).

Institutional Review Board Statement

Not applicable.

Informed Consent Statement

Not applicable.

Data Availability Statement

The materials used and the details on the methodology followed during the research as well the datasets produced during the analysis are available from the corresponding author on reasonable request.

Acknowledgments

We wish to thank Rohit Ranjitkar, Program Director of the Kathmandu Valley Preservation Trust (KVPT) for providing sample S.2 from Patan Durbar Square and Alina Tamrakar for her help collecting the mortar samples from Kathmandu Durbar Square. We are grateful to Michael Shilling from the Getty Institute in Los Angeles for kindly providing us with the ESCAPE ExcelÒ Application for the identification of compounds in Py-GC-MS.

Conflicts of Interest

The authors declare no conflict of interest.

Appendix A. Sample Preparation

For the preparation of the thin sections, used for the petrographic analysis, the samples were sub-sampled, and a part of each sample was embedded in epoxy resin (7:1) (Epofix Fix, Struers A/S, Ballerup, Denmark; 24 h hardening time) to prepare a cross-section. The cross-sections were then polished using sandpapers of different grain sizes (Struers, SiC, FEPA P # 320, 500, 800, 1200, 2000 and 4000, where 4000 is 5 μm). Afterwards, the polished cross-sections were glued on a glass with Araldite (1:1) (2 h hardening time with pressure). A saw (Discoplan TS Struers) was used to cut and separate the cross-section from the glass at a distance of around 1.7 cm from the glass. The samples were ground smooth by the saw until the sample is almost transparent. As a final step, the thin sections were polished using sandpapers of different grain sizes (Struers, SiC, FEPA P # 320, 500, 800, 1200, 2000 and 4000, where 4000 is 5 μm) until they reach around 30 μm in order to allow mineral identification.
For the powder preparation, the samples were sub-sampled and were ground up with an agate mortar and pestle. Between each sample preparation, the mortar and the pestle were cleaned with nitric acid diluted at 6.5% (HNO3) (65.0%, suprapur grade, Merck) to avoid any contamination.
For the preparation of the glass disks, used in XRF analysis, 1.2 g of each powdered sample was mixed with 12 g of flux and then fused in 1065 °C, which enabled its casting into a glass disk. The fusion was implemented by using a Claisse Fluxer® LeNeoTM fusion instrument.
For the preparation of oriented aggregate mounts, for the identification of clay minerals, the ground sample is mixed with distilled water, and after settling for fifteen seconds, the material is extracted by using a pipette and applied on a glass substrate, enabling the clay minerals to lie flat. This procedure was performed in duplicate. Then, the oriented specimens were left overnight in room temperature in order for them to dry and the water to evaporate. XRD analysis was performed as they were not treated. Then, the samples were subjected into standard treatments: (1) glycolation with ethylene glycol, where the oriented aggregate mounts were placed on the shelf of desiccators with ethylene glycol in its base and in the oven in 60 °C for 12 h. The process was followed by an XRD analysis; (2) heating to 400 °C before heating to 550 °C. The heating treatments were applied on the other glass substrates, the oriented specimens were placed in the oven at increasing temperature for fifteen minutes and at 400 °C for thirty minutes; then, XRD analysis was performed. The procedure was repeated at 550 °C and was followed again by XRD analysis.
Figure A1. Layout of the Hanuman Dhoka Durbar square [2]. Location of monuments sampled indicated.
Separations 09 00205 g0a1
Figure A2. Layout of the Patan Durbar square [2]. Location of monuments sampled indicated.
Separations 09 00205 g0a2

References

  1. Ojha, T.P. Magnetostratigraphy, Topography and Geology of the Nepal Himalaya: A GIS and Paleomagnetic Approach. Ph.D. Thesis, The University of Arizona, Tucson, AZ, USA, 2009. [Google Scholar]
  2. Devkota, B.P. Revival from Rubble: Community Resilience at UNESCO World Heritage Sites in Kathmandu after 2015 Earthquake; Repository; University of Waterloo’s Institutional Repository: Waterloo, ON, Canada, 2016. [Google Scholar]
  3. Hutt, M. Nepal: A Guide to the Art and Architecture of the Kathmandu Valley; Adroit Publishers: Delhi, India, 2010. [Google Scholar]
  4. Kaphle, K.P. Mineral Resources of Nepal and Their Present Status. 2020. Available online: https://ngs.org.np/mineral-resources-of-nepal-and-their-present-status/ (accessed on 28 January 2022).
  5. mindat.org. Nepal. 2022. Available online: https://www.mindat.org/loc-20766.html (accessed on 28 January 2022).
  6. Hutt, M. The History of Kathmandu Valley, as Told by Its Architecture. 2015. Available online: https://theconversation.com/the-history-of-kathmandu-valley-as-told-by-its-architecture-41103 (accessed on 22 January 2022).
  7. Gellner, D.N.; Letizia, C. Hinduism in the Secular Republic of Nepal. In The Oxford History of Hinduism: Modern Hinduism; Brekke, T., Ed.; University Press: Oxford, UK, 2019; pp. 275–304. [Google Scholar]
  8. Sapkota, A. Hydrogeological Study of Nagdhunga Tunnel Site, Thankot, Kathmandu, Nepal. Master’s Thesis, Tribhuvan University, Kirtipur, Nepal, 2016. [Google Scholar] [CrossRef]
  9. Digital Himalaya. Himalayan Maps Collection. 2021. Available online: https://www.digitalhimalaya.com/collections/maps/ (accessed on 23 January 2022).
  10. Gellner, D.N. The Idea of Nepal; Social Science Baha: Kathmandu, Nepal, 2016. [Google Scholar]
  11. Corvinus, G. The prehistory of Nepal after 10 years of research. Bull. Indo-Pac. Prehistory Assoc. 1996, 14, 43–55. [Google Scholar] [CrossRef]
  12. Rose, L.E.; History of Nepal. Encyclopedia Britannica. (Updated). 2015. Available online: https://www.britannica.com/place/Nepal/History (accessed on 24 January 2022).
  13. Bonapace, C.; Sestini, V. Traditional Materials and Construction Technologies Used in the Kathmandu Valley; UNESCO: Paris, France, 2003. [Google Scholar]
  14. UNESCO. Kathmandu Valley. 2022. Available online: https://whc.unesco.org/en/list/121/ (accessed on 22 January 2022).
  15. Slusser, M.S. Nepal Mandala: A Cultural Study of the Kathmandu Valley; Mandala Book Point: Kathmandu, Nepal, 1998. [Google Scholar]
  16. World Monuments Fund. Cultural Heritage Sites of Nepal. 2019. Available online: https://www.wmf.org/project/cultural-heritage-sites-nepal (accessed on 18 January 2022).
  17. Nepal Government. Kathmandu Valley World Heritage Site: Integrated Management Framework; KAT/2007/PI/H/3; Department of Archaeology, Ministry of Culture, Tourism and Civil Aviation: Kathmandu, Nepal, 2007.
  18. World Monuments Fund. Durbar Square. 2015. Available online: https://www.wmf.org/project/durbar-square (accessed on 18 January 2022).
  19. Bothara, J.K.; Guragain, R. Facing the earthquake. Spaces 2005, 3, 82–85. [Google Scholar]
  20. Apil, K.C.; Sharma, K.; Pokharel, B. Performance of Heritage Structures during the Nepal Earthquake of 25 April 2015. J. Earthq. Eng. 2019, 23, 1346–1384. [Google Scholar] [CrossRef]
  21. UNESCO. Culture. 2021. Available online: https://en.unesco.org/node/317579 (accessed on 17 January 2022).
  22. Joshi, A. Gaddi Baithak: Continued glory of the legacy built by Chandra Shamsher. Spaces 2018, 3, 26–36. Available online: https://issuu.com/spacesnepal5/docs/spaces_august_2018 (accessed on 31 January 2022).
  23. Durham University. Post-Earthquake Rescue Archaeology in Kathmandu. 2021. Available online: https://www.durham.ac.uk/departments/academic/archaeology/research/archaeology-research-projects/post-earthquake-kathmandu/ (accessed on 30 January 2022).
  24. Pradhan, A.R. Hanuman Dhoka Palace: 7 Years Later. Nepal News. 2022. Available online: https://nepalnews.com/s/nation/hanuman-dhoka-palace-7-years-later (accessed on 25 February 2022).
  25. ICOMOS. Principles for the Preservation of Historic Timber Structures; ICOMOS: Paris, France, 1999. [Google Scholar]
  26. Middendorf, B.; Hughes, J.J.; Callebaut, K.; Baronio, G.; Papayianni, I. Investigative methods for the characterisation of historic mortars—Part 1: Mineralogical characterisation. Mater. Struct. 2005, 38, 761–769. [Google Scholar] [CrossRef]
  27. ICOMOS. ICOMOS CHARTER—Principles for the Analysis, Conservation and Structural Restoration of Architectural Heritage; ICOMOS: Paris, France, 2003. [Google Scholar]
  28. ICOMOS. International Charter for the Conservation and Restoration of Monuments and Sites (THE VENICE CHARTER 1964); ICOMOS: Paris, France, 1965. [Google Scholar]
  29. Gutshow, N. Architecture of the Newars: A History of Building Typologies and Details in Nepal; 1; Serindia Publications: Chicago, IL, USA, 2011. [Google Scholar]
  30. Coningham, R.; Acharya, K.P.; Davis, C.; Kunwar, R.B.; Simpson, I.; Joshi, A.; Weise, K. Resilience within the Rubble: Reconstructing the Kasthamandap and Its Past after the 2015 Gorkha Earthquake. Spaces 2018, 10, 40–49. Available online: https://issuu.com/spacesnepal5/docs/spaces_march_2018-ilovepdf-compress (accessed on 30 January 2022).
  31. Kinnaird, T.C.; Simpson, I.A. Geochronologies from the Kathmandu Valley UNESCO World Heritage Site: Optically Stimulated Luminescence measurement of monument foundation sediments and radiocarbon measurement of timbers. In Geoarchaeological Assessment of Post-Earthquake Kasthamandap Working Papers; 3; Biological and Environmental Sciences; University of St Andrews: St Andrews, UK, 2019; Available online: https://dspace.stir.ac.uk/bitstream/1893/29859/1/ChronologyReport_KinnairdSimpson18.pdf (accessed on 29 January 2022).
  32. Prajapati, R. Hanuman Dhoka Durbar Square Conservation Program. Available online: https://backtokathmandu.tripod.com/hdrp.html (accessed on 25 February 2022).
  33. Sanday, J. The Hanuman Dhoka Royal Palace Kathmandu Building Conservation and Local Traditional Crafts; AARP: London, UK, 1974. [Google Scholar]
  34. Nepal Government. Hanumandhoka Durbar and Durbar Square: A UNESCO World Heritage Monument Zone. 2021. Available online: https://hanumandhoka.gov.np/index.html (accessed on 25 February 2022).
  35. Manhita, A.; Martins, S.; Dias, C.B.; Cardoso, A.; Candeias, A.; Gil, M. An unusual mural paintings at the charola of the convent of Tomar: Red lakes and organic binders. Color Res. Appl. 2016, 41, 258–262. [Google Scholar] [CrossRef]
  36. Schilling, M.R.; Heginbotham, A.; van Keulen, H.; Szelewski, M. Beyond the basics: A systematic approach for comprehensive analysis of organic materials in Asian lacquers. Stud. Conserv. 2016, 61 (Suppl. S3), 3–27. [Google Scholar] [CrossRef] [Green Version]
  37. Asensio, R.C.; San Andres Moya, M.; de la Roja, J.M.; Gomez, M. Analytical characterization of polymers used in conservation and restoration by ATR-FTIR spectroscopy. Anal. Bioanal. Chem. 2009, 395, 2081–2096. [Google Scholar] [CrossRef]
  38. Chukanov, N.V. Infrared Spectra of Mineral Species; Springer: New York, NY, USA, 2014; Volume 1. [Google Scholar]
  39. Chukanov, N.V.; Chervonnyi, A.D. Infrared Spectra of Minerals and Related Compounds; Springer: New York, NY, USA, 2016. [Google Scholar]
  40. Bruckman, V.J.; Wriessnig, K. Improved soil carbonate determination by FT-IR and X-ray analysis. Environ. Chem. Lett. 2013, 11, 65–70. [Google Scholar] [CrossRef] [Green Version]
  41. Derrick, M.R.; Stulik, D.; Landry, J.M. Infrared Spectroscopy in Conservation Science; Getty Publications: Los Angeles, CA, USA, 2000; p. 235. [Google Scholar]
  42. Barth, A. Infrared spectroscopy of proteins. Biochim. Biophys. Acta 2007, 1767, 1073–1101. [Google Scholar] [CrossRef] [PubMed] [Green Version]
  43. Yang, F.; Zhang, B.; Ma, Q. Study of Sticky Rice-Lime Mortar Technology for the Restoration of Historical Masonry Construction. Acc. Chem. Res. 2010, 43, 936–944. [Google Scholar] [CrossRef] [PubMed]
  44. Borsoi, G.; Santos Silva, A.; Candeias, A.; Mirão, J. Analytical characterization of ancient mortars from the archaeological roman site of Pisões (Beja, Portugal). Constr. Build. Mater. 2019, 204, 597–608. [Google Scholar] [CrossRef] [Green Version]
  45. Cardoso, I.; Macedo, M.F.; Vermeulen, F.; Corsi, C.; Santos Silva, A.; Rosado, L.; Candeias, A.; Mirão, J. A Multidisciplinary Approach to the Study of Archaeological Mortars from the Town of Ammaia in the Roman Province of Lusitania (Portugal). Archaeometry 2014, 56, 1–24. [Google Scholar] [CrossRef] [Green Version]
  46. Poletto, M.; Pistor, V.; Sanatana, R.M.C.; Zattera, A.J. Materials Produced from Plant Biomass. Part II: Evaluation of Crystallinity. Mater. Res. 2012, 15, 421–427. [Google Scholar] [CrossRef] [Green Version]
  47. Földvári, M. Handbook of the Thermogravimetric System of Minerals and Its Use in Geological Practice; Central European Geology; Geological Institute of Hungary: Budapest, Hungary, 2011; Volume 213. [Google Scholar]
  48. van der Werf, I.D.; Gnisci, R.; Marano, D.; de Benedetto, G.E.; Laviano, R.; Pellerano, D.; Vona, F.; Pellegrino, F.; Andriani, E.; Catalano, I.M.; et al. San Francesco d’Assisi (Apulia, South Italy): Study of a manipulated 13th century panel painting by complementary diagnostic techniques. J. Cult. Herit. 2008, 9, 162–172. [Google Scholar] [CrossRef]
  49. Bonaduce, I.; Andreotti, A. Py-GC/MS of Organic Paint Binders. In Organic Mass Spectrometry in Art and Archaeology; Colombini, M.P., Modugno, F., Eds.; Wiley: Chichester, UK, 2009; pp. 303–326. [Google Scholar]
  50. Chiavari, G.; Galletti, G.C.; Lanterna, G.; Mazzeo, R. The potential of pyrolysis gas chromatography mass spectrometry in the recognition of ancient painting media. J. Anal. Appl. Pyrol. 1993, 24, 227–242. [Google Scholar] [CrossRef]
  51. Carbini, M.; Stevanato, R.; Rovea, M.; Traldi, P.; Favretto, D. Curie-point pyrolysis-gas chromatography/mass spectrometry in the art field. 2. The characterization of proteinaceous binders. Rapid Commun. Mass Spectrom. 1996, 10, 1240–1242. [Google Scholar] [CrossRef]
  52. Modugno, F.; Ribechini, E. GC/MS in the Characterization of Resinous Materials. In Organic Mass Spectrometry in Art and Archaeology; Colombini, M.P., Modugno, F., Eds.; Wiley: Chichester, UK, 2009; pp. 215–235. [Google Scholar]
  53. Sanday, J. Traditional crafts and modern conservation methods in Nepal. In Appropriate Technologies’ in the Conservation of the Cultural Property. Protection of the Cultural Heritage, Technical Handbooks for Museums and Monuments, 7th ed.; The UNESCO Press: Paris, France, 1981; pp. 9–49. [Google Scholar]
  54. Shrestha, R.; Koju, S.; Shrestha, R. Performance of Lime Mortar in Reconstruction of Monuments of Bhaktapur. In Proceedings of the 2nd International Conference on Earthquake Engineering and Post Disaster Reconstruction Planning, Bhaktapur, Nepal, 25–27 April 2019; pp. 185–188. [Google Scholar]
  55. Yang, F.; Zhang, B.; Pan, C.; Zeng, Y. Traditional mortar represented by sticky rice lime mortar—One of the great inventions in ancient China. Sci. China Ser. E Technol. Sci. 2009, 52, 1641–1647. [Google Scholar] [CrossRef]
  56. Fang, S.Q.; Zhang, H.; Zhang, B.J.; Zheng, Y. The identification of organic additives in traditional lime mortar. J. Cult. Herit. 2014, 15, 144–150. [Google Scholar] [CrossRef]
  57. Snow, J.; Torney, C. Short Guide: Lime Mortars in Traditional Buildings; Historic Scotland: Edinburgh, UK, 2014. [Google Scholar]
  58. Moropoulou, A.; Bakolas, A.; Bisbikou, K. Investigation of the technology of historic mortars. J. Cult. Herit. 2000, 1, 45–58. [Google Scholar] [CrossRef]
Figure 1. Map of the Kathmandu valley with its major cities [9].
Separations 09 00205 g001
Figure 2. Illustration of the studied samples, as collected from the monumental structures.
Separations 09 00205 g002
Figure 3. Images from stereozoom microscope of polished cross-sections of mortar samples (2.5× magnification).
Separations 09 00205 g003
Figure 4. XRD patterns of the samples. Color coded by group. Group 1: organic binder samples—blue, Group 2: inorganic binder samples—black. Q, quartz; Pl, plagioclase; Or, potassium feldspar; Mca, mica; Clc, calcite; CM, clay minerals.
Separations 09 00205 g004
Figure 5. ATR-FTIR spectra of the bulk mortar samples, absorbance vs. wavenumber (cm1).
Separations 09 00205 g005
Figure 6. Thermogravimetric curves (—TG and --- DTG) of the mortar samples’ global fraction. Dashed lines for DTG with same color code of TG. Labels refers to the sample references.
Separations 09 00205 g006
Figure 7. Optical microphotographs of the examined thin sections displaying general textural features of the samples S.3.1, S.3.2, S.4, S.5 and S.6R (S.6R.a) and detailed microphotograph (S.6R.b) of sample S.6R illustrating rice husk. qz, quartz; cf, ceramic fragment; rh, rice husk.
Separations 09 00205 g007
Figure 8. XRF data. Scatter plot SiO2-CaO, color coded by sample.
Separations 09 00205 g008
Figure 9. Py-GC-MS chromatogram of the S.1 mortar sample’s binding media.
Separations 09 00205 g009
Figure 10. Py-GC-MS chromatogram of the S.2 mortar sample’s binding media.
Separations 09 00205 g010
Table 1. Context of the studied samples.
Sample IDMonumentConstruction DateMain Construction Material
S.1Krishna Mandir Temple17th century ADStone
S.2Yogendra Malla Pillar17th century ADStone
S.3Kasthamandap Temple11–13th century ADBricks
S.4Agamchhen/Hanuman-Dhoka Pallace15–18th century ADBricks
S.5Shah Kalin-Dhukuti/Hanuman-Dhoka Pallace19th century ADBricks
S.6Gaddi Baithak/Hanuman-Dhoka Pallace20th century ADBricks
Table 2. Semi-quantitative results of the bulk mineralogical composition of the mortar samples assessed by XRD.
SampleMonumentQPlOrMcaClcGCM
S.1Krishna Mandir Temple++++++++++++-+
S.2Yogendra Malla Pillar++++++++++++-+
S.3.1Kasthamandap Temple+++++++++++-++
S.3.2Kasthamandap Temple+++++++++++--+
S.4Agamchhen/Hanuman-Dhoka Pallace+++++++++++--+
S.5Shah Kalin-Dhukuti/Hanuman-Dhoka Pallace+++++++++++--+
S.6GGaddi Baithak/Hanuman-Dhoka Pallace++++++++++--+
S.6RGaddi Baithak/Hanuman-Dhoka Pallace++++++++++++--
Q, quartz; Pl, plagioclase; Or, potassium feldspar; Mca, mica; Clc, calcite; G, gypsum; CM, clay minerals. abundant, ++++; major, +++; minor, ++; present, +; undetected -. Color coded by group. Group 1 (S.1 and S.2): organic binder samples—blue, Group 2 (S.3–S.6): inorganic binder samples—black. The comparison of the semi-quantitative results could be considered only within each group (Group 1 (S.1 and S.2) and Group 2 (S.3–S.6)).
Publisher’s Note: MDPI stays neutral with regard to jurisdictional claims in published maps and institutional affiliations.

