Article

Expanding the Knowledge Related to Flavors and Fragrances by Means of Three-Dimensional Preparative Gas Chromatography and Molecular Spectroscopy

1
Department of Chemical, Biological, Pharmaceutical and Environmental Sciences, University of Messina, 98168 Messina, Italy
2
Traceability Unit, Research and Innovation Centre, Fondazione Edmund Mach, San Michele all’Adige, via Mach 1, 38098 Trento, Italy
3
Department of Biomedical, Dental, Morphological and Functional Imaging Sciences, University of Messina, 98125 Messina, Italy
4
Chromaleont S.R.L., c/o Department of Chemical, Biological, Pharmaceutical and Environmental Sciences, University of Messina, 98168 Messina, Italy
5
Department of Sciences and Technologies for Human and Environment, University Campus Bio-Medico of Rome, 00128 Rome, Italy
*
Author to whom correspondence should be addressed.
Separations 2022, 9(8), 202; https://doi.org/10.3390/separations9080202
Submission received: 14 July 2022 / Revised: 31 July 2022 / Accepted: 1 August 2022 / Published: 4 August 2022

Abstract

:
As universally known, gas chromatography (GC) coupled with mass spectrometry (MS) allows us to acquire spectra that can be searched in specific databases to attain qualitative information on a peak of interest. When not present in databases, structure elucidation is required before including a new component in a library: from that moment, scientists all around the world will be able to identify the new molecule with analytical confidence after GC-MS analysis. Conversely, if data are not shared in commercial databases, even if a molecule is studied and elucidated, it appears to be unknown or only identifiable on the basis of third-party data taken from the literature, which is a serious limitation. The present paper deals with a case that confirms this assumption. A component of Myrtus communis L. volatile fraction was tentatively identified based on literature data. Despite this, reliable identification could not be achieved due to the lack of a corresponding spectrum in commercial MS databases. Afterwards, the target component was isolated in a reasonable quantity and with a high degree of purity for downstream characterization by spectroscopic techniques. For this purpose, preparative (prep) GC may appear insufficient for the isolation of volatile components from highly complex samples. In this study, a prep-MDGC system was implemented for the isolation of the compound of interest from myrtle oil, consisting of three wide-bore columns of different selectivity coupled by means of Deans switch transfer devices. Based on the NMR and GC-FTIR data acquired, the unknown compound was identified as 2,2,5,5,7,7-hexamethyl-3,7-dihydro-1-benzofuran-4,6(2H,5H)-dione. Noticeably, this is a known molecule, yet its mass spectrum had never been registered into MS databases and thus was not available to the scientific community. Finally, the spectrum was included for the first time in a commercial library, namely the FFNSC 5.0 MS database. The aim of the present study was to highlight the opportunity to make analytical data quickly available in a reliable way by registering them in searchable MS databases to improve the identification means for researchers all over the world.

Graphical Abstract

1. Introduction

Myrtus communis L., commonly known as myrtle, is an aromatic perennial shrub belonging to the Myrtaceae family. This plant grows in damp and sunny places and is typical of all the low Mediterranean scrub, from Northern Africa to Southern Europe [1]. Myrtle leaves are evergreen, ovate, or lanceolate, while the flowers are lonely and axillary, white or rosy, and manifest abundantly from late spring to summer. The fruits consist of spherical berries, dark red to violet or white in color depending on the specific variety, which ripen in late fall and persist for long on the plant [2]. Since ancient Greek and Egyptian times, the beneficial properties of Myrtus communis L. have been recognized and valued by perfumery and traditional medicine. Myrtle is attributed to several pharmacological effects, and its antimicrobial, anticancer, antidiabetic, antiulcer, antidiarrheal, and anti-inflammatory activities were mentioned in early ethnopharmacological studies [3]. The leaves and berries are sources of essential oil (EO), which is predominantly composed of monoterpenes and oxygenated monoterpenes; the latter is most abundant in extracts obtained from the leaves [4]. However, significant differences have been reported in the volatile fraction, whose chemical composition may differ depending on the geographical origin of the plant [5,6,7], the organ selected, and the extraction method [8,9,10]. Moreover, different varieties/cultivars/genotypes of the plants bring about variations in the volatile organic compounds (VOCs) composition [11,12]. Still, achieving detailed knowledge of EO composition is mandatory to correlate its activities with the presence of specific volatile organic compounds (VOCs). All plant properties are ascribed to the presence of certain components or may result from the synergistic association of some of them. Common approaches to the structural elucidation of unknown VOCs usually involve a chromatographic step for compound isolation, consisting of preparative-GC (prep-GC). The collection of target analytes of suitable purity and in appropriate amounts may be an arduous task when dealing with natural matrices since most of them show medium-to-high complexity. In particular, the analysis of EOs may be cumbersome, as they typically include a multitude of volatile compounds from different chemical classes and in a wide concentration range. Reliable compound identification and quantification for these samples may not be achieved after a single dimension separation, demonstrating the likelihood for (odor/flavor-active) stereoisomers, which may lead to ambiguous MS library matches [13]. Multidimensional GC (MDGC) performed in the heart-cut mode focuses on selected components in complex matrices and offers interesting advantages for the analysis of target compounds [14]. The potential of multiple heart-cut MDGC has been extensively exploited in flavor and fragrance analysis, and such an approach has been proven effective for removing matrix interferences [15]. Implementing a prep-GC approach requires high-resolution separations, as well as viability for large volume injections of neat samples. To this concern, column selection plays a pivotal role in delivering adequate sample capacity for preparative applications, and mega-bore columns often represent the most suitable choice [16,17,18]. Nonetheless, the low efficiency of such columns represents a clear disadvantage compared to their narrower-bore counterparts. To overcome this limitation, multiple stationary phases with different selectivity may be combined whenever high resolution is required, and such an approach has been extensively used in prep-GC applications [19,20,21,22,23]. In this study, the essential oil and hydrosol extract of Myrtus communis L. leaves obtained from plants collected in the region of Boujmil, Morocco, were analyzed by GC-MS. A total of 75 components were identified, accounting for 98.6% and 93.8% of the oil and the hydrosol extract, respectively. For this purpose, the experimental MS data were matched against MS library databases, with the additional support of the Linear Retention Index (LRI) as a filter. However, identification was not possible for one of the sample constituents, accounting for around 0.78% of the oil and 7.29% of the hydrosol extract since no significant match was obtained by commercial MS libraries. To allow for the structural elucidation of the target compound, a 3D prep-MDGC system was exploited, combining the well-known resolution capability of the heart-cut mode [24,25] with the high sample capacity of wide-bore capillary columns. By these means, the collection of target fractions from a complex sample was attained, with a higher purity degree with respect to that afforded by conventional approaches. Noticeably, the overall analysis time was also conveniently reduced. Afterwards, the target compound was subjected to structural elucidation studies, consisting of MS, NMR, and FTIR spectroscopy.

2. Materials and Methods

2.1. Plant Material and Sample Preparation

Myrtus communis L. leaves were randomly collected in January 2020 from wild plants growing in the surroundings of Boujmil (northern Morocco, at 35°45′27″ N altitude and 5°26′25″ W longitude). The myrtle leaves (≈500 g) were subjected to conventional hydrodistillation (5–6 h), and the extracted essential oil was treated with anhydrous sodium sulfate and stored at +4 °C, shielded from the light. The remaining water (700 mL) was poured into a separating funnel, and liquid–liquid extraction of the volatile constituents from the hydrosol was achieved by adding GC-grade ethyl acetate (300 mL) from Merck (Merck Life Science, Darmstadt, Germany). After manual agitation and decantation, the organic phase was separated from the aqueous layer and evaporated to dryness. Finally, the obtained hydrosol extract was stored at +4 °C, shielded from the light. The samples were diluted 1:20 (v/v) in GC grade n-hexane from Merck (Merck Life Science, Darmstadt, Germany) prior to analysis. A C7-C30 saturated n-alkanes (ALKs) mixture and n-nonane were used for LRI measurements and internal standardization purposes, respectively, kindly provided by Merck (Merck Life Science, Darmstadt, Germany). Deuterated chloroform (CDCl3 99.8% atom D, Merck Life Science, Darmstadt, Germany) was used to dissolve the target analyte collected after the 3D-MDGC-prep step prior to NMR experiments.

2.2. GC-FID and GC-MS

GC analyses were performed on a Shimadzu GC-2010 Plus gas chromatograph equipped with an AOC-20i series auto injector and a GCMS-QP2010 Ultra system mass spectrometer (Shimadzu Europa, Duisburg, Germany) with an electron ionization (EI) source. The column was an SLB-5ms (silphenylene polymer, virtually equivalent to poly (5% diphenyl/95% methylsiloxane)), 30 m × 0.25 mm I.D. × 0.25 μm df, capillary stationary phase from Merck (Merck Life Science, Darmstadt, Germany). The separations were performed under the following conditions: oven temperature program, 50 °C to 300 °C, at 3 °C min1; split/splitless injector, 280 °C; injection mode, split (1:10 ratio); injection volume, 0.5 μL. For GC-FID analyses, helium was used as a carrier gas at a constant linear velocity of 30.0 cm s1, and the inlet pressure was set to 99.5 kPa. FID (310 °C) gases were H2 at 40.0 mL min1 and air at 400 mL min1; the sampling rate was 80 msec. Data were acquired by LabSolutions software ver. 5.92 (Shimadzu Europa, Duisburg, Germany). GC-MS analyses were carried out as follows: inlet pressure, 26.7 kPa; carrier gas, He at a constant linear velocity of 30 cm s1; source temperature, 220 °C; interface temperature, 250 °C; mass scan range, 40–400 m/z; scan speed, 10 Hz. Data were acquired using GCMS solution software ver. 4.30 (Shimadzu Europa, Duisburg, Germany). Identification was achieved by searching the experimental data in the W11N17 (Wiley11-NIST17, Wiley, Hoboken, NJ, USA) and FFNSC ver. 4.0 (Shimadzu Europa, Duisburg, Germany) mass spectral databases for library matching with the additional support of an LRI filter.

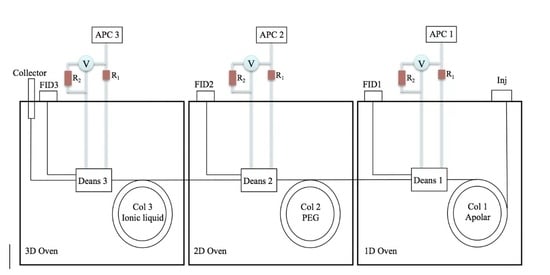
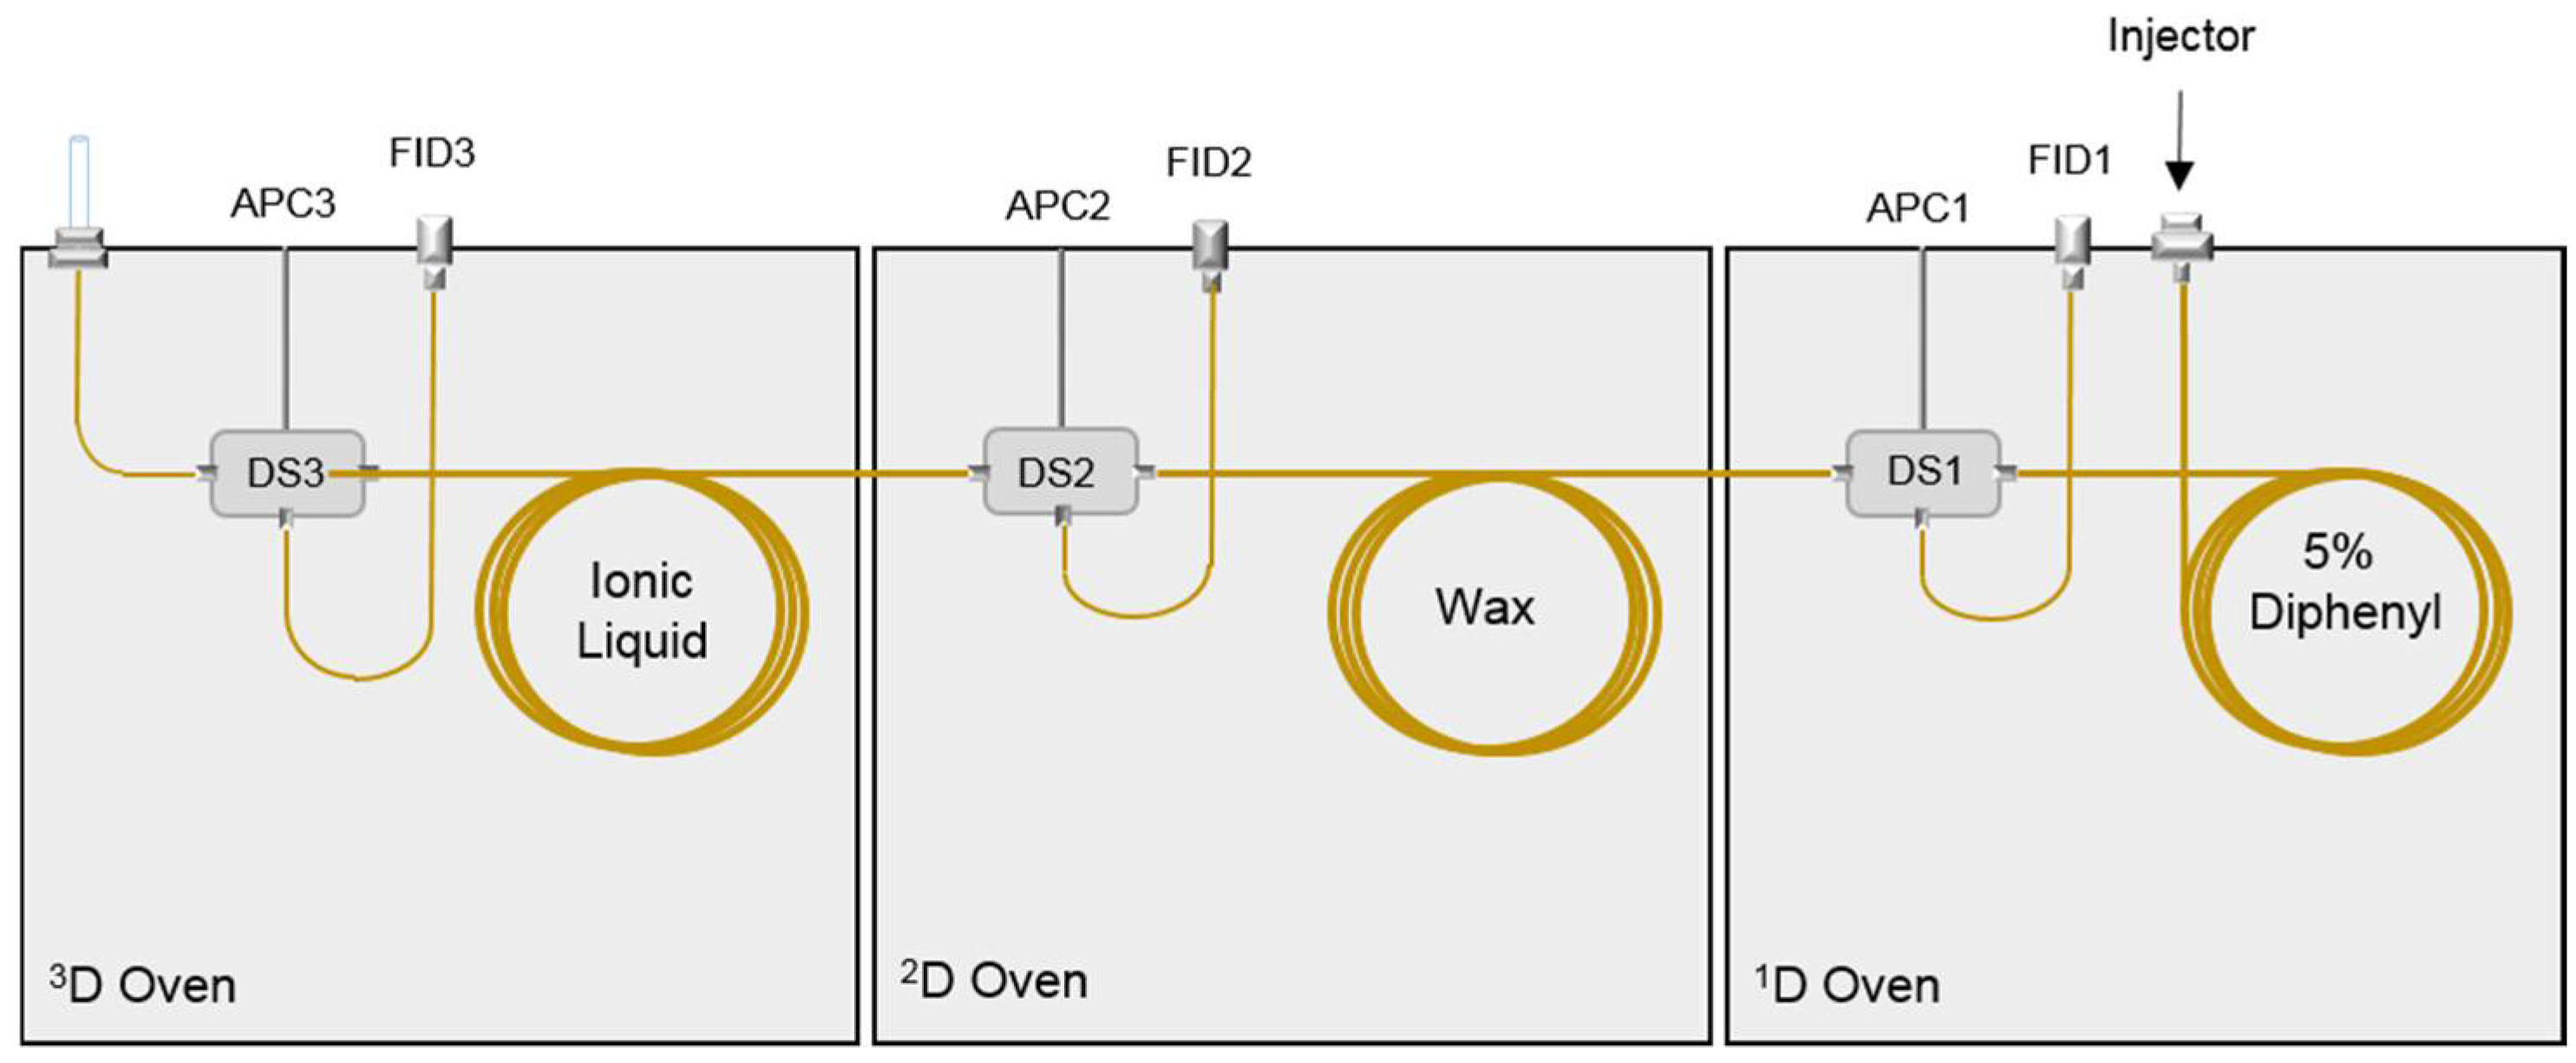
2.3. Preparative Multidimensional GC

The prep-MDGC system employed, illustrated in Figure 1, consisted of three Shimadzu GC-2010 Plus gas chromatographs (GC1, GC2, GC3), each equipped with a Deans switch (DS) transfer device (Shimadzu Europa, Duisburg, Germany), and an advanced pressure control system (APC1, APC2, APC3) which supplied the carrier gas (He); for more details see Sciarrone et al. [26].
The first dimension (1D) column was an Equity-5 [poly (5% diphenyl/95% dimethylsiloxane)], 30 m × 0.53 mm I.D. × 5 μm df (Merck Life Science, Darmstadt, Germany), preceded by a 1 m segment of an uncoated column of the same I.D. FID1 (300 °C) connected to DS1 via a 1 m × 0.22 mm I.D. segment of the uncoated column. Carrier gas pressure was maintained constant at 124.7 kPa, while a constant pressure of 110 kPa was applied to APC1. The oven temperature program in 1D was: 40 °C to 230 °C at 10 °C min−1 and 230 °C to 280 °C at 3 °C min−1 (held for 40.00 min); the transfer line between GC1 and GC2 was maintained at 240 °C. The second dimension (2D) column was a SupelcoPEG-10 (100% polyethylene glycol, PEG), 30 m × 0.53 mm I.D. × 1.0 μm df (Merck Life Science, Darmstadt, Germany). FID2 (300 °C) was connected to DS2 via a 0.5 m × 0.25 mm I.D. segment of the uncoated column. The oven temperature program in 2D was: 50 °C (held for 32.50 min) to 200 °C at 10 °C min−1 and 200 °C to 240 °C at 5 °C min−1 (held for 20.00 min); the transfer line between GC2 and GC3 was maintained at 240 °C. APC2 pressure was maintained constant at 95 kPa. The third dimension (3D) column was an SLB-IL59 (custom-made ionic liquid) 30 m × 0.53 mm I.D. × 0.8 μm df (Merck Life Science, Darmstadt, Germany). FID3 (300 °C) was connected to DS3 via a 0.6 m × 0.18 mm I.D. segment of the uncoated column. The oven temperature program in 3D was: 100 °C (held for 54.10 min) to 240 °C at 5 °C min−1. APC3 pressure was programmed as follows: 43.5 kPa (held for 54.10 min) to 60 kPa at 400 kPa min−1 (held for 28.00 min). Detector gases (for FID1, 2, and 3) were H2 at 50.0 mL min−1 and air at 400 mL min−1; the sampling rate was 40 msec. Data were collected by MDGCsolution software ver. 2.43.00 (Shimadzu Europa, Duisburg, Germany). A lab-made modified GC injector port was used as the collection device. The collection system (Figure 1) consisted of a heated (250 °C) aluminium block (3 cm length × 1.5 cm width × 11 cm height), with two liners in series located inside and held in position by means of two nuts: the bottom liner was fixed to drive the retention gap (0.3 m × 0.18 mm I.D.) into the upper one, which was removable and used to collect the condensed gas stream. After analyte isolation, the collection tube was removed and flushed in a 2 mL vial with 100 μL deuterated chloroform. The collected fraction containing the target compound was analyzed by GC-MS and GC-FID for qualitative and quantitative purposes, respectively, prior to GC-FTIR and NMR analyses.

2.4. Nuclear Magnetic Resonance

1H and 13C{1H} NMR spectra were recorded on an Agilent Propulse 500 MHz spectrometer equipped with a OneNMR probe (Agilent Technologies, Inc., Santa Clara, CA, USA) operating at 499.74 (1H) or 125.73 MHz (13C{1H}). After collection by prep-MDGC, the sample was dissolved in chloroform-d, poured into a 5 mm test tube, and analyzed after locking on the deuterium lock signal, searching for a good field homogeneity (shimming), and setting the frequency modulation (tuning). The 1H saturation 90° pulse was calculated as 8 μs at 61 dB of power level, while the protonic spectrum was recorded under 2 s acquisition time, 2 s scan delay, and 16 scans. Complete and unambiguous assignment was achieved by processing homo nuclear 2D-Correlation Spectroscopy (2D-COSY), Total-Correlation Spectroscopy (TOCSY), and Rotating Frame Overhauser Effect Spectroscopy (ROESY) [27] experiments together with the heteronuclear 13C {1H}-Heteronuclear Single-Quantum Coherence (HSQC) and 13C-Heteronuclear Multiple Bond Correlation (HMBC) experiments, as described elsewhere [28]. Calibration was attained using the residual proton signal of the solvent as the internal standard (CDCl3 singlet at δ = 7.26 ppm and 13C solvent triplet at δ = 79.0 ppm). Data were processed by Agilent VnmrJ software ver 4.2 (Agilent Technologies, Inc., Santa Clara, CA, USA) and by the ACD/Spectrus Processor 2015 Pack 2 inside the ACD Lab software package (Advanced Chemistry Development, Inc., Toronto, ON, CA, USA), which was also exploited for validation.

2.5. Solid Phase GC-FTIR

The GC-FTIR spectra were acquired by a DANI Master GC (Dani Instruments, Milan, Italy) coupled with a DiscovIR-GC (Spectra Analysis Instruments, Inc., Marlborough, MA, USA) detector. The same column as for the GC-MS experiment was used. GC parameters were as follows: injection volume, 1 μL at 280 °C in the split mode (1:10); carrier gas, He at constant linear velocity, 30 cm s1; temperature program, 50 °C to 280 °C, at 5 °C min1 (held for 5 min). The transfer line and restrictor temperature were 280 °C. FTIR spectra were acquired from 4000 to 700 cm1, at a resolution of 4 cm1. The column eluent was directly deposited on a cryogenically cooled ZnSe sample disc, which was cooled down to −50 °C by means of liquid nitrogen and rotated at 3 mm min1. The FTIR instrument was equipped with a Mercury Cadmium Telluride (MCT) cryogenically cooled detector. GRAMS/AI Spectroscopy software ver 9.3 (Thermo Fisher Scientific, Inc., Waltham, MA, USA) was used to perform the calculation of IR response vs. time.

3. Results

3.1. GC-MS and GC-FID Analyses

The composition of the EO and hydrosol volatile fractions of the M. communis L. leaves was investigated by GC-MS (Figure 2) and GC-FID analyses; 75 components were detected in both samples, accounting for 98.6% and 93.8% of the oil and extract, respectively. Peak identification was achieved by means of GC-MS exploiting the linear retention indices (LRIs) calculated against a C7–C30 alkane homologous series. Two filters were applied as criteria for positive identification in the library search, namely a minimum MS similarity of 85% and a tolerance window of ±5 LRI units with respect to the experimental LRI. Only one component, accounting for about 0.78% of the oil and 7.29% of the hydrosol extract, was not identified due to the lack of any spectral and LRI data in the MS libraries.
The composition data obtained for the oil (see Table 1) were in good accordance with the literature data relative to Moroccan M. communis L. leaves, with eucalyptol, myrtenyl acetate, and α-pinene being the oil's major components [7,11,29]. The presence of an unknown compound as a trace constituent of myrtle oil was previously described by Weyerstahl et al., but in that study, only the relative abundances of the lower-mass ions (fragments) of the molecule were reported [30]. In a first step, those data were used to build the MS spectrum of the molecule, with the aim to add it to a test MS database and to carry out a similarity search for the target component in the myrtle samples. Very low spectral similarity (66%) was obtained for the target compound (Figure S1), probably due to the lack of many ion fragments from the MS spectrum, which make the identification of the compound based on the literature data unreliable. Thus, isolation of the compound of interest was necessary to attain confident identification. With oxygenated compounds being predominant in hydrosol extract [31], the latter was used as the starting material for the collection and purification of the target compound by means of the prep-MDGC.

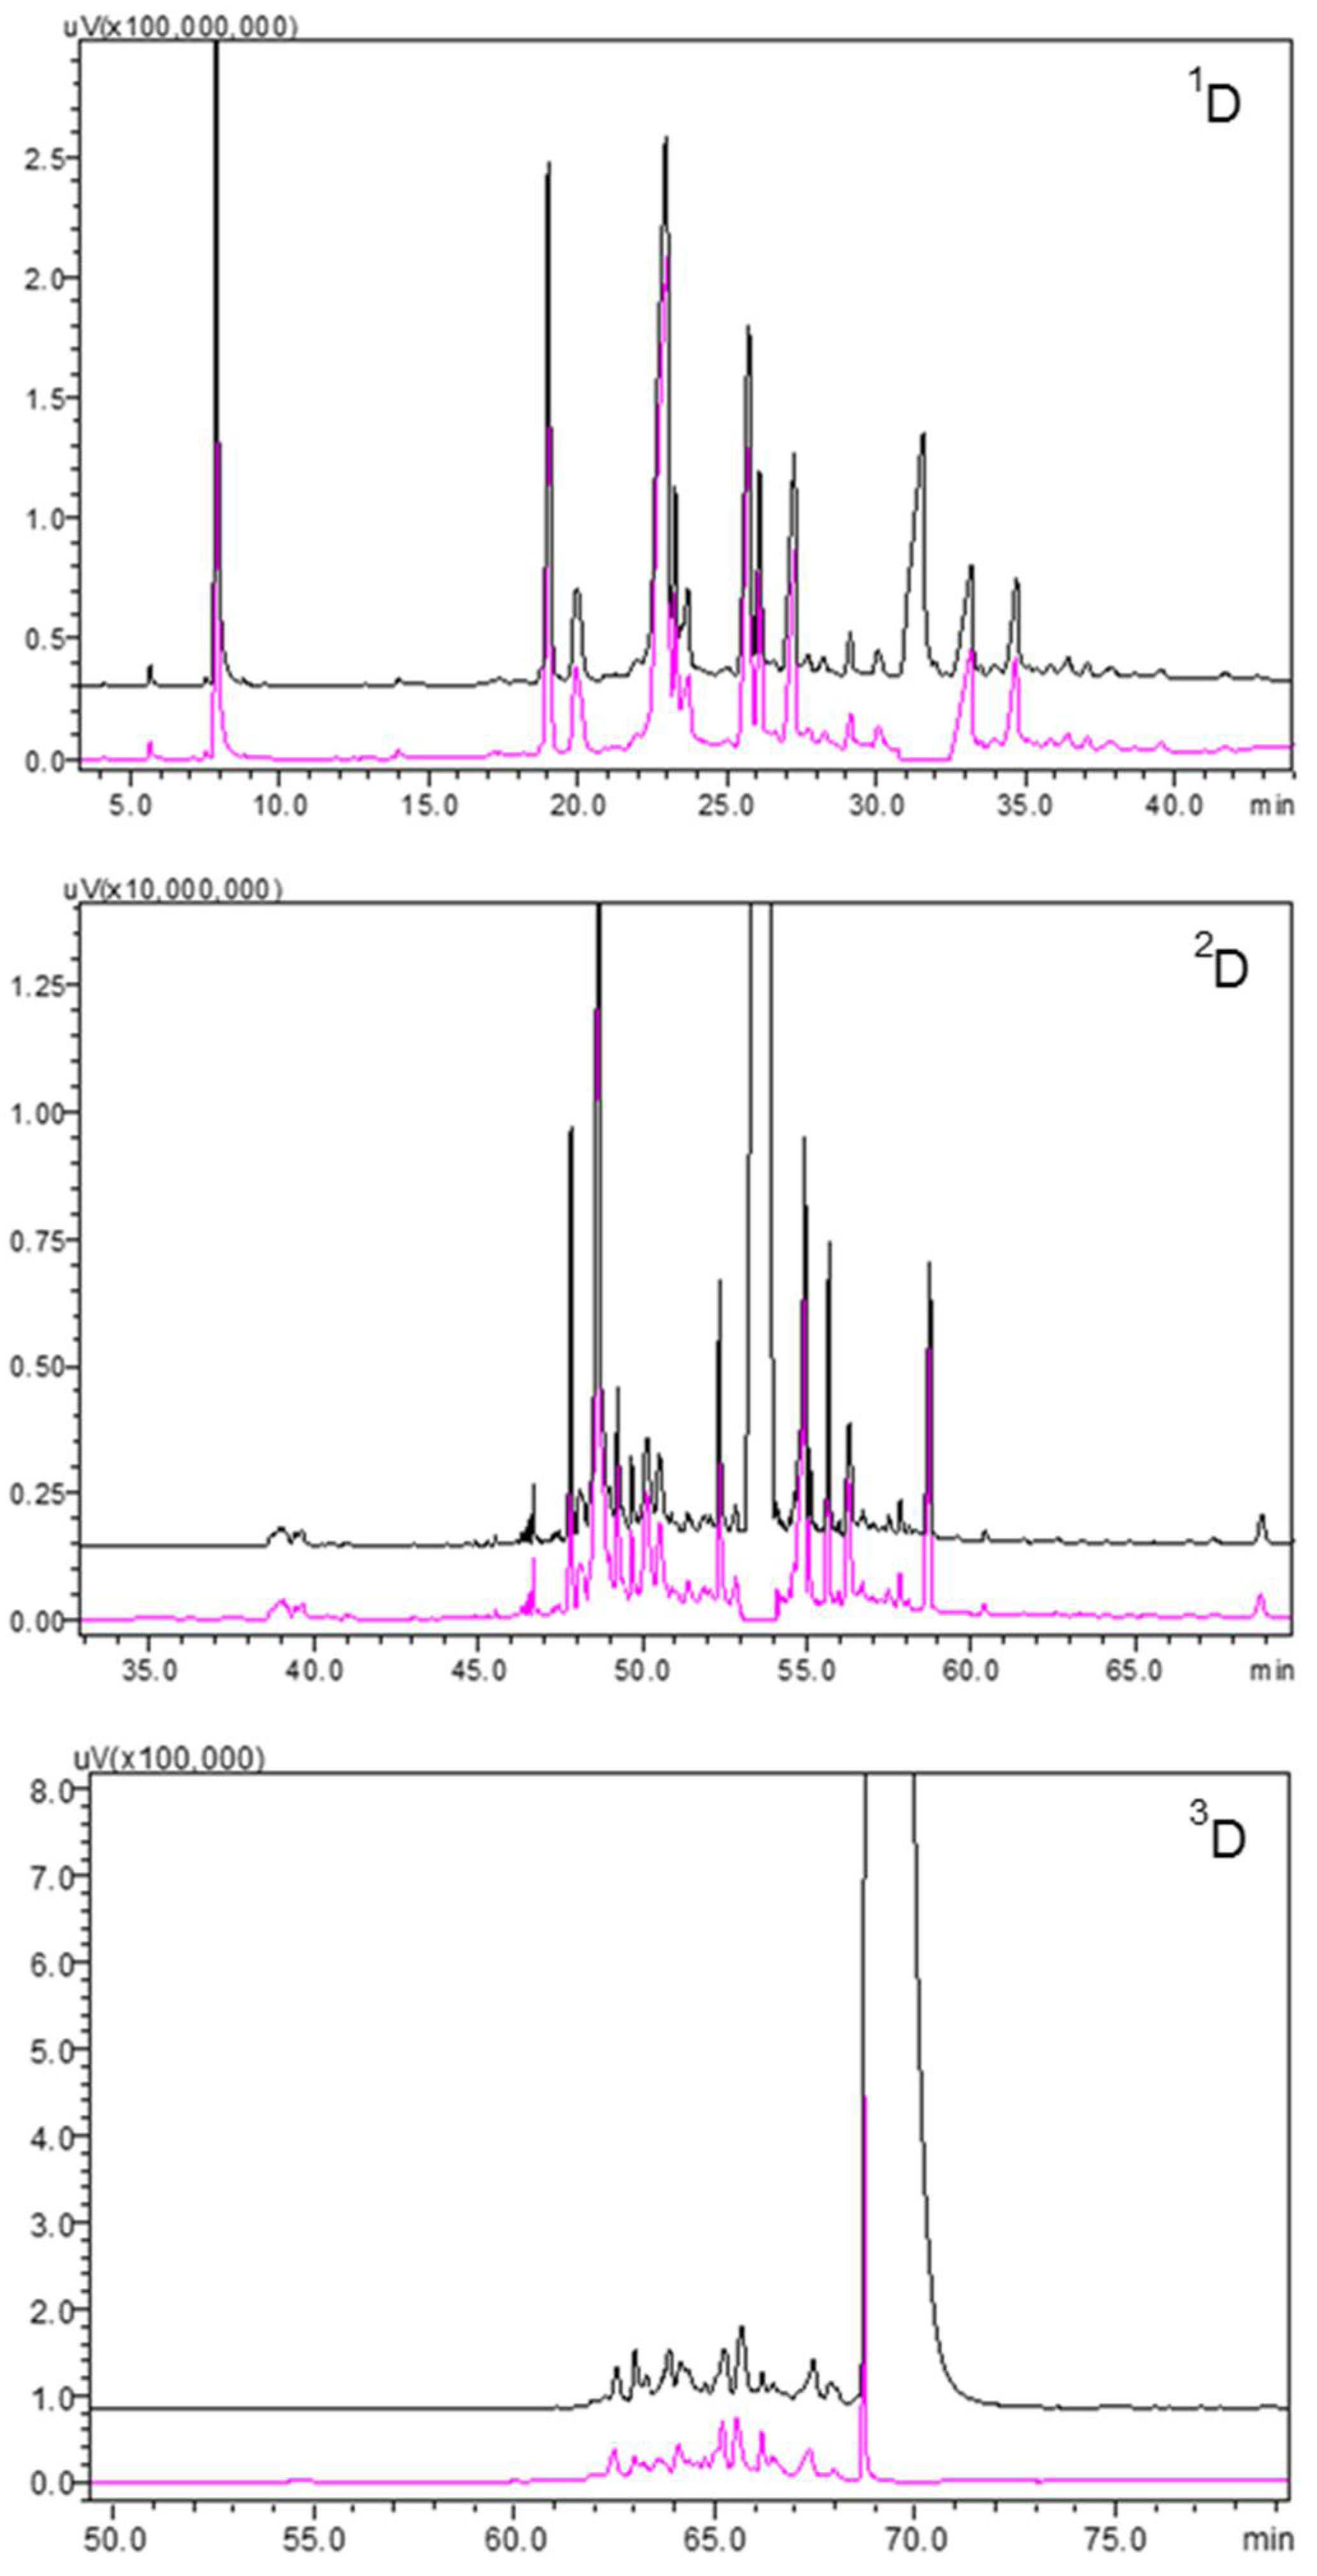
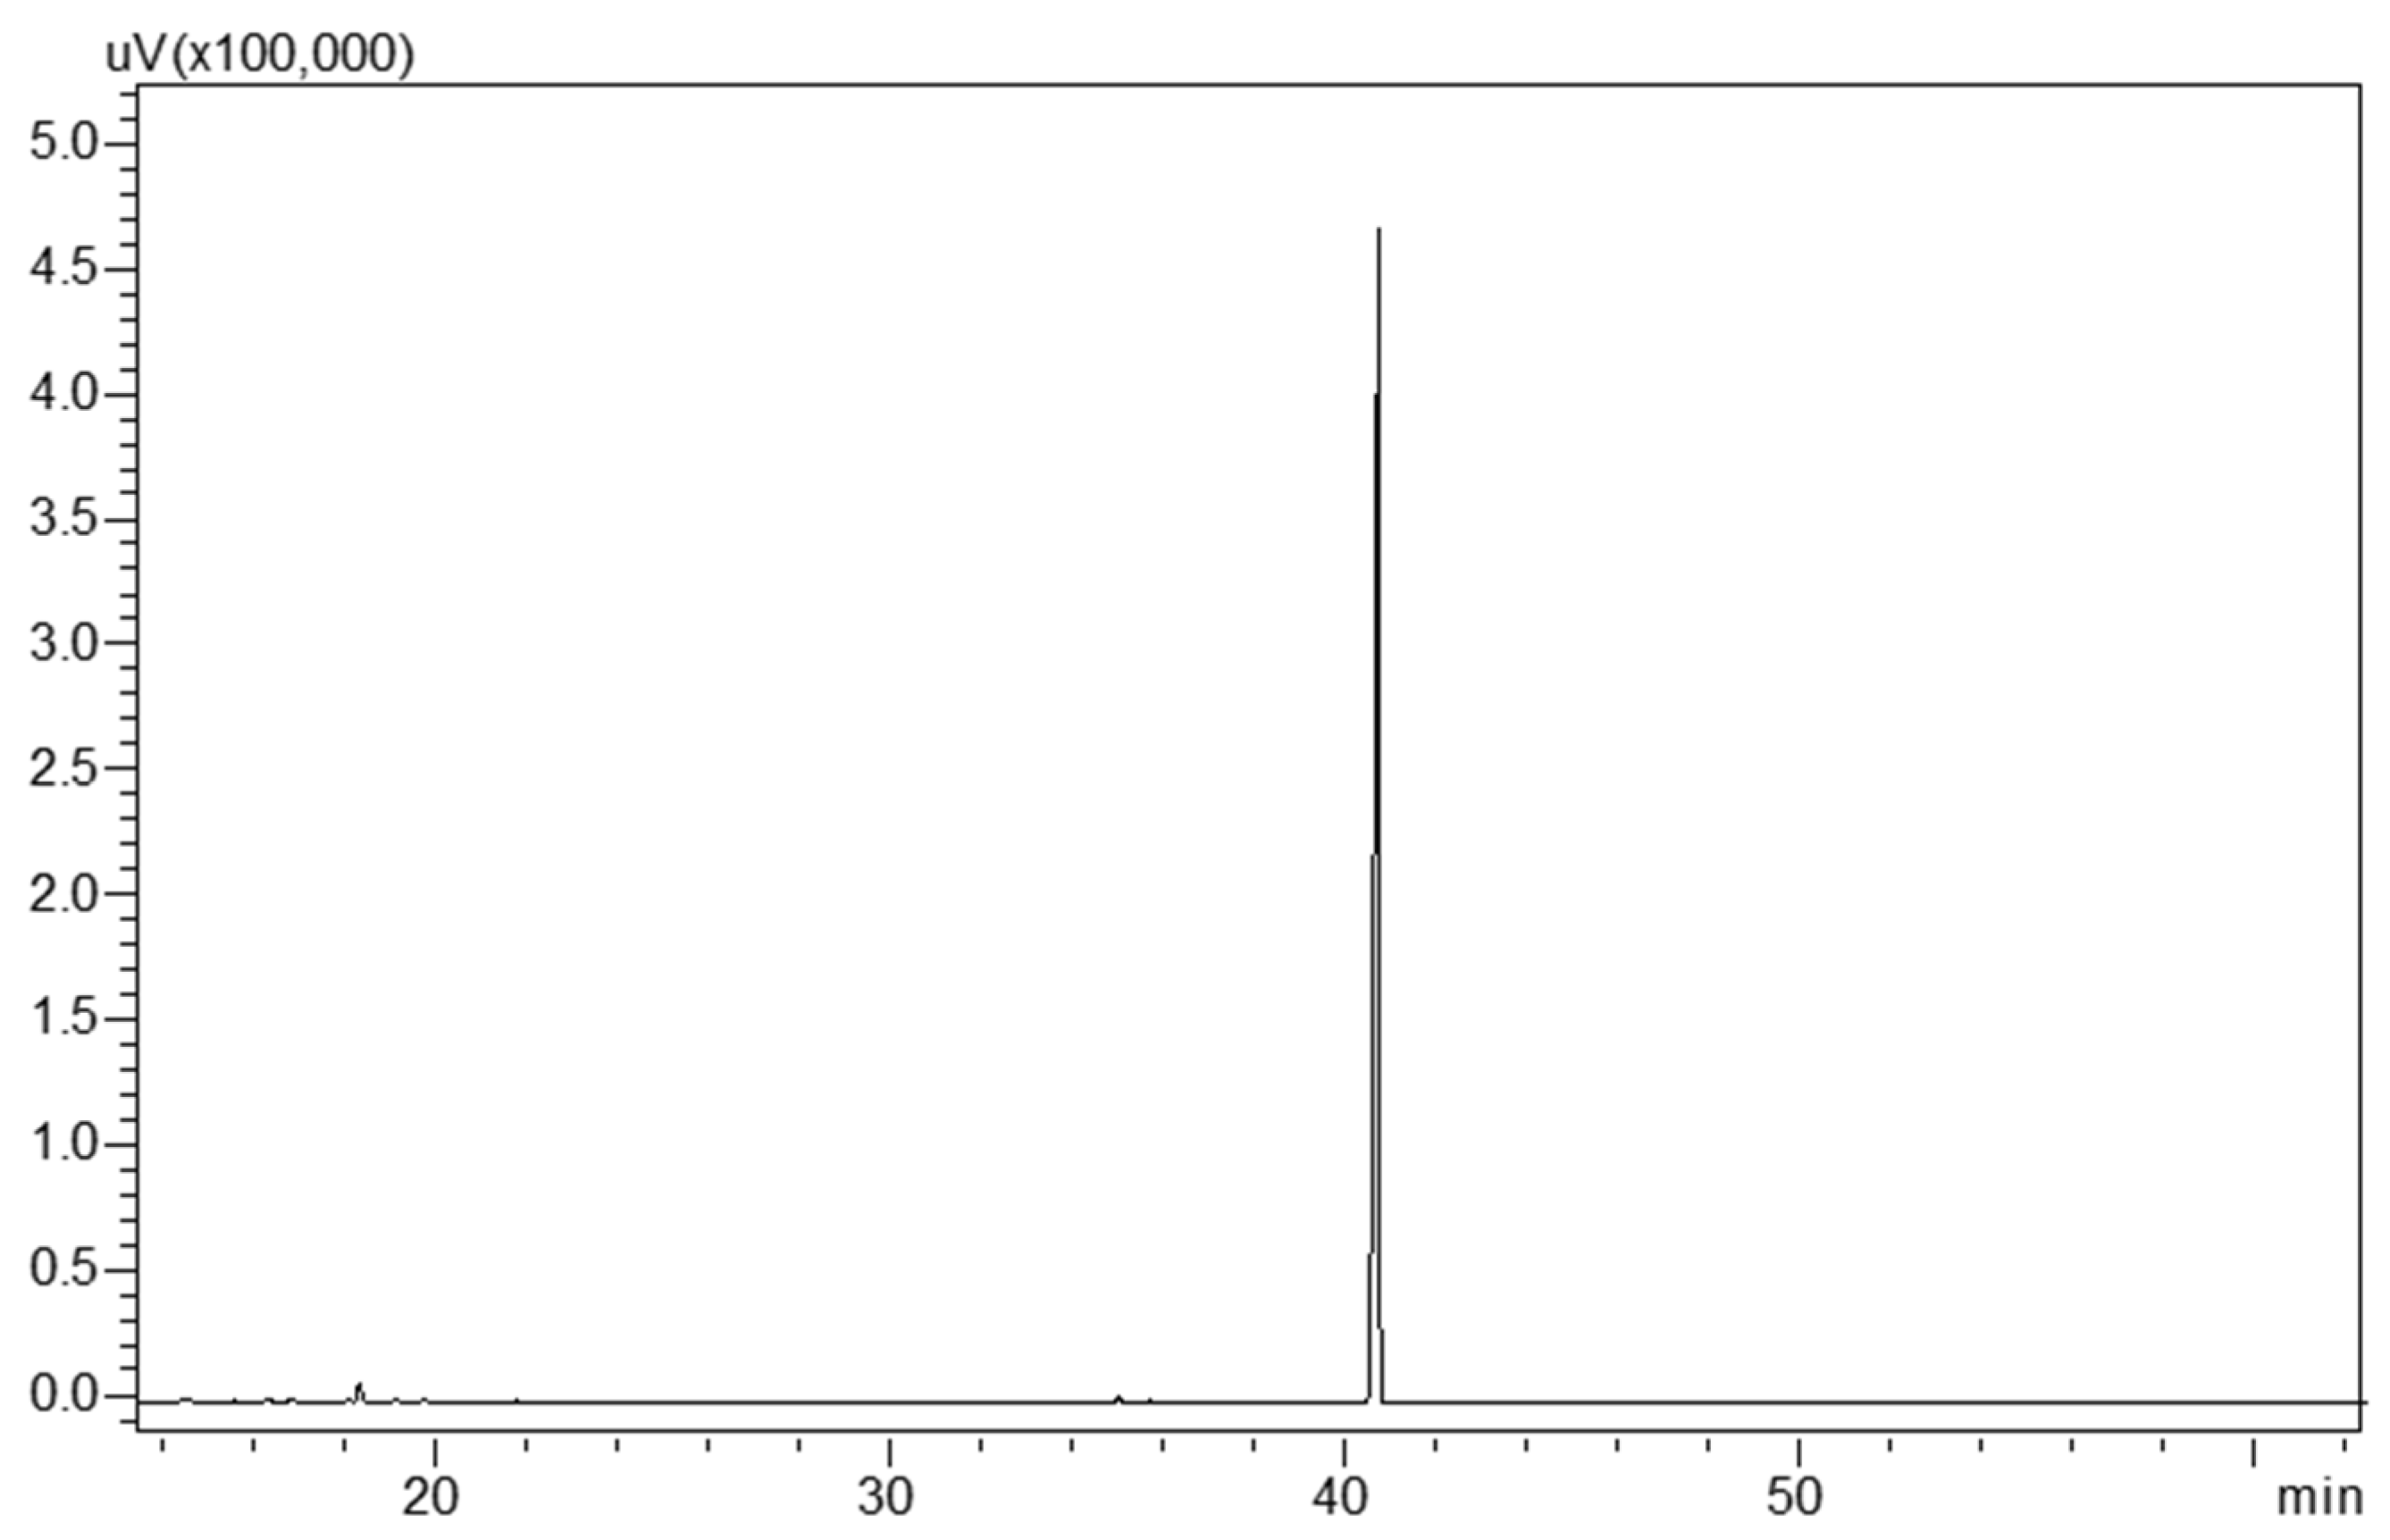
3.2. Preparative MDGC Analysis

A mandatory prerequisite for the structural elucidation of unknown compounds is the isolation and collection of sufficient amounts of the target molecule with a suitable degree of purity. Depending on the technique employed (e.g., NMR), up to mg levels may be required to carry out spectroscopic analyses successfully. Apart from the obvious constraints in terms of limited separation capacity, conventional prep-GC methods involve a long analysis time to achieve the collection of adequate quantities of pure compounds. Micro-bore capillary columns typically employed in prep-GC deliver high efficiency, but limited volumes of diluted samples need to be injected, per run, to prevent peak skewing and loss of resolution. On the other hand, the lower separation efficiency resulting from the use of a wide bore column would be problematic for most applications due to the low purity of the collected fractions containing co-eluted compounds. In this research, a prep-MDGC method was implemented, aiming to overcome the major limitations associated with the use of monodimensional GC approaches. For this purpose, 0.53 mm I.D. columns were selected for all the separation steps to obtain increased sample capacity. To ensure we were not trading resolution and efficiency for load capacity, a three-dimensional prep-GC system was implemented by the coupling of three stationary phases with different selectivity. Specifically, a silphenylene polymer, virtually equivalent in polarity to poly (5% diphenyl/95% methylsiloxane), was employed as 1D, a 100% polyethylene glycol as 2D, and a medium-polarity ionic liquid-based column as 3D. This setup allowed for highly pure fractions to be obtained by means of heart-cut MDGC. Moreover, mg amounts of the target compound could be collected in a reasonable analysis time due to the injection of a higher volume of the oil sample. 1D stand-by analysis was performed by the direct injection of 2 μL of the sample. As can be appreciated in the 1D stand-by chromatogram (black trace in Figure 3), a clear overload effect resulted for the target fraction, and thus a different retention mechanism was necessary to achieve satisfactory separation.
A 1D cut window from 30.70 to 32.50 min was selected, and the 2D stand-by chromatogram was obtained on a PEG stationary phase. As can be noticed in Figure 3, the heart-cut fraction transferred from 1D still resulted in being greatly impure due to the significant overload effect caused by the injection of a very high sample amount. In the stand-by analysis on the PEG column (2D), the target peak indeed accounted for only 75% of the whole fraction transferred. In a conventional MDGC approach, consisting of two chromatographic steps, a final heart-cut would have been applied for the collection of the target peak. Despite this, GC-MS analysis of the fraction collected after the 2D separation still revealed the co-elution of many sample components with the target peak (data not shown). Hence, a second heart-cut step was performed by selecting a 2D cut window from 53.00 to 54.10 min. As shown in the 3D stand-by chromatogram in Figure 3, the target peak was further purified from the fraction transferred because of a third separation step on the ionic liquid stationary phase. The latter had similar polarity to the PEG column but different selectivity. A third heart-cut window, from 68.60 to 71.00 min, was performed to collect the purified compound through its diversion to the collector system located inside the modified 3D injection port. Once the eluent was trapped, the collection tube was immediately removed and flushed in a 2 mL vial with 100 µL deuterated chloroform (to ensure compatibility with subsequent NMR analysis). To attain complete recovery of the fraction from the collection tube, the latter was washed again with the same solvent, and the solution obtained was injected into a GC-MS system: no peaks showed up, confirming the complete removal of the condensed fraction. A total of 12 prep-MDGC collections were performed to collect sufficient sample amounts for the NMR experiments. The solution obtained was spiked with n-nonane as the internal standard (10,000 ppm) and analyzed by means of GC-FID. Recovery was extrapolated from a calibration curve built using b-caryophyllene vs. the internal standard. Around 2.0 mg were collected in a total of 16 h, with an average collection recovery of approximately 90% and a purity degree of 99.9%. GC-FID (Figure 4) and GC-MS analyses were carried out to check the degree of purity of the target compound, as well as for identification purposes.

3.3. Spectroscopic Data and Structural Elucidation

Once pure milligrams of the target molecule were collected by means of the prep-MDGC approach and spectroscopic analyses were carried out for structure elucidation, consisting of solid phase GC-FTIR and NMR. Although not widespread, hyphenated GC-FTIR provides a very useful identification tool through the combination of highly efficient separation and highly specific fingerprinting of functional groups in unknown substances. Furthermore, the information provided by FTIR detection is complementary to those afforded by MS and may assist in the discrimination between isobaric compounds and regioisomers. Noticeably, GC-FTIR techniques based on the use of solid deposition interfaces provide superior resolution and lower detection limits compared to gas phase devices [32,33]. In this study, FTIR analyses were performed by direct micro deposition of the column eluent after a GC separation on a cryogenically cooled ZnSe sample disc. Solid phase IR spectra of the eluted compounds were recorded in real-time from 10 μm × 10 μm spots in the 4000–700 cm−1 range, with a resolution of 4 cm−1. Disc rotation speed plays a fundamental role in determining the overall performance of the GC-FTIR technique since it should allow for sufficient data points to be taken across the GC peak, to obtain a good quality IR spectrum [34]. Hereby, a disc speed of 3 mm min−1 provided the best results in terms of detection sensitivity whilst preserving the chromatographic resolution. A second parameter affecting the sensitivity of solid phase GC-FTIR is the amount of chilling provided to the ZnSe disc, which related to the volatility degree of the analytes to be deposited. In these experiments, the maximum analyte recovery in the solid state was obtained at a disc temperature of −50 °C. The reconstructed FTIR spectrum of the target compound obtained in the mid-IR is shown in Figure 5. In the high wavenumber region, absorptions due to C–H stretching were detected from 3000–2840 cm−1, while the stretching vibrations of the C=C bonds gave rise to a band centered at 1637 cm−1. Finally, a carbonyl stretching vibration band C=O showed up as a strong signal at 1715 cm−1, typical of the saturated ketones.
NMR spectra of the target molecule were acquired, exploiting both 1D and 2D NMR techniques to detect proton and 13C resonances. Figure 6 show the monodimensional 1H and two 1H-13H hetero-correlated experiments, namely HSQC and HMBC. The first two experiments define the unambiguous chemical shift (δ) assignment of the proton resonances and the relative 13C parent resonances. The last HMBC spectrum, connecting 1H and 13C resonances through two or three bonds (2J and 3J), is shown in Figure 6c and allowed the assignment of the quaternary 13C resonances opening the way to the definite structural elucidation.
A molecular drawing with the number labelling scheme is represented in Figure 7, corresponding to the assignment in Table 2, also including the consistent connections.
In detail, the protonic spectrum showed only four signals, with relative integrations 2:6:6:6. The related HSQC edited experiment highlighted the presence of six methyl groups distributed in three equivalent couples and one methylene group. Taking advantage of 2D HMBC hetero-correlated spectroscopy, it was possible to detect seven quaternary carbon atoms. Among the latter 13C signals, three were over 170 ppm. Considering that oxygen represented the only other atom type in the molecule, it was arguable that the three high-frequency 13C were each connected to three different oxygen atoms. Such an observation was consistent with the chemical formula C14H20O3 and the molecular weight of 236 amu, obtained from the corresponding MS spectrum. The definite structure elucidation came from direct (COSY and HSQC) and long-range (TOCSY and HMBC) connections, eliciting the structure in Figure 7, corresponding to 2,2,5,5,7,7-hexamethyl-3,7-dihydro-1-benzofuran-4,6(2H,5H)-dione. Finally, an experimental LRI value of 1518 was calculated for the isolated compound on an SLB-5ms column against an ALKs C7-C30 homologous series. All the data collected were used to register the new compound in the FFNSC 5.0 MS database. This would allow future researchers to attain quick and reliable compound identification by database search. Despite being described as part of the volatile myrtle components [35], this compound was absent in commercial MS databases, and thus its identification could not be achieved by means of GC-MS. Additionally, recent studies described 2,2,5,5,7,7-hexamethyl-2,3-dihydrobenzofuran-4,6(5H,7H)-dione as a key biosynthetic precursor of the acylphloroglucinols myrtucommulone J and myrtucommuacetalone. A wide range of biological activities have also been demonstrated for these two compounds isolated from M. communis L. [36].

4. Conclusions

A three-dimensional prep-MDGC setup was implemented, allowing for the collection of mg amounts of a target compound from the volatile myrtle fraction, with a high degree of purity and reduced time with respect to conventional approaches. Three consecutive heart cuts were performed on stationary phases of different selectivity prior to the structural elucidation of the target compound by means of GC-MS, GC-FTIR, and NMR spectroscopy. The complementary data gathered by different spectroscopic techniques allowed us to identify the target compound isolated as 2,2,5,5,7,7-hexamethyl-3,7-dihydro-1-benzofuran-4,6(2H,5H)-dione. This molecule was already registered with a CAS number 162885-71-4, but scarce information was available in the literature, and spectral data were absent in commercial MS libraries. It must be emphasized that if this target molecule was present in a sample different from myrtus EO, no reference data would be found in the literature, and since no MS database contains information about this analyte, there would not be any chance to identify it. Hereby, after achieving detailed knowledge of the chemical structure and spectroscopic features of the purified compound, it was registered into the FFNSC 5.0 MS library, making it readily available for future research. Interestingly, this also lays the basis for further research aimed at the investigation of compound activities, which may be of interest to different concerns.

Supplementary Materials

The following supporting information can be downloaded at: https://www.mdpi.com/article/10.3390/separations9080202/s1. Figure S1. MS similarity result of the unknown spectrum against the spectrum built with the main ion fragments reported by ref. [30].

Author Contributions

G.D.G.: validation, formal GC analysis, data curation. L.C.: validation, data curation. A.R.: NMR analysis, data curation. P.D.: writing—original draft. L.M.: resources, supervision, project administration, funding acquisition. D.S.: conceptualization, methodology, investigation, writing—original draft, writing—review and editing. All authors have read and agreed to the published version of the manuscript.

Funding

This research did not receive any specific grant from funding agencies in the public, commercial, or, not-for-profit sectors.

Institutional Review Board Statement

Not applicable.

Informed Consent Statement

Not applicable.

Data Availability Statement

Data will be made available upon request.

Acknowledgments

The authors gratefully acknowledge the Shimadzu Corporation and Merck Life Science (Merck KGaA, Darmstadt, Germany) for their continuous support.

Conflicts of Interest

The authors declare no conflict of interest.

References

  1. Hennia, A.; Nemmiche, S.; Dandlen, S.; Miguel, M.G. Myrtus communis essential oils: Insecticidal, antioxidant and antimicrobial activities: A review. J. Essent. Oil Res. 2019, 31, 487–545. [Google Scholar] [CrossRef]
  2. Migliore, J.; Baumel, A.; Juin, M.; Médail, F. From Mediterranean shores to central Saharan mountains: Key phylogeographical insights from the genus Myrtus. J. Biogeogr. 2012, 39, 942–956. [Google Scholar] [CrossRef]
  3. Sisay, M.; Gashaw, T. Ethnobotanical, Ethnopharmacological, and Phytochemical Studies of Myrtus communis Linn: A Popular Herb in Unani System of Medicine. Evid. Based Complement. Alternat. Med. 2017, 22, 1035–1043. [Google Scholar] [CrossRef] [Green Version]
  4. Brada, M.; Tabti, N.; Boutoumi, H.; Wathelet, J.P.; Lognay, G. Composition of the essential oil of leaves and berries of Algerian myrtle (Myrtus communis L.). J. Essent. Oil Res. 2012, 24, 1–3. [Google Scholar] [CrossRef] [Green Version]
  5. Bouzabata, A.; Castole, V.; Bighelli, A.; Abed, L.; Casanova, J.; Tomi, F. Chemical variability of Algerian Myrtus communis L. Chem. Biodivers. 2013, 10, 129–137. [Google Scholar] [CrossRef]
  6. Rahimmalek, M.; Mirzakhani, M.; Pirbalouti, A.G. Essential oil variation among 21 wild myrtle (Myrtus communis L.) populations collected from different geographical regions in Iran. Ind. Crops Prod. 2013, 51, 328–333. [Google Scholar] [CrossRef]
  7. Bazzali, O.; Tomi, F.; Casanova, J.; Bighelli, A. Occurrence of C8-C10 esters in Mediterranean Myrtus communis L. leaf essential oil. Flav. Fragr. J. 2012, 27, 335–340. [Google Scholar] [CrossRef]
  8. Hennia, A.; Miguel, M.G.; Brada, M.; Nemmiche, S.; Figueiredo, A.C. Composition, chemical variability and effect of distillation time on leaf and fruits essential oils of Myrtus communis from north western Algeria. J. Essent. Oil Res. 2016, 28, 146–156. [Google Scholar] [CrossRef]
  9. Pereira, P.; Cebola, M.; Oliveira, M.C.; Bernardo-Gil, M.G. Supercritical fluid extraction vs conventional extraction of myrtle leaves and berries: Comparison of antioxidant activity and identification of bioactive compounds. J. Supercrit. Fluids 2016, 113, 1–9. [Google Scholar] [CrossRef]
  10. Berka-Zougali, B.; Ferhat, M.A.; Hassani, A.; Chemat, F.; Allaf, K.S. Comparative Study of Essential Oils Extracted from Algerian Myrtus communis L. Leaves Using Microwaves and Hydrodistillation. Int. J. Mol. Sci. 2012, 13, 4673–4695. [Google Scholar] [CrossRef] [Green Version]
  11. Fadil, M.; Farah, A.; Ihssane, B.; Haloui, T.; Lebrazi, S.; Rachiq, S. Intrapopulation variability of Myrtus communis L. growing in Morocco: Chemometric investigation and antibacterial activity. J. Appl. Res. Med. Aromat. Plants 2017, 7, 35–40. [Google Scholar] [CrossRef]
  12. Wannes, W.A.; Mhamdi, B.; Sriti, J.; Marzouk, B. Changes in Essential Oil Composition of Tunisian Myrtus communis var. italica L. During Its Vegetative Cycle. J. Essent. Oil Res. 2010, 22, 13–18. [Google Scholar] [CrossRef]
  13. David, F.; Devos, C.; Sandra, P. Classical two-dimensional GC combined with mass spectrometry. LCGC Eur. 2006, 19, 602–616. [Google Scholar] [CrossRef]
  14. Amaral, M.S.S.; Marriott, P. The Blossoming of Technology for the Analysis of Complex Aroma Bouquets—A Review on Flavour and Odorant Multidimensional and Comprehensive Gas Chromatography Applications. Molecules 2019, 24, 2080. [Google Scholar] [CrossRef] [Green Version]
  15. Mondello, L.; Casilli, A.; Tranchida, P.Q.; Sciarrone, D.; Dugo, P.; Dugo, G. Analysis of Allergens in Fragrances using Multiple Heart-cut Multidimensional Gas Chromatography–Mass Spectrometry. LCGC Eur. 2008, 21, 130–137. [Google Scholar]
  16. Dong, G.; Bai, X.; Aimila, A.; Aisa, H.A.; Maiwulanjiang, M. Study on Lavender Essential Oil Chemical Compositions by GC-MS and Improved pGC. Molecules 2020, 25, 3166. [Google Scholar] [CrossRef]
  17. Li, Y.; Dong, G.; Bai, X.; Aimila, A.; Bai, X.; Maiwulanjiang, M.; Aisa, H.A. Separation and qualitative study of Ruta graveolens L. essential oil components by prep-GC. GC-QTOF-MS and NMR. Nat. Prod. Res. 2020, 35, 4202–4205. [Google Scholar] [CrossRef]
  18. Rahmani, R.; Andersson, F.; Andersson, M.N.; Yuvaraj, J.K.; Anderbrant, O.; Hedenström, E. Identification of sesquisabinene B in carrot (Daucus carota L.) leaves as a compound electrophysiologically active to the carrot psyllid (Trioza apicalis Förster). Chemoecology 2019, 29, 103–110. [Google Scholar] [CrossRef] [Green Version]
  19. Eyres, G.T.; Urban, S.; Morrison, P.D.; Marriott, P.J. Application of microscale-preparative multidimensional gas chromatography with nuclear magnetic resonance spectroscopy for identification of pure methylnaphthalenes from crude oils. J. Chromatogr. A 2008, 1215, 168–176. [Google Scholar] [CrossRef]
  20. Eyres, G.T.; Urban, S.; Morrison, P.D.; Dufour, J.P.; Marriott, P.J. Method for Small-Molecule Discovery Based on Microscale-Preparative Multidimensional Gas Chromatography Isolation with Nuclear Magnetic Resonance Spectroscopy. Anal. Chem. 2008, 80, 6293–6299. [Google Scholar] [CrossRef]
  21. Sciarrone, D.; Pantò, S.; Rotondo, A.; Tedone, L.; Tranchida, P.Q.; Dugo, P.; Mondello, L. Rapid collection and identification of a novel component from Clausena lansium Skeels leaves by means of three-dimensional preparative gas chromatography and nuclear magnetic resonance/infrared/mass spectrometric analysis. Anal. Chim. Acta 2013, 785, 119–125. [Google Scholar] [CrossRef]
  22. Sciarrone, D.; Pantò, S.; Tranchida, P.Q.; Dugo, P.; Mondello, L. Rapid Isolation of High Solute Amounts Using an Online Four-Dimensional Preparative System: Normal Phase-Liquid Chromatography Coupled to Methyl Siloxane–Ionic Liquid–Wax Phase Gas Chromatography. Anal. Chem. 2014, 86, 4295–4301. [Google Scholar] [CrossRef]
  23. Sciarrone, D.; Pantò, S.; Donato, P.; Mondello, L. Improving the productivity of a multidimensional chromatographic preparative system by collecting pure chemicals after each of three chromatographic dimensions. J. Chromatogr. A 2016, 1475, 80–85. [Google Scholar] [CrossRef]
  24. Sciarrone, D.; Giuffrida, D.; Rotondo, A.; Micalizzi, G.; Zoccali, M.; Pantò, S.; Donato, P.; Rodrigues-das-Dores, R.G.; Mondello, L. Quali-quantitative characterization of the volatile constituents in Cordia verbenacea D.C. essential oil exploiting advanced chromatographic approaches and nuclear magnetic resonance analysis. J. Chromatogr. A 2017, 1524, 246–253. [Google Scholar] [CrossRef]
  25. Sciarrone, D.; Schepis, A.; De Grazia, G.; Rotondo, A.; Alibrando, F.; Cipriano, R.R.; Bizzo, H.; Deschamps, C.; Sidisky, L.M.; Mondello, L. Collection and identification of an unknown component from Eugenia uniflora essential oil exploiting a multidimensional preparative three-GC system employing apolar, mid-polar and ionic liquid stationary phases. Faraday Discuss. 2019, 218, 101–114. [Google Scholar] [CrossRef]
  26. Sciarrone, D.; Panto, S.; Ragonese, C.; Tranchida, P.Q.; Dugo, P.; Mondello, L. Increasing the Isolated Quantities and Purities of Volatile Compounds by Using a Triple Deans-Switch Multidimensional Preparative Gas Chromatographic System with an Apolar-Wax-Ionic Liquid Stationary-Phase Combination. Anal. Chem. 2012, 84, 7092–7098. [Google Scholar] [CrossRef]
  27. Rotondo, A.; Ettari, R.; Zappalà, M.; De Micheli, C.; Rotondo, E. NMR characterization and conformational analysis of a potent papain-family cathepsin L-like cysteine protease inhibitor with different behaviour in polar and apolar media. J. Mol. Struct. 2014, 1076, 337–343. [Google Scholar] [CrossRef]
  28. Rotondo, A.; Ettari, R.; Grasso, S.; Zappalà, M. NMR conformational analysis in solution of a potent class of cysteine proteases inhibitors. Struct. Chem. 2015, 26, 943–950. [Google Scholar] [CrossRef]
  29. Farah, A.; Afifi, A.; Fechtal, M.; Chhen, A.; Satrani, B.; Talbi, M.; Chaouch, A. Fractional distillation effect on the chemical composition of Moroccan myrtle (Myrtus communis L.) essential oils. Flavour Fragr. J. 2006, 21, 351–354. [Google Scholar] [CrossRef]
  30. Weyerstahl, P.; Marschall, H.; Rustaiyan, A. Constituents of the Essential Oil of Myrtus communis L. from Iran. Flavour Fragr. J. 1994, 9, 333. [Google Scholar] [CrossRef]
  31. Paolini, J.; Leandri, J.C.; Desjobert, J.-M.; Barboni, T.; Costa, J. Comparison of liquid–liquid extraction with headspace methods for the characterization of volatile fractions of commercial hydrolats from typically Mediterranean species. J. Chromatogr. A 2008, 1193, 37–49. [Google Scholar] [CrossRef] [PubMed]
  32. Salerno, T.M.G.; Donato, P.; Frison, G.; Zamengo, L.; Mondello, L. Gas Chromatography-Fourier Transform Infrared Spectroscopy for Unambiguous Determination of Illicit Drugs: A Proof of Concept. Front. Chem. 2020, 8, 624. [Google Scholar] [CrossRef] [PubMed]
  33. Frison, G.; Zancanaro, F.; Frasson, S.; Quadretti, L.; Agnati, M.; Vlassich, F.; Gagliardi, G.; Salerno, T.M.G.; Donato, P.; Mondello, L. Analytical Characterization of 3-MeO-PCP and 3-MMC in Seized Products and Biosamples: The Role of LC-HRAM-Orbitrap-MS and Solid Deposition GC-FTIR. Front. Chem. 2021, 8, 618339. [Google Scholar] [CrossRef]
  34. Salerno, T.M.G.; Coppolino, C.; Donato, P.; Mondello, L. The online coupling of liquid chromatography to Fourier transform infrared spectroscopy using a solute-deposition interface: A proof of concept. Anal. Bioanal. Chem. 2022, 414, 703–712. [Google Scholar] [CrossRef] [PubMed]
  35. Neves, A.; Marto, J.; Duarte, A.; Gonçalves, L.M.; Pinto, P.; Figueiredo, A.C.; Ribeiro, H.M. Characterization of Portuguese Thymbra capitata, Thymus caespititius and Myrtus communis essential oils in topical formulations. Flavour Fragr. J. 2017, 32, 392–402. [Google Scholar] [CrossRef]
  36. Liu, H.; Huo, L.; Yang, B.; Yuan, Y.; Zhang, W.; Xu, Z.; Qiu, S.; Tan, H. Biomimetic-Inspired Syntheses of Myrtucommuacetalone and Myrtucommulone. J. Org. Lett. 2017, 19, 4786–4789. [Google Scholar] [CrossRef]
Figure 1. Scheme of the preparative multidimensional GC system.
Separations 09 00202 g001
Figure 2. GC-MS chromatograms of M. communis L. essential oil (upper trace) and hydrosol extract (lower trace). For peak identification, refer to Table 1 (the unknown compound is labeled in red).
Separations 09 00202 g002
Figure 3. Prep-MDGC stand-by (black trace) and cut (pink trace) chromatograms of M. communis L. hydrosol extract relative to the first (1D), second (2D), and third dimension (3D).
Separations 09 00202 g003
Figure 4. GC-FID chromatogram of the target compound isolated from M. communis L. hydrosol extract.
Separations 09 00202 g004
Figure 5. Solid phase GC-FTIR spectrum of the target compound.
Separations 09 00202 g005
Figure 6. (a) 1H-NMR spectrum with the related assignment; (b) 1H-13C (HSQC) enlightening the presence of the hydrogen-connected carbon atoms; (c) 13C{1H}-HMBC spectrum detecting the carbon atoms and the related connectivity also represented in the molecular diagram.
Separations 09 00202 g006aSeparations 09 00202 g006b
Figure 7. Molecular drawing with the atom-labelling scheme used for the assignment, according to the nomenclature rules.
Separations 09 00202 g007
Table 1. VOCs quali-quantitative profile of M. communis L. leaves essential oil and hydrosol extracts.
IDCompoundsLRItheorLRIexpEssential OilLRIexpHydrosol
1Isobutyl isobutyrate9139120.649120.15
2α-Thujene9279250.19--
3α-Pinene93393414.619331.75
4Camphene9539480.08--
5β-Pinene9789770.519770.05
66-methyl-Hept-5-en-2-one986--9840.07
7trans-5-Isopropenyl-2-methyl-2-vinyl-tetrahydrofuran9899900.139900.14
8Myrcene9919890.04--
9isobutyl 2-methyl Butyrate100210020.5710020.13
10cis-dehydro-Linalool oxide100610060.1910060.12
11δ-3-Carene100910090.08--
12Isopentyl isobutyrate101410150.2310140.04
13p-Cymene102510260.6810250.08
14Limonene103010293.5410291.03
15Eucalyptol1032103527.25103322.46
16Benzyl alcohol1040--10360.91
17trans-β-Ocimene104610460.08--
18γ-Terpinene105810580.09--
19cis-Linalool oxide1069--10700.71
20m-Cresol1073--10780.04
21trans-Linalool oxide1086--10860.60
22Terpinolene108610860.11--
23p-Cymenene109310920.07--
24Linalool110111014.9411014.81
253-methylbutyl-2-methyl-Butyrate110411031.24--
26trans-p-Mentha-2,8-dien-1-ol1122--11230.04
27Fenchyl alcohol112311200.0511200.09
28α-Campholenal1125--11270.03
29Limona ketone1131--11320.04
30cis-Limonene oxide113411340.05--
31cis-p-Mentha-2,8-dien-1-ol1138--11370.07
32Nopinone1139--11400.06
33trans-Pinocarveol114111420.3411420.84
34trans-Verbenol114511480.09--
35cis-β-Terpineol1149--11500.15
36Camphene hydrate1156 11560.08
37Menthone115811570.04--
38Pinocarvone116411640.0611630.04
39δ-Terpineol117011710.2411710.98
40Borneol117311730.0611730.15
41trans-Linalool oxide (pyranoid)11741176-11760.15
42Terpinen-4-ol118411810.5811811.58
43α-Terpineol119511987.14120022.74
44Myrtenol120211992.1412013.85
45Verbenone1208--12100.13
46Fenchyl acetate121912180.04--
47trans-Carveol122312220.1012220.67
48cis-p-Mentha-1(7),8-dien-2-ol123012300.0612320.43
49cis-Carveol1232--12350.11
50Pulegone124112400.6312402.02
51Linalyl acetate125012500.20--
52Geraniol125512530.6812532.59
53Geranial1268--12690.05
54trans-Pinocarvyl acetate129612960.6512960.18
55Myrtenyl acetate1324132715.9613275.16
56α-Terpenyl acetate134913481.3913470.43
57cis-Geranyl acetate136113600.15--
58α-Copaene137513760.10--
59trans-Geranyl acetate138013794.2213781.22
60trans-Myrtanol acetate138713850.32--
61β-Elemene139013900.12--
62Methyl eugenol140314033.3314058.50
63β-Caryophyllene142414201.1114190.17
64Perillyl acetate143514360.06--
65α-Humulene145414560.47--
66β-Santalene145914590.05--
67Myrtenyl isobutyrate146314630.34--
68β-Selinene149214890.24--
69α-Selinene150114970.14--
70Geranyl isobutyrate150715080.42--
71Unknown-15150.7815157.29
72Elemicin1548--15500.53
73Caryophyllene oxide158715830.6515830.26
74Geranyl 2-methylbutyrate159615970.19--
75Humulene epoxide II161316120.2416110.07
TOT 98.60 93.79
LRI exp, calculated on SLB-5ms column; LRI theor, reported in the commercial MS library FFNSC 4.0 (Shimadzu Europa).
Table 2. Label, calculated, and assigned chemical shifts for any 1H and 13C of the molecule with the related heteronuclear connections.
13C Label13C ShiftType1H Label1H Shift13C
Calc Shift
1H
Calc Shift
13C Count1H Count1H
HMBC
13C
HMBC
C 290.8C 87.93 8, 8′, 3
C 339.6CH2H 32.74937.732.706128, 8′8, 8′, 2, 3′, 7′
C 3′110C 112.96 3
C 4195C 193.51 9′, 9
C 555C 55.74 9′, 9
C 6214C 210.81 9′, 9, 10′, 10
C 745.3C 45.06 10′, 10
C 7′177C 171.22 10′, 10, 3
C 828.1CH3H 81.48228.391.4112633, 2
C 924.6CH3H 91.35121.251.33526 5, 4, 6
C 1024.2CH3H 101.39123.291.34826 7, 7′, 6
Publisher’s Note: MDPI stays neutral with regard to jurisdictional claims in published maps and institutional affiliations.

