Article

Comparative Study of the Selective Sorption of Organic Dyes on Inorganic Materials—A Cost-Effective Method for Waste Treatment in Educational and Small Research Laboratories

by
Anifat Adenike Bankole
1,
Vijo Poulose
1,
Tholkappiyan Ramachandran
2,
Fathalla Hamed
2 and
Thies Thiemann
1,*
1
Department of Chemistry, College of Science, United Arab Emirates University, Al Ain P.O. Box 15551, United Arab Emirates
2
Department of Physics, College of Science, United Arab Emirates University, Al Ain P.O. Box 15551, United Arab Emirates
*
Author to whom correspondence should be addressed.
Separations 2022, 9(6), 144; https://doi.org/10.3390/separations9060144
Submission received: 26 April 2022 / Revised: 16 May 2022 / Accepted: 30 May 2022 / Published: 7 June 2022

Abstract

:
Educational and research laboratories often produce relatively small amounts of highly diverse organic wastes. Treating waste can contribute significantly to the cost of running laboratories. This study introduced a simple and economical waste management system such that readily available used chromatography-grade inorganic materials, such as silica and alumina (basic and acidic), are utilized to treat remnant dye solutions and solution wastes from educational and small research laboratories. To recycle the adsorbents, they were heated to 600 °C, where the adsorbates were combusted. The results showed that acidic alumina is an effective adsorbent material for azo dyes and anionic dyes/stains, as well as textile dyes, with a 98 to 100% removal efficiency. Furthermore, alumina and silica possess excellent regeneration properties, where the dye removal efficiency of the materials was retained after regeneration at 600 °C. The adsorption properties of the materials were compared with those of aliginite and activated biomass from coffee grounds. Kinetic and thermodynamic studies of the sorption processes on the different materials were carried out. Overall, the inorganic materials used were efficient at removing contaminating remnant organic dyes stemming from educational and small research laboratories.

1. Introduction

Waste from educational and small research laboratories is of great concern, especially when such waste is toxic and when there are not enough resources to treat the waste appropriately [1,2]. While the number of chemical wastes generated by such laboratories is usually much smaller in comparison to chemical wastes generated in industrial processes, the waste can be quite diverse, sometimes numbering in the hundreds of different compounds per year. The wastes can incorporate both inorganic and organic compounds. Inorganic materials are often employed as stationary phases in the column chromatographic separations of reaction mixtures in organic synthetic chemistry. These are frequently declared as waste after use and not recycled. In most countries, materials that have chemical substances adsorbed must be managed as hazardous chemical waste. In terms of both financial and environmental costs, both the waste disposal of such inorganic materials and the purchase of new materials are costly. In this case, the best option is to recycle or reuse the waste products generated [3], reducing the waste that needs to be disposed of [1,4]. Organic dyes are a class of substances that are found regularly as wastes from educational and small research laboratories, where they are used in staining processes and as indicators. Most times, remnant dye solutions end up in the sink and often directly enter the municipal sewage system. The municipal wastewater treatment does not always lead to the complete degradation of dye wastes and the possible presence of these colored organic pollutants in the effluents from wastewater treatment systems poses a threat to the aquatic environment and is harmful to humans as well [5]. For small educational and research laboratories, and especially for those with a small budget, it is pertinent to consider simple waste management schemes that address the reduction of waste. For the removal of dyes from wastewater, a variety of treatment methods were used, including filtration, reverse osmosis, oxidation methods, and adsorption [6,7,8,9,10,11,12,13,14,15,16]. However, most of these approaches necessitate large amounts of reagents and consume an appreciable amount of energy, in addition to producing a large amount of secondary waste [17,18]. Most of these approaches are not suitable for small and educational research laboratories with a small budget. Among the mentioned approaches, the adsorption of dyes on inexpensive and reliable solid supports was proposed as an easy and cost-effective method for their removal from wastewater [19,20,21,22]. Many adsorbents, including carbon-containing adsorbents, such as biowaste-derived materials [23], were used in practice for such purposes. Following waste adsorption, either the carbon-based adsorbents must be considered hazardous wastes themselves and disposed of in a landfill or the adsorbed chemical content must be desorbed in a separate process. This, in turn, results in agreeably smaller volumes of secondary waste. The use of inorganic-based adsorbents has the advantage that, in principle, they can be recycled thermally [3,14]. In addition, many inorganic sorbents possess high surface areas. Inorganic materials that offer themselves as adsorbents include silicon- and aluminum-based materials, such as silica and alumina, especially when they are already present in educational/small research laboratories, for instance, as stationary phases in the column chromatographic separation of organic reaction mixtures. Silica gel, with a large surface area and a large pore volume, is known to be a good adsorbent for dyes [14]. Aluminum oxide is another low-cost adsorbent with a high decontamination efficiency [6,12,24,25]. Another material that could potentially offer itself as adsorbent is alginite, which is a natural complex soil aggregate consisting of biomass fossil, clay, and calcium carbonate. Alginite is mined in a number of countries and was reported to be a good adsorbent of heavy metals in wastewater [26]. Recently, alginite was discovered to be an effective de-emulsifier of oil–water emulsions [27].
While most studies focus on the use of synthesized inorganic materials or surface-modified adsorbent materials, to the best of our knowledge, there has been no study on the use of chromatography grade inorganic materials that accumulate in the laboratory as wastes, e.g., from chromatographic separations. Therefore, here, we investigated different alumina and silica gel materials, pristine and used, as adsorbents for aqueous dye solutions, aqueous dye mixtures, and aqueous dye remnants as components of typical aqueous laboratory wastes. Two other solid sorbent materials were studied in comparison, namely, aliginite as an organic–inorganic hybrid material and coffee grounds, which were activated with aqueous phosphoric acid as an example of a biowaste-derived, mostly organic material.
The study included 18 organic dyes/stains commonly used in experimental and educational laboratories, in addition to two commercially used reactive textile dyes. The effects of the operating parameters, such as initial concentration of dyes, contact time, pH, and sorbent dosage, were explored. To understand the adsorption process, the kinetic and thermodynamic parameters were examined. All sorbent materials were recycled thermally at 600 °C, where the reuse of the materials in the adsorption processes was studied. Overall, the investigation constituted the development of a simple, cost-effective treatment scheme for wastes from educational and small research laboratories. The study is seen as a continuation of the investigation by Wahshi et al. (2018 and 2019) of our group [3,14].

2. Materials and Methods

2.1. Materials

Silica gel (60–120 mesh, BDH, named coarse silica throughout the text), silica gel (230–400 mesh, Sigma Aldrich, Steinheim, Germany), alumina (aluminum oxide active, acidic, Brockmann grade 1, BDH; alumina oxide active, basic, Brockmann grade 1, BDH), and alginite (Terra Natural Resources GmbH, Bonn, Germany) were used as purchased. Silica gel (230–400 mesh, Sigma-Aldrich, named used silica gel throughout the text) was used for chromatography to separate organic reaction mixtures, especially from Wittig-olefination reactions and Appel-type reactions, and recycled thermally before utilizing it as an adsorbent material [14]. Table 1 contains the list of dyes/stains used in this study, many of which are commonly utilized in research and educational laboratories. In addition, there are two Novacron® reactive textile dyes. All the compounds were used without further purification.

2.2. Stock Solutions

Aqueous stock solutions (50 ppm) of each dye were prepared, where different concentrations of the dyes (45 ppm, 40 ppm, 30 ppm, 20 ppm, 10 ppm, 8 ppm, 6 ppm, 5 ppm, 4 ppm, 3 ppm, 2 ppm, and 1 ppm) were made via appropriate dilution of the stock solution. The 50 ppm of phenol solution was also prepared by diluting 100 ppm of the stock solution.

2.3. Preparation of Activated Carbon from Coffee Grounds (ACCG)

Coffee grounds were initially dried for 7 h to remove the moisture. Then, 100 g of the dried coffee ground were mixed at a ratio of 1 to 3 with a 10 M aq. solution of phosphoric acid. Then, the mixture was stirred for 24 h at room temperature and subsequently filtered through a glass filter. Adequate distilled water was used to wash the coffee grounds to remove the remaining acid. After being washed, the leftover activated carbon was dried in an oven for 48 h at 37 °C to yield 74.25 g of product.

2.4. Measurement and Characterization of the Adsorbent Materials

Fourier transform infrared (FT-IR) spectroscopy was used to identify the functional surface groups of the adsorbent materials before adsorption and after recycling. Infrared spectra of the sorbent materials as KBr pellets were taken with a PerkinElmer Spectrum 2 and a Thermo Nicolet Nexus 670 FT-IR spectrometer. The crystal structure of the adsorbent material was investigated using a SHIMADZU Lab X-XRD-6100 Powder X-ray diffractometer unit. The XRD unit was operated at 30 kV with a current intensity of 30 mA. The XRD profiles were recorded over a 2θ range of 20° to 80° with a step size of 0.02°/min using Cu Kα radiation (1.541 Å) at room temperature. The XRD profile was matched against the International Center for Diffraction Data (ICDD) PDF-2 database. Microstructural features of the samples before adsorption and after regeneration were studied with a JEOL JSM-6010LA scanning electron microscope (SEM, Akishima, Tokyo, Japan). The sample was placed on a brass stub with the help of a double-sided adhesive carbon tape and sputtered with gold up to a 15 nm thickness using a Cressington 108 auto sputter coater and the thickness controller MTM-20. Fields of the sample were inspected under a high vacuum (ULVAC KIKO lnc., Model: G-100DB, Miyazaki, Japan) and micrographs of the sample were recorded using InTouchScope JSM-6010 Version 2 software. The elemental composition analysis and mapping were carried out with a JEOL-SEM equipped with an energy dispersive X-ray detector (EDS). BET surface analysis was carried out by measuring the N2 adsorption–desorption isotherms using a Micromeritics Tristar II Plus at 77 K with liquid N2 after degassing at 350 °C for 3 h under vacuum.

2.5. Adsorption Experiments

Optimal adsorption conditions for each dye on different adsorbent materials were investigated through a series of batch adsorption experiments, where the effect of the initial dye concentration, contact time, solution pH, and temperature was investigated. Here, 0.5 g of adsorbent was used in all adsorption experiments. The mixture was stirred for a maximum time of 30 min with a WiseStir 20MHD magnetic stirrer. At time intervals of 5 min, a sample was collected and centrifuged (Beckman model TJ-6, at 2000 rpm for 5 min). The supernatant was filtered. UV-VIS spectroscopy (Cary 50 spectrophotometer) was used to determine the residual dye concentration, utilizing the value of absorbance of the solution at λmax of the individual dye, as listed in Table 1. Each adsorption experiment process was repeated 3 to 4 times to ascertain the data obtained and the repeatability of our experimental process. The dye adsorption capacity (qe) of the sorbent materials and the percentage removal of the dyes were determined using Equations (1) and (2), respectively:
Q e = ( C o C e W   ) V  
%   Removal = C o C e   C o   × 100
where Qe is the amount of dye adsorbed at equilibrium (mg/g), co and ce are the initial and final dye concentrations (mg/L), V (L) is the sample volume, and W (g) is the adsorbent mass.

2.6. Selective Adsorption of Dyes from Mixed-Dye Solutions

Here, two solutions of mixed dyes were prepared. The first mixture of dyes (solution A) contained 10 mL (50 ppm) each of methysulphonazo III, chromotrope FB, Rose Bengal, Fast green, bromophenol purple, Reactive Novacron® yellow, Reactive Novacron® cherry red, and phenol red. The second mixture (solution B) contained 25 mL (50 ppm) of methyl green and 25 mL (50 ppm) of chromotrope FB. Acidic alumina (0.8 g) was used in the adsorption study of the first mixture, while 0.5 g of acidic alumina and 0.5 g of used silica gel were used separately for the adsorption study of the second dye mixture.

2.7. Adsorption Kinetics Studies

Adsorption kinetics data are very important for understanding adsorption rates and adsorption mechanisms, as well as estimating the rate-controlling step [28]. Adsorption kinetic models express a statistical correlation between the absorbate adsorbed and adsorption time. In this study, the kinetic data of dyes were fit to three different kinetic models: pseudo-first-order, pseudo-second-order, and intra-particle diffusion models. The best-fit model was determined by conducting linear regression analysis on the linear form of the kinetic equations. The analysis of the adsorption data allowed for the models to be evaluated. Below is a summary of the chosen models describing the adsorption kinetic data.

2.7.1. Pseudo-First-Order Kinetic Model

The pseudo-first-order model assumes that the rate at which a solute is adsorbed over time is proportional to the difference between the saturation concentration and the amount adsorbed [29]. This model is expressed by the following equation:
log ( Q e Q t ) = log Q e K 1 2.303 t

2.7.2. Pseudo-Second-Order Kinetic Model

The pseudo-second-order kinetic model considers a rate-limiting stage, which states that chemical adsorption involves sharing or exchanging electrons [30]. The model is expressed by the following equation:
t Q t = 1 k 2 Q e 2 + 1 Q e t
where Qe and Qt (mg/g) are the quantities of adsorbed molecules at equilibrium and at time t, k1 is the pseudo-first-order rate constant (min−1), and k2 is the pseudo-second-order rate constant (g/mg·min).

2.7.3. Intra-Particle Diffusion Model

The intra-particle diffusion model explains the diffusion mechanism during the adsorption process. This model is used for the determination of the rate-controlling step for an adsorption process [28]. The model is expressed using Equation (5), shown below:
Q t = k p t 1 / 2 + C
where Qt is the adsorption capacity a time t (mg/g) and kp is the intra-particle diffusion rate constant (mg/g#xB7;min1/2). C is the intercept of the plot of Qt vs. t1/2. A higher C value corresponds to a greater impact on the limiting boundary layer. The value of R2 is used to determine whether the adsorption process is controlled by an intra-particle diffusion process or not.

2.8. Thermodynamic Studies

Thermodynamic parameters give full details on the energetic changes associated with adsorption. Therefore, these parameters must be accurately evaluated. The study of thermodynamic parameters provides insights into the adsorption behavior of the adsorbate toward adsorbent materials. The important thermodynamic parameters, such as the standard Gibbs free energy (ΔG), standard entropy change (ΔS), and the standard enthalpy change (ΔH), are calculated using the following Equations (6) and (7).
Δ G = Δ H T Δ S  
l n K L = Δ H R T + Δ S R
R is the universal gas constant (8.314 J/mol·K), T is the temperature in kelvins (K) and KL is derived from the value of qe/Ce. ΔH and ΔS are calculated from the slope and intercept values of the plot of lnKL vs. 1/T (plot not shown).

2.9. Desorption and Regeneration of Sorbent Materials

In this study, the adsorption of all dyes and the regeneration of the dye-loaded sorbent materials were performed five times to assess the sorbent’s reusability. The loaded sorbent was filtered and transferred into a crucible. The crucible was then heated in a Carbolite electric oven (ELF 11-6) at 600 °C for 2 h, whereby the adsorbed dye was combusted, and we were left with pure sorbent material. The regenerated sorbent material was used for another adsorption study. This process was repeated five times.

3. Results

3.1. General Experimental Overview

The successful treatment of wastewater containing organic dye remnants was discovered to follow specific patterns. A clear solution could be obtained from an aqueous solution of 200 mL (50 ppm) of methyl violet when used silica gel (2.5 g) was added, and the subsequent mixture was stirred for 5 min at room temperature, during which time, all the dye was adsorbed (Figure 1A). A large amount of dye solution could be treated in a similar pattern using the same ratio of adsorbent to the volume of the dye solution to be treated. To treat 1000 mL of an azo dye or anionic dye solution, 10 g of acidic alumina was required, while for a similar quantity of a cationic dye, 10 g of used silica gel was required.

3.2. Characterization of the Adsorbent Materials

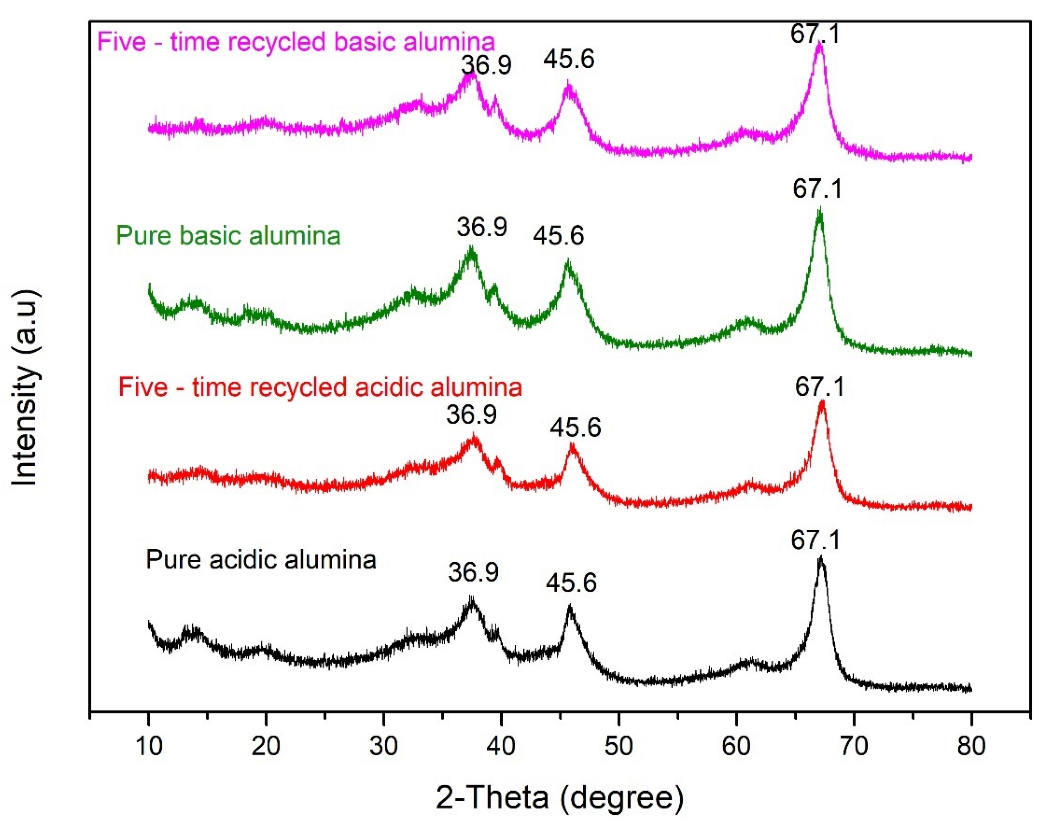
3.2.1. X-ray Diffraction

The X-ray diffraction pattern (XRD) of acidic alumina and basic alumina before the first adsorption and after five-time regeneration is given in Figure 2. It was discovered that all peaks found in the pure acidic alumina were retained after the five-time adsorption–desorption process. Furthermore, the XRD patterns of pristine basic alumina and basic alumina after five-time regeneration corresponded to each other. This shows that the sorbent materials showed no structural changes when heated to 600 °C. The broad peaks at 2-theta = 32.6°, 36.9°, 45.6°, and 67.1° were matched to single-phase aluminum oxide, XRD pattern JCPDS file no. 00-047-1770, and to that of acidic alumina [24].

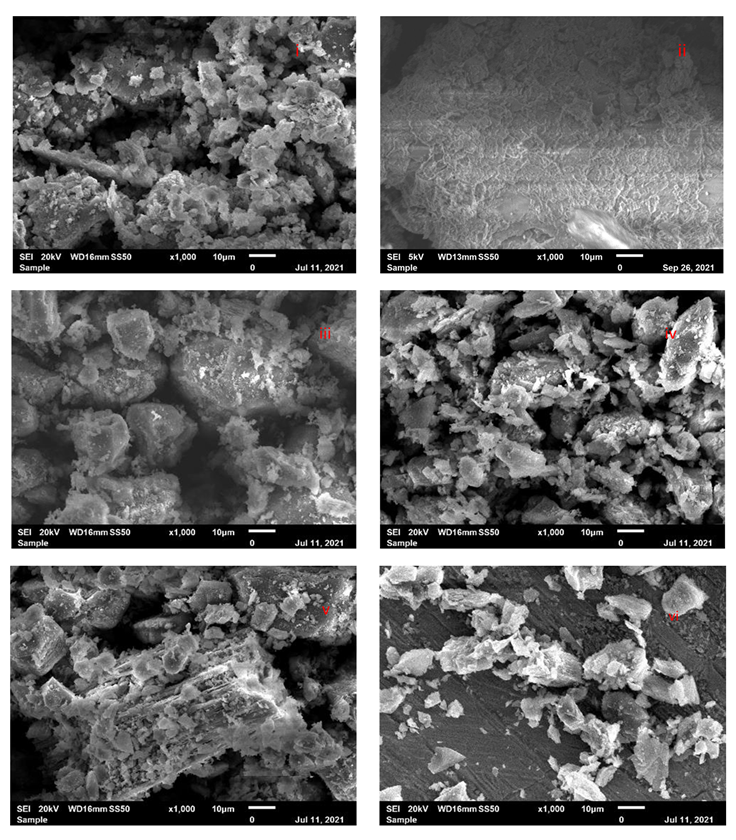
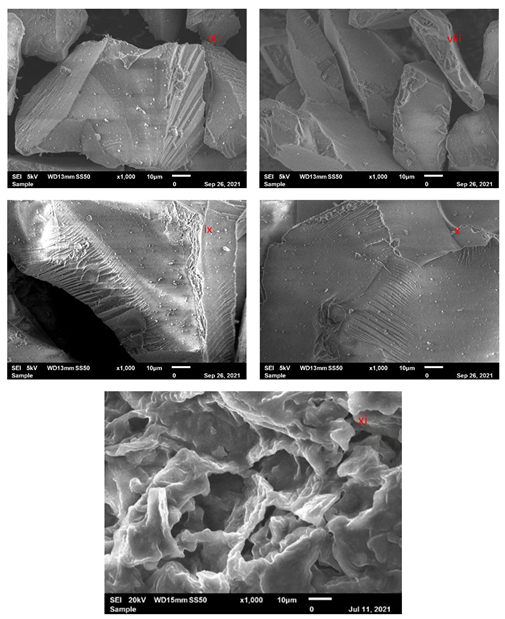
3.2.2. SEM Characterization of Adsorbent Material

The microgram images of all the adsorbent materials used in this study are shown in Figure 3. In general, the microimages of the sorbent materials before the first adsorption and after the five-time regeneration were used to investigate whether there were no changes in the sorbent materials that could affect their adsorption capacity after thermal treatment. In the SEM image of alginite before adsorption (Figure 3i), it appeared that the alginite was porous with a rough surface and included an agglomeration of smaller particles. However, for the recycled alginite (Figure 3ii), the surface morphology changed significantly with the first regeneration. This change in surface morphology can be viewed in Figure 3i,ii. The surfaces of both the acidic and basic alumina before the first adsorption and after the five-time regeneration (Figure 3iii–vi) were rough and no appreciable change in the morphology was noted. This could explain why there were little or no differences in the adsorption capacity of the pristine and the recycled acidic and basic alumina materials used. The surfaces of the used silica before adsorption (Figure 3vii) and after five-time regeneration (Figure 3viii), the surfaces of pristine coarse silica (Figure 3ix), and the one-time regenerated coarse silica (S1(x)) were all smooth. The surfaces of the activated coffee grounds before the first adsorption process were rough and showed flaky protuberances.
All the analyzed adsorbent materials displayed irregular shapes with edges that could be attributed to inorganic particles that are insoluble in water and have thermal or heat stability up to 100 °C in the case of activated coffee grounds and possibly alginite, and up to 600 °C for alumina (acidic and basic) and used silica.

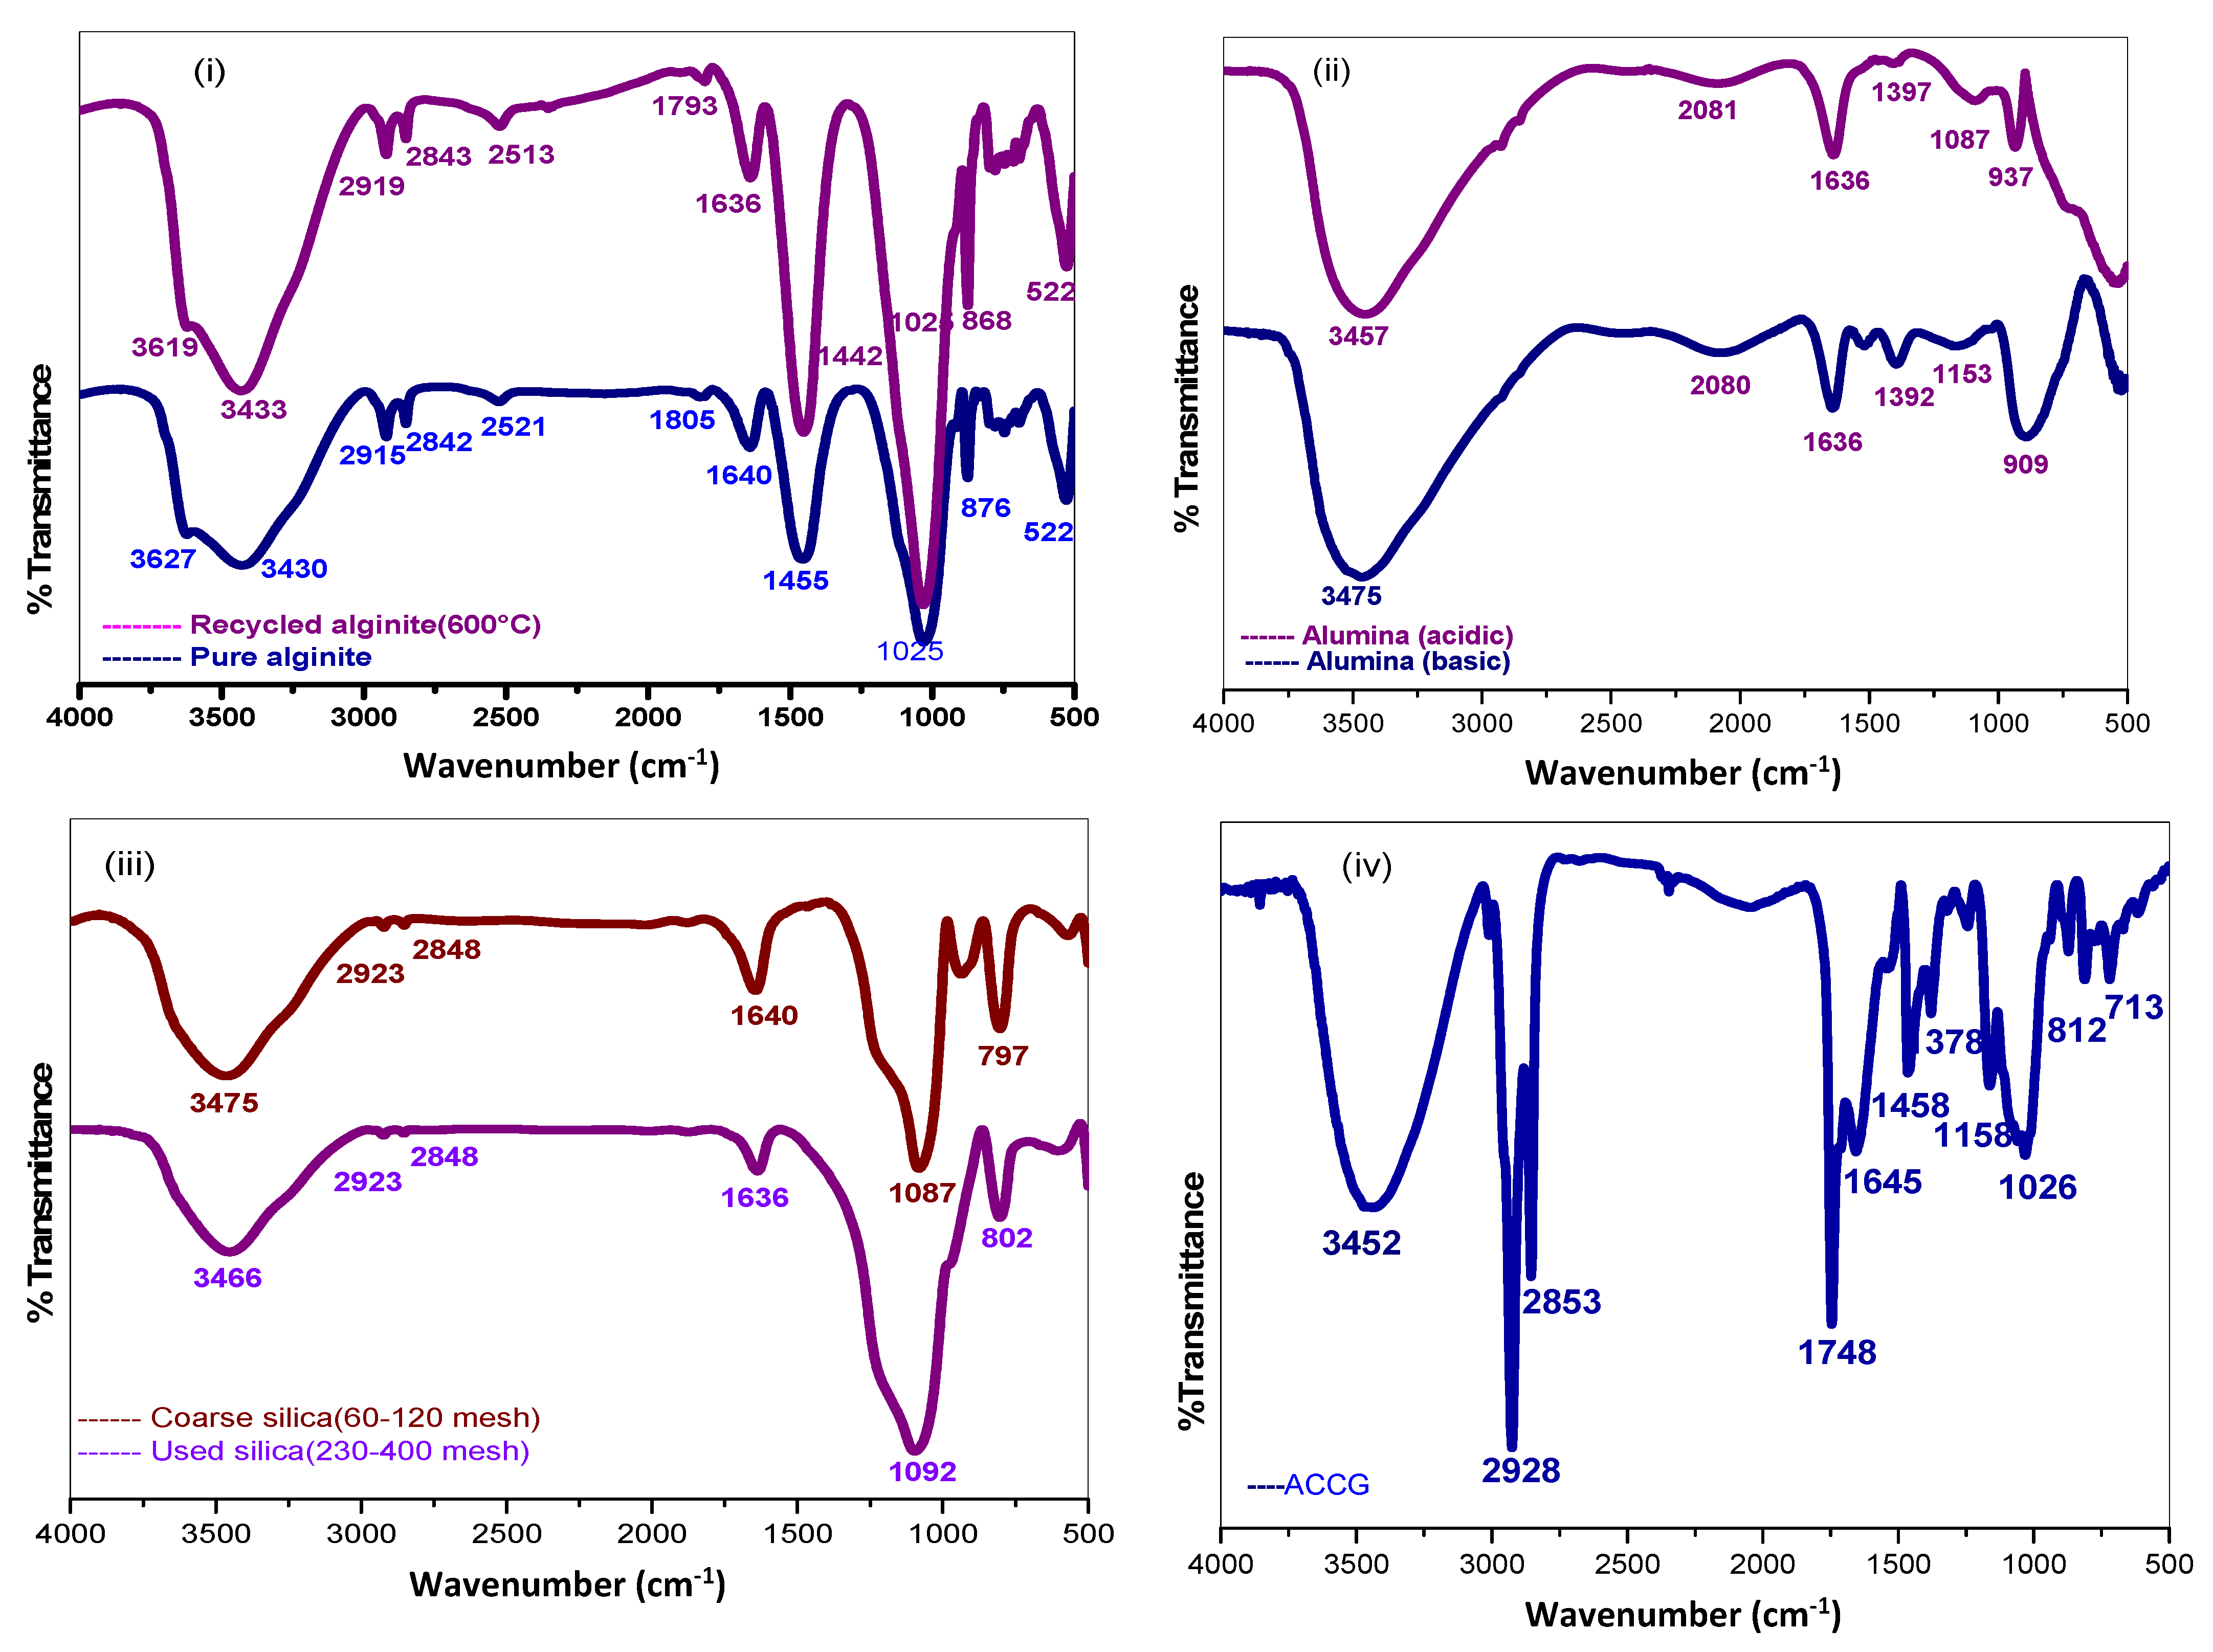
3.2.3. FT-IR Characterization of the Adsorbent Materials

To further understand the specific nature of the interactions between the adsorbent and the adsorbate, FT-IR spectra of the sorbents were analyzed. The FT-IR spectra obtained for the different adsorbent materials used for this study are shown in Figure 4. In the FT-IR spectra for pure alginite and recycled alginite Figure 4i, the infrared region of interest in this study were 876 cm−1 (pure alginite) and 868 cm−1 (recycled alginite), which were assigned to the out-of-plane bending of the C-H aromatic ring; 1025 cm−1 (both pure and recycled alginite) was attributed to the Si-O-Si stretching vibration; 1455 cm−1 (pure alginite) and 1442 cm−1 (recycled alginite) were attributed to the stretching vibration of the C=O conjugated system due to the carbonate content; 1640 (pure alginite) and 1636 cm−1 (recycled alginite) corresponded to physisorbed water molecules; 2521 cm−1 (pure alginite) and 2513 cm−1 (recycled alginite) were attributed to the dolomite content (high Mg-content calcite); and 2800–3000 cm−1 (i.e., 2521 cm−1 and 2842 cm−1 for pure alginite and 2513 cm−1 and 2843 cm−1 for recycled alginite) were attributed to the aliphatic CHx stretching region [31]. Some of the inband peaks within the fingerprint region of 700–800 cm−1 found in the pure alginite disappear after the first-time thermal regeneration, as shown in Figure 4i.
In the FT-IR spectral data for acidic alumina and basic alumina before the adsorption study Figure 4ii, the broad band at 3457 cm−1 for acidic alumina and 3475 cm−1 for basic alumina showed the characteristics of -OH stretching vibrations that were bonded to Al3+, indicating possibilities of an interaction of an adsorbate with the alumina as adsorbent. Moreover, the bands at 1636 cm−1, seen in the FT-IR spectra of both acidic alumina and basic alumina, corresponded to physisorbed water molecules. The bands at 1087 cm−1 (acidic alumina) and 1153 cm−1 (basic alumina) were attributed to the Al-O vibration [32], while the bands at 937 cm−1 (acidic alumina) and 909 cm−1 (basic alumina) were assigned to the bending vibration of the Al-O bond [33].
In the FT-IR spectra for coarse silica and used silica (Figure 4iii), the broad peak at 3466 cm−1 (coarse silica) and 3475 cm−1 (used silica) were attributed to the stretching vibration of Si-OH groups overlapping the -OH groups of physisorbed water molecules. The peaks at 1640 cm−1 (coarse silica) and 1636 (used silica) were both assigned to the bending vibration of the water molecule. The peaks at 1087 cm−1 (coarse silica) and 1092 cm−1 (used silica) were attributed to the stretching vibration mode of Si-O-Si [34,35,36,37].
In the FT-IR spectra for activated coffee grounds (Figure 4iv), the peaks between 713 cm−1 and 812 cm−1 could be attributed to N-H, O-H, and C-H bending vibrations. The peak at 1026 cm−1 was attributed to a C-O stretching vibration, for instance, within polysaccharides. The peaks between 1378 cm−1 and 1458 cm−1 could be attributed to C-O-H and NH bending vibrations, as well as to CH2 and CH3 deformation vibrations. The band at 1645 cm−1 was attributed to the -OH stretching vibration of the adsorbed water molecule, while the 1748 peak was attributed to the -C=O stretching vibration of esters and potentially carboxylic acids and keto compounds. The peak at 2853 was attributed to the CH stretching vibrations in, for instance, cellulose or aromatic methoxy groups or methylene groups. The broad band centered around 3452 cm−1 was attributed to the -OH stretching vibration of a possible combination of alcohol, phenol, and carboxylic acid OH groups, as well as of water molecules adsorbed on the surface of the activated coffee ground material [38,39].
The EDX elemental analysis data of the adsorbent material is attached in Supplementary Figure S1. The result shows that the dye molecules were completely burnt off during the thermal regeneration. There were little or no significant differences in the percentage by weight or atom of the elements present in the adsorbent material before adsorption and after five-time regeneration. For the alginite, the loss of carbon as a result of combustion correlates to the percentage mass gain of the non-volatile elements, such as the Al, Si, and Fe present in the material.
BET analyses were performed for the used silica gel, acidic alumina, and basic alumina. These three adsorbents were selected based on their regeneration efficiency. The surface area, pore size, and pore volume of the materials are listed in Table 2. The BET surface area of used silica gel increased by about 5%, that of acidic alumina decreased by 3.8% and that of basic alumina decreased by 4.9% after five-time regeneration. However, considering the number of times the sorbent materials were recycled, one can say that there were no significant differences between the values of the BET surface areas of the pure materials and the materials after five-time regeneration. The N2 adsorption–desorption isotherm linear plot and surface area vs. pore width plot of all the samples before and after adsorption are attached in Supplementary Figure S2.

3.3. Adsorption Studies

Adsorption studies on different adsorbent materials were conducted with the organic water-soluble dyes listed in Table 1 above. The adsorption capacity of dyes on acidic alumina was large for azo dyes, reactive textile dyes, and anionic dyes. The adsorption capacity of used silica gel was also large for cationic, anionic, and triphenylmethane dyes, while that of ACCG was smaller, e.g., when compared with that of used silica gel toward cationic dyes. The charge on the dye was assumed to be the influencing factor for the adsorption capacity. The adsorption behavior of the individual dye could be related to the type of substituent attached to the chromophore, which modified the adsorption properties. We could relate the good adsorption of sulphonate substituted dyes on acidic alumina to the interaction of the alumina -OH groups with the sulphonate group. On the other hand, silica gel, alginite, and ACCG adsorbed dyes with an amino group through electrostatic attraction. The variation in the adsorption capacity of a specific type of dye on acidic alumina, basic alumina, used silica, coarse silica, alginate, and ACCG might have been due to competition between the functional group retaining fractions of dye molecules and the free active site of a specific sorbent that attracts it, causing it to revert into a solution or by the desorption of molecules due to an increase in inter-particle collisions [40]. On the other hand, the no to little adsorption rate displayed by some adsorbent material for a particular dye molecule may be due to the difficulty encountered by a specific dye molecule in reaching active sites of the adsorbent material when such material is present in excess. The percentage removal of each dye on different sorbent materials is shown in Table 3.

3.4. Optimization Studies of Organic Pollutant Removal Using Adsorbent Material

3.4.1. Effect of Contact Time and Initial Concentration

After 30 min of contact time, the equilibrium removal was achieved for most of the dyes treated. Adsorption increased with an increase in adsorption time for all the dyes used. The rate of adsorption observed for coarse silica was initially small; however, with an adsorption time of 30 min to 1 h, a significant amount of the individual dyes was adsorbed. The effect of the initial concentration of all dyes used in the study was also studied from 15 ppm to 50 ppm on the different adsorbent materials. The adsorption capacity of the respective dye was found to depend on the initial concentration of the dye sample.

3.4.2. Effect of pH on the Adsorption of Dyes

An important parameter that influences the uptake of dyes by the adsorbent is pH. The effect of pH was illustrated with the reactive textile dye Novacron® yellow. Novacron® yellow was selected because it is a reactive textile dye that is frequently used. In typical wastewater, the pH of a solution is known to affect the selective adsorption of a dye on an adsorbent. Here, the removal of Novacron yellow® with an initial concentration of 20 ppm was carried out with the addition of 5 g of acidic alumina, where the percentage removal of the dye reached 93.12% at the acidic pH of 2.21. At pH 6.49, the percentage removal decreased to 88.44%, and at the basic pH of 11.78, the percentage removal of Novacron® yellow was only 17.19%. Therefore, acidic pH was most efficient for the removal of this particular dye with acidic alumina.

3.4.3. Effect of Sorbent Dosage on the Adsorption of Dyes

The effect of the sorbent dosage was tested with the adsorption of all dyes on all different adsorbent materials used in this study. It was confirmed that as the adsorbent dosage increased, the needed adsorption time decreased. The increase in removal rate could be related to an increase in available surface area and unoccupied binding sites on the sorbent added to the solution [41].

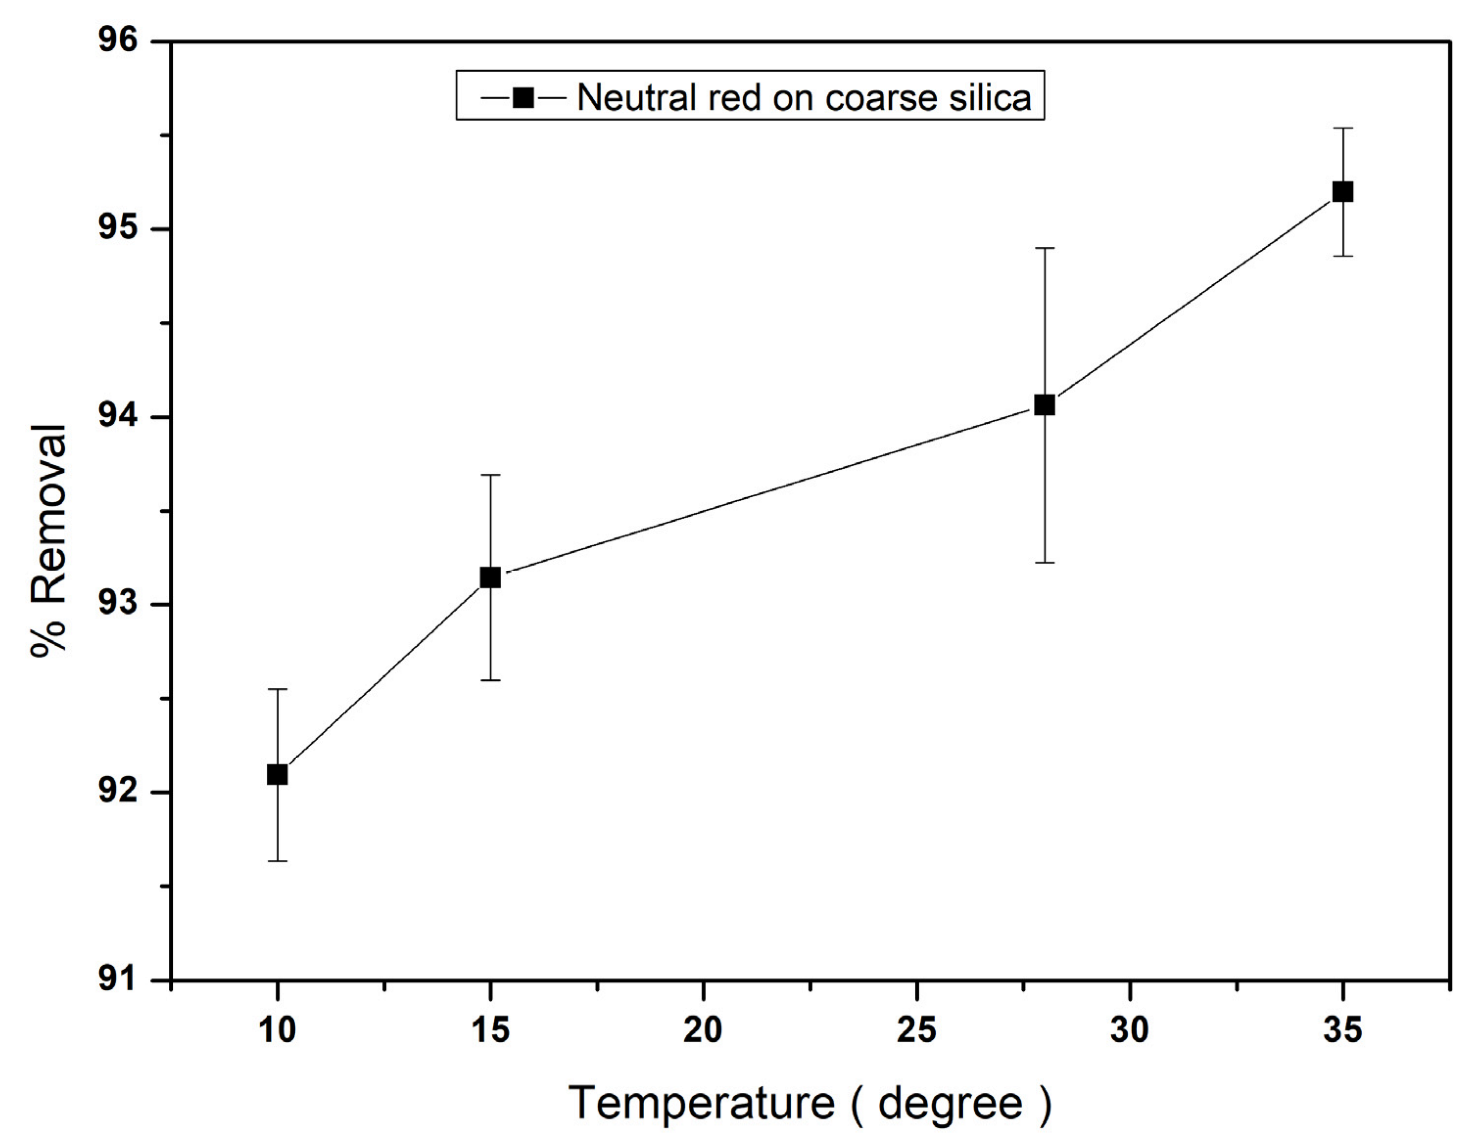
3.4.4. Effect of Temperature on the Adsorption of Dyes

An important factor in the adsorption process is temperature. Here, the effect of temperature was illustrated on the adsorption of neutral red dye on coarse silica. For this study, the dye neutral red was selected because it is among the most common dyes used for staining purposes in educational and research laboratories. Coarse silica takes longer to adsorb dye molecules and it has a relatively low adsorption capacity. For the other silica and alumina sorbent materials used in this study, it will be difficult to ascertain the behavior of the adsorption of dyes within a very short adsorption time of 5 min. As shown in Figure 5, the largest adsorption capacity of coarse silica and the highest percentage removal of neutral red were found to be at 35 °C (308 K). As the temperature increased from 283 K to 308 K the percentage removal of the neutral red dye increased. These findings could be related to the increase in collision efficiency between the auxochrome group (N+(CH3)2) of the neutral red and the coarse silica as the adsorbent. Additionally, the higher temperature tends to enhance the deprotonation of the adsorption functional group leading to more adsorption sites for the binding of the N+(CH3)2 [42].

3.5. Thermodynamic Analysis

Adsorption thermodynamic analysis can help to further explain the mechanisms involved in the adsorption of the sorbate on the sorbent material. The plot of lnKL vs. 1/T (plot not shown) gives the data listed in Table 4. Based on the same reason indicated for the effect of temperature on the adsorption of dyes, again, neutral red dye as the adsorbate and coarse silica as the adsorbent were used for this study. As listed in Table 4, the negative value of ΔG at all temperatures indicated that the adsorption process was spontaneous. The results obtained in this study are similar to that of the thermodynamic study of neutral red on a zirconium metal–organic framework [43] and the adsorption of neutral red onto halloysite nanotubes [15]. The absolute value of ΔG increased as the temperature increased. This suggested that the degree of spontaneity increased as the temperature increased. The value of ΔH at the temperature range was positive. This implied that the reaction between the neutral red dye and the surface of the adsorbent was endothermic. As the temperature rose, the result corresponded to an increase in adsorption capacity. Adsorption is often an exothermic reaction. However, the solvation ability of the auxochrome group (N+(CH3)2) of neutral red in water explains the reaction’s endothermic character. Because the adsorption processes occur in an aqueous environment comprising both dyes, as well as water molecules, it is necessary to desorb the water molecule to adsorb the dye. However, because water molecules have a lower molar volume than dye molecules, a significant number of water molecules are desorbed from the sorbent surface for every sorbate molecule that is adsorbed, for which energy is needed. As a result, the entire chemical process becomes endothermic. Furthermore, there is an increase in randomness at the liquid–solid interface during the fixation of the adsorbate at the active site of the adsorbent as water molecules are released into the bulk solution. As a result, a positive value of ΔS (46.127 J/mol·K) was noted. Thus, the adsorption of neutral red was not an enthalpy-driven process but rather an entropy-driven one. Our findings are supported by the results from other researchers, as similar spontaneous adsorption processes, seen as the result of a negative value of ΔG, were noted to have a positive change in enthalpy ΔH and a positive change in entropy ΔS [15,43].

3.6. Activation Energy Studies

From the kinetic studies within the chosen temperature range for the adsorption of neutral red on coarse silica, the activation energy was derived from the Arrhenius plot of lnkd against 1/T using the linear form of Equation (8), below:
l n k d = E a R T + ln A
where k is the reaction rate constant at a given temperature, Ea is the activation energy (KJ/mol), T is the temperature in kelvins, and A is the Arrhenius constant in J/mol·K. From the plot of lnkd against 1/T (temperatures: 288, 301, and 308 K), the value of Ea was derived from the slope of the plots (plot not shown). Although the R2 (0.9123) value obtained from the plot of lnkd against 1/T (temperatures: 288, 301, and 308 K) was a little bit low, it can be ascertained that the value for Ea was less than 40 KJ/mol (36.4 KJ/mol). Physisorption is said to take place with an activation energy of less than 40 KJ/mol [44]. Therefore, the data taken within the chosen temperature range suggests that the adsorption of neutral red dye on coarse silica occurred through physisorption

3.7. Adsorption Kinetics

The dyes’ adsorption behavior was investigated further to determine the adsorption kinetics with the most suitable model. Experimental data obtained from the adsorption studies were fitted to pseudo-first-order and pseudo-second-order kinetics using the model equations shown in (3) and (4).
The value of k1, k2, Qe (calculated), and the correlation coefficients were all obtained from the plot of log(QeQt) vs. t and t/Qt vs. t for pseudo-first-order and pseudo-second-order kinetics, respectively. As highlighted in Table 5, for each model, all Qe’s calculated for the adsorption of the evaluated dyes to different sorbents were compared with the experimentally derives values for Qe. Additionally, R2 values of 0.99 and above for the adsorption of a specific dye on a particular adsorbent were used to determine their good fit for pseudo-first-order or pseudo-second-order kinetics. The R2 values obtained from the fitting of the adsorption of the dyes on the used adsorbents to pseudo-first-order kinetic model were within the range of 0.75–0.9212, which was significantly less than 0.99. Thus, the pseudo-first-order kinetic model was considered not to be a good fit for the adsorption studies carried out. On the other hand, as highlighted in Table 5, when using the pseudo-second-order kinetic model, the values of all the Qe’s calculated for the adsorption of the dyes on the types of adsorbent used agree well with the experimental values of Qe. Additionally, the R2 values of all dyes were within the range of 0.9996–1, which is greater than 0.99. This result suggested that the pseudo-second-order kinetic model was a good fit for all the experimental data. Our conclusion is supported by the finding of other researchers, where the adsorption of dyes on different sorbents fits well with pseudo-second-order kinetics with R2 values within the range of 0.999–1 [13,43,44,45,46].

3.8. Intra-Particle Diffusion Model

To identify the diffusion mechanism during the adsorption process, the intra-particle diffusion model (Equation (5)) was used to compute the experimental data. The adsorption of a solute from a solution by porous adsorbents can be divided into three stages. The exterior surface adsorption, also known as immediate adsorption, is the initial stage. This is followed by a progressive adsorption stage, where intra-particle diffusion is rate-limiting. Lastly, intra-particle diffusion begins to slow down due to the relatively low adsorbate concentrations remaining in the solutions [47]. The adsorption rate is controlled by one or more of these three stages. Based on the R-square value, the intra-particle diffusion behavior of most of the dyes was studied. Dye molecules with R-square values greater than 90% were assumed to be controlled by external mass factors and intra-particle diffusion (Table 5).

3.9. Selective Adsorption of Dye Mixture

The selective adsorption of dyes on acidic alumina and used silica adsorbent material was studied. Used silica and acidic alumina were selected based on their outstanding removal efficiency and short adsorption time. We initiated our study using a mixture of the following dyes: fast green, bromocresol purple, phenol red, chromotrope FB, methysulphonazo iii, and Rose Bengal, as well as the two textile dyes (referred to as solution A) and a mixture of methyl green and chromotrope FB, hereby referred to as solution B. As shown in Figure 1B, all the dyes in solution A were completely adsorbed on acidic alumina. The inset of Figure 1B shows that before adsorption, the initial solution A had a dark blue color, and after the 30 min adsorption process, it became colorless. This indicated that acidic alumina had a good selectivity toward anionic dyes, azo dyes, and reactive textile dyes and could remove these classes of dyes effectively with a very high adsorption capacity. To further confirm that a particular type of adsorbent had selective adsorption capability for a specific classification of dyes, used silica and acidic alumina were used separately for removing the dyes in solution B, where acidic alumina selectively adsorbed the dye chromotrope FB from the mixture of methyl green and chromotrope FB, leaving behind the non-adsorbed cationic dye. The absorbance in the UV-VIS spectrum was used to identify the type of dye removed and the concentration of the residual dye solution. Based on the UV-VIS spectral data obtained after the treatment, no absorbance was observed at λ = 510 nm, identified as the maximum absorbance wavelength of chromotrope FB (azo dye), while there was still absorbance at the wavelength λ = 635 nm, identified for the dye methyl green (cationic dye). Likewise, used silica gel selectively adsorbed methyl green, leaving behind chromotrope FB (azo dye). This was also confirmed through UV-VIS spectrometric measurements. Aside from the UV-VIS spectra before and after the adsorption process, the initial colors of the dyes before mixing could be identified optically after the selective adsorption process. To determine the effect of other contaminating pollutants on the adsorption efficiency, 5 g of used silica gel was added to an aqueous mixture of 50 ppm of methylene blue dye and 50 ppm phenol. The resulting mixture was stirred for 30 min. This led to 100% removal of the dye component, leaving behind 37.5 ppm of phenol, as confirmed by the UV-VIS spectral data. No absorbance was found at the maximum absorbance wavelength of methylene blue. A separate plot of the concentration of phenol and that of methylene blue in solution as a function of adsorption time on used silica showed that only 25% of phenol was removed, while 100% of the methylene blue was removed. This shows that the presence of other contaminants, such as phenol, did not affect the absorption of the dye.

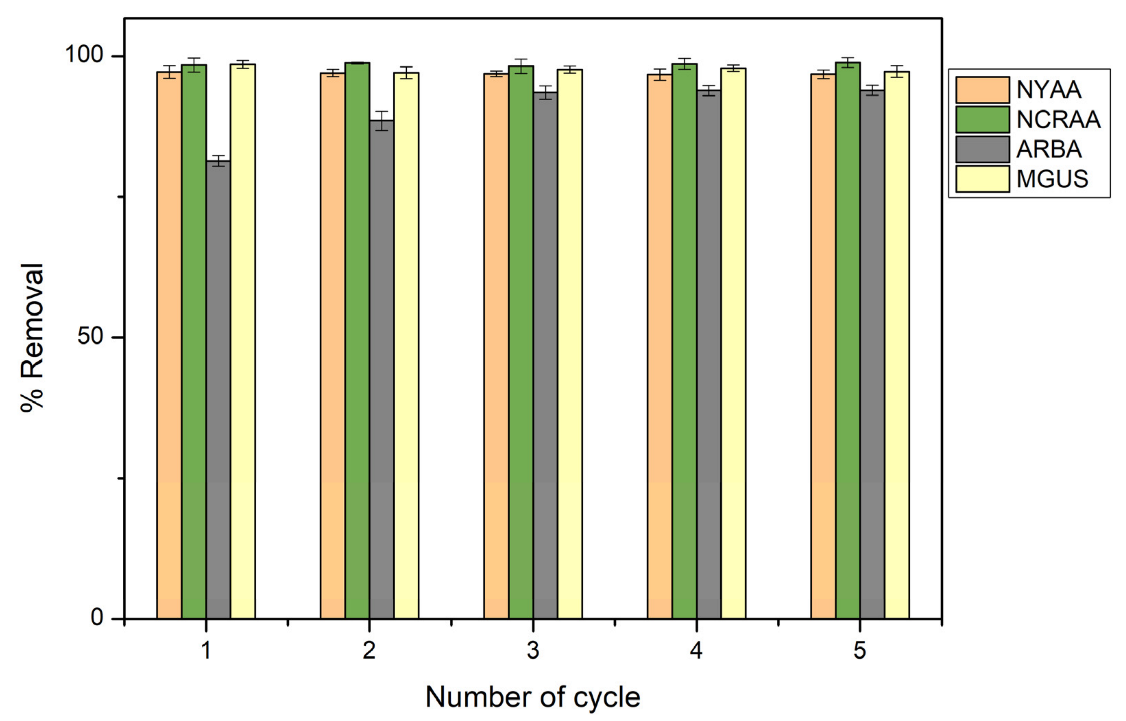
3.10. Regeneration of the Adsorbents

The regeneration of the adsorbent material was attempted through thermolysis. Silica gel and alumina were recycled at 600 °C, where the recycled adsorbent showed qualitatively the same behavior as the unused sorbent material, as illustrated in Figure 6. There was a little mass loss of the inorganic materials (used silica and alumina) in the cycle of dye adsorption–sorbent filtration–sorbent recycling. This mass loss of sorbent was accounted for when the ash of the filter paper that was used in the filtration process of the sorbent was analyzed after the transfer of the sorbent to the crucible for combustion. It was found that any mass loss was unrecovered solid from the filter paper that remained after the transfer of the dye-loaded sorbent to the crucible for thermal treatment. An attempt at the thermal regeneration of alginite showed that the organic carbon content of the material was either volatilized or combusted together with the dye molecules. This led to an increase in the percentage by mass of nonvolatile elements of the material, such as calcium (carbonate) and iron-containing mineral constituents. The changes observed in the attempt of a regeneration of the alginite at 600 °C are shown in the EDX analysis of the recycled alginite (Supplementary Figure S1J). Furthermore, the FT-IR spectra of recycled alginite at 600 °C (Figure 4i), where it is known that any dye adsorbed had already been combusted, and pristine alginite differed. Some of the inband peaks within the fingerprint region of 700–800 cm−1 found in the pure alginite disappeared as a result of the heating process after the first-time thermal regeneration, as shown in Figure 4i. This shows that alginite can be recycled only to some extent at 600 °C. This result was supported by the SEM image of pure alginite and the SEM image after the first-time regeneration of alginite. The surface morphology of the alginite was changed after the thermal treatment, as can be seen from the differences in the images of pure and regenerated alginite, shown in Figure 3i,ii. At 600 °C, the organic content of ACCG was completely burnt off and thermal regeneration of ACCG was not possible.

4. Conclusions

In this study, acidic alumina was discovered to be an excellent recyclable adsorbent for reactive textile dyes, azo dyes, and anionic dyes, while silica gel was discovered to be an excellent sorbent for cationic dyes. ACCG was shown to have a selective adsorption capacity toward cationic dyes (basic and triphenylmethane), with that for basic dyes being slightly higher than that for triphenylmethanes. For all of the sorbent materials used in this study, almost all dyes were adsorbed within 5 min. The adsorption processes could best be fit to pseudo-second-order kinetics. Adsorption mechanisms were discovered to be controlled by both the external mass transfer and intra-particle diffusion. In particular, silica (230–400 mesh) and acidic alumina displayed excellent efficiency in the treatment of dye-containing wastewater. Silica gel and alumina could be recycled thermally, where the recycled materials showed virtually the same adsorption capacities toward dyes as the pristine sorbent materials. As much of the silica gel used in the adsorption processes was recycled waste silica gel stemming from chromatographic separations, the currently described process is a further example of using wastes (silica gel) to treat other wastes (dye-loaded wastewater). Overall, this study provided potent evidence for the effectiveness of chromatography-graded inorganic materials at removing dye contamination from water. Moreover, this process could be scaled up to treat larger waste flows.

Supplementary Materials

The following supporting information can be downloaded at: https://www.mdpi.com/article/10.3390/separations9060144/s1. Figure S1: EDS elemental analysis of (A) silica 60–120 mesh, (B) silica 60–120 mesh, (C) used silica before adsorption, (D) five-time recycled used silica, (E) pure acidic alumina, (F) five-time regenerated acidic alumina, (G) pure basic alumina, (H) five-time regenerated basic alumina, (I) pure alginite, and (J) first-time regenerated pure alginate. Figure S2: The N2 adsorption–desorption isotherm linear plot and surface area vs. pore width plot for (1A) the pristine acidic alumina sample before adsorption, (1B) acidic alumina after five-time regeneration, (2A) acidic alumina before adsorption, (2B) basic alumina after regeneration, (3A) used silica gel before adsorption, and (3B) used silica gel after regeneration.

Author Contributions

A.A.B.: Investigation and Writing and Editing—original draft; V.P.: Investigation; T.R.: Investigation; F.H.: Resources and Writing—review and editing; T.T.: Conceptualization and Writing—review and editing. All authors have read and agreed to the published version of the manuscript.

Funding

This research received no external funding.

Data Availability Statement

Not applicable.

Conflicts of Interest

The authors declare no conflict of interest.

References

  1. Goh, H.Y.; Wong, W.W.C.; Ong, Y.Y. A Study To Reduce Chemical Waste Generated in Chemistry Teaching Laboratories. J. Chem. Educ. 2020, 97, 87–96. [Google Scholar] [CrossRef]
  2. de Souza Nascimento, E.; Tenuta Filho, A. Chemical waste risk reduction and environmental impact generated by laboratory activities in research and teaching institutions. Braz. J. Pharm. Sci. 2010, 46, 187–198. [Google Scholar] [CrossRef] [Green Version]
  3. Wahshi, F.S.; Alqahtani, M.D.; Abdulla, M.; Al-Hemyari, A.; Bufaroosha, M.; Ramachandran, T.; Hamed, F.; Thiemann, T. Our Experience of Using Thermally Recycled Silica Gel in a Teaching and Small Research Laboratory Setting. Proceedings 2018, 9, 28. [Google Scholar] [CrossRef] [Green Version]
  4. Sales, M.G.F.; Delerue-Matos, C.; Martins, I.B.; Serra, I.; Silva, M.R.; Morais, S. A waste management school approach towards sustainability. Resour. Conserv. Recycl. 2006, 48, 197–207. [Google Scholar] [CrossRef] [Green Version]
  5. Berradi, M.; Hsissou, R.; Khudhair, M.; Assouag, M.; Cherkaoui, O.; Bachiri, A.E.; Harfi, A.E. Textile finishing dyes and their impact on aquatic environs. Heliyon 2019, 5, e02711. [Google Scholar] [CrossRef] [PubMed]
  6. Yang, D.; Paul, B.; Xu, W.; Yuan, Y.; Liu, E.; Ke, X.; Wellard, R.M.; Guo, C.; Xu, Y.; Sun, Y.; et al. Alumina nanofibers grafted with functional groups: A new design in efficient sorbents for removal of toxic contaminants from water. Water Res. 2010, 44, 741–750. [Google Scholar] [CrossRef] [PubMed] [Green Version]
  7. Abid, M.; Zablouk, M.; Abid-Alameer, A. Experimental Study of Dye Removal from Industrial Wastewater by Membrane Technologies of Reverse Osmosis and Nanofiltration. Iran. J. Environ. Health Sci. Eng. 2012, 9, 17. [Google Scholar] [CrossRef] [Green Version]
  8. Malakootian, M.; Shahesmaeili, A.; Faraji, M.; Amiri, H.; Silva Martinez, S. Advanced oxidation processes for the removal of organophosphorus pesticides in aqueous matrices: A systematic review and meta-analysis. Process Saf. Environ. Prot. 2020, 134, 292–307. [Google Scholar] [CrossRef]
  9. Moreira, F.C.; Boaventura, R.A.R.; Brillas, E.; Vilar, V.J.P. Electrochemical advanced oxidation processes: A review on their application to synthetic and real wastewaters. Appl. Catal. B Environ. 2017, 202, 217–261. [Google Scholar] [CrossRef]
  10. Al-Abri, M.; Al-Ghafri, B.; Bora, T.; Dobretsov, S.; Dutta, J.; Castelletto, S.; Rosa, L.; Boretti, A. Chlorination disadvantages and alternative routes for biofouling control in reverse osmosis desalination. NPJ Clean Water 2019, 2, 2. [Google Scholar] [CrossRef] [Green Version]
  11. Derouich, G.; Younssi, S.A.; Bennazha, J.; Achiou, B.; Ouammou, M.; El Hassani IE, E.A.; Albizane, A. Adsorption study of cationic and anionic dyes onto Moroccan natural pozzolan. Application for removal of textile dyes from aqueous solutions. Desalination Water Treat. 2019, 145, 348–360. [Google Scholar] [CrossRef]
  12. Banerjee, S.; Dubey, S.; Gautam, R.K.; Chattopadhyaya, M.C.; Sharma, Y.C. Adsorption characteristics of alumina nanoparticles for the removal of hazardous dye, Orange G from aqueous solutions. Arab. J. Chem. 2019, 12, 5339–5354. [Google Scholar] [CrossRef]
  13. Alpat, S.K.; Özbayrak, Ö.; Alpat, Ş.; Akçay, H. The adsorption kinetics and removal of cationic dye, Toluidine Blue O, from aqueous solution with Turkish zeolite. J. Hazard. Mater. 2008, 151, 213–220. [Google Scholar] [CrossRef] [PubMed]
  14. Wahshi, F.S.; Alqahtani, M.D.; Abdulla, M.; Ramachandran, T.; Hamed, F.; Thiemann, T. Adsorption of Model Dyes on Recycled Silica Gel. Proceedings 2019, 48, 10. [Google Scholar] [CrossRef] [Green Version]
  15. Luo, P.; Zhao, Y.; Zhang, B.; Liu, J.; Yang, Y.; Liu, J. Study on the adsorption of Neutral Red from aqueous solution onto halloysite nanotubes. Water Res. 2010, 44, 1489–1497. [Google Scholar] [CrossRef]
  16. Ali, F.F. Adsorption of Toluidine blue dye from industrial waste water on the remnants of tea leaf. Int. J. ChemTech Res. 2017, 10, 497–506. [Google Scholar]
  17. Kurniawan, T.A.; Lo, W.H. Removal of refractory compounds from stabilized landfill leachate using an integrated H2O2 oxidation and granular activated carbon (GAC) adsorption treatment. Water Res. 2009, 43, 4079–4091. [Google Scholar] [CrossRef]
  18. Titchou, F.E.; Akbour, R.A.; Assabbane, A.; Hamdani, M. Removal of cationic dye from aqueous solution using Moroccan pozzolana as adsorbent: Isotherms, kinetic studies, and application on real textile wastewater treatment. Groundw. Sustain. Dev. 2020, 11, 100405. [Google Scholar] [CrossRef]
  19. Benafqir, M.; Hsini, A.; Laabd, M.; Laktif, T.; Ait Addi, A.; Albourine, A.; El Alem, N. Application of Density Functional Theory computation (DFT) and Process Capability Study for performance evaluation of Orthophosphate removal process using Polyaniline@Hematite-titaniferous sand composite (PANI@HTS) as a substrate. Sep. Purif. Technol. 2020, 236, 116286. [Google Scholar] [CrossRef]
  20. Abdulrazak, S.; Hussaini, K.; Sani, H.M. Evaluation of removal efficiency of heavy metals by low-cost activated carbon prepared from African palm fruit. Appl. Water Sci. 2017, 7, 3151–3155. [Google Scholar] [CrossRef] [Green Version]
  21. Bushra, R.; Mohamad, S.; Alias, Y.; Jin, Y.; Ahmad, M. Current approaches and methodologies to explore the perceptive adsorption mechanism of dyes on low-cost agricultural waste: A review. Microporous Mesoporous Mater. 2021, 319, 111040. [Google Scholar] [CrossRef]
  22. Hu, Q.; Bin, L.; Li, P.; Fu, F.; Guan, G.; Hao, X.; Tang, B. Highly efficient removal of dyes from wastewater over a wide range of pH value by a self-adaption adsorbent. J. Mol. Liq. 2021, 331, 115719. [Google Scholar] [CrossRef]
  23. Anastopoulos, I.; Bhatnagar, A.; Hameed, B.H.; Ok, Y.S.; Omirou, M. A review on waste-derived adsorbents from sugar industry for pollutant removal in water and wastewater. J. Mol. Liq. 2017, 240, 179–188. [Google Scholar] [CrossRef] [Green Version]
  24. Goswami, A.; Purkait, M.K. The defluoridation of water by acidic alumina. Chem. Eng. Res. Des. 2012, 90, 2316–2324. [Google Scholar] [CrossRef]
  25. Revathi, M.; Kavitha, B.; Vasudevan, T. Removal of nickel ions from industrial plating effluents using activated alumina as adsorbent. J. Environ. Sci. Eng. 2005, 47, 1–6. [Google Scholar]
  26. Frišták, V.; Pipíška, M.; Lesný, J. Cd2+ Ions Removal from Aqueous Solutions Using Alginite. Int. J. Chem. Biomol. Metall. Mater. Sci. Eng. 2014, 8, 237. [Google Scholar]
  27. Hippmann, S.; Ahmed, S.S.; Fröhlich, P.; Bertau, M. Demulsification of water/crude oil emulsion using natural rock Alginite. Colloids Surf. Physicochem. Eng. Asp. 2018, 553, 71–79. [Google Scholar] [CrossRef]
  28. Tran, H.N.; You, S.-J.; Hosseini-Bandegharaei, A.; Chao, H.-P. Mistakes and inconsistencies regarding adsorption of contaminants from aqueous solutions: A critical review. Water Res. 2017, 120, 88–116. [Google Scholar] [CrossRef] [PubMed]
  29. Lagergren, S. About the theory of so-called adsorption of soluble substances. Zur Theorie der sogenannten Adsorption gelőster Stoffe. Sven. Vetenskapsakad. Handlingar 1898, 24, 1–39. [Google Scholar]
  30. Ho, Y.-S. Review of second-order models for adsorption systems. J. Hazard. Mater. 2006, 136, 681–689. [Google Scholar] [CrossRef] [Green Version]
  31. Liu, B.; Schieber, J.; Mastalerz, M. Petrographic and micro-FTIR study of organic matter in the Upper Devonian New Albany shale during thermal maturation: Implications for kerogen transformation. In Mudstone Diagenesis: Research Perspectives for Shale Hydrocarbon Reservoirs, Seals, and Source Rocks, AAPG Memoir; The American Association of Petroleum Geologists: Tulsa, OK, USA, 2020; Chapter 10; Volume 120. [Google Scholar] [CrossRef]
  32. Xu, B.; Yang, Y.; Xu, Y.; Han, B.; Wang, Y.; Liu, X.; Yan, Z. Synthesis and characterization of mesoporous Si-modified alumina with high thermal stability. Microporous Mesoporous Mater. 2017, 238, 84–89. [Google Scholar] [CrossRef]
  33. Toledo, R.R.; Santoyo, V.R.; Sánchez, D.M.; Rosales, M.M. Effect of aluminum precursor on physicochemical properties of Al2O3 by hydrolysis/precipitation method. Nova Sci. 2018, 10, 83–99. [Google Scholar] [CrossRef]
  34. An, D.; Wang, Z.; Zhao, X.; Liu, Y.; Guo, Y.; Ren, S. A new route to synthesis of surface hydrophobic silica with long-chain alcohols in water phase. Colloids Surf. Physicochem. Eng. Asp. 2010, 1–3, 218–222. [Google Scholar] [CrossRef]
  35. Darmakkolla, S.R.; Tran, H.; Gupta, A.; Rananavare, S.B. A method to derivatize surface silanol groups to Si-alkyl groups in carbon-doped silicon oxides. RSC Adv. 2016, 6, 93219–93230. [Google Scholar] [CrossRef]
  36. Ashu-Arrah, B.A.; Glennon, J.D.; Albert, K. Preparation and characterization of bonded silica hydride intermediate from triethoxysilane and dimethylmethoxysilane using supercritical carbon dioxide and dioxane as reaction medium. J. Chromatogr. A 2012, 1236, 42–50. [Google Scholar] [CrossRef]
  37. Wong, S.; Ghafar, N.A.; Ngadi, N.; Razmi, F.A.; Inuwa, I.M.; Mat, R.; Amin, N.A.S. Effective removal of anionic textile dyes using adsorbent synthesized from coffee waste. Sci. Rep. 2020, 10, 2928. [Google Scholar] [CrossRef] [Green Version]
  38. Block, I.; Günter, C.; Duarte Rodrigues, A.; Paasch, S.; Hesemann, P.; Taubert, A. Carbon Adsorbents from Spent Coffee for Removal of Methylene Blue and Methyl Orange from Water. Materials 2021, 14, 3996. [Google Scholar] [CrossRef] [PubMed]
  39. Hao, L.; Wang, P.; Valiyaveettil, S. Successive extraction of As(V), Cu(II) and P(V) ions from water using spent coffee powder as renewable bioadsorbents. Sci. Rep. 2017, 7, 42881. [Google Scholar] [CrossRef] [Green Version]
  40. Chaouki, Z.; Hadri, M.; Nawdali, M.; Benzina, M.; Zaitan, H. Treatment of a landfill leachate from Casablanca city by a coagulation-flocculation and adsorption process using a palm bark powder (PBP). Sci. Afr. 2021, 12, e00721. [Google Scholar] [CrossRef]
  41. Deniz, F.; Karaman, S. Removal of Basic Red 46 dye from aqueous solution by pine tree leaves. Chem. Eng. J. 2011, 170, 67–74. [Google Scholar] [CrossRef]
  42. Li, T.-T.; Liu, Y.; Peng, Q.; Hu, X.; Liao, T.; Wang, H.; Lu, M. Removal of lead(II) from aqueous solution with ethylenediamine-modified yeast biomass coated with magnetic chitosan microparticles: Kinetic and equilibrium modeling. Chem. Eng. J. 2013, 214, 189–197. [Google Scholar] [CrossRef]
  43. Nanthamathee, C.; Dechatiwongse, P. Kinetic and thermodynamic studies of neutral dye removal from water using zirconium metal-organic framework analogues. Mater. Chem. Phys. 2021, 258, 123924. [Google Scholar] [CrossRef]
  44. Boparai, H.K.; Joseph, M.; O’Carroll, D.M. Kinetics and thermodynamics of cadmium ion removal by adsorption onto nano zerovalent iron particles. J. Hazard. Mater. 2011, 186, 458–465. [Google Scholar] [CrossRef] [PubMed]
  45. Fahanwi, A.N.; Erdem, A.; Yildiz, U. Synergistic removal of Cu(II) and nitrazine yellow dye using an eco-friendly chitosan-montmorillonite hydrogel: Optimization by response surface methodology. J. Appl. Polym. Sci. 2016, 133, 43664. [Google Scholar] [CrossRef]
  46. Lafi, R.; Rezma, S.; Hafiane, A. Removal of toluidine blue from aqueous solution using orange peel waste (OPW). Desalin. Water Treatm. 2015, 56, 2754–2765. [Google Scholar] [CrossRef]
  47. Wu, F.-C.; Tseng, R.-L.; Juang, R.-S. Comparisons of porous and adsorption properties of carbons activated by steam and KOH. J. Colloid Interface Sci. 2005, 283, 49–56. [Google Scholar] [CrossRef] [PubMed]
Figure 1. (A) Process of the adsorption of methyl violet from an aqueous solution on used silica gel, recycling of the silica gel, and reuse of the sorbent material. (B) Selective adsorption of a dye mixture containing 8 dyes (designated as solution A in the text).
Separations 09 00144 g001
Figure 2. XRD patterns of pristine alumina (acidic and basic) and after five-time thermal regeneration.
Separations 09 00144 g002
Figure 3. SEM images of (i) pure alginite (1000× magnification), (ii) one-time recycled alginite (1000× magnification), (iii) pure acidic alumina (1000× magnification), (iv) five-time recycled acidic alumina (1000× magnification), (v) pure basic alumina (1000× magnification), (vi) five-time recycled basic alumina (1000× magnification), (vii) used silica (1000× magnification), (viii) first-time recycled used silica (1000× magnification), (ix) coarse silica (60–120 mesh) before adsorption (1000× magnification), (x) coarse silica after the first recycling (1000× magnification), and (xi) ACCG (1000× magnification).
Separations 09 00144 g003aSeparations 09 00144 g003b
Figure 4. FT-IR spectra of (i) alginite before adsorption and after the first-time regeneration at 600 °C. (ii) Alumina (acidic and basic). (iii) Coarse and used silica gel. (iv) Activated coffee grounds (ACCG).
Separations 09 00144 g004
Figure 5. Effect of temperature on the adsorption of 50 mL/50 ppm of neutral red on 5 g silica gel (60–120 mesh) with a contact time of 30 min.
Separations 09 00144 g005
Figure 6. Effect of the number of regeneration cycles on the percentage removal of dyes (NYAA: Novacron Yellow on acidic alumina; NCRAA: Novacron cherry red on acidic alumina; ARBA: Alizarin red on basic alumina; MGUS: methyl green on used silica).
Separations 09 00144 g006
Table 1. Properties of the selected dyes/stains.
Organic Compoundλmax
(nm)
Type
Nitrazine yellow460Azo dye
Malachite green oxalate620Cationic triphenylmethane dye
Fast green625Cationic dye
Methylene blue665Cationic dye
Novacron® yellow415Reactive textile dye
Novacron® cherry red530Reactive textile dye
Phenol red430Anionic dye
Neutral red520Cationic dye
Rose bengal550Anionic dye
Crystal violet590Cationic dye
Methyl green635Cationic triphenylmethane dye
Alizarin red510Anionic dye
Toluidine blue O635Basic cationic dye
Chromotrope FB510Azo dye
Bromophenol blue590Triphenylmethane dye
Methylsulphonazo iii580Azo dye
Methyl violet585Triphenylmethane dye
Table 2. BET surface area analysis of different adsorbent materials.
AdsorbentBefore AdsorptionAfter Five-Time Regeneration
Surface Area
(m2/g)
Pore Volume
(cm3/g)
Pore Size
(Å)
Surface Area
(m2/g)
Pore Volume
(cm3/g)
Pore Size
(Å)
Acidic alumina109.970.2384.63105.840.2490.03
Basic alumina109.730.2280.40104.330.2285.79
Used silica gel286.280.6185.40302.010.6585.62
Table 3. Percentage removal of dyes on different adsorbent materials.
Dyes RemovedBasic Alumina Acidic Alumina Used Silica Gel
230–400
Silica Gel
60–120
AlginiteActivated Coffee
Alizarine red S81.7%99.9%(-)(-)55.5%94.9%
Bromocresol purple(-)100%(-)(-)(-)(-)
Bromophenol blue(-)97.1%(-)(-)(-)(-)
Chromotrope TB(-)99.9%(-)(-)(-)
Crystal violet(-)(-)99.9%(--+)99.9%90.1%
Fast green(-)99.2%91.2%(-)(-)(-)
Malachite green oxalate(-)(-)98.9%88.4%98.8%66.9%
Methylene blue(-)(-)99.8%99.0%99.8%92.1%
Methyl green(-)(-)98.9%95.8%98.7%73.3%
Methyl violet(+--)(-)100%96.9%100%99.1%
Methylsulphonazo III(-)99.8%(-)(-)(-)(-)
Neutral red(-)(-)96.2%86%94.6%88.6%
Nitrazene yellow(-)98.1% (-)(-)(-)
Novacron® cherry red(-)99.7%(-)(-)(-)(-)
Novacron® yellow(-)97.5%(-)(-)(-)(-)
Phenol red(-)94%36.2%(-)(-)(-)
Rose bengal(-)97.9%(-)(-)(-)(-)
Toluidine blue(-)(-)100%100%100%99.6%
(-): did not adsorb at all, (+--): did not adsorb well, (--+): negligible adsorption.
Table 4. Thermodynamic parameters for the neutral red adsorption on coarse silica gel.
T (K)KLΔG (KJ/mol)ΔH (KJ/mol)ΔS (J/mol·K)R (Square)
2830.534−13.03914.42846.1270.9651
2880.659−13.270
3010.794−13.869
3080.914−14.192
Table 5. Kinetic parameters for the adsorption isotherm of dyes for various sorbents.
DyesTypes of SorbentPseudo-First-Order ParametersPseudo-Second-Order ParametersIntra-Particle Diffusion
Qe exp (mg/g)Qe cal (mg/g)K1 (min1)R2Qe exp (mg/g)Qe cal (mg/g)K1 (min1)R2Kp (mg/gmin1/2)R2
Malachite green oxalateUsed silica4.9490.0600.1190.6764.9494.9603.17510.0040.516
Alginte4.9400.2460.1390.9754.9404.9651.20010.0890.922
ACCG3.4403.4150.0920.9963.3445.0680.0120.9920.1620.937
Coarse silica4.4185.1030.2060.8834.4184.8420.0730.9950.0080.926
Nitrazine yellowAcidic Alumina 4.9040.1280.0820.9804.9044.9230.70510.0070.997
Novacron Cherry redAcidic Alumina 4.4860.0950.1280.9704.4864.4982.82310.0000.946
Novacron yellowAcidic Alumina 4.8740.4960.1980.8954.8744.9300.6880.9990.0190.519
Methysulphon azo iiiAcidic Alumina 4.9900.0340.1250.9964.9904.9977.02410.0020.988
Bromophenol blueAcidic Alumina 4.9900.0050.08114.9904.85628.26310.0000.964
Fast greenAcidic Alumina 4.9590.0040.13814.9594.96067.73710.0000.890
Used silica4.5604.2730.1130.9234.5605.5520.0250.9800.1580.976
Methyl greenUsed silica4.9490.1860.1570.6034.9494.9602.00210.0030.891
Alginite4.9360.0960.0840.9334.9364.9481.96310.0040.926
ACCG3.6671.3920.0140.7203.6672.7700.3200.9930.1090.664
Coarse silica4.7914.5870.1080.8814.7916.2930.0160.9800.1970.905
Neutral redUsed silica4.8101.3190.1890.9364.814.9300.2850.9990.0330.796
Coarse silica4.3003.8190.0960.9544.304.3320.7820.9990.0110.956
Alginite4.7300.1180.0510.754.734.7591.13710.0080.856
ACCG4.432.3280.0680.8854.434.4820.36590.9990.0230.874
Publisher’s Note: MDPI stays neutral with regard to jurisdictional claims in published maps and institutional affiliations.

