Article

HPLC-MS, GC and NMR Profiling of Bioactive Lipids of Human Milk and Milk of Dairy Animals (Cow, Sheep, Goat, Buffalo, Camel, Red Deer)

Callaghan Innovation, P.O. Box 31310, Lower Hutt 5040, New Zealand
*
Authors to whom correspondence should be addressed.
Separations 2022, 9(6), 145; https://doi.org/10.3390/separations9060145
Submission received: 13 May 2022 / Revised: 27 May 2022 / Accepted: 3 June 2022 / Published: 7 June 2022

Abstract

:
For non-bovine milks, information regarding bioactive lipids is fragmented, unreliable or unavailable. The purpose of the current study was to analyse bioactive lipids in the milk of dairy animals using modern analytical methods to achieve the most reliable results. Bioactive lipids in human milk were also analysed and used as a reference. A suite of modern analytical methods was employed, namely High Performance Liquid Chromatography-Mass Spectrometry (HPLC-MS), Gas Chromatography (GC) and Nuclear Magnetic Resonance (NMR). The total lipid content was determined, and phospholipid, fatty acid, neutral glycosphingolipids and ganglioside (GM3 and GD3) levels were measured. Lipid classes in selected milks were reliably characterised for the first time, including gangliosides in deer, camel and sheep; cerebrosides in deer, camel and buffalo; plasmalogens in deer, buffalo and goat and phospholipids in deer. Our study demonstrated the advantage of utilising a range of analytical techniques in order to characterise a diverse set of bioactive lipids.

1. Introduction

Milk is a complex liquid food containing lipids, proteins, lactose and microelements. Though the primary role of milk is to feed newborns, it now plays a key role in healthy human nutrition and development throughout life. While many alternative plant-based emulsions marketed as “milks” are gaining popularity, these are lacking many of the major bioactive components of natural mammalian milk, e.g., gangliosides and plasmalogens, and they will not be discussed here.
Lipids in milk are mostly present in the form of oil droplets surrounded by the membrane. Analytical studies employing techniques available by the end of the twentieth century identified both major and minor classes of lipids present in milk; a comprehensive review by Jensen [1] is highly recommended reading. The primary component of milk fat is triacylglycerols, >95%, along with lesser quantities of diacylglycerols and monoacylglycerols. Milk fatty acids, the major component of acylglycerols and phospholipids, possess great structural variations featuring several types of biologically active compounds, including medium chain fatty acids (MCFAs), trans-fatty acids (trans-FAs) and both monounsaturated acids, e.g., vaccenic and polyunsaturated, e.g., conjugated linoleic acid (CLA), as well as all-cis-polyunsaturated fatty acids (PUFAs) [1].
MCFAs possess biological activity as they metabolise at a higher rate compared to the longer chain fatty acids, thus providing additional energy important for infants and people recovering in post-operative periods or involved in energy-demanding exercises [2]. MCFAs are also beneficial to the elderly by providing an additional energy stream, in case of deteriorating brain glucose uptake [3]. Trans-FAs found in ruminant milk fat are products of the biohydrogenation of unsaturated lipids caused by microorganisms in the rumen. The ruminant trans-FAs, especially cis-9, trans-11 conjugated linoleic acid (CLA), are reported to exhibit potent biological activity, including anticancer, anti-obesity and anti-inflammatory effects (e.g., [4] and references therein). PUFAs are one of the most important types of fatty acid. Linoleic (LA, 18:2n-6) and alpha-linolenic acids (ALA, 18:3n-3) are essential fatty acids and must be present in human diet [5]. Arachidonic (AA, 20:4n-6) and docosahexaenoic acids (DHA, 22:6n-3) play important roles in postnatal brain development, with DHA also supporting the development of visual function in newborns [6,7].
Although polar lipids comprise generally less than 1% of milk lipids, these molecules possess very important biological activity. Concentrated in the milk fat globular membrane (MFGM), they include several classes of lipids—glycerophospholipids (phosphatidylcholine, phosphatidylethanolamine, phosphatidylinositol, etc.), sphingophospholipids (mainly sphingomyelin), neutral glycosphingolipids (mainly glycosyl- and lactosylceramide), sialic acid-containing glycosphingolipids (gangliosides). Biological activity reported for dairy polar lipids include anticancer (especially colon cancer), anti-inflammatory, antibacterial and antiviral effects, and many other beneficial effects [8,9]. Gangliosides reportedly play a crucial role in infants’ neural development and may impact on cognitive functions later in life [10].
According to the Food and Agriculture Organization of the United Nations, cow milk accounted for 83.1% of world milk production, followed by buffalo (12.8%), goat (2.4%), sheep (1.4%) and camel (0.3%) milks [11]. Deer milk food products have been commercially available in New Zealand since 2018. For some of these milks, information regarding particular bioactive lipids is fragmented, unreliable or unavailable. Early results of the sheep milk study were published by the authors in 2017 [12].
Our analysis of the literature showed gaps in the available information on specific lipid class composition in milks from a number of species. We could not find reliable information about the composition of gangliosides in deer, camel and sheep; cerebrosides in deer, camel and buffalo; plasmalogens in deer, buffalo and goat or phospholipids in deer.
The purpose of the current study was to analyse and compare bioactive lipids in the milks of dairy animals relevant to New Zealand and Australia using modern advanced analytical techniques. Another focus of this work is to fill the gap in the information on bioactive lipids in milks of some animals, especially deer, camel and buffalo.

2. Materials and Methods

2.1. Samples and Reagents

Human milk samples were kindly donated by healthy volunteers, pooled prior to analysis. Individual samples were also analysed (data not shown). Raw cow milk was purchased from Manna Milk Limited Partnership (Levin, New Zealand). Raw pooled sheep milk was provided by AgResearch Ltd. (Palmerston North, New Zealand). Raw goat milk was purchased from Aroha Organic Cheese (Te Aroha, New Zealand). Pasteurised non-homogenised buffalo milk was purchased from Clevedon Buffalo Co. (Clevedon, New Zealand). Pasteurised non-homogenised camel milk was purchased from The Camel Milk Co (Australia). The red deer milk sample was provided by Deer Milking NZ Limited and identified as coming from a vat of milk collected from 40–60 deer on 12 April 2018. The information about the diet of the animal during the lactation period is not available.
The LCMS grade acetonitrile and the HPLC grade methylene chloride used was supplied by Fisher Scientific (Thermo Fisher Scientific, Waltham, MA, USA). All other solvents used were HPLC grade and were supplied by Merck (Merck & Co, Rahway, NJ, USA). All chemicals were supplied by Sigma-Aldrich (Sigma-Aldrich, St. Louis, MI, USA).

2.2. Extraction of Lipids

The original method of Svennerholm and Fredman [13] was modified as follows: 8 g milk in a 40 mL centrifuge tube was mixed with 16 mL of methanol and 8 mL of chloroform and sonicated for 10 min, then spun at 2850 rcf for 10 min. The pellet was further extracted with chloroform (6 mL)/methanol (6 mL), and twice with chloroform (6 mL)/methanol (3 mL) with the use of ultrasonication. The centrifuged lipid extracts from each extraction were combined and transferred to a 100 mL centrifuge tube and washed with water (19 mL) and 10% aq. KCl (3 mL), then spun at 2850 rcf for 10 min. The lower layer was dried and constituted the crude lipid extract.

2.3. Analysis of Fatty Acids by Gas Chromatography (GC)

Fatty acid methyl esters (FAME) were prepared from the total lipid extract as described by Carreau and Dubacq [14] and analysed by an Agilent 7890B gas chromatograph (Agilent Technologies, Santa Clara, CA, USA) equipped with a flame ionization detector (FID) and BPX70 (60 m × 0.25 mm i.d., 0.25 μm) capillary column. Helium was used as the carrier gas, split—1:100. Injector and detector temperatures were both 260 °C. Oven temperature was held at 45 °C for 4 min, then increased by 15 °C/min to 165 °C (held for 1 min), followed by an increase of 2 °C/min to 225 °C (held for 20 min). FID correction factors for individual fatty acids were measured using quantitative standards and were applied accordingly.

2.4. Analysis of Phospholipids by Nuclear Magnetic Resonance (NMR)

Analysis of phospholipids by nuclear magnetic resonance (NMR) was performed according to MacKenzie et al. [15]. Prior to analysis, polar lipids were enriched using solid phase extraction (Sep-Pak® Vac 6cc (500 mg) silica cartridges, Waters). Total lipid extract (500 mg) was dissolved in 10 mL chloroform and loaded onto the solid phase extraction cartridge. Non-polar lipids were eluted with 13 mL chloroform. Polar lipids were eluted with 4 mL methanol, then 4 mL of chloroform/methanol/water (1:1:1 by volume). Solvent was removed by drying under a stream of nitrogen at 50 °C.
Deacylation with monomethylamine [16] allowed for the detection and quantification of ethanolamine plasmalogen (EPLAS). Ethanol (0.5 mL) and aqueous methylamine (40% in water, 3 mL) was added to the polar lipid fraction in an 8 mL test tube. The tube was heated at 55 °C for 1 h, then solvent was removed under a stream of nitrogen at 60 °C.
Phospholipid classes (intact or deacylated) were analysed using 31P-NMR in a detergent system containing sodium cholate (10% w/w), EDTA (1% w/w) and phosphonomethylglycine (glyphosate) as an internal standard for quantification (0.3 g/L); pH was adjusted to 7.1 using sodium hydroxide. The detergent solution was an aqueous solution containing 20% D2O for deuterium field-frequency lock capability. The sample was mixed with detergent solution (750 µL) by vortexing, then dispersed by ultrasonication with occasional shaking at 60 °C for up to 10 min.
Quantitative phosphorus NMR spectra were acquired on a two-channel Bruker Avance III 500 MHz NMR spectrometer (Bruker Corporation, Billerica, MA, USA) operating at a frequency of 202.52 MHz for 31P and 500.11 MHz for 1H. Inverse gated proton decoupling (WALTZ-16 composite pulse decoupling, 80 us 90 for 1H pulses) was used (pulse sequence zgig) to suppress the nuclear Overhauser effect with the following instrument settings: sample temperature 30 °C, a spectral width of 10,121 Hz (50 ppm) and 31P and 1H transmitter offsets of 10.0 ppm and 4.0 ppm, respectively. In total, 65,536 complex datapoints were acquired (acquisition time of 6.47 s, 10.0 us 90 degree r.f. excitation pulse. Four dummy scans, followed by 360 transients, were co-added, each with an 6.0 s delay time between scans (D1). Spectra were processed using an exponential apodization function (0.2 Hz) before Fourier transformation, one times zero filling, manual phase correction and 5th order polynomial baseline correction.
Chemical shifts were measured relative to the glyphosate internal standard and were also relative to SM (−7.53 ppm relative to PMG at pH 7.1). Molecular weights were calculated from average fatty acid chain lengths for bovine dairy phospholipids [17].

2.5. Analysis of Neutral Glycosphingolipids (Glucosyl and Lactosylceramides, Cerebrosides)

Analysis of neutral glycosphingolipids (glucosyl and lactosylceramides, cerebrosides) in the total lipid extract was performed using high-performance lipid chromatography-mass spectrometry, Shimadzu 8040 (Shimadzu, Kyoto, Japan). The chromatographic method was similar to that used by Trung Le et al. [18] but was adapted to allow the quantification of the cerebrosides as follows: column—Thermo HILIC column 150 × 2.1 mm, solvent gradient: dichloromethane vs. methanol (with added HOAc/triethylamine buffer). Lactosyl- and glucosylceramides were detected based on specific MRMs optimised from standard bovine milk glucosyl and lactosyl standards from Nagara Science (Nagara Science, Gifu, Japan).

2.6. Analysis of Gangliosides GM3 and GD3 by HPLC-MS

A separate extraction of the milk sample was performed according to [19]. Analysis was performed by LCMS using the a method described by Rivas-Serna et al. [20]. The aqueous sample from extraction was used directly. LCMS/MS setup: Shimadzu 8040 instrument with ESI probe, column; Waters 50 mm × 2 mm BEH C18 column; mobile phase A 50:50 water/isopropanol mixture containing 5 mM ammonium acetate and 0.05% acetic acid, phase B consisted of 100% methanol. Total LC run time of 12 min at a flow rate of 0.5 mL/min. The retention times of the gangliosides ranged from 4 to 8 min. Detection was carried out using the MRM of four species, for GD3 and GM3. The MRMs were optimised using standard bovine milk GD3 and GM3 standards from Nagara Science (Japan). The glycolyl gangliosides in goat milk used adjusted MRM values.

2.7. Statistical Analysis

All measurements were performed in triplicate. Results are reported as mean values with standard deviation. All calculations were performed in Excel.

3. Results and Discussion

3.1. Total Lipids

The average total lipid content of human milk was 3.8%, cow milk was 4.0%, goat milk was 3.0% and camel milk was 2.7%. Buffalo, sheep and deer milk possessed similarly high levels of total lipids: 7.1%, 6.8% and 7.4%, respectively.
The total lipid content of the deer milk sample studied was 7.4% (determined in triplicate), close to that of buffalo milk, 7.1%, and sheep milk, 6.8%, and higher than the total lipid content of cow milk (4.0%). Camel milk possessed the lowest lipid content, 2.7%.

3.2. Fatty Acids by GC

The fatty acid compositions of the milks are presented in weight % of total fatty acids (Table 1).
The results of fatty acid analysis in our study correlate well with the literature data [21,22]. The fatty acid composition of human milk is very different from compositions of the analysed animal milks in many aspects. Whilst the major fatty acids are the same (16:0, 18:1n-9) across all milks, there are many important differences.
Total PUFA level is significantly higher in human milk (16.1%), than in other milks. The highest PUFA level in ruminant milks is observed in deer milk: 4.6% of total fatty acids. The major PUFA in human milk in the samples studied was linoleic acid, reaching 12.3% of total fatty acids. It was followed, by a considerable amount, by linolenic acid (up to 1.4%). This pattern loosely resembles other milks, but with much lower levels of linoleic acid. Deer and goat milks feature linolenic acid at the same levels as human milks: 1.6% and 1.4%, respectively. The arachidonic acid (AA) level observed in human milk is 0.4%; in other milks, AA levels accounted for only about 0.1% of total fatty acids. Eicosapentaenoic acid (EPA) levels are very similar across all milks, around 0.1%, but docosahexaenoic acid (DHA) level is much higher in human milk (0.4%), with the only other milks where it was observed being sheep and goat milks (0.1%). In our study, the level of DHA content in human milk varied between donors from 0.2% to 0.7% of total fatty acids (data not shown). It is well known that the maternal diet has a great effect on the fatty acid composition of human milk, and such variation of DHA levels observed in our study likely reflects this [23]. The levels of docosahexaenoic acid reported in the literature [24] varied from 0.95 to 1.33% of total fatty acids in the milk of Japanese women, but were below 0.3%% or even absent from the milk of Sudanese women. EPA, DHA and AA fortification to meet human milk levels is still required, but sheep milk (per 100 g milk) exhibits elevated levels of these key PUFA with DHA levels, exceeding those in cow and buffalo milk by more than ten times (data not presented).
Another group of biologically active fatty acids observed in milk are ruminant trans-fatty acids [25]. The highest level of trans-fatty acids was observed in buffalo milk (6.0%), and high levels of 9c,11t-conjugated linoleic acid (CLA) levels were found in buffalo and sheep milk (1.6% and 1.7%, respectively). Unlike industrial trans-FA found in hydrogenated oils, ruminant trans-FA have been shown to have beneficial properties, with anticarcinogenic and antiatherogenic activities among them [26,27]. Because it is possible to alter the fatty acid profile of milk to increase ruminant trans-FA content, CLA-enriched functional milk products might become a reality in the future [28,29].
In human milk, trans-fatty acids originate from both immediate dietary sources and from “trans-fatty acids stored in adipose tissues as a result of previous dietary exposure and liberated from fat depots during the weight loss following childbirth” [30].
Medium-chain fatty acids, caproic (6:0), caprylic (8:0) and capric acid (10:0), are a very special subset of saturated fatty acids. Goat milk is known to be naturally enriched in such fatty acids, hence the fatty acid names, which are all derived from Capra, the goats’ genus name. Medium-chain fatty acids were expectedly found at the highest levels in goat milk—21.6 wt%. This means that at least every 4th fatty acid in goat milk is a medium-chain fatty acid. The metabolic destiny of medium-chain fatty acids is different from their long-chain counterparts [31]. They are transferred and metabolised much faster, providing energy to the organism, and have low tendency towards the formation of adipose tissue [2]. There are also indications that medium-chain fatty acids have beneficial effects in elderly adults with neurological and metabolic disorders [32].
The levels of saturated fatty acids in milk fat are high, reaching as much as 74.7% in cow milk and 74.6% in goat milk. This is one of the generally held concerns about milk lipids. This makes camel milk somewhat interesting, with the lowest saturated fatty acid levels among animal milks at 64.1%. This is due to the significant levels of palmitoleic acid (9.3%) compared to all other milks where it ranges from 0.3% to 2.4%. Such unusually high levels of palmitoleic acid probably relate to delta-9 desaturase specificity. Because palmitoleic acid elongates to oleic acid upon adsorption, it makes sense to compare total cis-monounsaturated fatty acid levels in milks: the level of total cis-MUFA in human milk is 40.6%, and camel milk has the highest cis-MUFA level among the animal milks—30.6%.
It is obvious that human milk is very different from ruminant milks, which have their own features. Buffalo milk has the highest ruminant trans-FA, sheep milk features a higher level of long-chain PUFA and CLA, goat milk is well known for its medium-chain fatty acids content and camel has the highest cis-MUFA level among all of the animal milks analysed in this study.

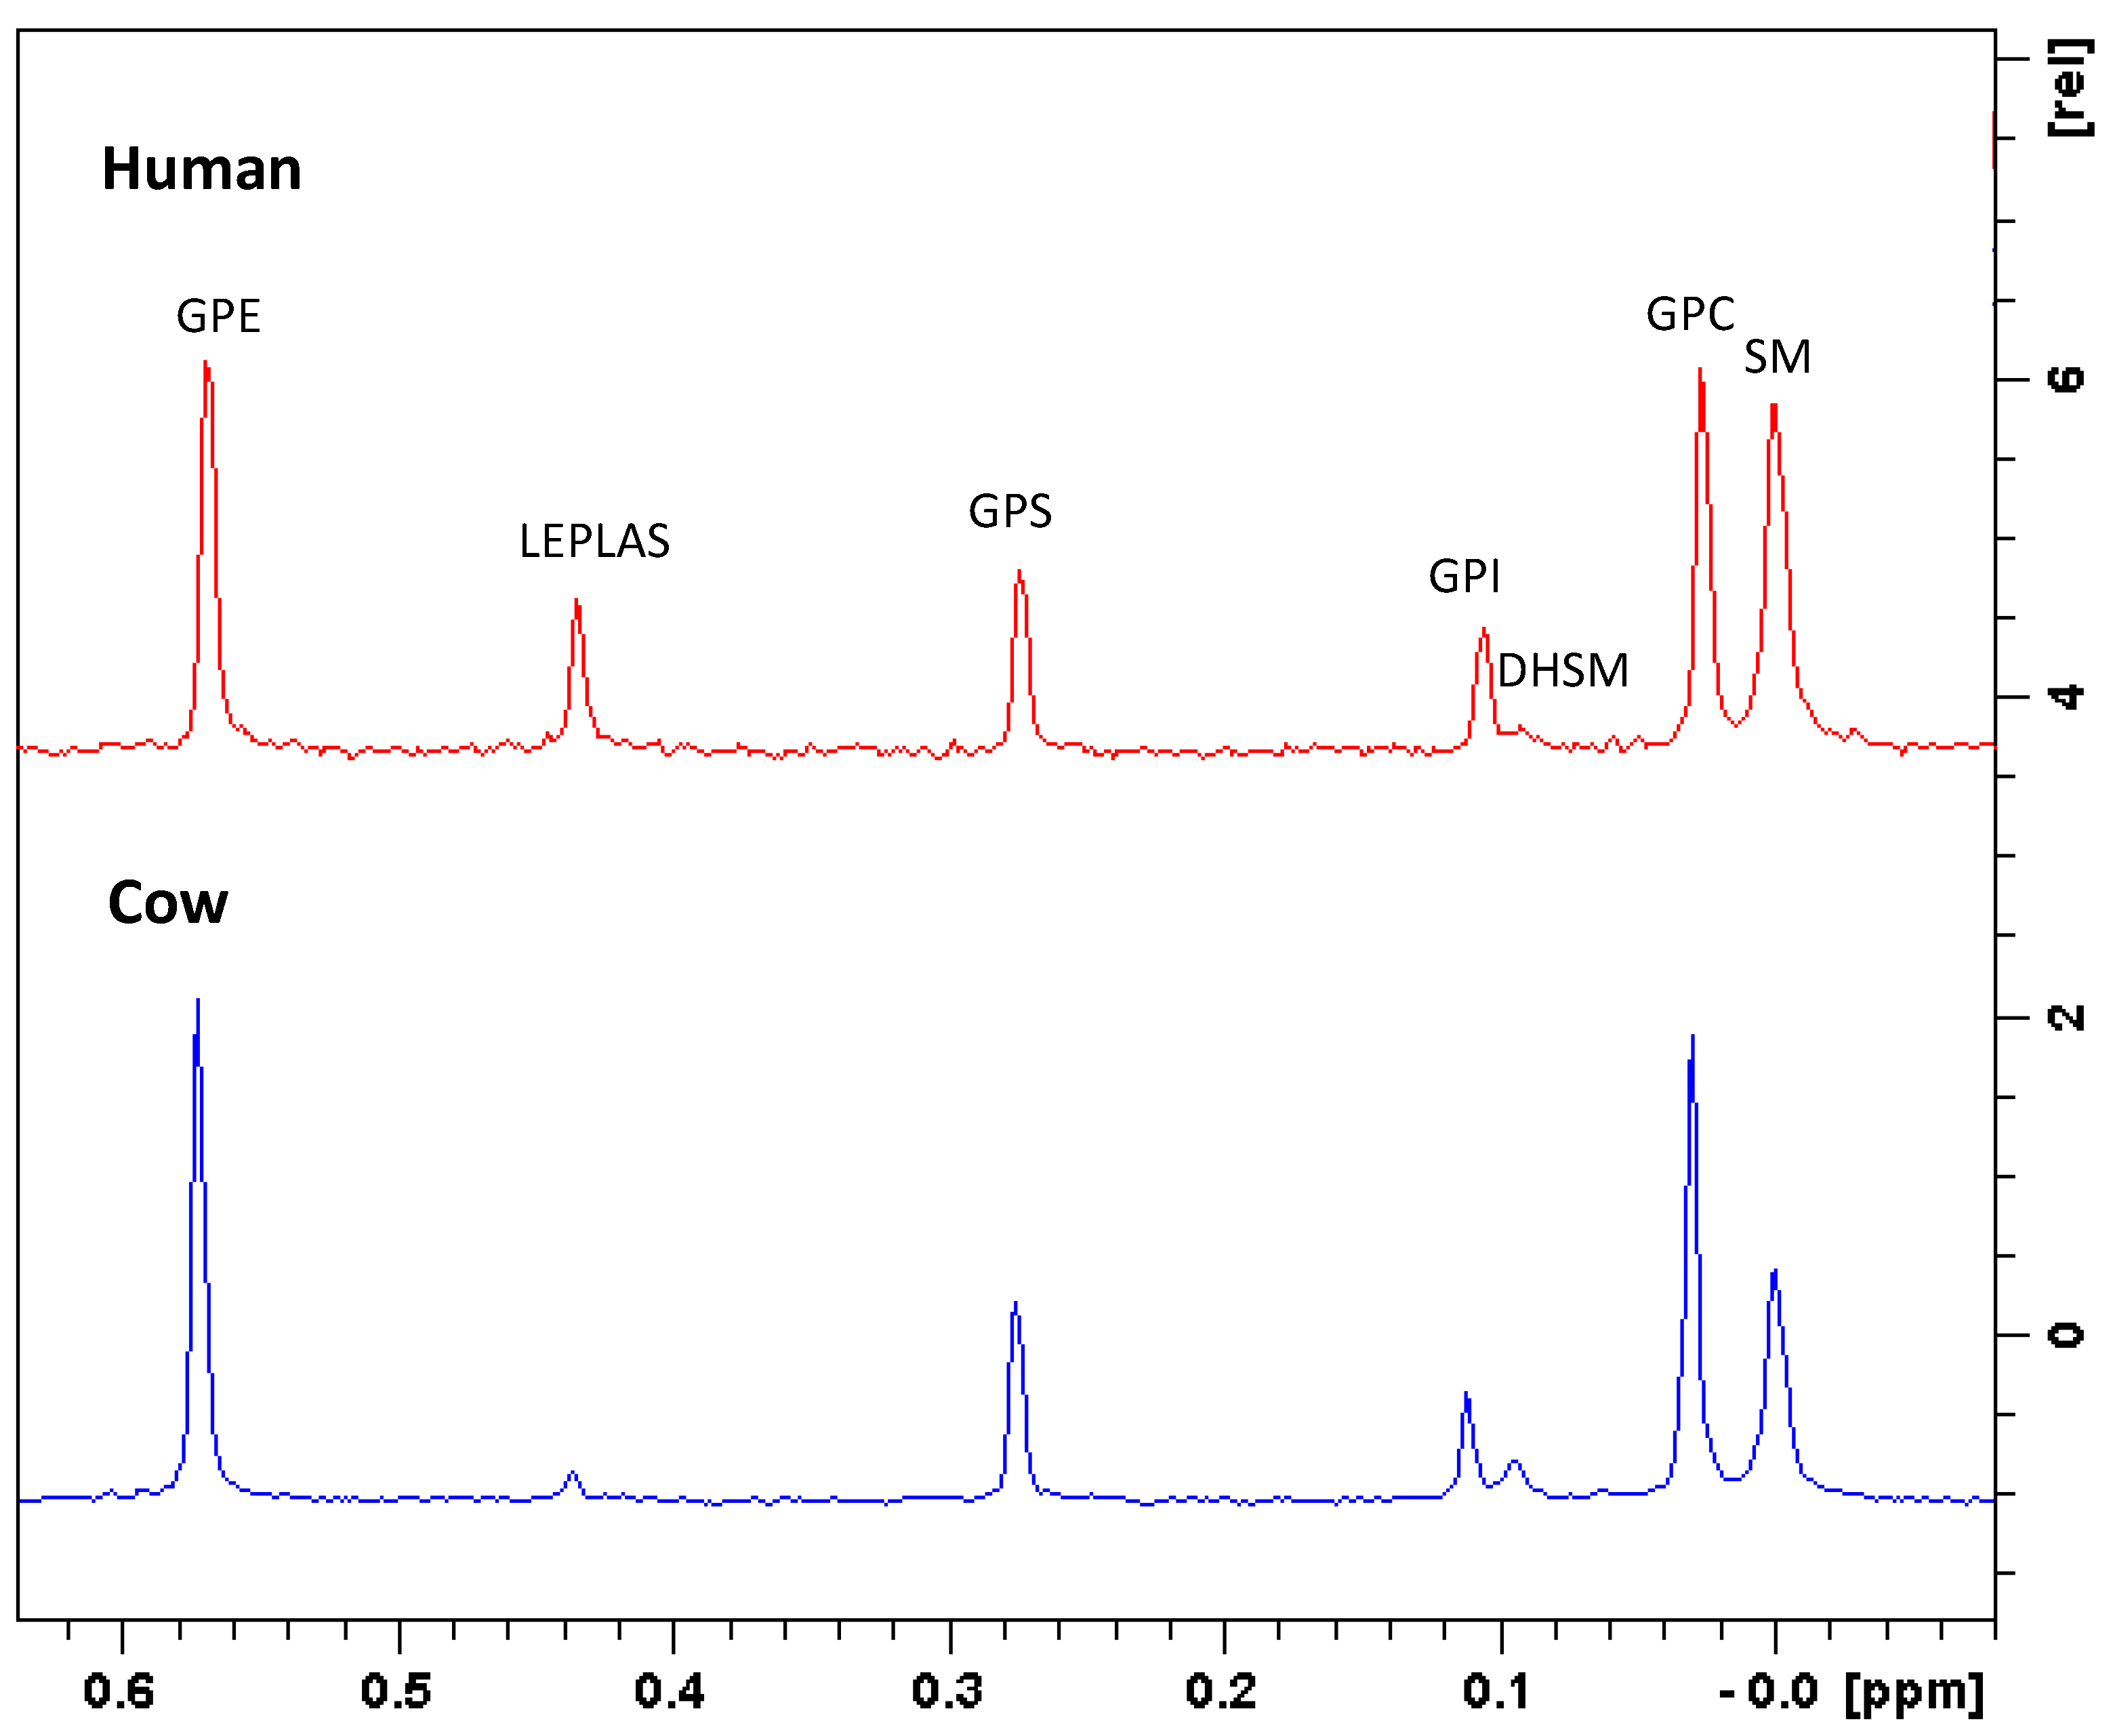
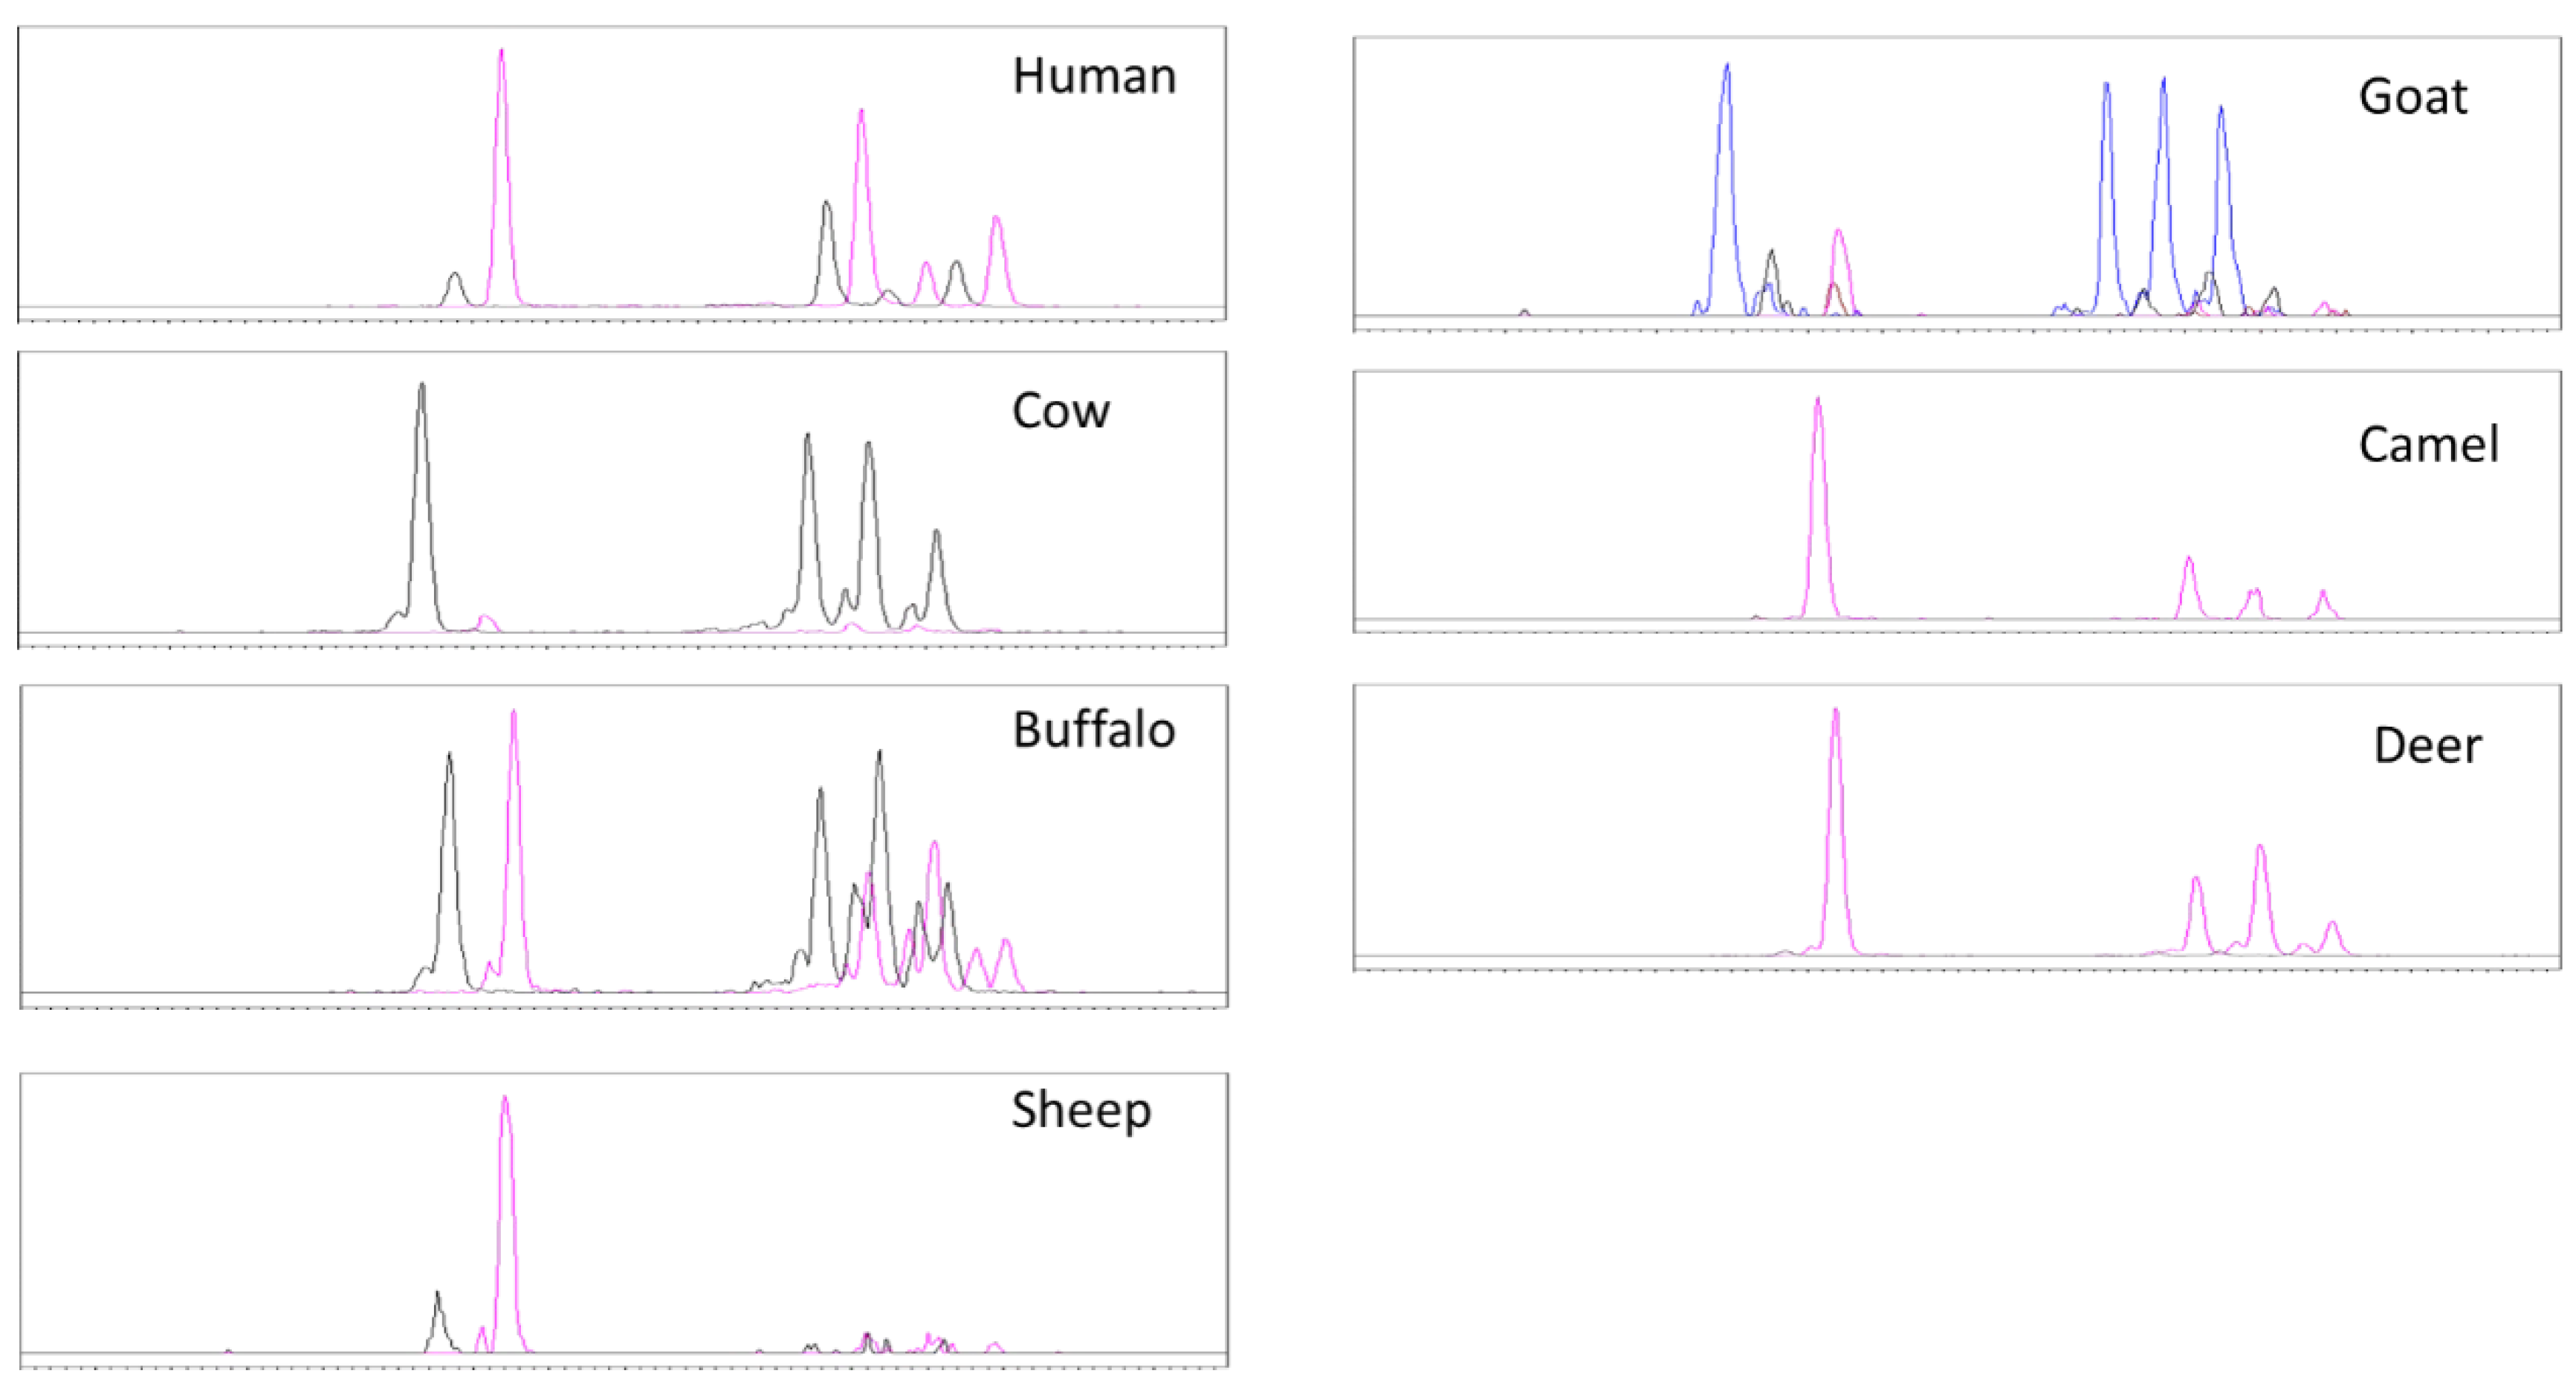
3.3. Phospholipids by 31P-NMR

The phospholipids profiles of the samples are presented in Table 2 and Figure 1.
Phospholipids are an important bioactive component of milk. Of special interest are the levels of phosphatidylethanolamine, phosphatidylserineand and sphingomyelin, due to their known importance for brain health and gut health, respectively. The plasmalogen form of phospholipids reportedly possess neuroprotective properties and as such are currently considered important for the proper development of the foetal/infant brain (human milk contains elevated levels of ethanolamine plasmalogen (EPLAS), about 11.4 mol% of total phospholipid [33]) and for alleviating adverse processes in ageing brains [34].
Phospholipid content varied from 0.61% to 1.17% of total lipids for cow and camel, respectively (Table 2). Phospholipid profiles were quite similar between different animals, featuring SM, PC and PE as the major phospholipids. The greatest difference between human milk and all animal milks was the content of the plasmalogen version of PE (EPLAS), with human milk significantly higher in plasmalogen content (see Table 2 and Figure 1). Our data stand in good agreement with previous reports, although most publications do not report plasmalogens separately from PE [8,21,35]. Considering absolute levels of individual phospholipids, deer milk has the highest content of phospholipids per 100 g of milk. Some differences can be attributed to variation in lactation stage, breed, season and other factors.
Overall, red deer and sheep milk are the richest source of phospholipids among all other types of milk (Table 2).

3.4. Neutral Glycosphingolipids by HPLC-MS

Two major species of neutral glycosphingolipids, namely monohexosylceramides and lactosylceramide, have been quantified (Table 3).
Neutral glycosphingolipids are components of MFGM [9], along with gangliosides and phospholipids. The neutral glycosphingolipids, cerebrosides, found in milk include glycosylceramides (also referred to as hexosylceramides: glucosyl- and galactosyl ceramides) and lactosylceramide, and serve as biological precursors of ceramides and gangliosides. Glycosyl- and lactosylceramide were reported for milk from several species [36], where they were found at different levels and ratios. They are involved in a multitude of bodily processes, including the maintenance of bone and skin health. There are publications on beneficial activities of sphingolipids consumed with food (e.g., with a potential to be used in skin and gut health applications [37,38]).
Overall, animal milks contain much higher levels of neutral glycosphingolipids compared to human milk. The highest neutral glycosphingolipids content was observed in camel milk. The major difference between human and animal milks was the ratio of hexosylceramide (cerebroside) to lactosylceramide; in human milk such ratio is above 1, whilst in animal milk it is lower than 1 (see Table 3) [39]. The composition of the hexosylceramide species is different between human and animal milks. The major cerebroside in human milk is galactosylceramide, whilst glucosylceramide is predominant in animal milks [40,41].
The sample of deer milk analysed in our current research contained a total of 4.36 mg of glycosyl- and lactosylceramides per 100 g milk, or 0.52 mg/g total lipids (i.e., about 0.05 weight %). While the latter value was close to that reported for cow milk, 0.071% of total lipids (i.e., 0.71 mg/g total lipids), the ratios of glycosylceramide to lactosylceramide in deer milk and cow milk differed: in cow milk that ratio was equal to 0.9, while in deer milk it was much lower—0.2 (Table 3). It has been reported that a dairy-based preparation enriched in lactosylceramide was found to induce the demise of colon cancer cells [42].

3.5. Gangliosides by HPLC-MS

Gangliosides analysis results were reported as mg/100 g of milk (Table 4), because these molecules are very polar and could not be quantitatively extracted from milk with a regular lipid extraction procedure.
Gangliosides are an extremely important group of bioactive lipids. They are heavily involved in the development of a healthy infant brain, immune response processes and in preventing adhesion of ingested pathogens to gut tissue, etc. Two major gangliosides in human milk are GM3 and GD3, but the ratio between gangliosides changes with lactation. In the early period of lactation, the ratio of GM3 to GD3 is 0.2–0.3. This ratio gradually changes to more than 3 in mature milk [43]. Our samples were obtained from the volunteers at the intermediate stage of lactation where GM3 and GD3 levels are similar, with the GM3 to GD3 ratio equal to about 0.7 (see Table 4).
The only animal milk featuring levels of GD3 similar to human milk is cow milk, whilst in almost all of the animal milks studied in this work, GM3 has been either detected at a very low level (<0.1 mg/100 mL milk) or not detected at all. The exceptions were buffalo milk and deer milk. Buffalo milk possessed a somewhat elevated level of GM3, 0.12 mg/100 mL, with the GM3 to GD3 ratio equal to about 0.1. Red deer milk was unique in the sense that it was the only milk possessing the levels of GM3 comparable with these of human milk, 3.43 mg/100 mL, with an extremely high ratio (>19) of GM3 to GD3. Unlike cow milk, where the content of GD3 is much greater than GM3 [1], the deer milk sample studied had a low level of GD3 present, 1.8 mg/L, whilst GM3 has been observed at levels of 34.3 mg/L (four determinations) (Table 4). For a comparison, in mature cow milk, GM3 has been reported to be present at only 0.3 mg/L, and in human milk it is 8.1 mg/L [44]. In other words, the GM3 level in the red deer milk sample studied was more than 100 times higher than in cow milk, and about four times higher than in human milk. Considering that there are known human hereditary pathologies that are potentially alleviated by supplementing GM3 without adding GD3 (e.g., infantile-onset symptomatic epilepsy syndrome [45]), this finding might lead to the development of a special-needs product.
A unique feature of goat milk is that its gangliosides are based, not on N-acetylneuraminic acid, but on its analogue, N-glycolylneuraminic acid [46]. We did not observe these analogues in the rest of the milks studied (See Figure 2).

4. Conclusions

Our study demonstrates the diversity of the bioactive lipids present in milks from different sources. Overall, employing a range of modern analytical techniques, HPLC-MS, GC and NMR, allows researchers to profile, characterise and accurately quantify lipid classes in milk. Some classes of lipids were analysed for the first time, including gangliosides in deer, camel and sheep; cerebrosides in deer, camel and buffalo; plasmalogens in deer, buffalo and goat and phospholipids in deer.
Analysis and reporting of a wide range of lipid classes using the same methods will allow direct comparison between bioactive lipids in cow, sheep, goat, buffalo, camel, deer and human milk.

Author Contributions

Analysis, A.M., K.L., D.S. and S.B.; writing, K.L. and M.V.; project administration, K.L. and M.V. All authors have read and agreed to the published version of the manuscript.

Funding

Some analytical method development was funded within the project “SIF Novel Bioactives” (Callaghan Innovation—internal funding). The red deer milk work was funded by Deer Milking NZ Limited. The sheep milk samples were collected as part the research programme Boosting exports of the emerging NZ dairy sheep industry (Ministry of Business of Innovation and Employment, contract no C10X1305).

Informed Consent Statement

Informed consent was obtained from all subjects involved in the study.

Acknowledgments

The authors are grateful to Rebecca Davidson (deer milk, publication support), Linda Samuelsson, Li Day, Marita Broadhurst (sheep milk), Jaganmohan Billakanti (goat, buffalo), Jared Raynes (camel milk).

Conflicts of Interest

The authors declare no conflict of interest.

References

  1. Jensen, R.G. The Composition of Bovine Milk Lipids: January 1995 to December 2000. J. Dairy Sci. 2002, 85, 295–350. [Google Scholar] [CrossRef]
  2. Schoenfeld, P.; Wojtczak, L. Short- and medium-chain fatty acids in energy metabolism: The cellular perspective. J. Lipid Res. 2016, 57, 943–954. [Google Scholar] [CrossRef] [Green Version]
  3. Cunnane, S.C.; Courchesne-Loyer, A.; St-Pierre, V.; Vandenberghe, C.; Pierotti, T.; Fortier, M.; Croteau, E.; Castellano, C. Can ketones compensate for deteriorating brain glucose uptake during aging? Implications for the risk and treatment of Alzheimer’s disease. Ann. N. Y. Acad. Sci. 2016, 1367, 12–20. [Google Scholar] [CrossRef] [Green Version]
  4. Kim, J.H.; Kim, Y.; Kim, Y.J.; Park, Y. Conjugated Linoleic Acid: Potential Health Benefits as a Functional Food Ingredient. Annu. Rev. Food Sci. Technol. 2016, 7, 221–244. [Google Scholar] [CrossRef]
  5. Spector, A.A.; Kim, H.-Y. Discovery of essential fatty acids. J. Lipid Res. 2015, 56, 11–21. [Google Scholar] [CrossRef] [PubMed] [Green Version]
  6. Delplanque, B.; Gibson, R.; Koletzko, B.; Lapillonne, A.; Strandvik, B. Lipid Quality in Infant Nutrition. J. Pediatr. Gastroenterol. Nutr. 2015, 61, 8–17. [Google Scholar] [CrossRef] [PubMed] [Green Version]
  7. Koletzko, B.; Agostoni, C.; Carlson, S.; Clandinin, T.; Hornstra, G.; Neuringer, M.; Uauy, R.; Yamashiro, Y.; Willatts, P. Long chain polyunsaturated fatty acids (LC-PUFA) and perinatal development. Acta Paediatr. 2007, 90, 460–464. [Google Scholar] [CrossRef]
  8. Contarini, G.; Povolo, M. Phospholipids in Milk Fat: Composition, Biological and Technological Significance, and Analytical Strategies. Int. J. Mol. Sci. 2013, 14, 2808–2831. [Google Scholar] [CrossRef] [Green Version]
  9. Brink, L.R.; Lönnerdal, B. Milk fat globule membrane: The role of its various components in infant health and development. J. Nutr. Biochem. 2020, 85, 108465. [Google Scholar] [CrossRef] [PubMed]
  10. Palmano, K.; Rowan, A.; Guillermo, R.; Guan, J.; Mc Jarrow, P. The Role of Gangliosides in Neurodevelopment. Nutrients 2015, 7, 3891–3913. [Google Scholar] [CrossRef] [Green Version]
  11. Muehlhoff, E.; Bennett, A.; McMahon, D. Milk and Dairy Products in Human Nutrition; Food and Agriculture Organisation of the United Nations (FAO): Rome, Italy, 2013. [Google Scholar]
  12. Vyssotski, M.; Lagutin, K.; Bloor, S.; MacKenzie, A.; Scott, D.; Broadhurst, M.; Day, L.; Samuelsson, L. Lipid profile of New Zealand Sheep Milk. Food New Zealand 2017, 17, 32–33. [Google Scholar]
  13. Svennerholm, L.; Fredman, P. A procedure for the quantitative isolation of brain gangliosides. Biochim. Biophys. Acta (BBA)—Lipids Lipid Metab. 1980, 617, 97–109. [Google Scholar] [CrossRef]
  14. Carreau, J.; Dubacq, J. Adaptation of a macro-scale method to the micro-scale for fatty acid methyl transesterification of biological lipid extracts. J. Chromatogr. A 1978, 151, 384–390. [Google Scholar] [CrossRef]
  15. MacKenzie, A.; Vyssotski, M.; Nekrasov, E. Quantitative Analysis of Dairy Phospholipids by 31P NMR. J. Am. Oil Chem. Soc. 2009, 86, 757–763. [Google Scholar] [CrossRef]
  16. Clarke, N.G.; Dawson, R.M.C. Alkaline ON-transacylation. A new method for the quantitative deacylation of phospholipids. Biochem. J. 1981, 195, 301–306. [Google Scholar] [CrossRef] [PubMed]
  17. Bitman, J.; Wood, D. Changes in Milk Fat Phospholipids During Lactation. J. Dairy Sci. 1990, 73, 1208–1216. [Google Scholar] [CrossRef]
  18. Le, T.T.; Miocinovic, J.; Nguyen, T.M.; Rombaut, R.; van Camp, J.; Dewettinck, K. Improved Solvent Extraction Procedure and High-Performance Liquid Chromatography–Evaporative Light-Scattering Detector Method for Analysis of Polar Lipids from Dairy Materials. J. Agric. Food Chem. 2011, 59, 10407–10413. [Google Scholar] [CrossRef] [PubMed]
  19. Ma, L.; MacGibbon, A.K.; Mohamed, H.J.B.J.; Loy, S.; Rowan, A.; McJarrow, P.; Fong, B.Y. Determination of ganglioside concentrations in breast milk and serum from Malaysian mothers using a high performance liquid chromatography-mass spectrometry-multiple reaction monitoring method. Int. Dairy J. 2015, 49, 62–71. [Google Scholar] [CrossRef] [Green Version]
  20. Rivas-Serna, I.M.; Polakowski, R.; Shoemaker, G.K.; Mazurak, V.C.; Clandinin, M.T. Profiling gangliosides from milk products and other biological membranes using LC/MS. J. Food Compos. Anal. 2015, 44, 45–55. [Google Scholar] [CrossRef]
  21. Yao, Y.; Zhao, G.; Xiang, J.; Zou, X.; Jin, Q.; Wang, X. Lipid composition and structural characteristics of bovine, caprine and human milk fat globules. Int. Dairy J. 2016, 56, 64–73. [Google Scholar] [CrossRef]
  22. Barłowska, J.; Szwajkowska, M.; Litwińczuk, Z.; Król, J. Nutritional Value and Technological Suitability of Milk from Various Animal Species Used for Dairy Production. Compr. Rev. Food Sci. Food Saf. 2011, 10, 291–302. [Google Scholar] [CrossRef]
  23. Innis, S.M. Impact of maternal diet on human milk composition and neurological development of infants. Am. J. Clin. Nutr. 2014, 99, 734S–741S. [Google Scholar] [CrossRef] [Green Version]
  24. Jensen, R.G. Lipids in human milk. Lipids 1999, 34, 1243–1271. [Google Scholar] [CrossRef]
  25. Aitchison, J.M.; Dunkley, W.L.; Canolty, N.L.; Smith, L.M. Influence of diet on trans fatty acids in human milk. Am. J. Clin. Nutr. 1977, 30, 2006–2015. [Google Scholar] [CrossRef] [Green Version]
  26. Yang, B.; Chen, H.; Stanton, C.; Ross, R.P.; Zhang, H.; Chen, Y.Q.; Chen, W. Review of the roles of conjugated linoleic acid in health and disease. J. Funct. Foods 2015, 15, 314–325. [Google Scholar] [CrossRef]
  27. Bauman, D.; Perfield, J.; Lock, A. Effect of Trans Fatty Acids on Milk Fat and Their Impact on Human Health. In Proceedings of the Southwest Nutrition and Management Conference, Tempe, AZ, USA, 26–27 February 2004; pp. 41–52. [Google Scholar]
  28. Chilliard, Y.; Ferlay, A.; Mansbridge, R.M.; Doreau, M. Ruminant milk fat plasticity: Nutritional control of saturated, polyunsaturated, trans and conjugated fatty acids. Anim. Res. 2000, 49, 181–205. [Google Scholar] [CrossRef] [Green Version]
  29. Siurana, A.; Calsamiglia, S. A metaanalysis of feeding strategies to increase the content of conjugated linoleic acid (CLA) in dairy cattle milk and the impact on daily human consumption. Anim. Feed Sci. Technol. 2016, 217, 13–26. [Google Scholar] [CrossRef]
  30. Decsi, T. Nutritional relevance of trans isomeric fatty acids in human milk. Acta Paediatr. 2003, 92, 1369–1371. [Google Scholar] [CrossRef]
  31. Bhavsar, N.; St-Onge, M.-P. The diverse nature of saturated fats and the case of medium-chain triglycerides. Curr. Opin. Clin. Nutr. Metab. Care 2016, 19, 81–87. [Google Scholar] [CrossRef]
  32. Augustin, K.; Khabbush, A.; Williams, S.; Eaton, S.; Orford, M.; Cross, H.; Heales, S.J.R.; Walker, M.C.; Williams, R.S.B. Mechanisms of action for the medium-chain triglyceride ketogenic diet in neurological and metabolic disorders. Lancet Neurol. 2018, 17, 84–93. [Google Scholar] [CrossRef]
  33. Garcia, C.; Lutz, N.W.; Confort-Gouny, S.; Cozzone, P.J.; Armand, M.; Bernard, M. Phospholipid fingerprints of milk from different mammalians determined by 31P NMR: Towards specific interest in human health. Food Chem. 2012, 135, 1777–1783. [Google Scholar] [CrossRef] [Green Version]
  34. Yamashita, S.; Hashimoto, M.; Haque, A.M.; Nakagawa, K.; Kinoshita, M.; Shido, O.; Miyazawa, T. Oral Administration of Ethanolamine Glycerophospholipid Containing a High Level of Plasmalogen Improves Memory Impairment in Amyloid β-Infused Rats. Lipids 2017, 52, 575–585. [Google Scholar] [CrossRef]
  35. Farah, Z. Composition and characteristics of camel milk. J. Dairy Res. 1993, 60, 603–626. [Google Scholar] [CrossRef] [Green Version]
  36. Rodríguez-Alcalá, L.; Fontecha, J. Major lipid classes separation of buttermilk, and cows, goats and ewes milk by high performance liquid chromatography with an evaporative light scattering detector focused on the phospholipid fraction. J. Chromatogr. A 2010, 1217, 3063–3066. [Google Scholar] [CrossRef]
  37. Wang, X.; Wang, Y.; Xu, J.; Xue, C. Sphingolipids in food and their critical roles in human health. Crit. Rev. Food Sci. Nutr. 2020, 61, 462–491. [Google Scholar] [CrossRef]
  38. Schmelz, E.M.; Zhou, H.; Roberts, P.C. Dietary sphingolipids in colon cancer prevention. In Bioactive Sphingolipids in Cancer Biology and Therapy; Springer: Berlin/Heidelberg, Germany, 2015; pp. 161–188. [Google Scholar]
  39. Rombaut, R.; Dewettinck, K. Properties, analysis and purification of milk polar lipids. Int. Dairy J. 2006, 16, 1362–1373. [Google Scholar] [CrossRef]
  40. Bouhours, J.-F.; Bouhours, D. Galactosylceramide is the major cerebroside of human milk fat globule membrane. Biochem. Biophys. Res. Commun. 1979, 88, 1217–1222. [Google Scholar] [CrossRef]
  41. Newburg, D.S.; Chaturvedi, P. Neutral glycolipids of human and bovine milk. Lipids 1992, 27, 923–927. [Google Scholar] [CrossRef]
  42. Kuchta-Noctor, A.M.; Murray, B.A.; Stanton, C.; Devery, R.; Kelly, P.M. Anticancer Activity of Buttermilk Against SW480 Colon Cancer Cells is Associated with Caspase-Independent Cell Death and Attenuation of Wnt, Akt, and ERK Signaling. Nutr. Cancer 2016, 68, 1234–1246. [Google Scholar] [CrossRef]
  43. Kotaro, T.; Masao, I.; Masahiko, M.; Yoshitaka, N. Selective changes in gangliosides of human milk during lactation: A molecular indicator for the period of lactation. Biochim. Biophys. Acta (BBA)—Lipids Lipid Metab. 1986, 879, 73–77. [Google Scholar] [CrossRef]
  44. Lægreid, A.; Kolstø Otnæss, A.-B.; Fuglesang, J. Human and Bovine Milk: Comparison of Ganglioside Composition and Enterotoxin- Inhibitory Activity. Pediatric Res. 1986, 20, 416–421. [Google Scholar] [CrossRef] [Green Version]
  45. Simpson, M.A.; Cross, H.; Proukakis, C.; Priestman, D.A.; Neville, D.C.A.; Reinkensmeier, G.; Wang, H.; Wiznitzer, M.; Gurtz, K.; Verganelaki, A.; et al. Infantile-onset symptomatic epilepsy syndrome caused by a homozygous loss-of-function mutation of GM3 synthase. Nat. Genet. 2004, 36, 1225–1229. [Google Scholar] [CrossRef] [Green Version]
  46. Gallier, S.; Tolenaars, L.; Prosser, C. Whole Goat Milk as a Source of Fat and Milk Fat Globule Membrane in Infant Formula. Nutrients 2020, 12, 3486. [Google Scholar] [CrossRef] [PubMed]
Figure 1. 31P NMR traces of deacylated Human (red) and Cow (blue) phospholipids. Chemical shifts are shown relative to SM. Abbreviations: GPE—glycerophosphoethanolamine, LEPLAS—lyso−ethanolamine plasmalogen, GPS—glycerophosphoserine, GPI—glycerophosphoinositol, DHSM—dihydrosphingomyelin, GPC—glycerophosphocholine, SM—sphingomyelin.
Separations 09 00145 g001
Figure 2. Gangliosides HPLC traces in samples studies. GD3—black, GM3—pink, N-glycolylneuraminic acid analogue of GD3—blue.
Separations 09 00145 g002
Table 1. Fatty acid composition of the milk samples studied (in weight % of total fatty acids, with only those above 0.1% in at least one of the samples presented).
HumanCowBuffaloSheepGoatCamelDeer
4:00.1 ± 0.012.7 ± 0.204.2 ± 0.072.9 ± 0.042.7 ± 0.130.1 ± 0.014.8 ± 0.39
6:0tr.1.7 ± 0.182.1 ± 0.122.0 ± 0.073.0 ± 0.070.1 ± 0.021.9 ± 0.24
8:00.1 ± 0.0021.1 ± 0.041.0 ± 0.031.8 ± 0.053.5 ± 0.100.1 ± 0.011.0 ± 0.03
10:01.4 ± 0.013.4 ± 0.032.6 ± 0.026.5 ± 0.0212.7 ± 0.010.2 ± 0.012.1 ± 0.02
12:04.9 ± 0.014.3 ± 0.013.2 ± 0.014.2 ± 0.045.3 ± 0.021.2 ± 0.022.8 ± 0.01
14:05.6 ± 0.0312.3 ± 0.0811.2 ± 0.0412.5 ± 0.1110.0 ± 0.0314.4 ± 0.2512.2 ± 0.13
i15:00.1 ± 0.0030.2 ± 0.0020.5 ± 0.0020.4 ± 0.010.2 ± 0.0040.5 ± 0.010.4 ± 0.00
14:1n-50.2 ± 0.011.1 ± 0.020.8 ± 0.0030.3 ± 0.010.1 ± 0.011.4 ± 0.020.5 ± 0.00
ai15:00.1 ± 0.0040.5 ± 0.010.8 ± 0.0040.7 ± 0.010.5 ± 0.0030.8 ± 0.010.6 ± 0.01
15:00.4 ± 0.011.1 ± 0.0041.4 ± 0.0041.2 ± 0.010.9 ± 0.011.4 ± 0.011.1 ± 0.02
i16:00.1 ± 0.0020.2 ± 0.0020.4 ± 0.010.2 ± 0.0020.2 ± 0.0020.4 ± 0.010.3 ± 0.002
16:021.4 ± 0.0636.0 ± 0.2626.4 ± 0.0326.6 ± 0.1223.4 ± 0.0629.7 ± 0.2225.7 ± 0.46
16:1n-72.4 ± 0.021.7 ± 0.0031.5 ± 0.011.1 ± 0.010.3 ± 0.029.3 ± 0.101.1 ± 0.03
i17:00.1 ± 0.010.3 ± 0.010.4 ± 0.0050.4 ± 0.010.3 ± 0.010.4 ± 0.020.4 ± 0.01
ai17:00.2 ± 0.020.6 ± 0.010.5 ± 0.0020.7 ± 0.040.5 ± 0.020.6 ± 0.020.4 ± 0.02
17:00.3 ± 0.0040.5 ± 0.0020.7 ± 0.010.5 ± 0.020.6 ± 0.010.7 ± 0.0020.6 ± 0.02
18:05.6 ± 0.019.5 ± 0.0510.8 ± 0.029.1 ± 0.0310.8 ± 0.0313.2 ± 0.0114.9 ± 0.61
18:1 9t + (6t–8t)0.1 ± 0.010.4 ± 0.010.5 ± 0.010.4 ± 0.020.5 ± 0.010.8 ± 0.020.4 ± 0.01
18:1 10t & 11t0.6 ± 0.012.1 ± 0.0053.7 ± 0.012.5 ± 0.032.4 ± 0.0041.3 ± 0.012.6 ± 0.02
Other 18:1 trans0.1 ± 0.010.3 ± 0.020.2 ± 0.0020.3 ± 0.020.6 ± 0.0030.1 ± 0.010.3 ± 0.01
18:1 9c37.2 ± 0.0215.7 ± 0.0621.6 ± 0.0720.7 ± 0.0417.0 ± 0.0518.6 ± 0.2420.1 ± 0.44
18:1 11c1.9 ± 0.010.3 ± 0.010.6 ± 0.010.4 ± 0.020.3 ± 0.0031.0 ± 0.0050.7 ± 0.01
18:1 12ctr.0.1 ± 0.0010.1 ± 0.0030.1 ± 0.010.2 ± 0.0040.1 ± 0.0010.1 ± 0.00
18:2n-612.5 ± 0.041.2 ± 0.031.7 ± 0.0041.1 ± 0.061.3 ± 0.021.0 ± 0.061.5 ± 0.04
18:3n-31.4 ± 0.0031.0 ± 0.010.8 ± 0.0040.9 ± 0.011.4 ± 0.010.9 ± 0.021.6 ± 0.05
20:00.1 ± 0.010.1 ± 0.0020.2 ± 0.010.2 ± 0.010.1 ± 0.010.3 ± 0.010.2 ± 0.01
9c,11t CLA0.4 ± 0.0040.8 ± 0.0041.6 ± 0.011.7 ± 0.020.8 ± 0.010.5 ± 0.021.1 ± 0.03
20:1n-90.4 ± 0.01tr.tr.tr.tr.0.2 ± 0.010.1 ± 0.002
20:2n-60.2 ± 0.01tr.tr.tr.tr.tr.tr.
20:3n-60.4 ± 0.01tr.0.1 ± 0.0004tr.tr.tr.tr.
20:4n-60.4 ± 0.0040.1 ± 0.0010.1 ± 0.0040.1 ± 0.0050.1 ± 0.010.1 ± 0.0030.1 ± 0.005
11c-22:10.1 ± 0.0040.1 ± 0.002tr.tr.tr.tr.tr.
20:5n-30.1 ± 0.0030.1 ± 0.0020.1 ± 0.010.1 ± 0.0040.1 ± 0.0030.1 ± 0.0010.1 ± 0.004
24:00.1 ± 0.01tr.0.1 ± 0.01tr.tr.0.1 ± 0.0050.1 ± 0.01
22:5n-30.3 ± 0.0040.2 ± 0.010.1 ± 0.010.2 ± 0.010.2 ± 0.0030.2 ± 0.010.2 ± 0.01
22:6n-30.4 ± 0.004tr.tr.0.1 ± 0.010.1 ± 0.002tr.tr.
Saturated40.574.766.369.874.664.169.5
Medium-chain1.56.35.710.319.20.35.0
Total monoenoic43.221.829.025.821.332.825.8
cis-monoenoic42.319.024.622.717.930.622.5
trans-monoenoic0.92.84.43.13.42.23.3
Polyunsaturated16.13.44.54.34.03.04.6
“tr.”—traces, < 0.1%.
Table 2. Phospholipids in the samples studied (presented as averages ± standard deviations in weight % of total phospholipids, unless otherwise indicated). Samples were analysed in triplicate; human milk data is averaged from the data from the three different donors’ milks.
Phospholipids *HumanCowBuffaloSheepGoatCamelDeer
PC23.7 ± 0.126.1 ± 0.531.1 ± 1.224.2 ± 1.425.1 ± 0.221.1 ± 0.623.1 ± 0.0
PI7.0 ± 0.17.9 ± 0.74.6 ± 0.85.9 ± 0.67.2 ± 0.46.8 ± 0.16.5 ± 0.3
PS9.0 ± 0.112.6 ± 0.98.7 ± 0.811.7 ± 1.012.1 ± 0.810.7 ± 1.010.8 ± 0.2
EPLAS7.9 ± 0.11.5 ± 0.71.9 ± 0.22.1 ± 0.73.1 ± 0.34.6 ± 0.12.3 ± 0.2
PE18.8 ± 0.122.9 ± 4.229.9 ± 0.425.8 ± 1.924.9 ± 1.223.5 ± 1.027.9 ± 0.7
SM32.3 ± 0.0124.6 ± 3.118.4 ± 0.828.7 ± 0.426.0 ± 1.532.6 ± 0.724.9 ± 1.0
DHSM1.3 ± 0.24.5 ± 0.54.9 ± 1.11.6 ± 0.41.6 ± 0.20.7 ± 0.14.4 ± 0.2
% PL w/w in lipid0.66 ± 0.10.61 ± 0.030.66 ± 0.050.74 ± 0.10.87 ± 0.011.17 ± 0.020.88 ± 0.01
PL (mg/100g milk)24.4 ± 0.524.4 ± 1.543.1 ± 2.950.5 ± 4.028.9 ± 0.831.7 ± 0.565.0 ± 0.0
* PC—phosphatidylcholine, PI—phosphatidylinositol, PS—phosphatidylserine, EPLAS—ethanolamine plasmalogen, PE—phosphatidylethanolamine, SM—sphingomyelin, DHSM—dihydrosphingomyelin, PL—phospholipids.
Table 3. Hexosylceramides and lactosylceramide in the samples studied (presented as averages ± standard deviations in weight % of total lipids.
HexosylceramidesLactosylceramideHexCer/LacCer
Human0.016 ± 0.0020.010 ± 0.0021.6
Cow0.034 ± 0.0010.037 ± 0.0030.9
Buffalo0.047 ± 0.0050.066 ± 0.0080.7
Sheep0.034 ± 0.0020.059 ± 0.0020.6
Goat0.058 ± 0.0020.099 ± 0.0040.6
Camel0.094 ± 0.0030.103 ± 0.0060.9
Deer0.009 ± 0.0000.043 ± 0.0020.2
Table 4. Ganglioside content of the milks studied (in mg/100g of milk).
GD3GM3GD3 glyc*GM3/GD3
Human5.25 ± 0.43.46 ± 0.3n.d.0.7
Cow3.03 ± 0.17tr.n.d.
Buffalo0.87 ± 0.010.12 ± 0.01n.d.0.1
Sheepn.d.n.d.n.d.
Goatn.d.n.d.0.30 ± 0.03
Cameln.d.0.11 ± 0.01n.d.
Deer0.18 ± 0.023.43 ± 0.06n.d.19.4
tr.—traces, < 0.1 mg/100 g milk; n.d.—not detected; GD3 glyc*—N-glycolylneuraminic acid analogue of GD3.
Publisher’s Note: MDPI stays neutral with regard to jurisdictional claims in published maps and institutional affiliations.

