Abstract
This paper describes the isosteric enthalpy through narrow pores at low levels of coverage through adsorption of CO2, CH4, and H2 on pores in natural chabazite exchanged with aqueous solutions of Na+, Mg2+, and Ca2+ salts at different concentrations, and with variable time and temperature of treatment. Experimental data of CO2, CH4, and H2 adsorption were treated by the Freundlich and Langmuir equations. Complementarily, the degree of interaction of these gases with these zeolites was evaluated by the evolution of isosteric enthalpy of adsorption. The exchange with Mg2+ and Na+ favors an increase in the adsorption capacity for CO2. while that of Ca2+ and Mg2+ favor adsorption through to H2 and CH4. These cations occupy sites in strategic positions S4 and S4’, which are located in the channels and nanocavities of these zeolites. The presence of Ca2+ and Mg2+ at S4 and S4′ sites causes increased adsorption into the nanocavities and on the external area of the ion-exchanged zeolites. Depending on the conditions of the exchange treatment, Ca2+ and Mg2+, and Na+ were found to be most favorable, well distributed, and accessible for CO2, CH4, and H2 adsorption.
1. Introduction
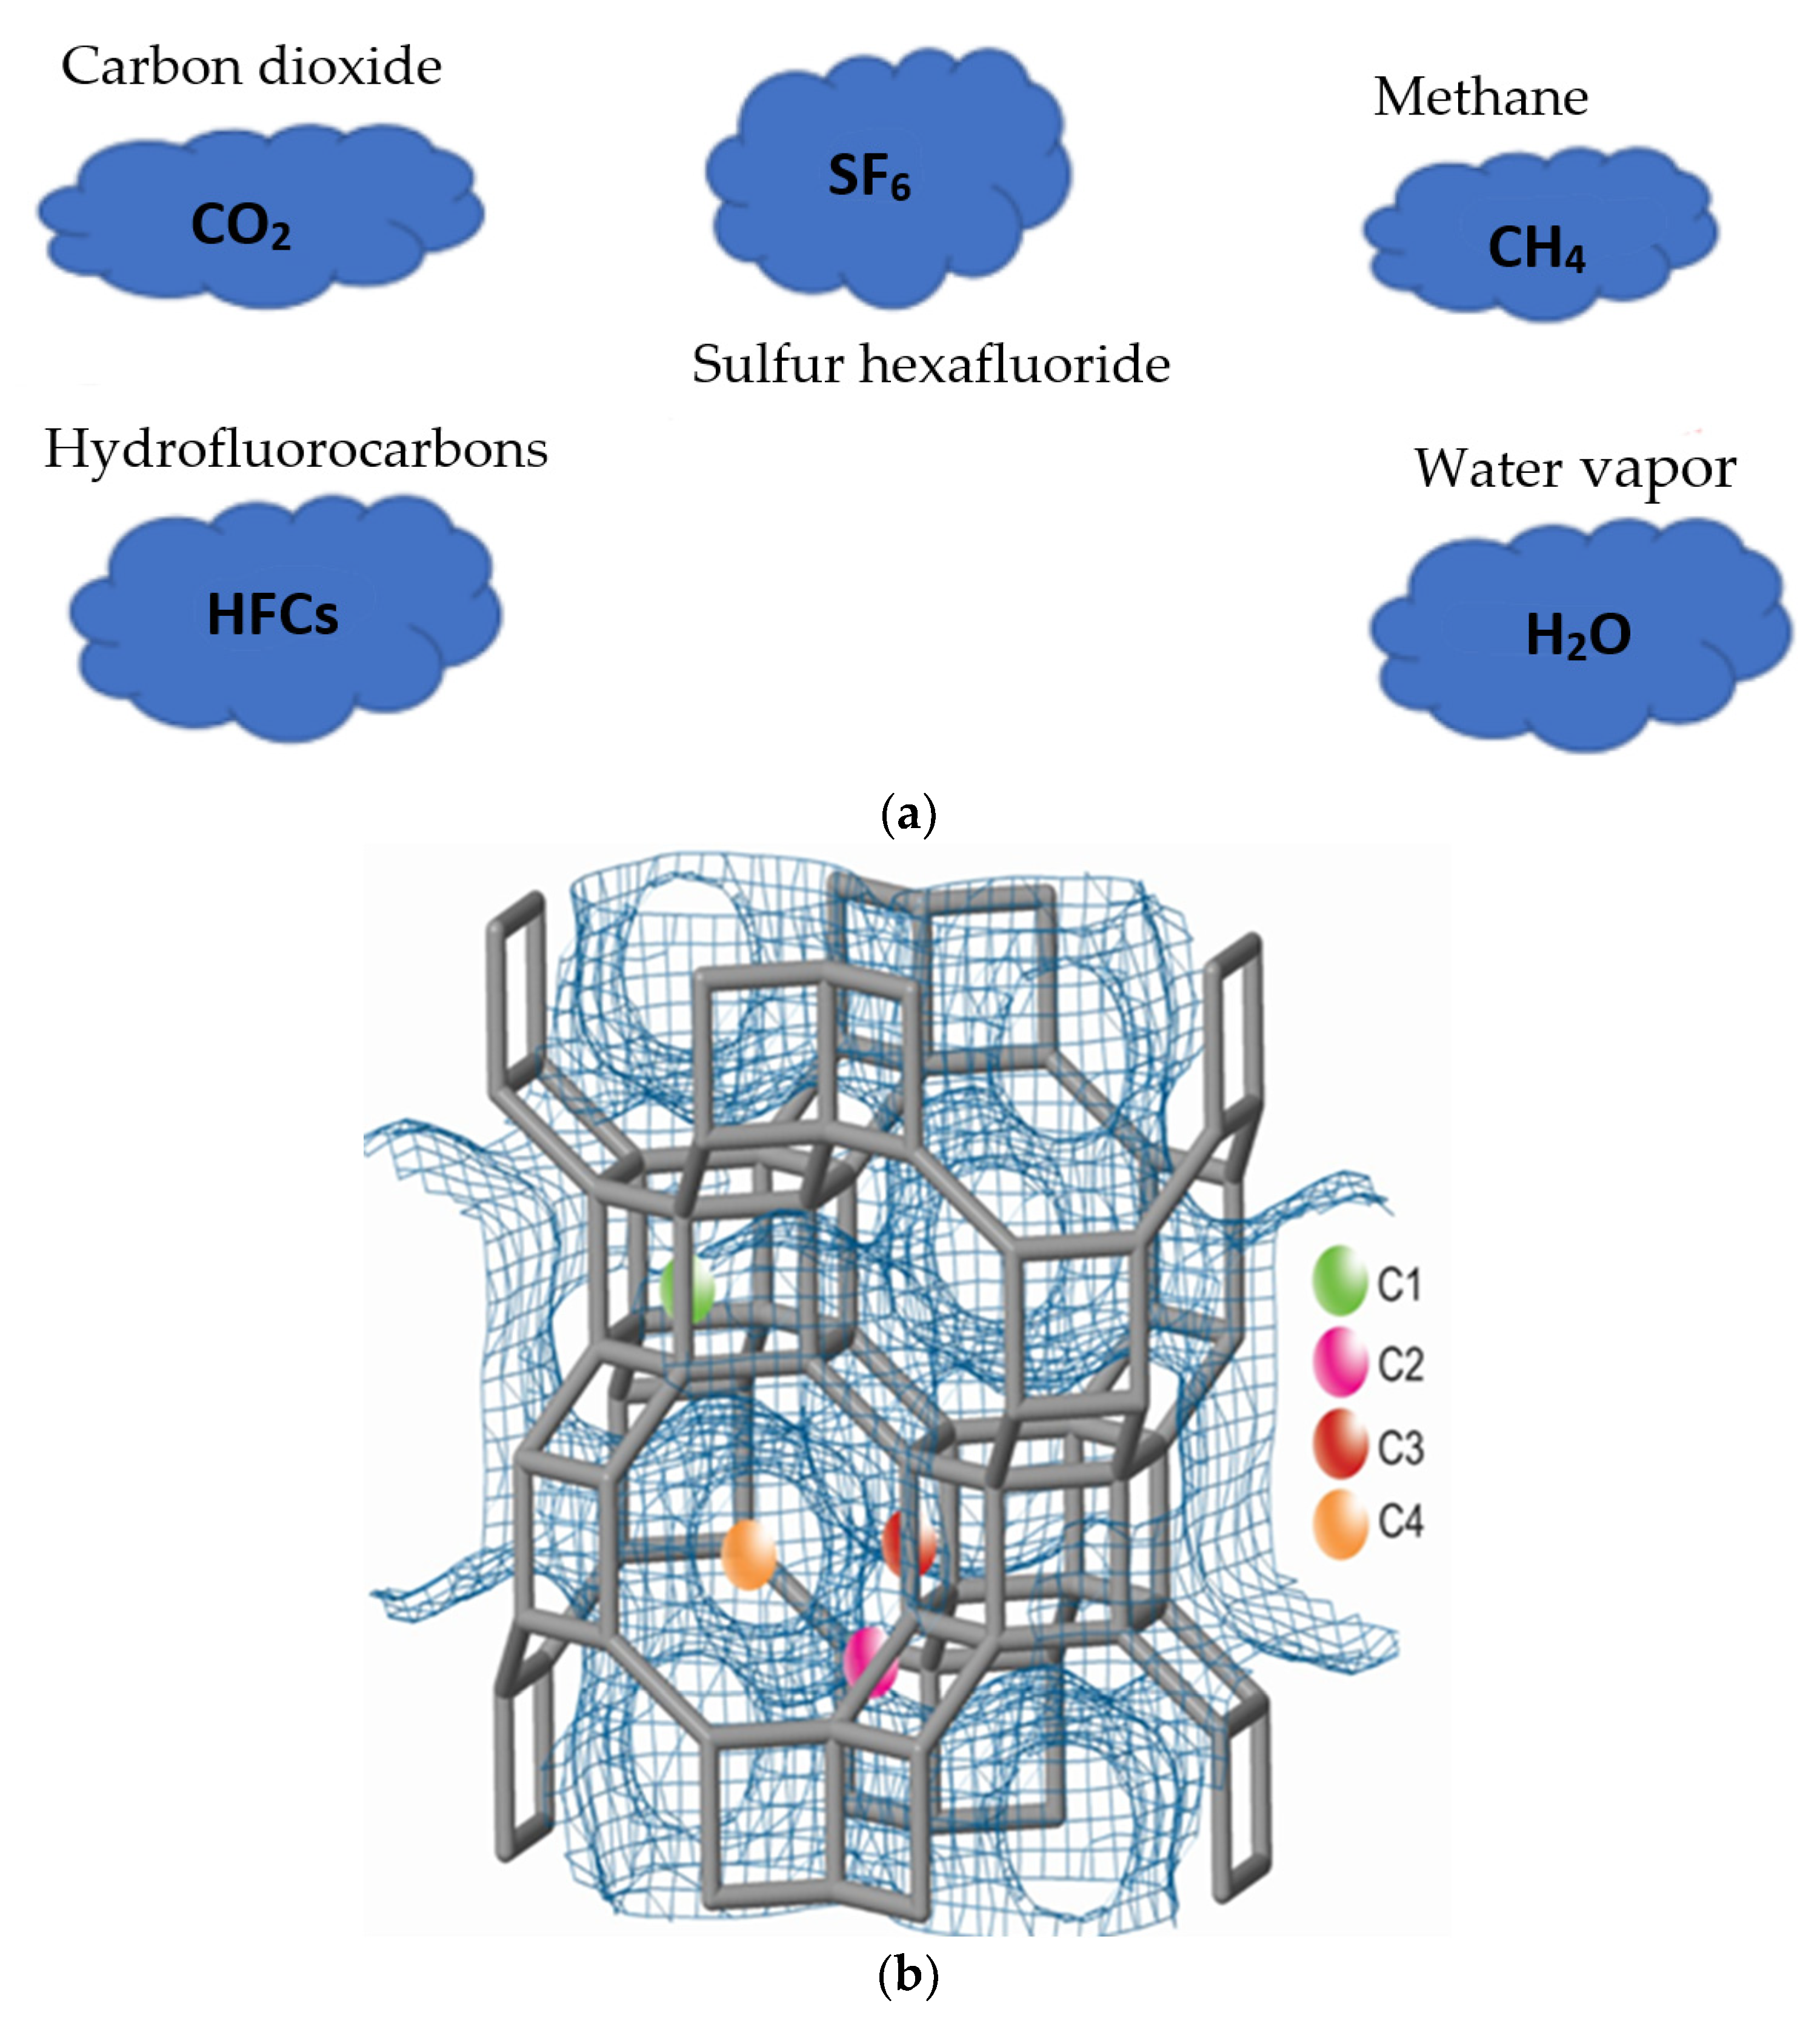
In recent years, the concentration of greenhouse effect gases (GHG) in the atmosphere has increased exponentially due to the increase in the number of inhabitants of the planet and the development of technologies that do not consider the environmental impact they produce. According to the national inventory of greenhouse gases in Mexico (2018), CO2 emissions were 532,830,899 Gg of CO2, while those of CH4 were 143,572,906 Gg of CO2 [1], these being the two main chemical compound pollutants that correspond to 94% of total GHG. Specifically, in Mexico City and the metropolitan area, more than 43,909,047 tons/year of CO2 were emitted and 411,341 tons/year of CH4 [2]. Figure 1a shows the main greenhouse gases that promote global warming. Controlling the amount of CO2 and CH4 in the atmosphere due to emission by anthropogenic activities is one of the most important scientific and environmental challenges today [3]. The storage of CO2 and CH4 becomes a new motivation for the development and functionalization of adsorbent materials. Indeed, advances in science and engineering at the nanoscale provide unprecedented opportunities to develop more cost-effective and environmentally acceptable gas purification systems, as having a low cost and widely available feedstock or a simple synthesis process is preferable [4]. Small-pore zeolites are known effective adsorbents with a high adsorption capacity at high pressures and low temperatures of CO2 and CH4. Examples of these are, in addition to LTA [5,6], NaY [7], MOF-74 [8], RHO [9], CHA [10,11], HEU, and 13X [12,13] zeolites, which present values ranging from 0.15 to 5.5 mmol/g in the temperature range of 273–373 K. However, these values are mainly for synthetic zeolites that involve additional energy and environmental cost to obtain. Among the most relevant applications in the separation of these gases are the enrichment of the energy value of natural gas, air purification, and the prevention of corrosion of equipment [12].
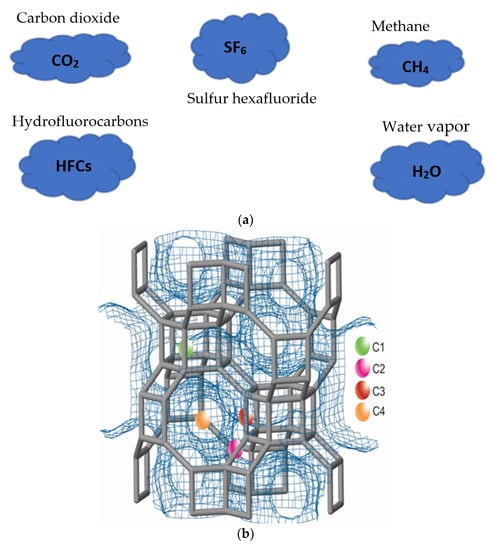
Figure 1.
(a) Main greenhouse gases causing global warming. (b) Cationic chabazite positions: C1, D6R, C2, 8MR, C3, D6R and C4, 8MR.
Chabazite (CHA) zeolites [14] have been the best-known zeolites for a long time. This zeolite is found in four mineral species that differ in the dominant cation: Ca-chabazite, Na-chabazite, K-chabazite, and Sr-chabazite [15]. Of these zeolites, Ca-chabazite is the one that exists in greater abundance and better studied. This zeolite has a trigonal crystalline system and a space group R3 [16]; it has a lattice that consists of a stacked sequence that forms 6-part double rings (D6R) at each apex of the unit cell (Figure 1b). The largest perpendicular channels are confined by eight-membered rings with an aperture of 0.38 × 0.38 nm, which is why it is considered a small-pore zeolite. There are four cationic sites in the channels that can be seen in Figure 1b, (C1, C2, C3, and C4). Of these positions, the greatest exchange takes place in the C1 and C3 sites where there is a greater exposure to the treatments; the C2 and C4 positions can be replaced to a lesser extent. Its applications are very varied, however, as it has this pore diameter, it is suggested to apply it in the adsorption of greenhouse gases with great success [17,18].
In this work we investigate and compare the adsorption of CO2, CH4, and H2, and the isosteric enthalpy of these gases in a series of zeolites of framework type CHA, natural and exchanged. The novelty of this work is based on the study of nanoporosity of the zeolite CHA through adsorption studies using the Dubinin–Astakhov theory, differential adsorption curves and their applications in adsorption of GEI. The objective of this work is to estimate the degree of interaction of greenhouse gases (CO2, H2, and CH4) by dynamic methods in natural chabazite zeolite (CHAN) and exchanged with salts (CHANa, CHACa, and CHAMg) with low concentrations.
2. Materials and Methods
Natural zeolites from deposits located in Divisaderos, Sonora, Mexico, were selected for this work. As a reference for characterization, the zeolite SSZ-39 was used. The salts CaCl2, MgCl2, and NaCl were purchased from Aldrich and the gases N2, CH4, CO2, H2, and He > 99.999%, supplied by INFRA Corp., were used. The physical properties of the adsorbables used in this work are listed in Table 1 [17]. The CHAN sample is (label accounts for) the natural chabazite sample, which is free of any treatment. Exchanged chabazite samples CHACaX, CHAMgX, and CHANaX were prepared from CHAN precursor and exchanged either X = 1, 2, or 3 times with 0.01 N solutions of the corresponding cation chloride salts (i.e., CaCl2, MgCl2, and NaCl) at 50 °C for 6 h. XRD studies were determined through a Bruker D8 diffractometer (Bruker, Co., Billerica, MA, USA) using nickel-filtered CuKα (λ = 0.154 nm) radiation operated at 40 kV and 30 mA [19]. The patron was refined by the Rietveld method to confirm the composition of crystalline phases. Quantitative chemical analyses were obtained through QUANT-EXPRESS method (fundamental parameters) in the sodium (Na) to uranium (U) range in an X-ray fluorescence spectrometer (S8-TIGER, Bruker, Co., Billerica, MA, USA). Photomicrographs of the samples under study were obtained with a JEOL, model JSM-7800F (JEOL USA, Inc., Peabody, MA, USA) high-resolution scanning electron microscope at 5 kV. The samples were mounted on aluminum stub holders and subsequently coated with Au using a sputtering coater. N2 adsorption–desorption isotherms were carried out at the boiling point of nitrogen liquid (76.6 K) at an altitude of 2200 m in Puebla City, Mexico (2200 above mean sea level AMSL), using an automatic volumetric adsorption system (Quantachrome AutoSorb-1C, Quantachrome Instruments, Boynton Beach, FL, USA). This system includes, in addition to the mechanical pump, a turbomolecular pump and a low-pressure transducer, which is located close to the measuring adsorption cell as this ensures a better balance. N2 adsorption isotherms were evaluated at the relative pressure range (p/p0) [10−6–0.1], where p is the adsorption pressure and p0 is the saturation pressure at 76.6 K of N2. A specific mesh size of 0.250 mm was used for all samples. Before carrying out the experimental runs, the samples were degassed via thermal treatments at 623 K for 18 h under a vacuum of 10−5 Torr. The microporosity of these zeolites was studied using the Dubinin–Polanyi volumetric filling theory of micropores [20] in the area of relative pressures p/p0 = [10−6–0.2], the high-resolution t-plots in the area of p/p0 = [10−6–0.8], as well as the adsorption differential curves DAC [21]. This procedure consists of determining the derivative of the t plot (i.e., a curve of the adsorbed volume versus the thickness, t, of the adsorbed layer) to give an approximate idea of the main pore sizes of a nanomaterial. The specific surface area (ASL and ASB) and microporous volume (W0) were calculated using the Langmuir, BET, and t-plot methods, respectively. Mesopore size distribution was calculated by the Barrett–Joyner–Halenda (BJH) method, applied to the N2 desorption boundary isotherm [22]. The gas adsorption isotherms of CO2 at temperatures of 473–573 K, CH4, and H2 at temperatures of 298-473 K, were obtained on a Shimadzu GC-14A gas chromatograph (Shimadzu Co. KK, Kyoto, Japan) equipped with a thermal conductivity detector. The chromatographic columns were made of glass and packed with the adsorbents to be studied. Before carrying out the experimental runs, the samples introduced into the columns were subjected to a dehydration process in situ in a regulated flow of carrier gas at 573 K for 8 h. He carrier gas flows of different speeds were measured at the column outlet with a flowmeter. Injections of different volumes of the adsorbates were introduced to the chromatographic column (i.d. = 5 mm and length 50 cm). The injected volumes were introduced through a 6-way valve and were 2 mL. All the chromatographic peaks were recorded in an interface and do not show evidence of chemical conversion of the adsorbables. The method followed in this work to obtain the chromatographic peaks was the dynamic adsorption method of gas chromatography or inverse adsorption chromatography IGC [23].

Table 1.
Properties of gases used in this work.
Data corresponding to the adsorption of CO2, CH4, and H2 on Chabazite samples were fitted to standard Freundlich and Langmuir isotherm models through linear regression to determine the adsorption parameters pertinent to each of the above approaches. The Freundlich adsorption equation can be written as:
where a is the adsorbed amount (mmol g−1), KF is the Freundlich adsorption constant, and n is an exponential factor. All gas adsorption data were fitted to the standard Langmuir adsorption equation through linear regression. From gas adsorption data at low pressures, it is possible to evaluate the Henry constants (KH) at different temperatures for the series of adsorbent–adsorptive pairs employed in this work according to the following expression [24]:
where a represents the amount adsorbed on the solid walls at pressure p, while am is the monolayer capacity evaluated from the Langmuir equation:
where Kam = KH, which can be tested graphically by plotting 1/a versus 1/p:
a = KF + p1/n
KH = limp→0 (a/amp)
θ = a/am = Kp/1 + Kp
1/a = 1/am + 1/amKp
The isosteric enthalpy of adsorption, qst (kJ mol−1), at zero coverage can be evaluated from the adsorption isotherms data through a Clausius–Clapeyron equation [25]:
where p and T are the equilibrium pressure and temperature at a given adsorbate loading (a).
[∂lnp/∂T]a = qsta/RT2
3. Results
3.1. X-ray Analysis (XRD)
Figure 2 shows the diffraction patterns of the zeolites under study. The powder patterns were analyzed according to the Rietveld method [26], using the High Score Plus 3.0 software [27]. Crystalline phases were identified using the database of the International Centre for Diffraction Data for Inorganic Substances (Inorganic Crystal Structure Database). The X-ray diffraction pattern of natural zeolite shows CHA-type zeolite as the main phase. Minor phases present include Ca-clinoptilolite, montmorillonite, and quartz, Table 2.
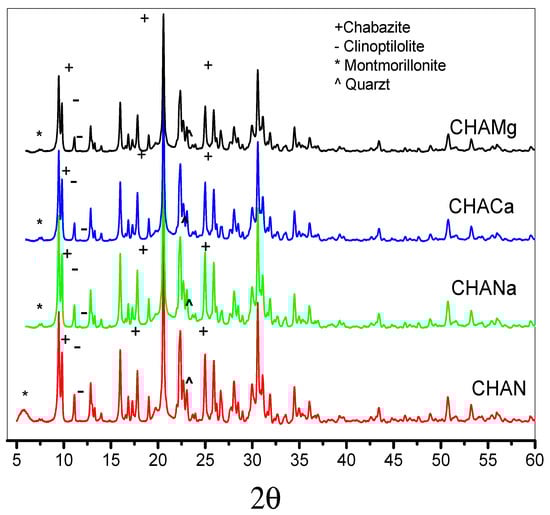
Figure 2.
X-ray diffraction of natural (CHAN) and exchanged chabazite (CHANa, CHACa, and CHAMg), Rietveld refinement.
Table 2.
Mineralogical phases of natural zeolite used in the study (wt%), XRD.
3.2. X-ray Fluorescence (XRF)
The results of the estimation of the chemical composition through X-ray fluorescence (XRF) of natural (CHAN) and exchanged chabazite are presented in Table 3.
Table 3.
Chemical composition (% weight) of natural (CHAN) and exchanged chabazite samples, XRF.
3.3. Scanning Electron Microscopy (SEM)
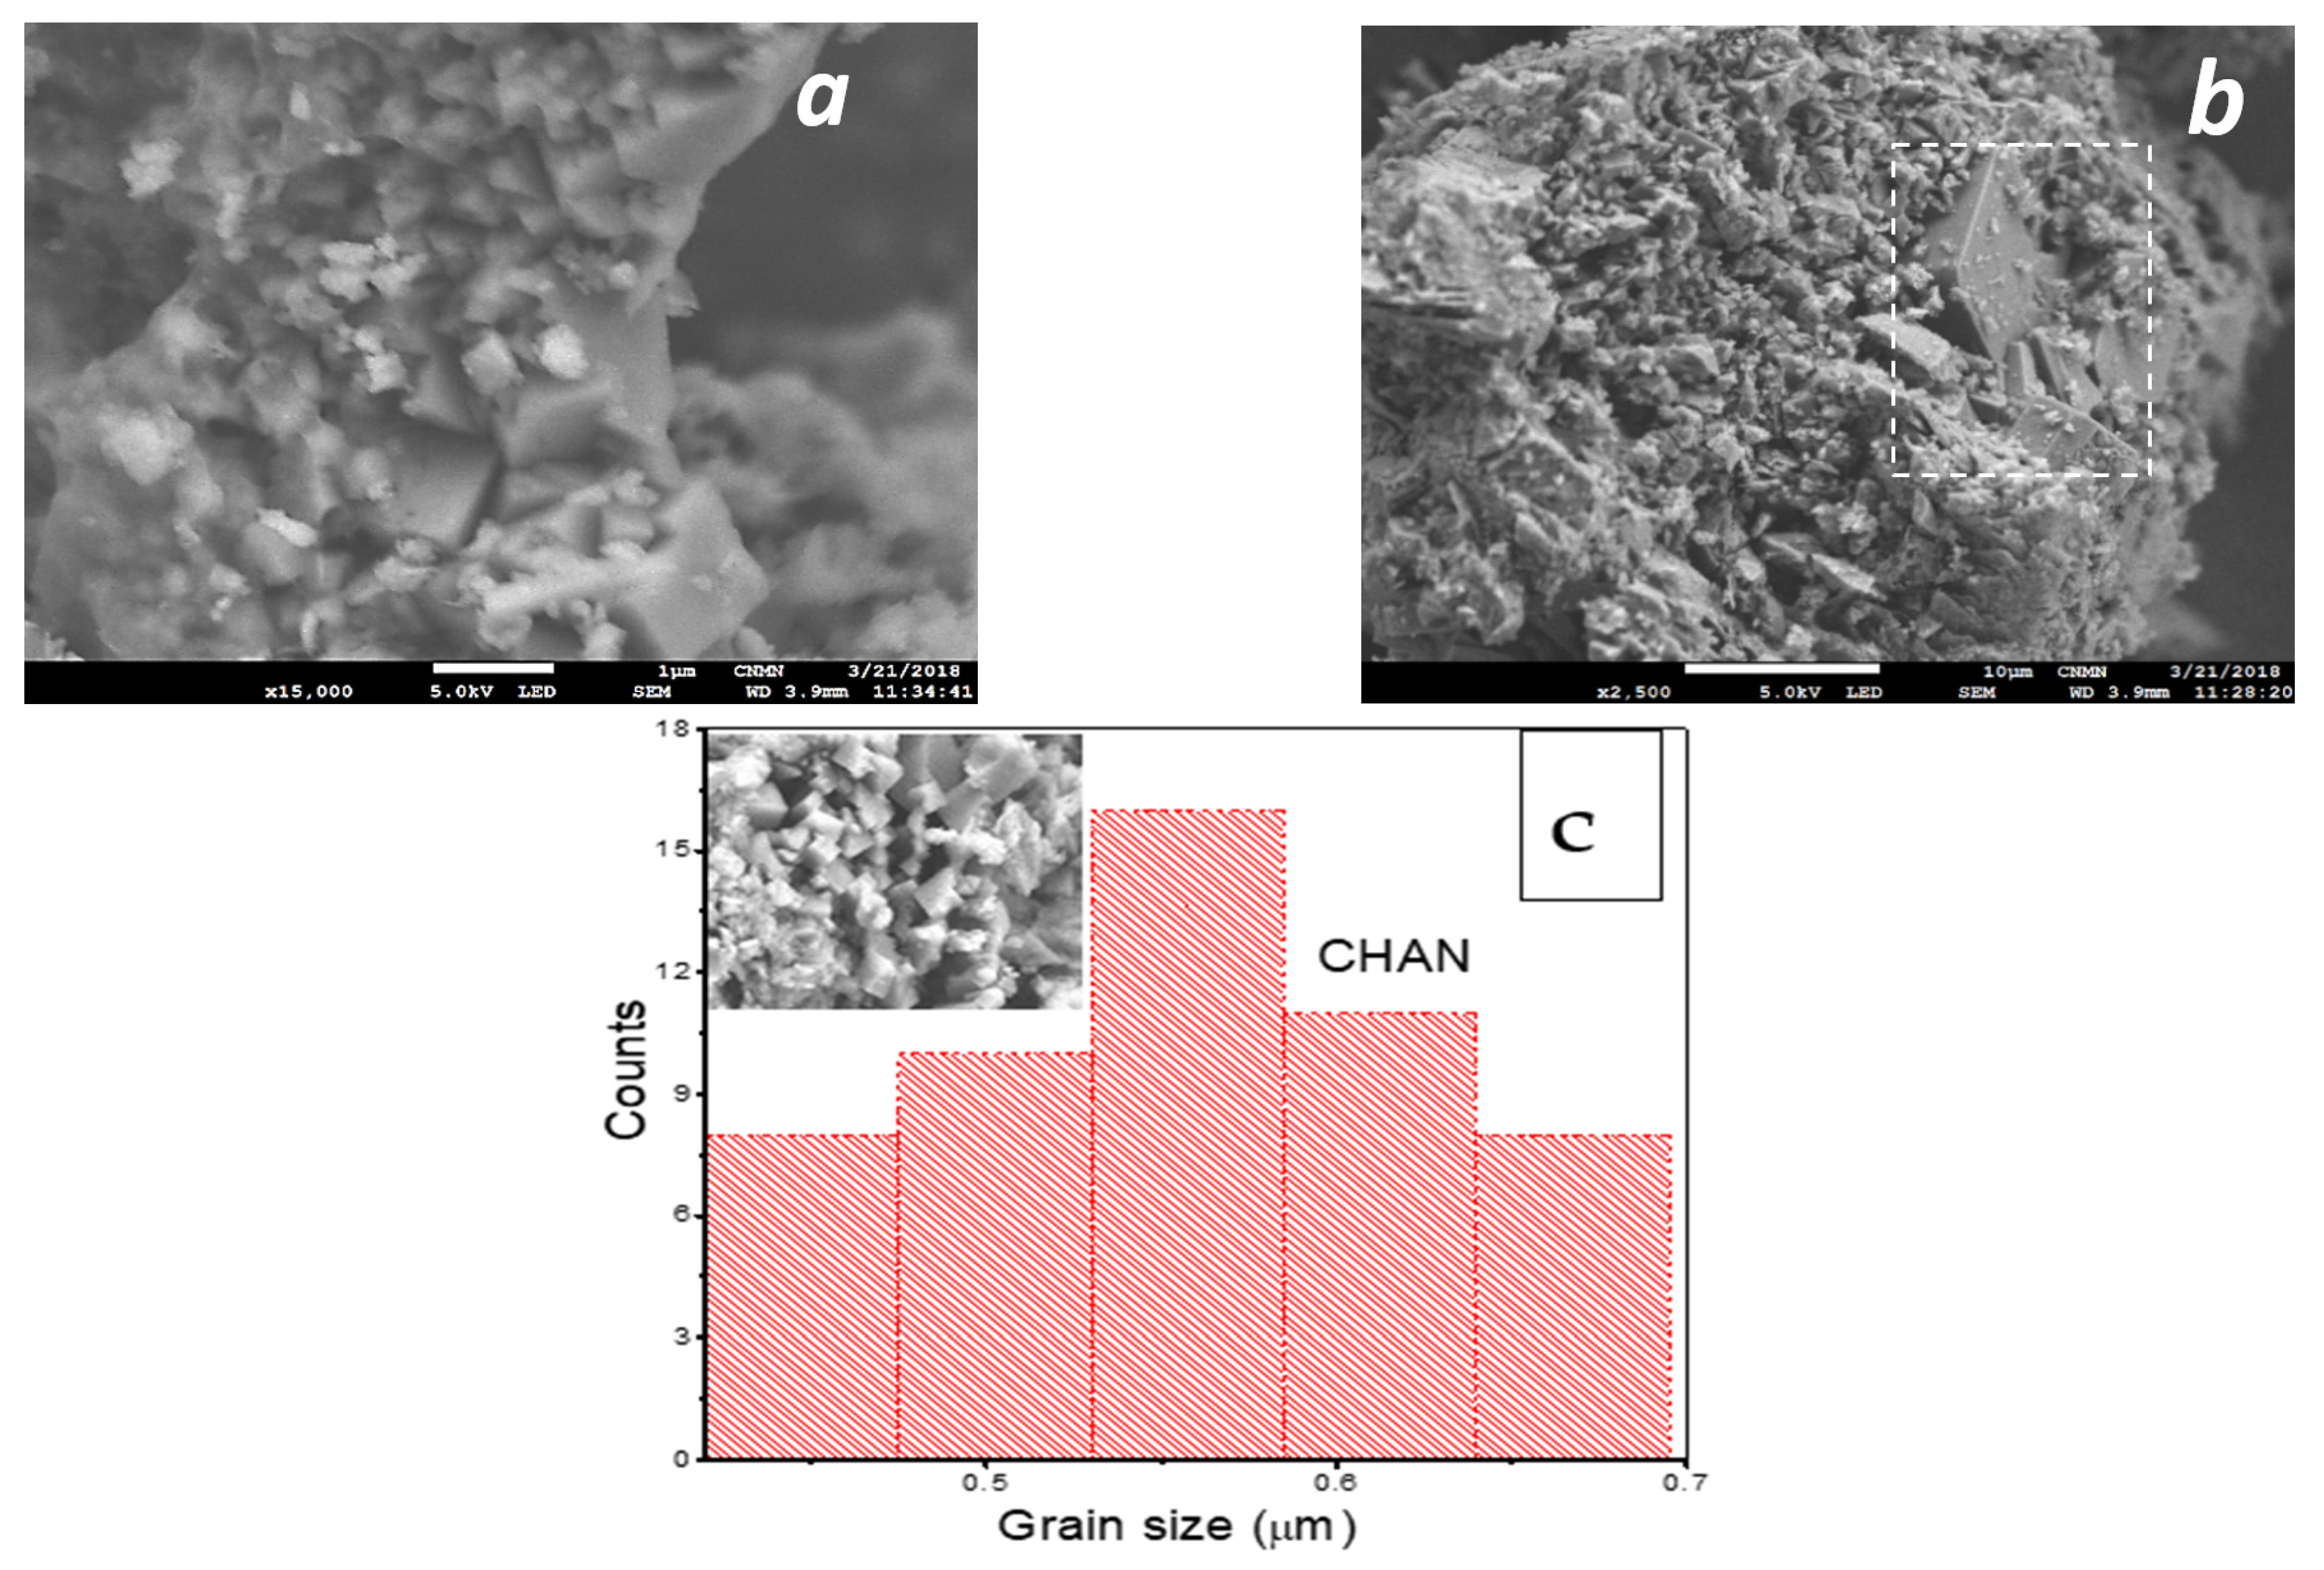
SEM images of the natural chabazite zeolites at 15,000 are displayed in Figure 3a,b and in Figure 3c is noted the particle size histogram of CHAN.
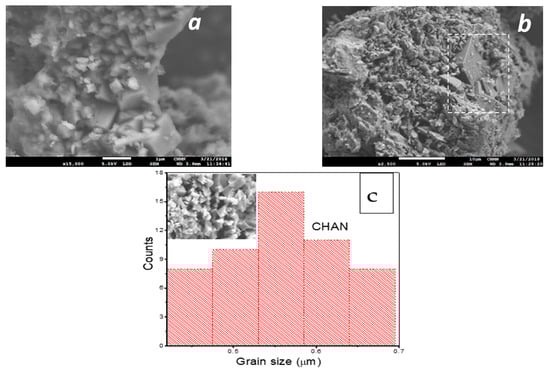
Figure 3.
Micrographs of: (a) CHAN—×15,000, (b) accompanying crystalline phase, clinoptilolite, and (c) particle size histogram chabazite zeolite.
3.4. N2 Adsorption
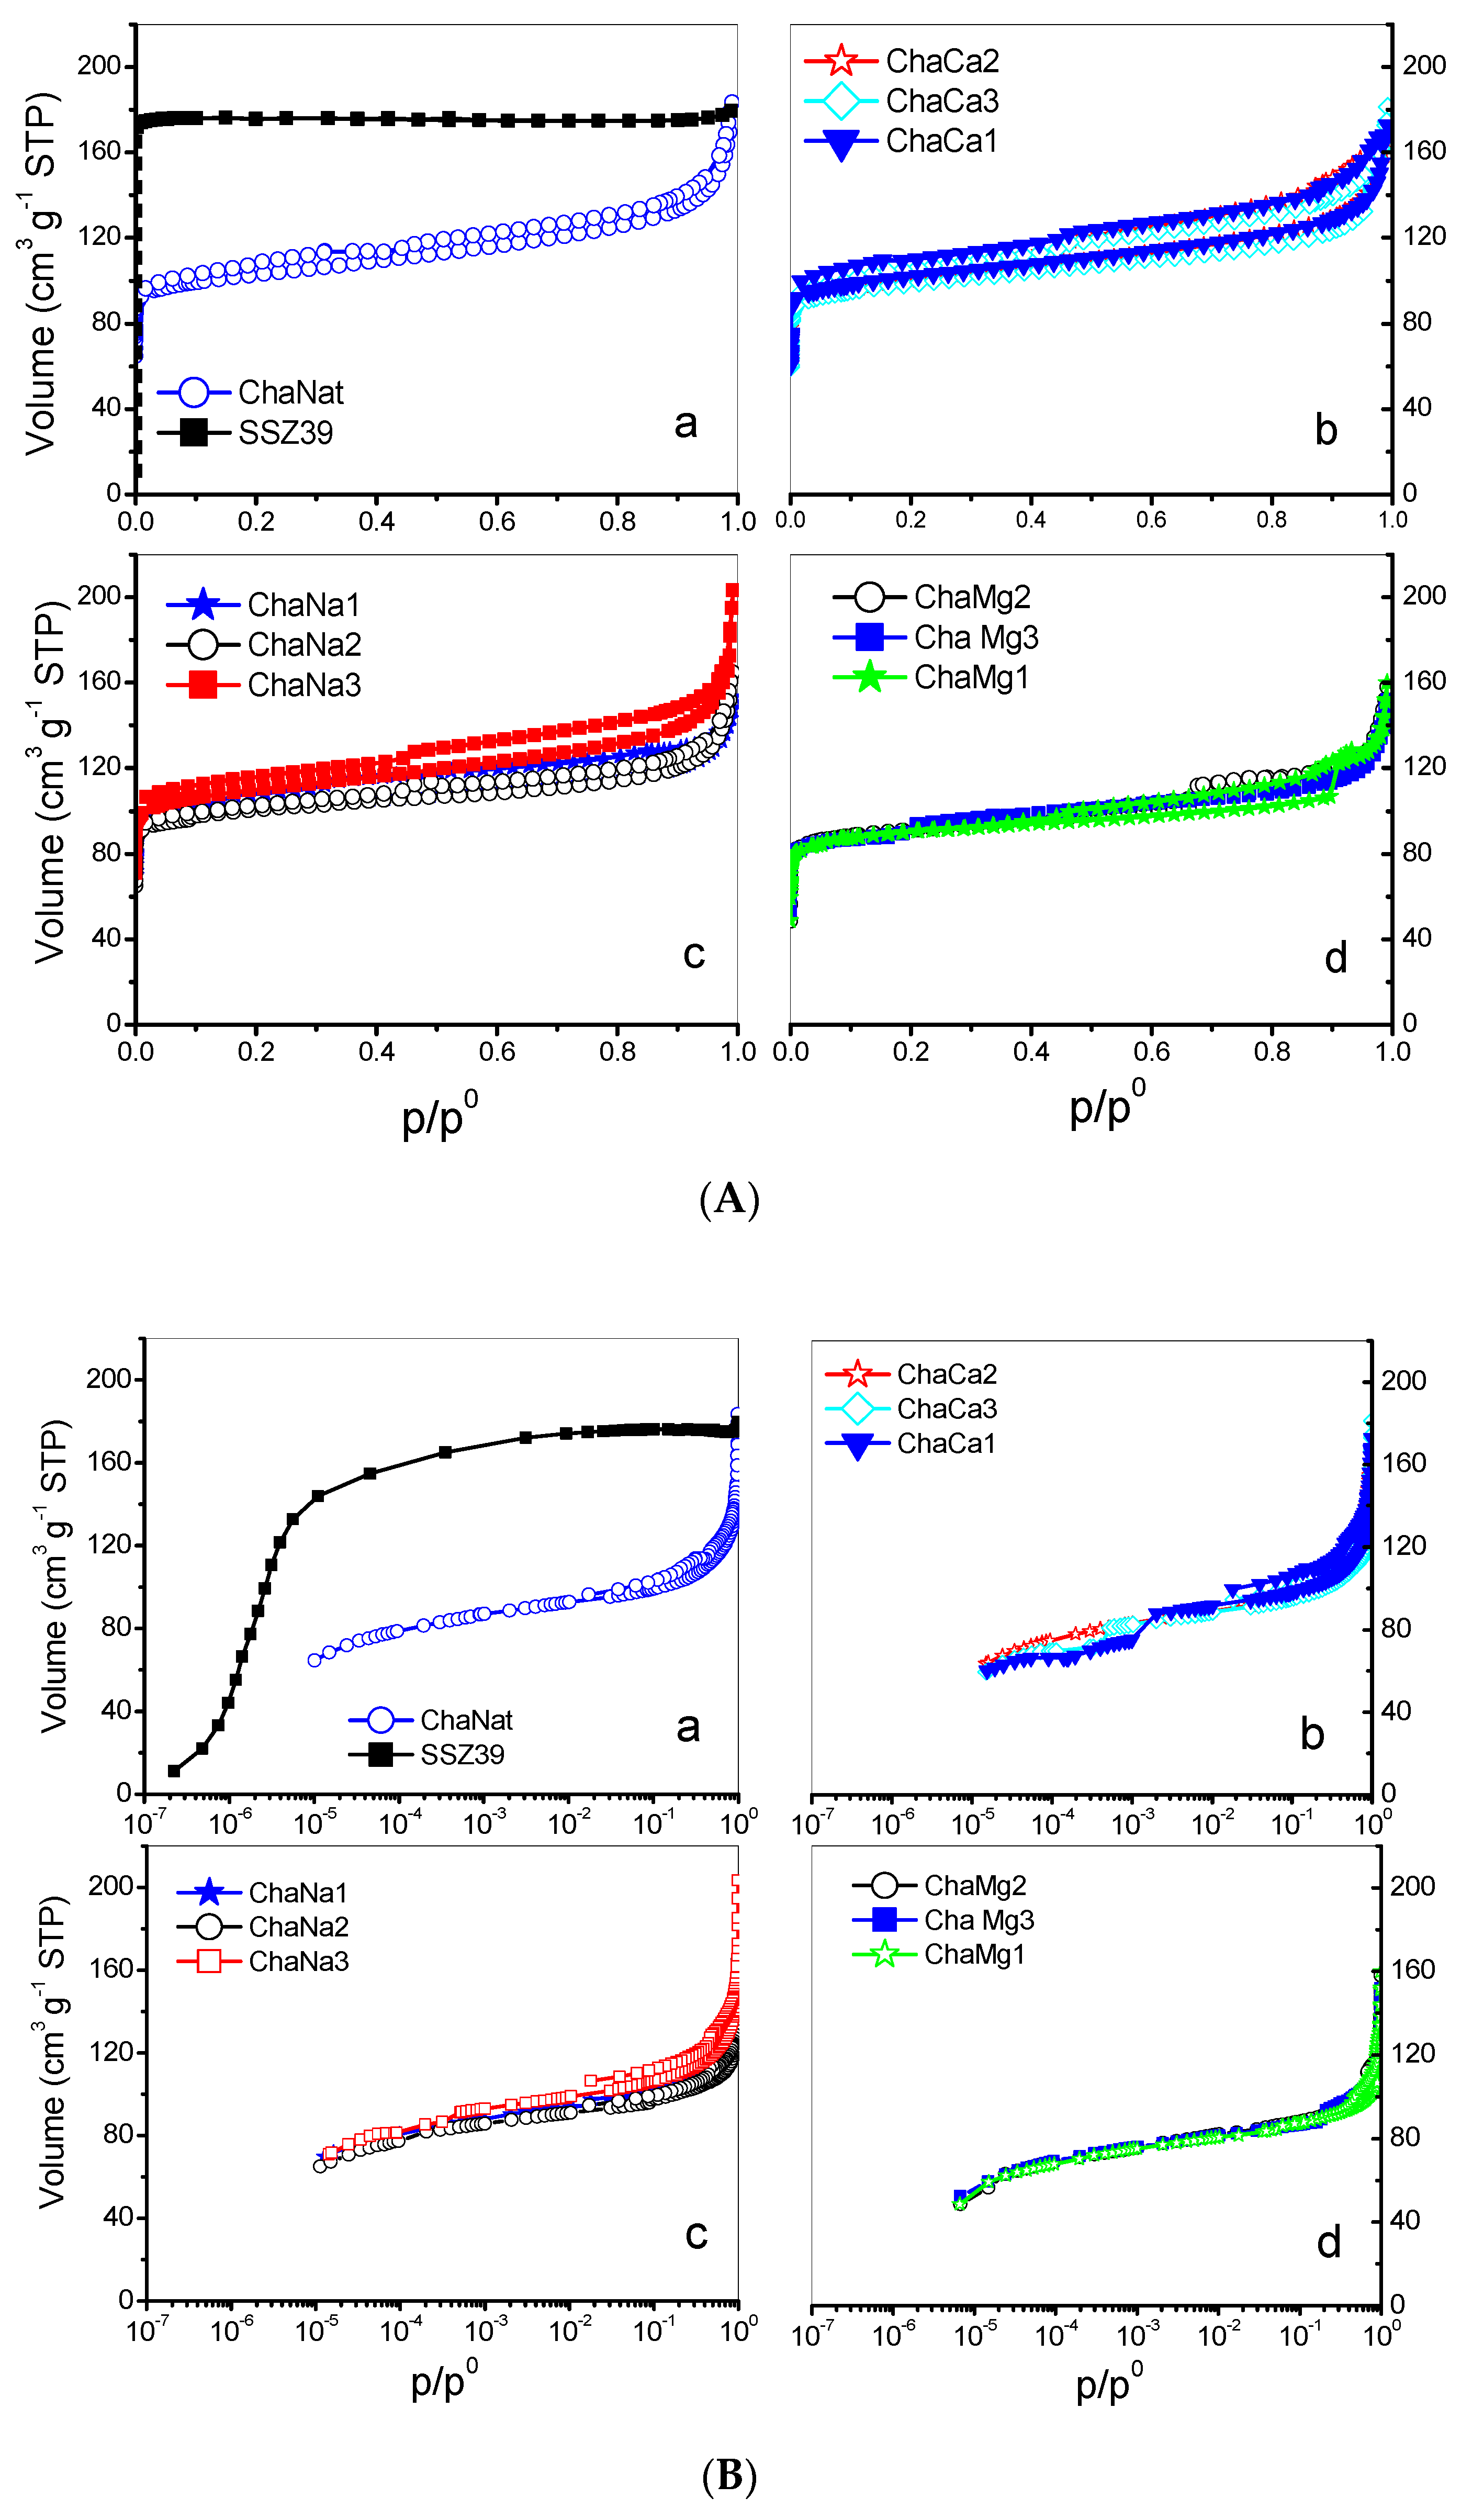
N2 adsorption isotherms at 77 K on natural chabazite (CHAN) and CHACa, CHANa CHAMg zeolites are shown in Figure 4A, while in Figure 4B these isotherms are observed in logarithmic scale. Some of the most corresponding textural parameters are listed in Table 4. In these figures, by way of comparison, the isotherms corresponding to the synthetic zeolite (CHAS) SSZ-39 are observed.
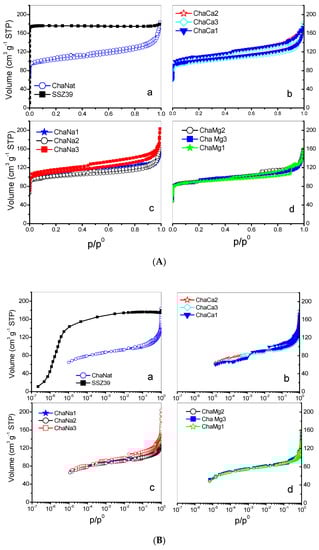
Figure 4.
(A) N2 adsorption isotherms at 77 K in CHA zeolites. (B) N2 adsorption isotherms at 77 K in CHA zeolites, logarithmic scale.
Table 4.
Textural parameters of natural and exchanged chabazite, adsorption of N2 at 77 K.
3.4.1. Dubinin–Astakhov (DA) Approach
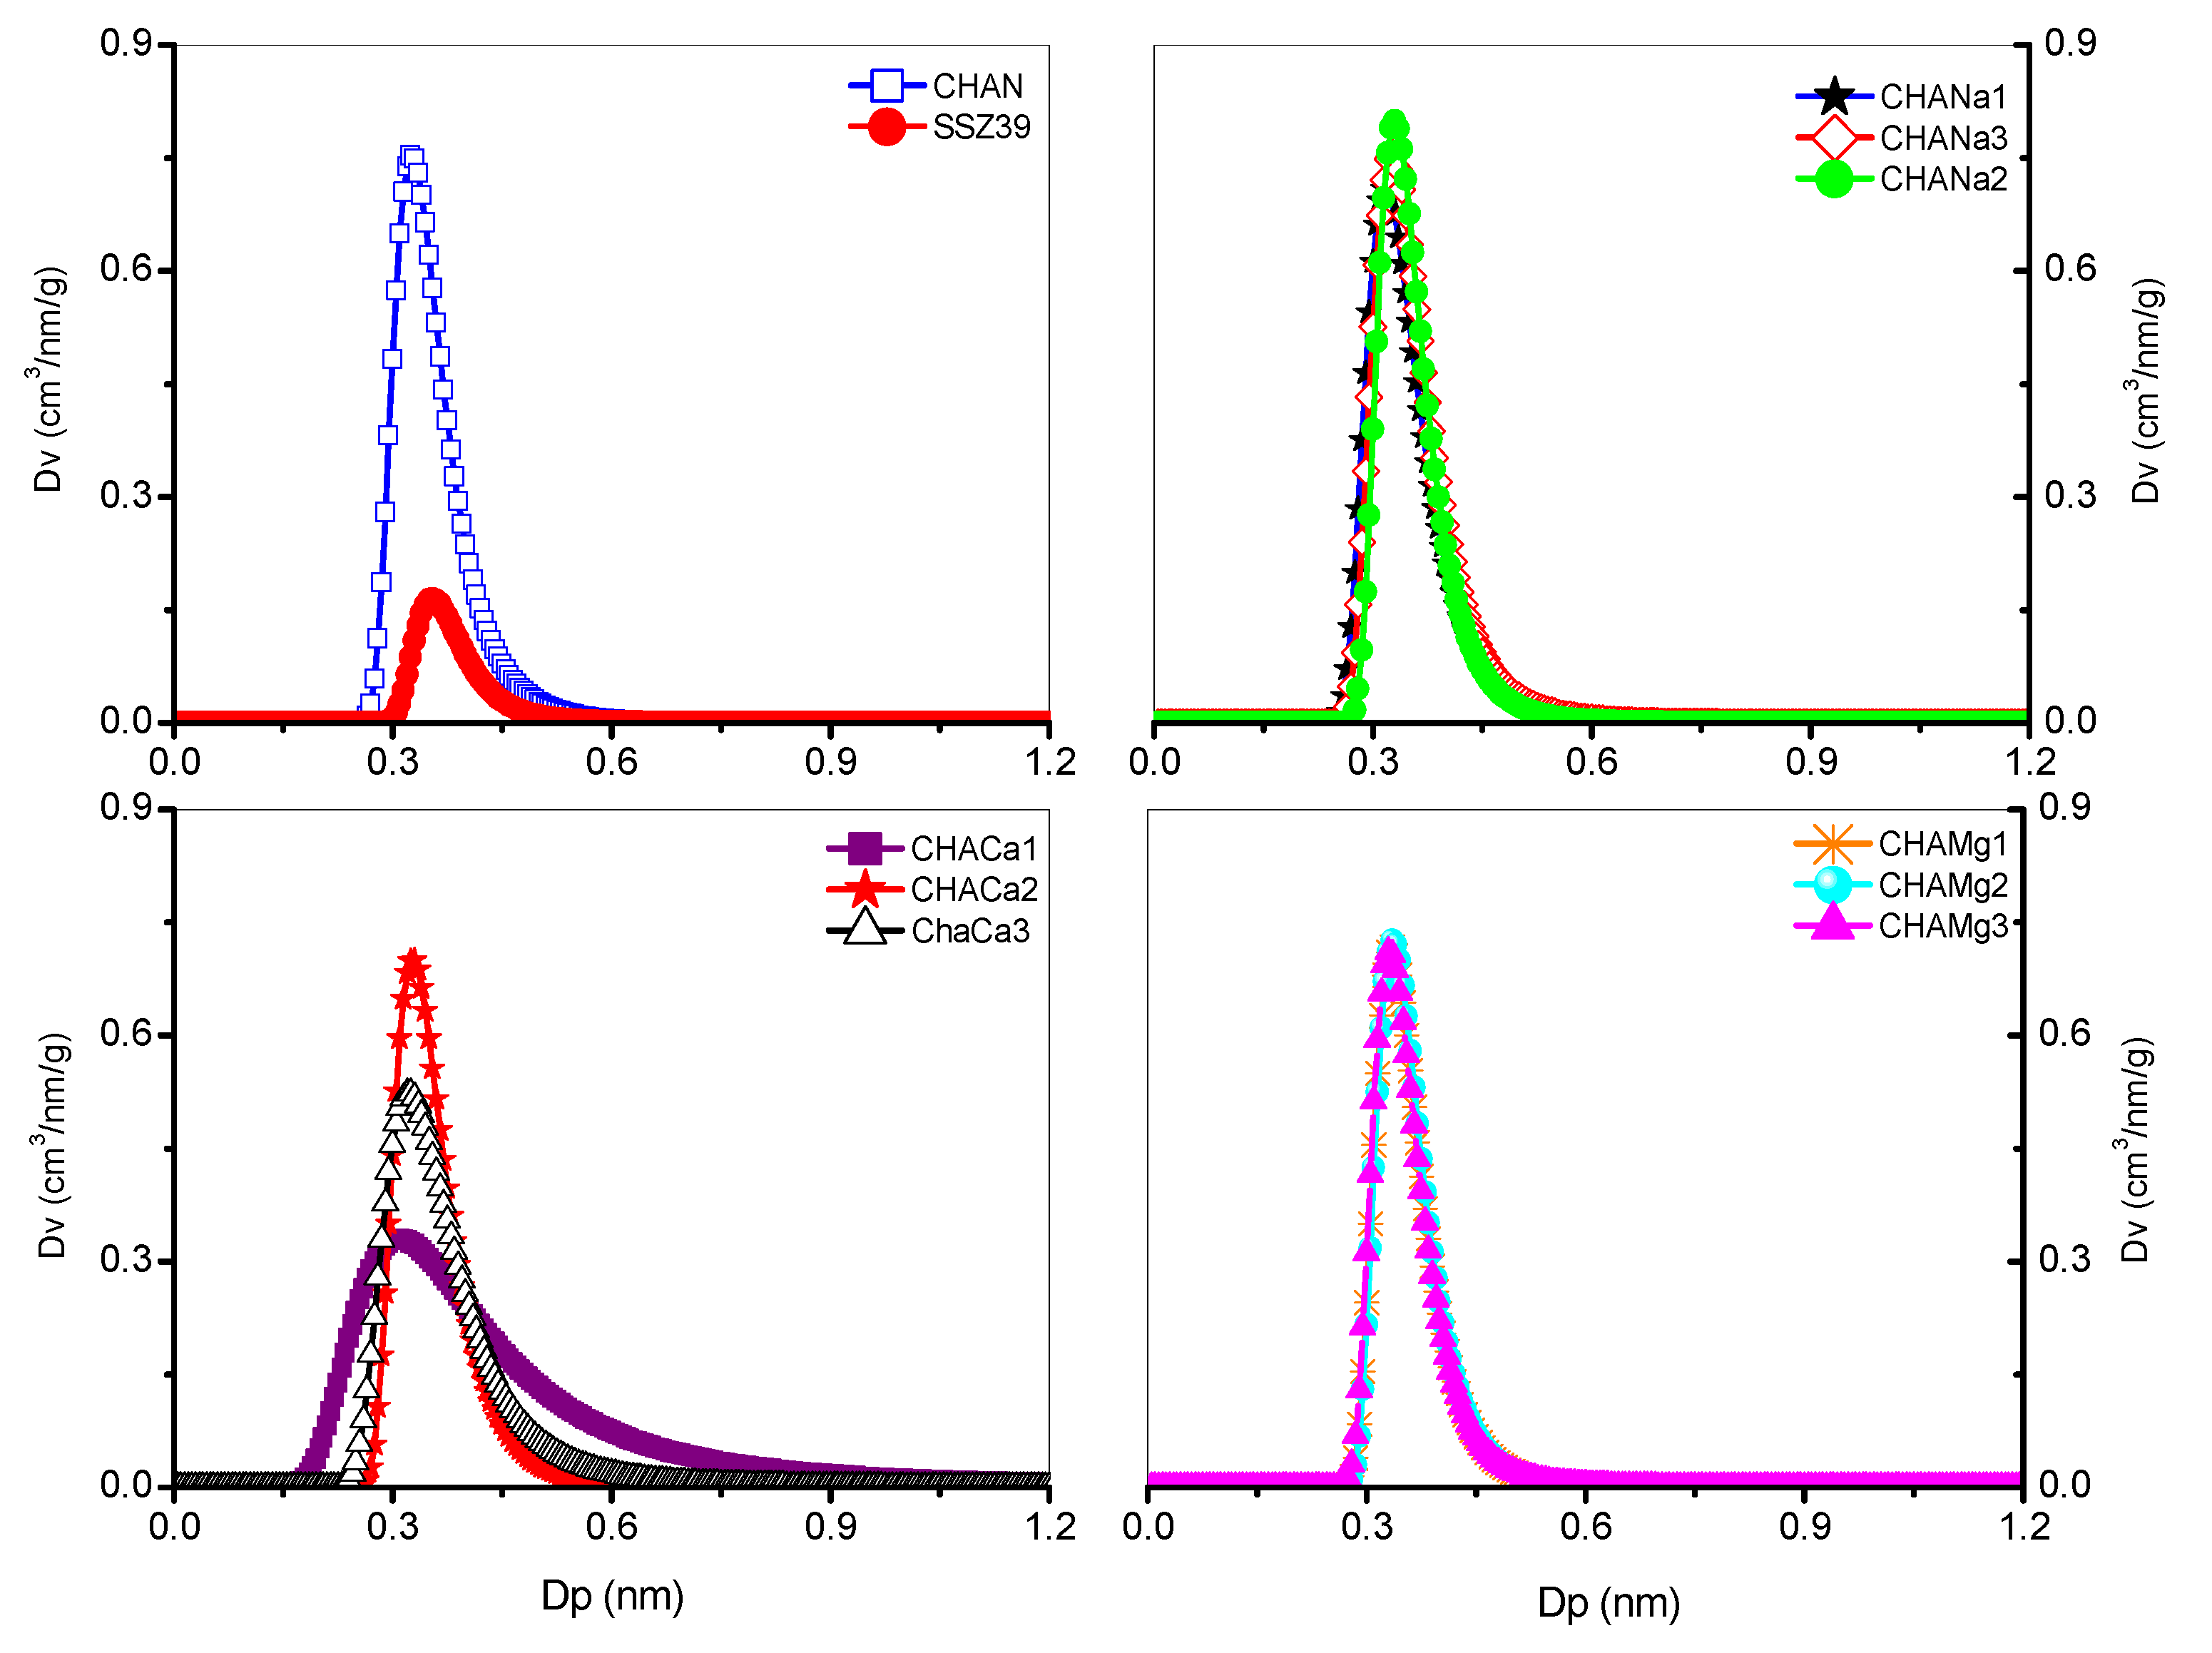
The corresponding nanopores’ size distribution was calculated from adsorption–desorption isotherms of N2 at 77 K and the results of these estimates show that the nanochannels are uniformly distributed and have diameters from 0.31 (CHACa1) to 0.35 nm (CHAS), see Figure 5 and Table 5.
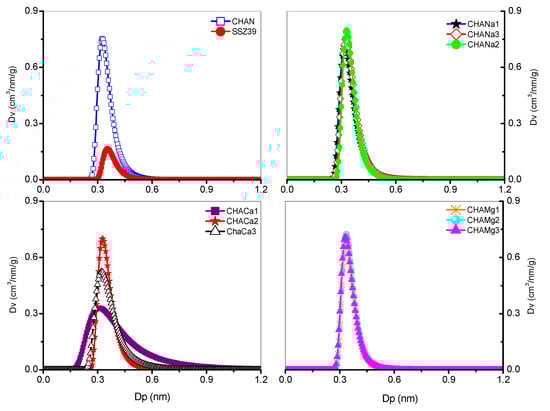
Figure 5.
Nanopore distribution in chabazita, Dubinin–Astakhov (DA).
Table 5.
Parameters of micropores of chabazite zeolites, Dubinin–Astakhov equation.
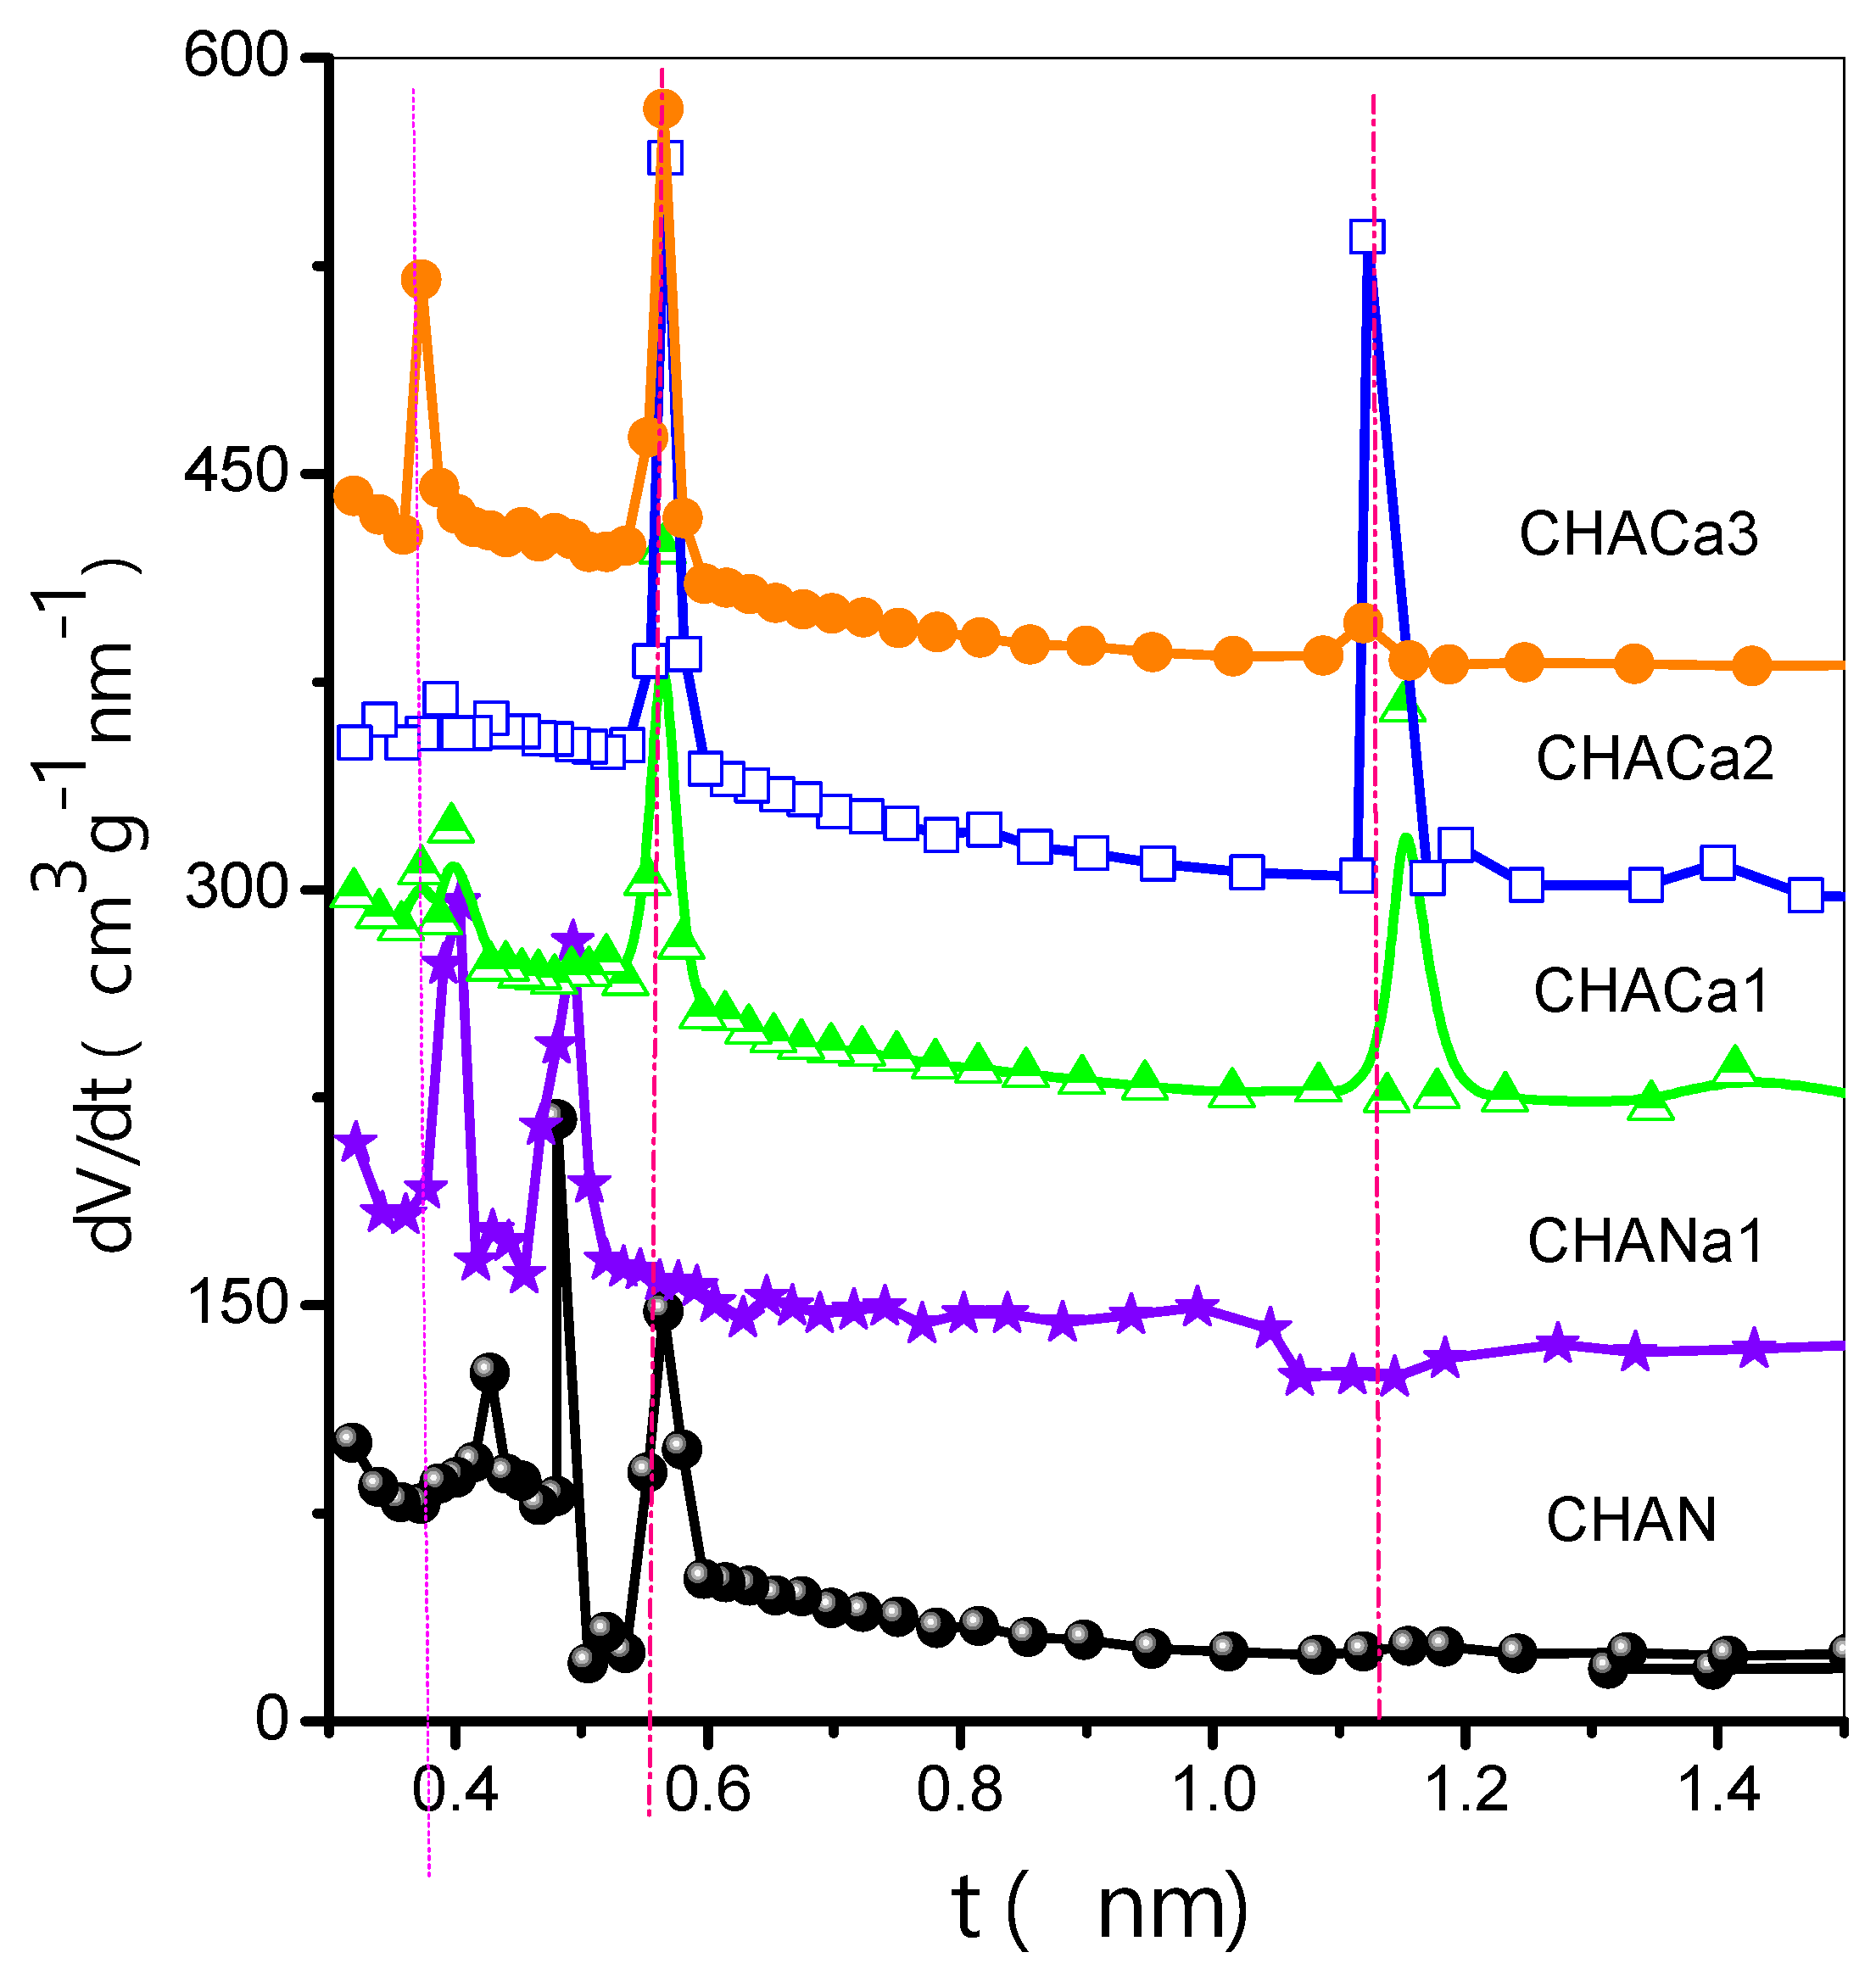
3.4.2. Differential Curves of Comparison Plots (DCCP) Method
In Figure 6, CHAN exhibits a polymodal distribution with pore size maxima occurring at 0.427, 0.481, and 0.564 nm. For its part, CHANa1 exhibits a bimodal distribution with pore size maxima happening at 0.400 and 0.492 nm. For CHACa zeolites, representative pore size results are located at 0.373, 0.564, and 1.118 nm.

Figure 6.
Differential curves of comparison plots (DCCP).
3.5. Adsorption of CO2, CH4, and H2 on Chabazite at Low Coverage Degrees
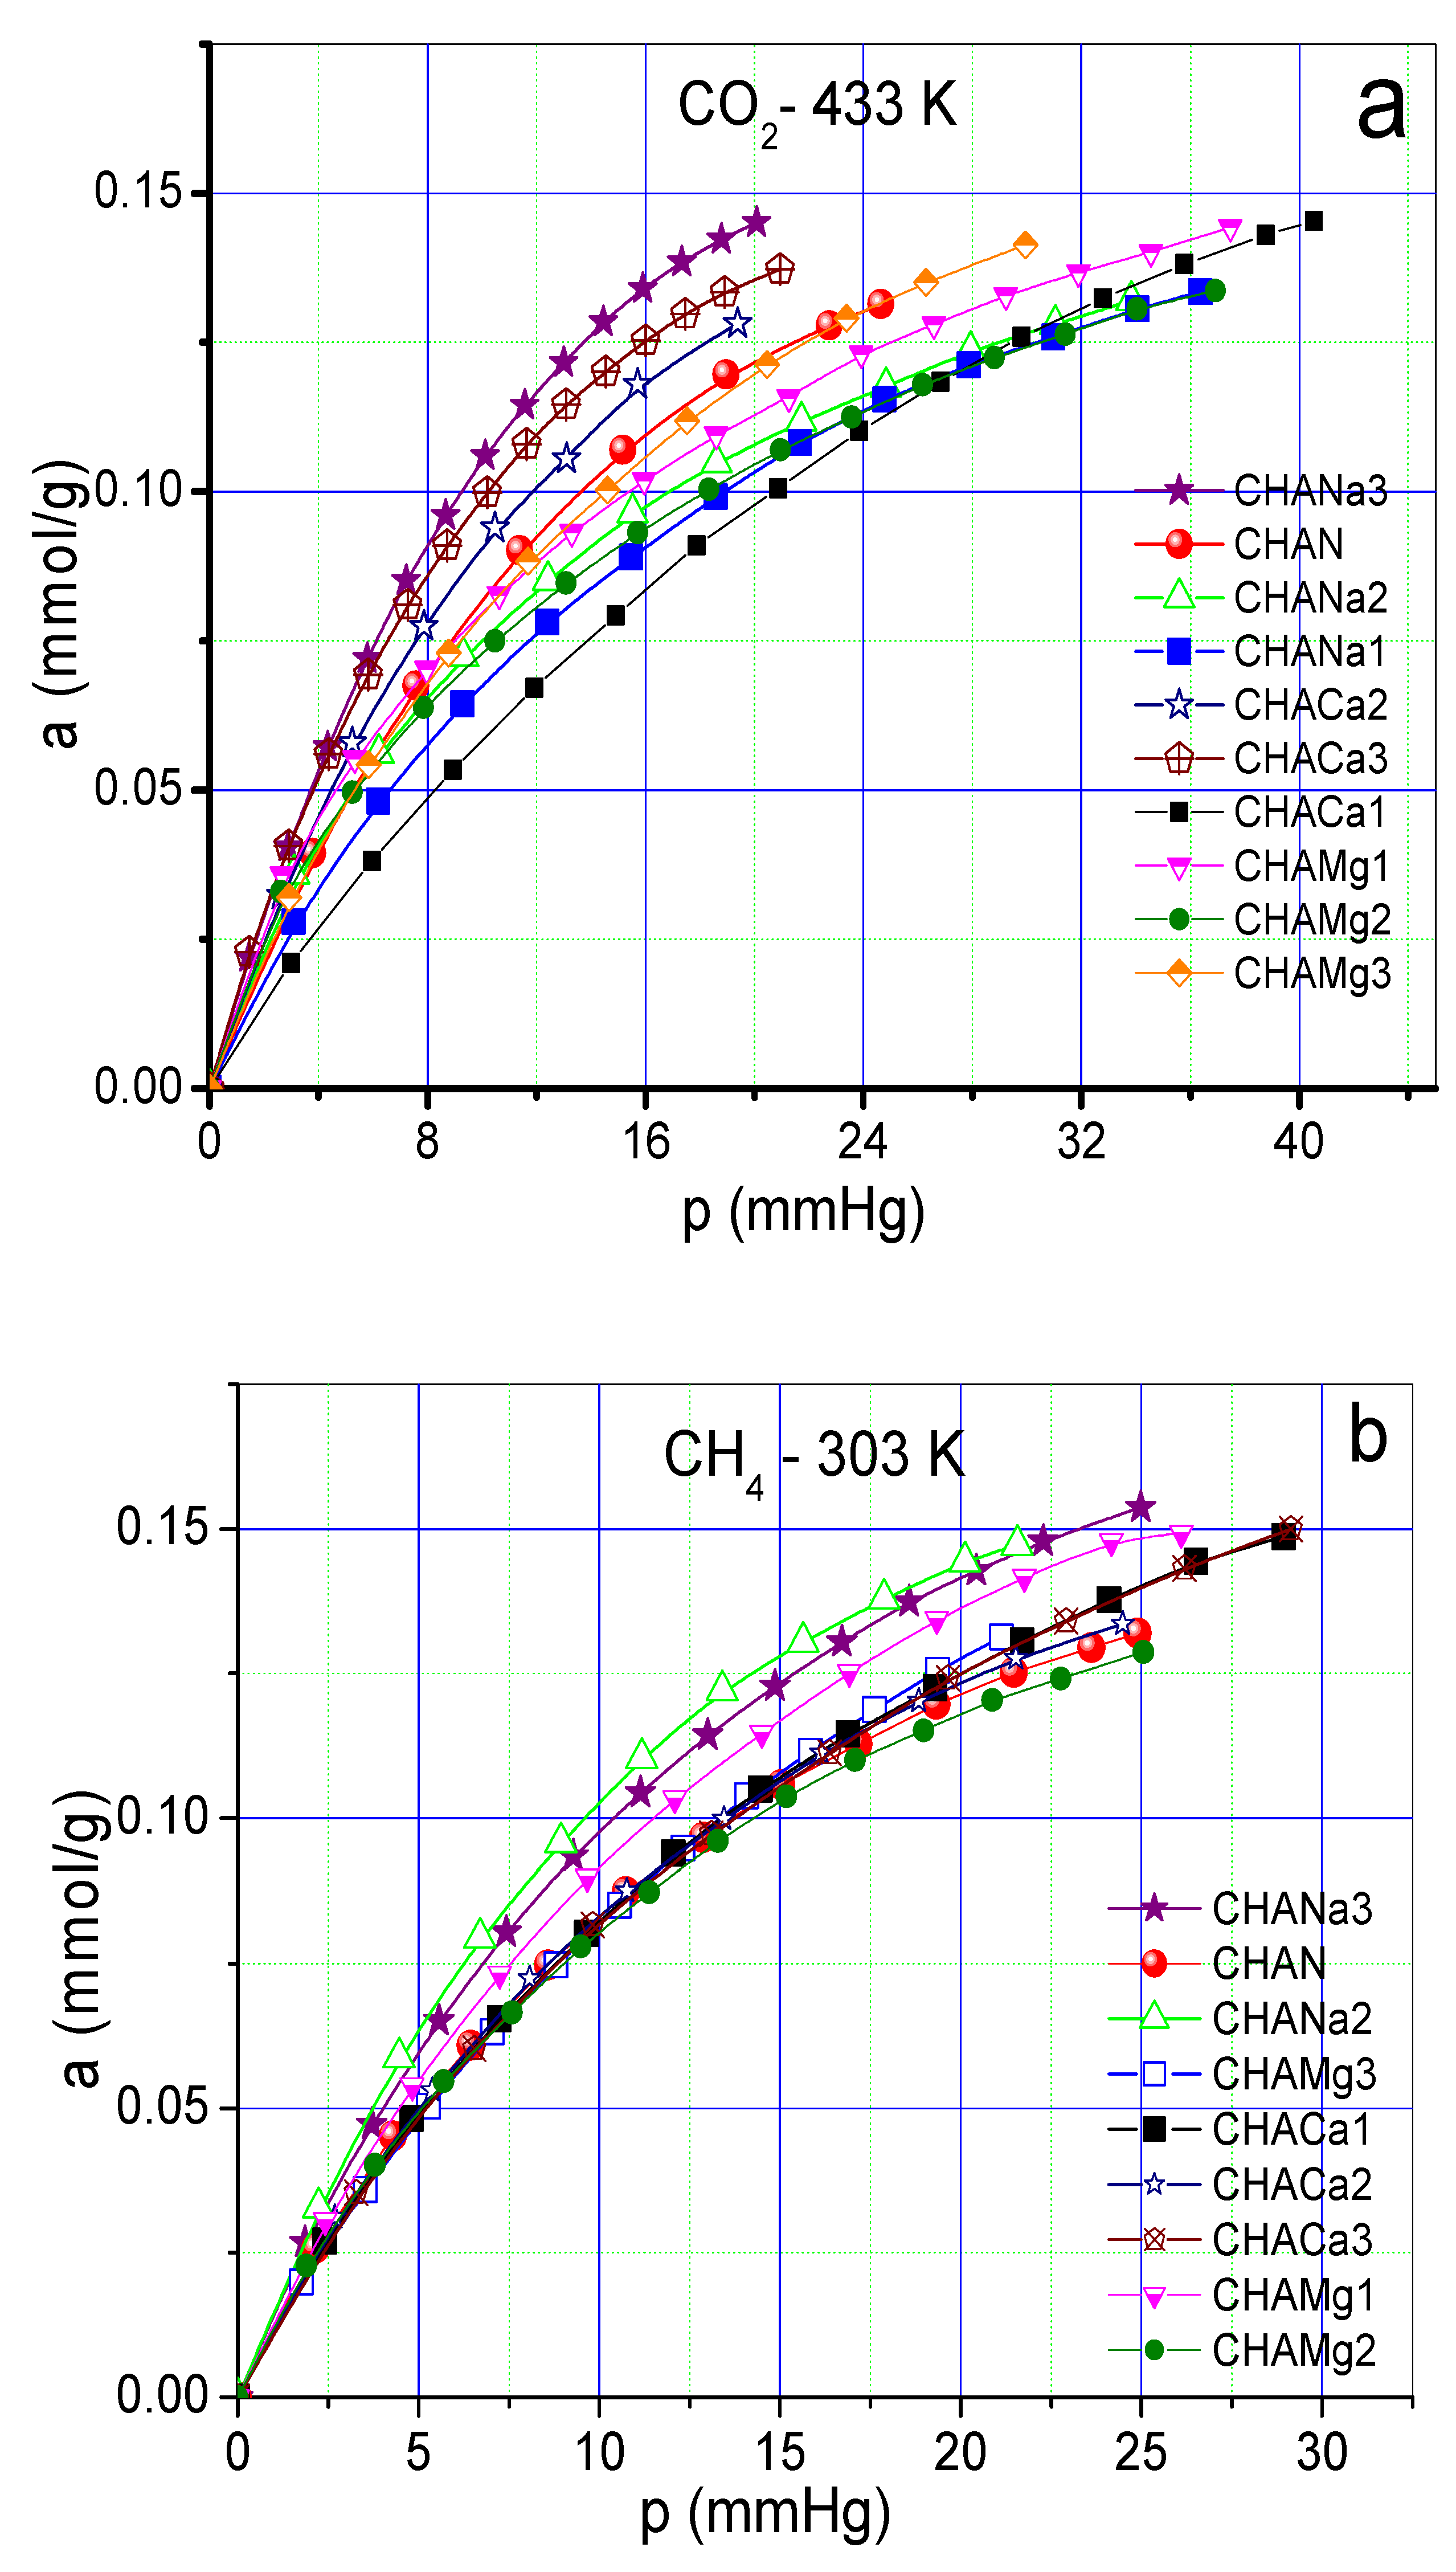
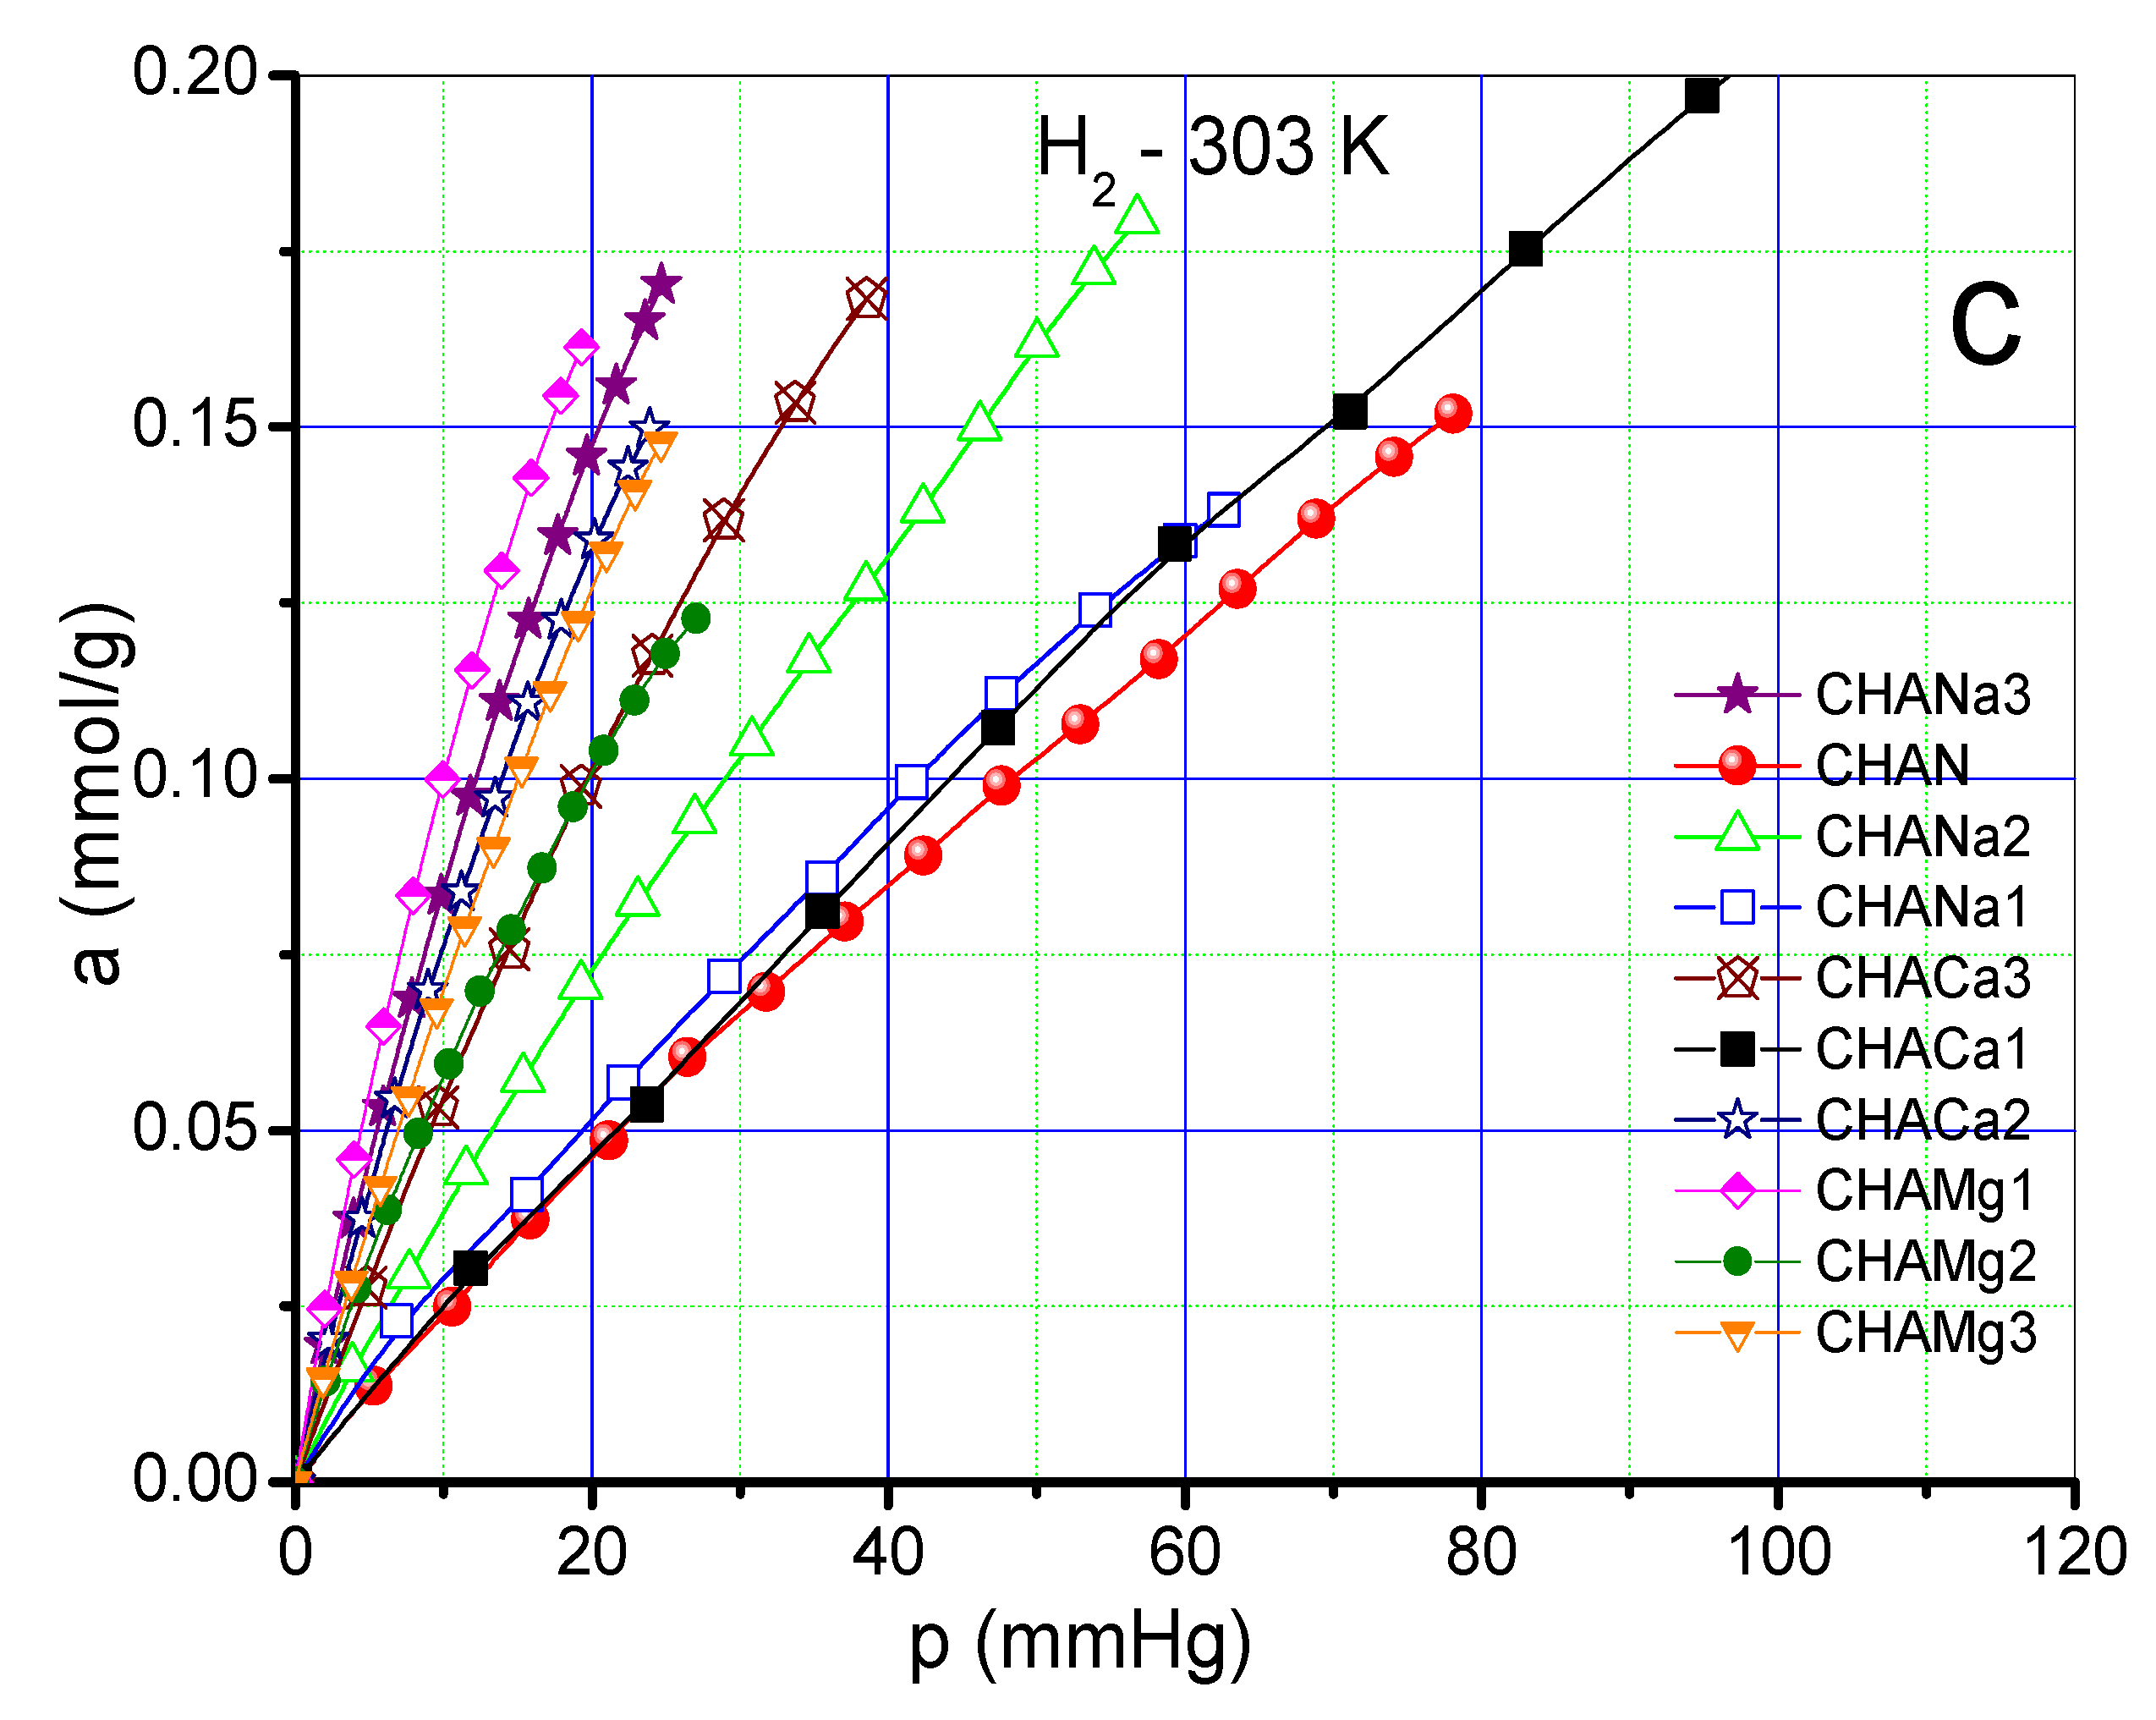
As an example, Figure 7a–c shows CO2 at 433 K, CH4 and H2 at 303 K adsorption isotherms on chabazite and natural and exchanged zeolites measured at those temperatures. The values of the Freundlich parameters (n) and Henry constants (KH) of CO2, CH4 and H2 on chabazite and natural and exchanged zeolites can be seen in Figure 8a,b.
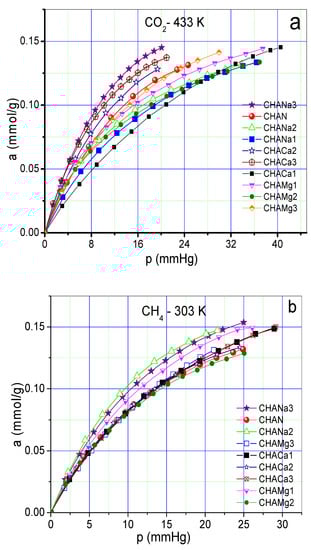
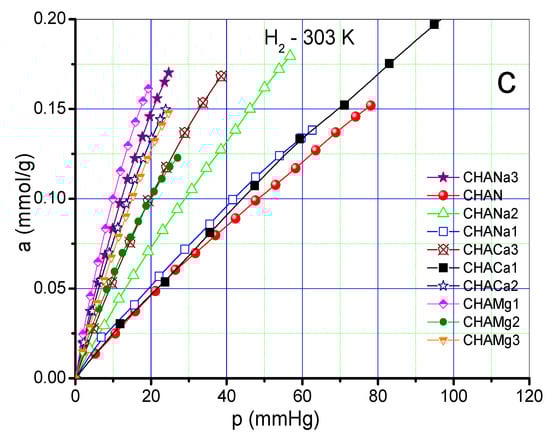
Figure 7.
(a) Adsorption isotherm of CO2 on chabazite zeolites at 433 K. (b) Adsorption isotherm of CH4 on chabazite zeolites at 303 K (c). Adsorption isotherm of H2 on chabazite zeolites at 303 K.
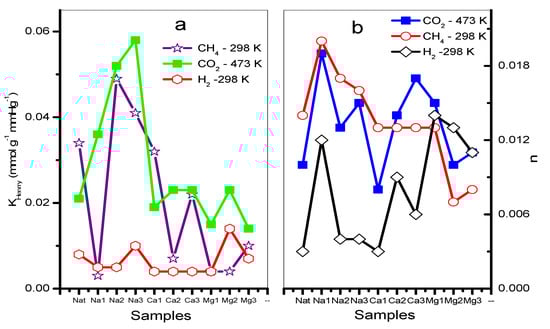
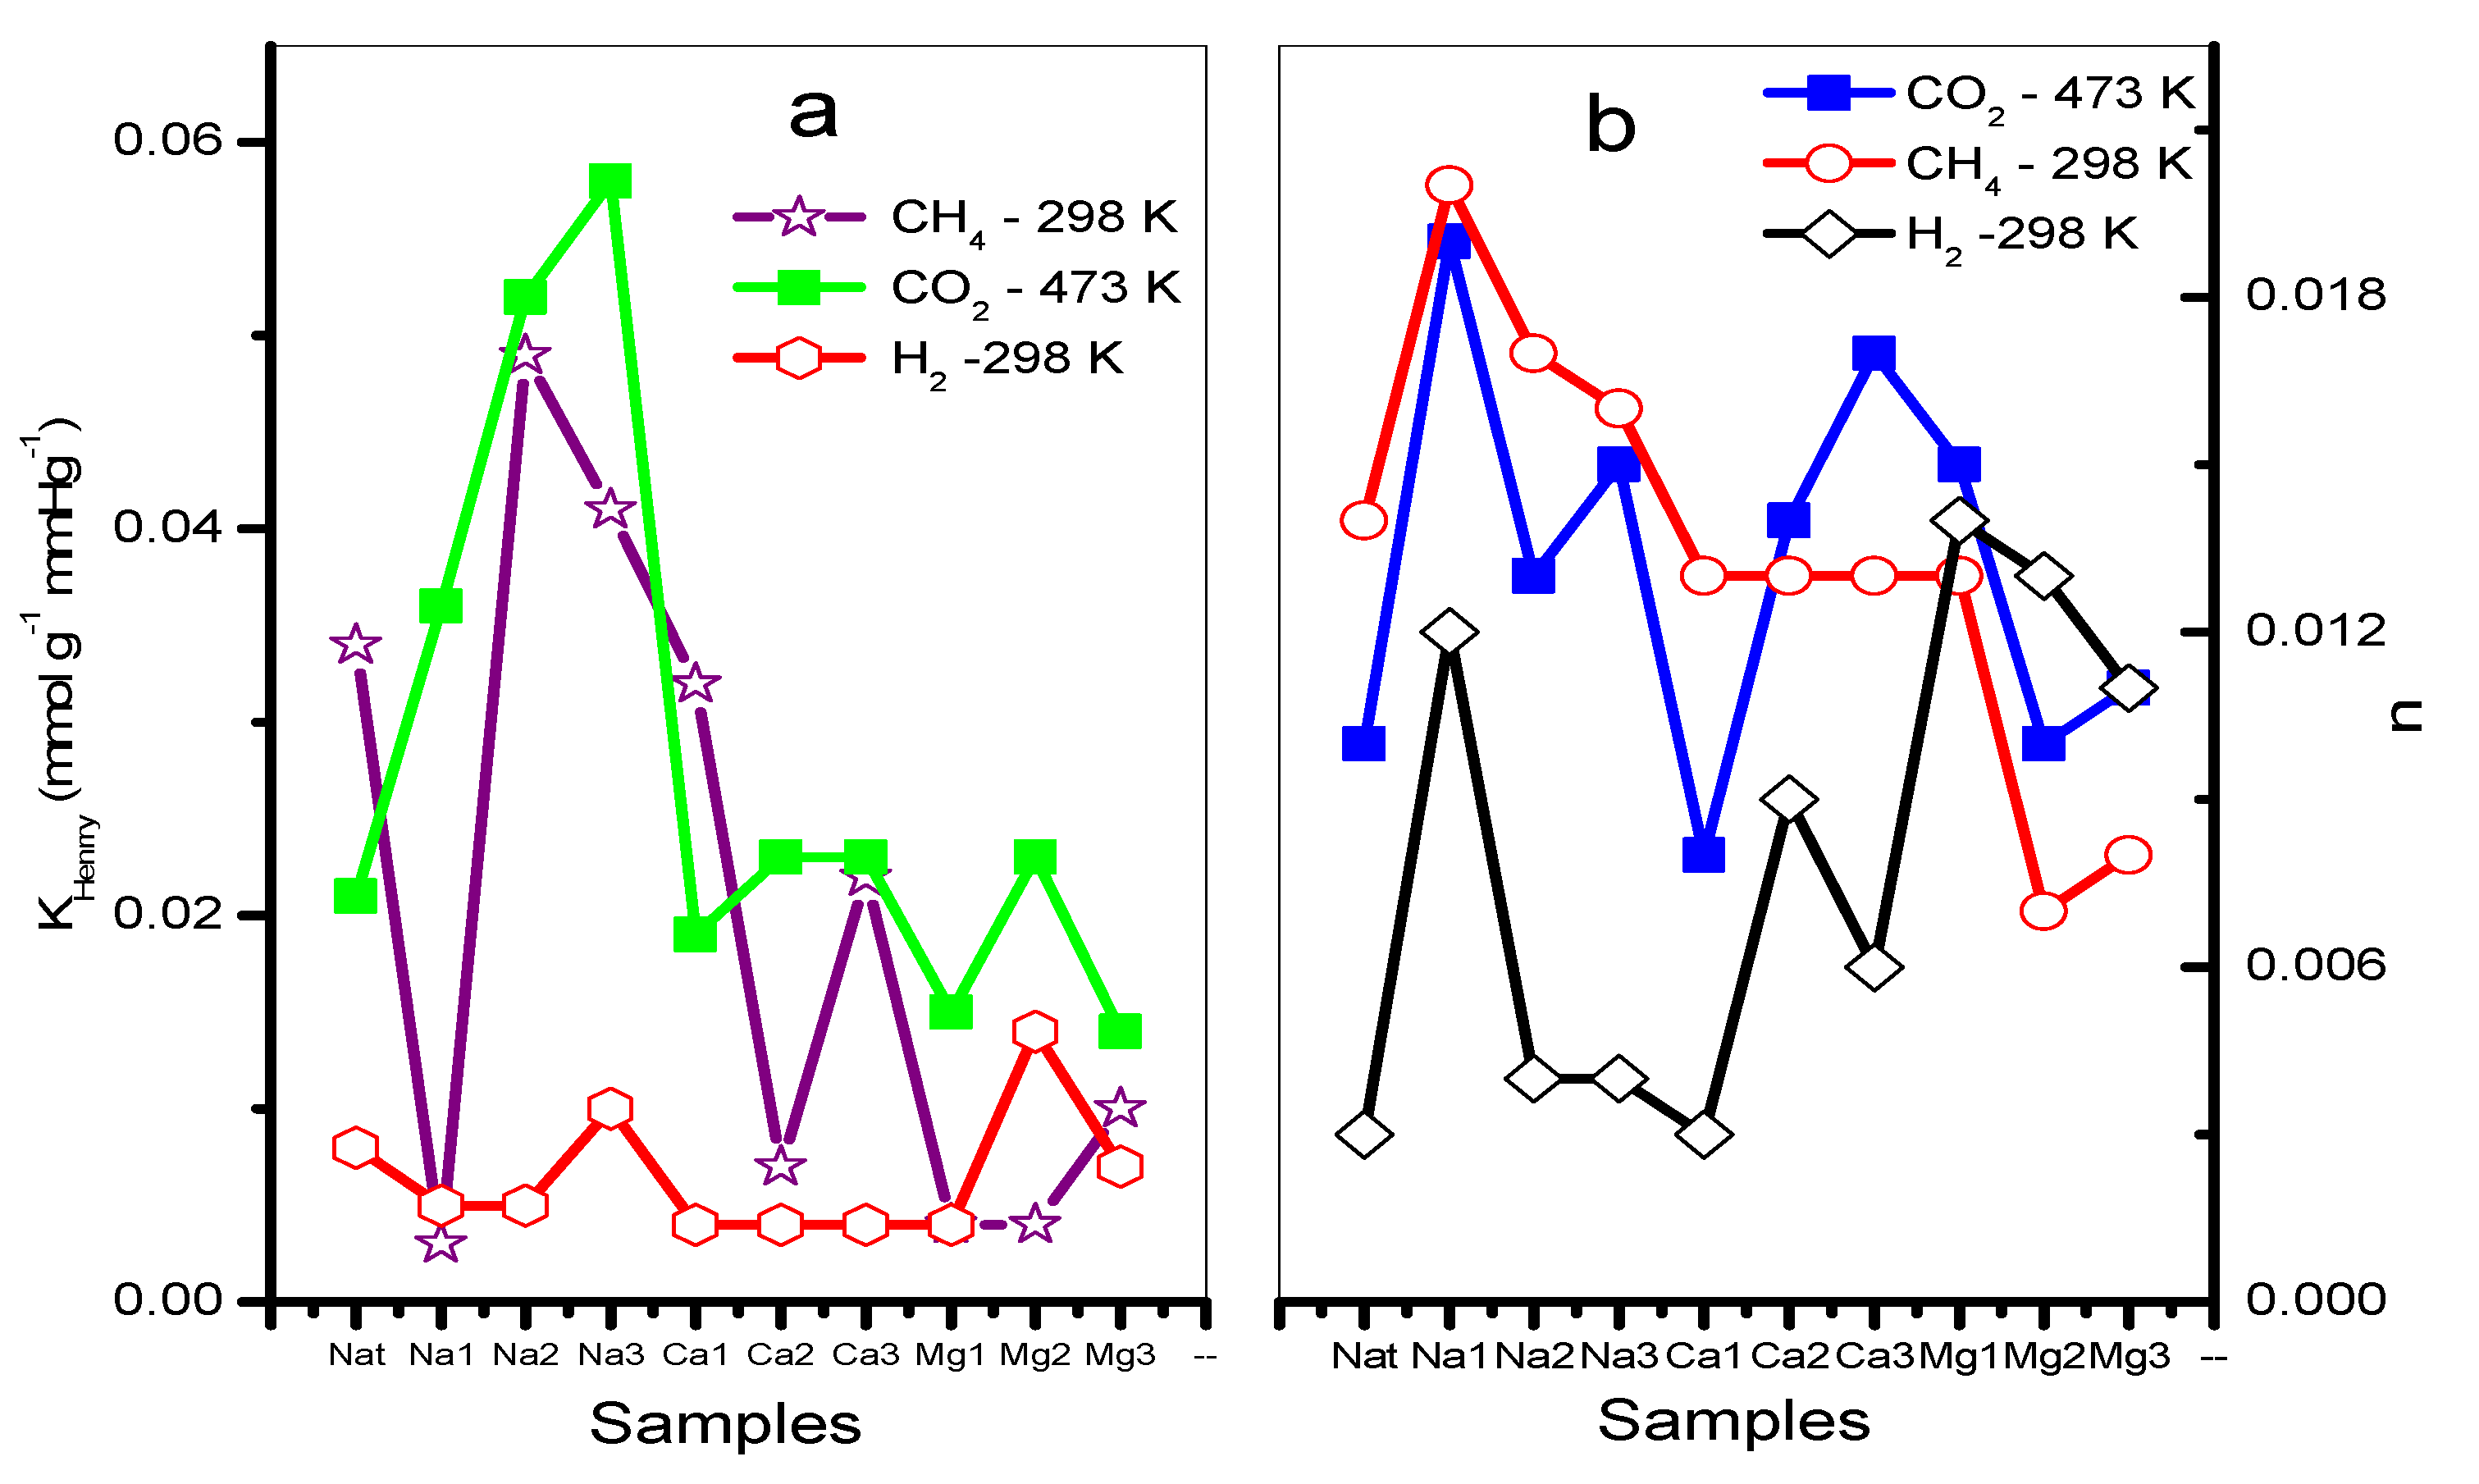
Figure 8.
(a) Henry (KH) and (b) Freundlich (n) parameters of CO2, CH4, and H2 of natural and exchanged chabazite.
3.6. Isosteric Enthalpy of Adsorption
The behavior of the isosteric enthalpy of adsorption (−qst, kJ mol−1) of CO2, CH4, and H2 on the chabazite zeolites is presented in Figure 9a–c and the results of these estimates are listed in Table 6.
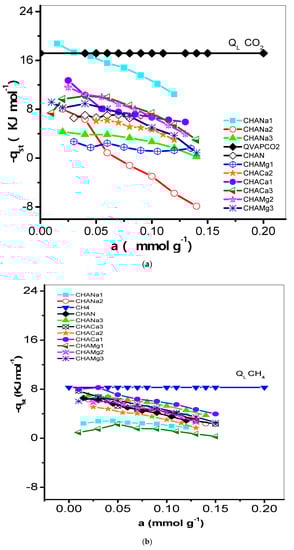

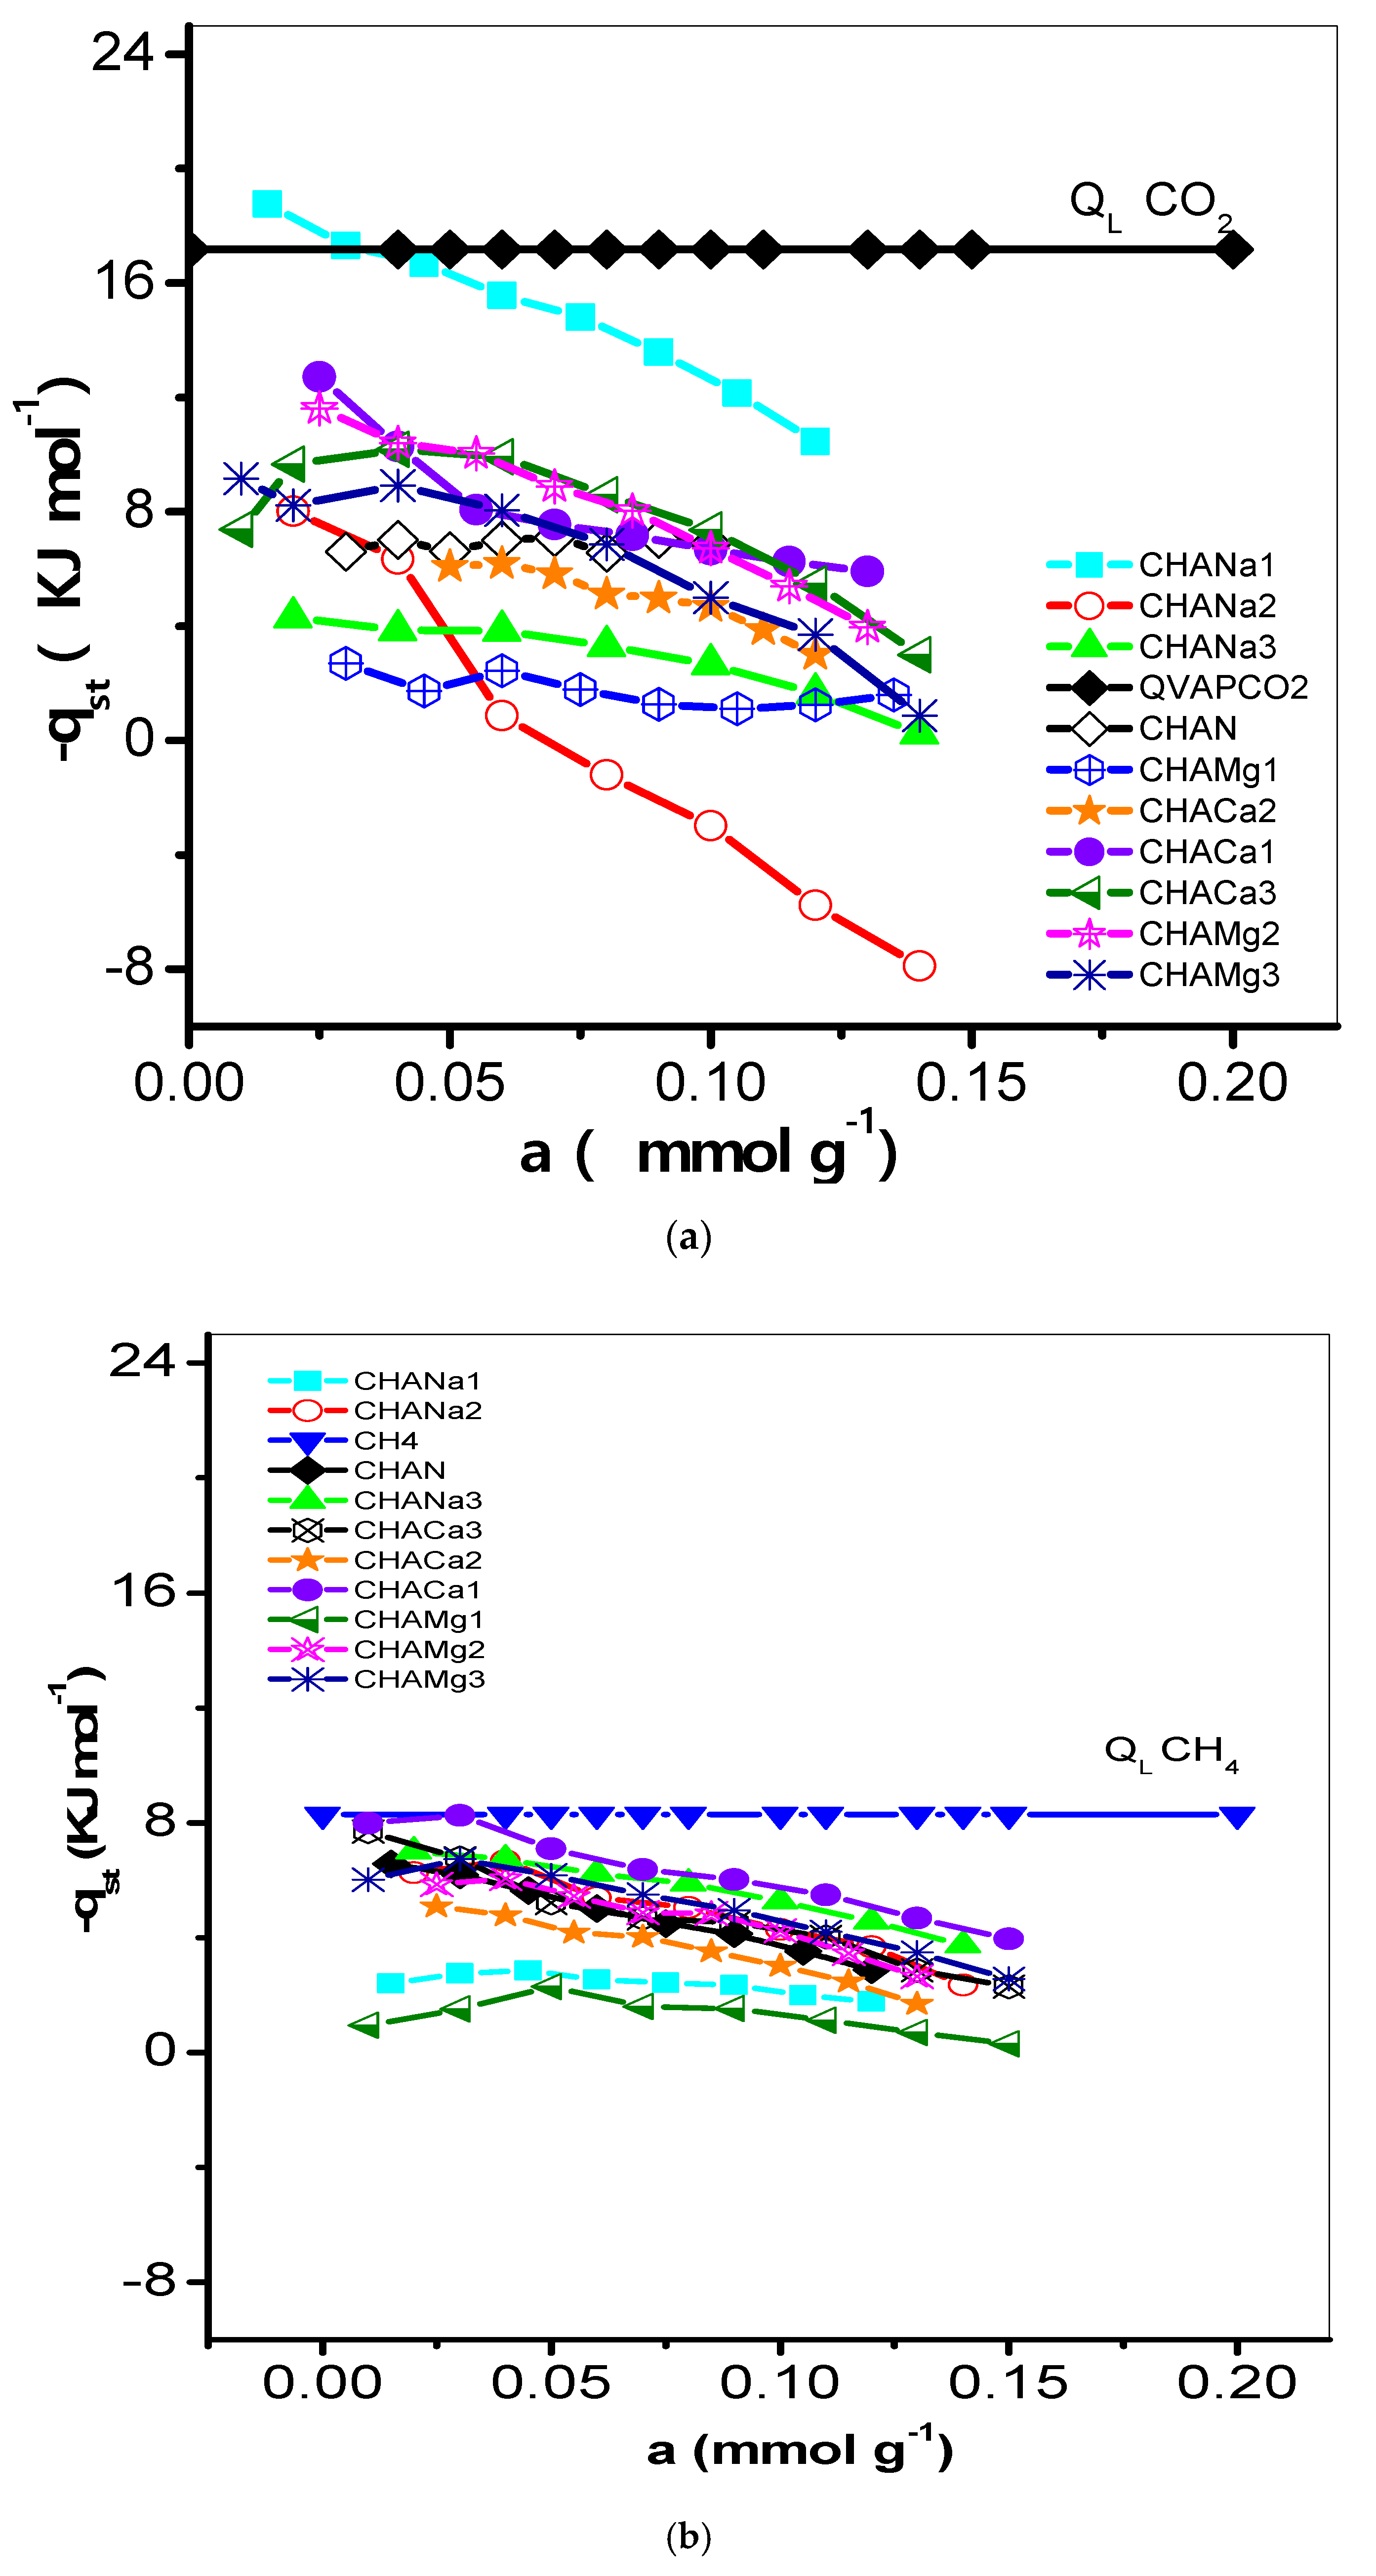
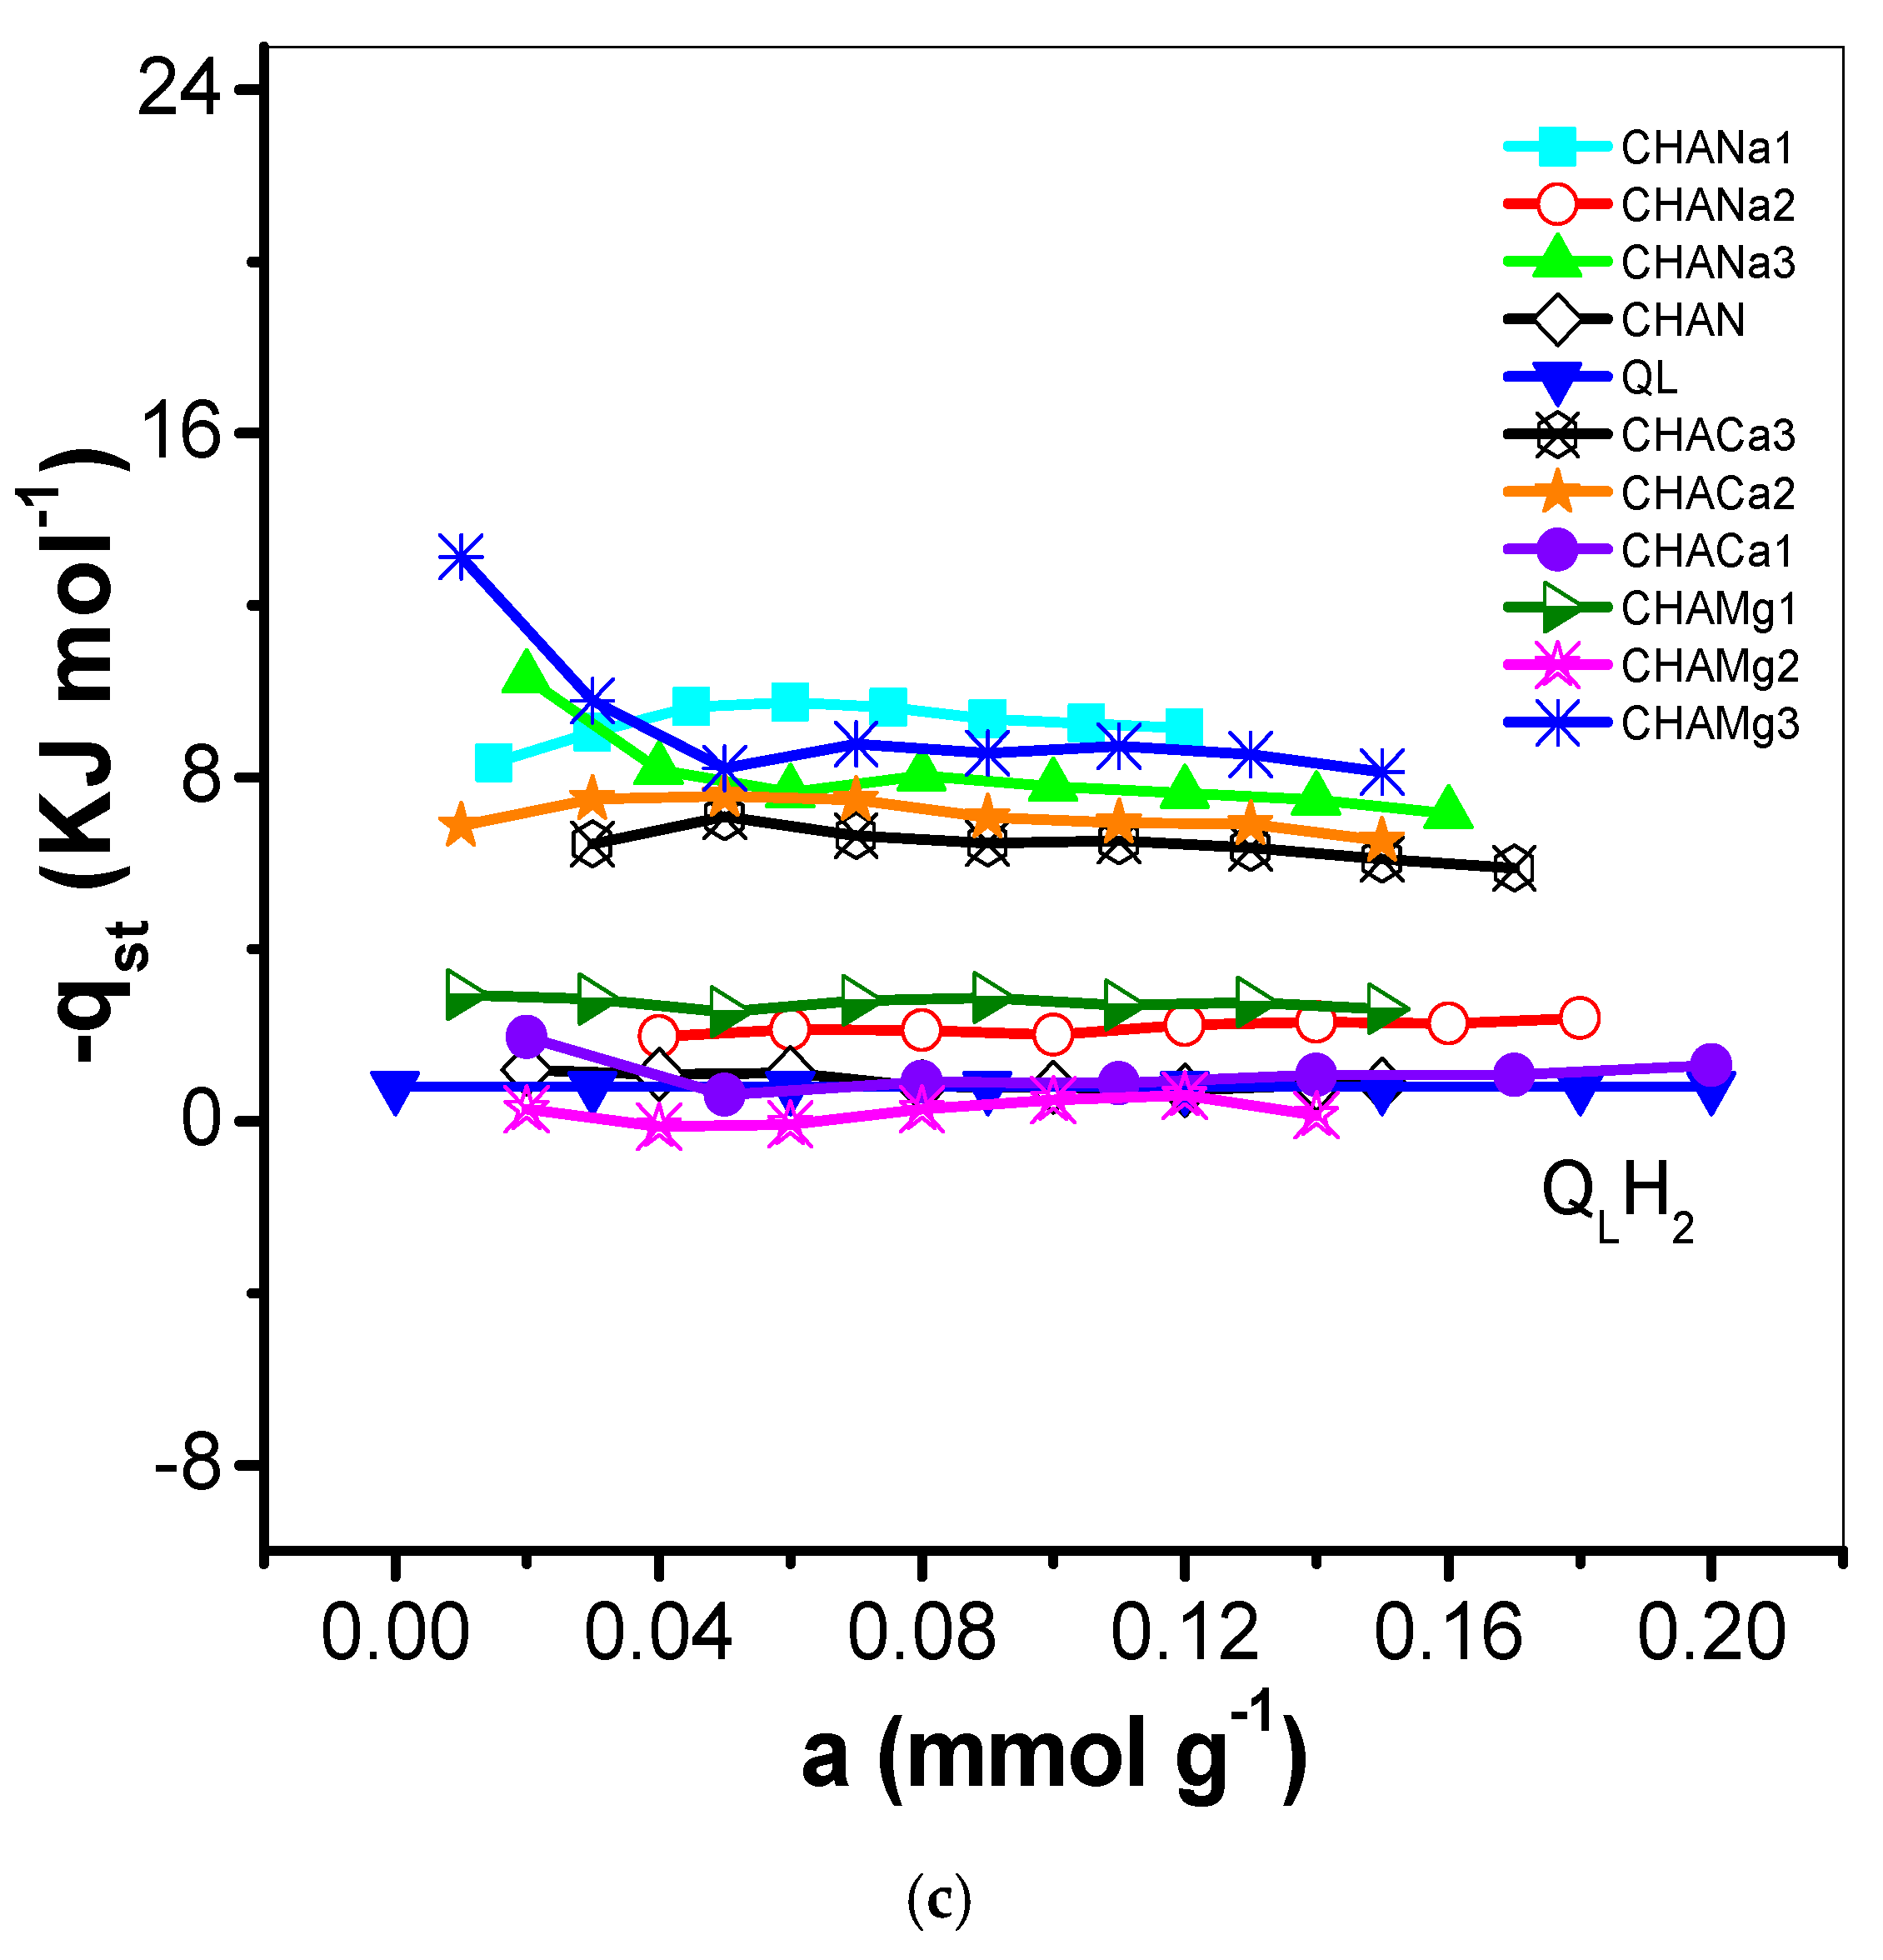
Figure 9.
(a) Variation of the isosteric heat of adsorption (−qst, kJ mol−1) of CO2 with adsorbate loading on CHAN and exchanged CHA zeolites. (b) Variation of the isosteric heat of adsorption (−qst, kJ mol−1) of CH4 with adsorbate loading on CHAN and exchanged CHA zeolites. (c) Variation of the isosteric heat of adsorption (−qst, kJ mol−1) of H2 with adsorbate loading on CHAN and exchanged CHA zeolites.
Table 6.
The isosteric enthalpy (kJ mol−1) of adsorption of CH4, H2, and CO2.
4. Discussion
4.1. DRX
The Rietveld analysis indicates that the main percentage obtained corresponds to Ca-chabazite 56.2%, Ca-clinoptilolite crystalline phase with 43.6%, while montmorillonite is equal to 11.11%, and finally, minor amounts of quartz are equal to <0.2%, Table 2. X-ray diffraction studies indicate the presence of the Ca-chabazite crystalline phase, its characteristic signals being located at angle 2θ = 9.2°, 16.8°, 19.1°, 22°, 29°, 30.8°, 31.4°, 33.9°, 35.12°, and for clinoptilolite the signals are at angle 2θ = 9.85°, 11.08°, 16.86°, 20.73°, 22.35°, 25.42°, 26.24°, 30.01°, and 34.80°.
4.2. XRF
The results of these analyses include the variation of the atomic ratios from XRF results of exchanged cations both in the chabazite and in the secondary phase (clinoptilolite). From Table 3 it can be seen that the majority percentage in the natural sample is Ca, and when carrying out the chemical treatments it increased considerably: the cations of Mg2+ being replaced, Na+ mainly, in the case of the samples exchanged with Mg2+, the concentration of CHAMg1, CHAMg2, and CHAMg3 increased to a lesser extent with the decrease in Na+, and finally the samples under NaCl treatment showed a slight increase in this cation. From these results it was concluded that the natural chabazite CHAN was classified as Ca-chabazite with the formula (Ca3.64K1.91Mg1.2Na1.15) [Al2.81Si9.19O23.9 2]•24.27 H2O, according to the determination of the atoms by unit formula (apfu) [28].
4.3. SEM
4.4. N2 Adsorption
Figure 4A,B portrays the evolution of the shapes of the N2 isotherms with respect to the ionic exchanges; the CHAN and CHACa, CHANa, CHAMg zeolites render IUPAC type I-IV isotherms with low-pressure hysteresis [30], while a type I isotherm is proper for the SSZ-39 zeolite [30]. Distinctive features of these types of isotherms are as follows: (i) the extent of microporosity in exchanged chabazites increases, in general, with the number of exchanged treatments with Na+; the plateaus of the isotherms corresponding to CHANa chabazites reach increasing heights according to the accessible microporosity depicted by each zeolite; and (ii) the existence of a low-pressure hysteresis effect is evident for the CHANa and CHACa zeolites. It is also important to note that CHANa and CHACa possess a microporous volume several times larger than that of CHAN. The cation blocking effects at pore entrances in natural chabazites are thus diminished by cation-exchange treatments. Important textural parameters of these zeolites are listed in Table 4. For all the zeolites, the BET equation C constants are sometimes negative, and this can be explained by the fact that multilayer adsorption in micropores is not a plausible model therein. The mechanism of micropore filling is evidenced in Figure 4B for SSZ-39 zeolite. From this figure the primary filling begins in the 10−7–10−6 zone and the secondary micropore filling is observed in the 10−6–10−5 zone.
4.4.1. Dubinin–Astakhov (DA) Approach
4.4.2. Differential Curves of Comparison Plots (DCCP) Method
The above DCCP characteristics suggest the following reflections concerning the porous structures of our chabazite zeolites: (i) CHAN pore entrances are closed to the uptake of molecules; this is likely due to the presence of bulky ionic species at these entrance points. (ii) CHANa2 is an open microporous structure in which primary and secondary micropore filling mechanisms take place. The existence of a low-pressure hysteresis associated with this substrate can mean that microporous channels are either interconnected to each other by thin capillaries or surrounded by narrow cracks that are due to the exchange process. ChaNa1 represents a transitional substrate with porous characteristics between those of the CHAN and CHANa2 structures (Figure 6).
4.5. Adsorption of CO2, CH4, and H2 on Chabazite at Zero Coverage
The adsorption isotherms corresponding to CO2 at a temperature of 433 K show a greater adsorption in the zeolites CHANa3, CHACA3, and CHACA2 with respect to CHAN (Figure 7a). While the isotherms corresponding to CH4 show that practically all the exchanged samples have a higher adsorption capacity with respect to the natural zeolite CHAN (Figure 7b). Finally, the isotherms corresponding to the adsorption of H2 show an almost linear form of these isotherms, observing a behavior similar to that of CH4 (Figure 7c). In Figure 8a,b the highest values of KH and n correspond to the adsorption of CO2 on CHANa3 while the lowest values correspond to the zeolite CHAMg3. A similar behavior can be observed for CH4 adsorption. In the case of H2 adsorption, it is observed that the highest values correspond to the zeolites exchanged with Mg2+ and the lowest values correspond to the zeolites exchanged with Ca2+. On the other hand, the values of n indicate that the exchanges are favored when zeolites are exchanged with Na+ for adsorption with CO2 and CH4. However, the most favored zeolites with respect to H2 adsorption are the Mg2+ -exchanged zeolites.
4.6. Isosteric Enthalpy of Adsorption
The degree of interaction of CO2, CH4, and H2 on chabazite and natural and exchanged zeolites was analyzed from the evolution of the isosteric enthalpy of adsorption –qst. Isosteric enthalpy of adsorption obtained by the IGC technique is often calculated at very low surface coverages; i.e., the adsorbate–adsorbate interactions can be neglected in favor of the adsorbate–adsorbent interactions [30]. The behavior of the isosteric enthalpy of adsorption (−qst, kJ mol−1) of CO2, CH4, and H2 on the chabazite zeolites is shown in Figure 9a–c. For these samples, the −qst values assume the following order: −qst CO2 > −qst CH4 > −qst H2 and this is largely due to the magnitudes of the quadrupolar moments of the adsorptive molecules (Table 1) with the cations of structure of chabazite zeolites. Sorption data of CO2 on some other adsorbents were previously studied [31]. The −qst values related to the CHA zeolites correspond to the following decreasing sequence:
- −qst (CO2): Na: 1 > 3 > 2; Ca: 1> 3 > 2; Ca: 2 > 3 > 1 and Mg: 3 > 1 > 2
- −qst (CH4): Mg: 1 > 2 > 3; Ca: 2 > 1 > 3; Na: 1 > 2 > 3, while for
- −qst (H2): Mg: 1 > 2 > 3, Ca: 2 > 3 > 1, and Na: 2 > 3 > 1.
This behavior can be explained as follows: the enrichment of CHA structure by Na+ ensures the participation of these cations in the interaction with CO2 quadrupole (0.64 A3) and generation of improved adsorption centers (Table 1). These results can be explained considering the difference in the properties of the CO2 molecule. Its critical diameter is equal to 0.31 nm, with the polarizability equal to 1.9 A3 [18]. This effect means the molecule is influenced to a greater extent by the electric field, which create the cations presented in material. It is very likely that differences in properties of this gas are responsible for the CO2 being adsorbed in remote sites, as this molecule interacts specifically with the electric field of solid. In Figure 9a the −qst values are lower than the enthalpy of vaporization (qL, 17.165 kJ mol−1) values, which indicates a weak interaction of CO2 with the zeolite CHA. The behavior of −qst of CO2 is associated with the heterogeneous surface energetically. From the sequence it is observed that the exchange with Na1, Mg2, and Ca1 favors this interaction in greater proportion (Table 6). On the other hand, regarding the −qst CH4 it is established that the exchange with Ca1, Na3, and Mg3 is favored. Finally, for the −qst of H2, it is observed that the ionic exchange with Mg1, Ca2, and Na2 turn out to be the most favored zeolites. In this last case, an aspect of cooperative interaction stands out. For a heterogeneous adsorption system, the isosteric enthalpy curve varies with the surface loading. Information concerning the magnitude of the isosteric enthalpy of adsorption and its variation with coverage can prove useful in analysis of the nature of the surface and the adsorbate phase [32].
5. Conclusions
The XRD data indicate the presence of chabazite (55%) mixed with clinoptilolite (43%) followed by traces of montmorillonite. The FDX analysis indicates that the structure is Ca-chabasite (Ca3.64K1.91Mg1.2Na1.15) [Al2.81Si9.19O23.9 2] 24.27 H2O). The SEM analysis indicates the presence of rhombohedral crystal agglomerates for the chabazite while the clinoptilolite has a presence in the form of coffins. The CHAN and CHACa, CHANa, CHAMg zeolites render IUPAC type I-IV isotherms with low-pressure hysteresis while a type I isotherm is proper for the SSZ13 zeolite. The changes experienced by the nanoporosity of natural and exchanged chabazite are conveniently described by the Dubinin–Astakhov and differential curves of comparison plots methods since the calculated values match the amplitudes of the cavities of this zeolite. The exchange with Mg2+ and Na+ favors an increase of the adsorption capacity of CO2, while that of Ca2+ and Mg2+ favor adsorption through to H2 and CH4. These cations occupy sites in strategic positions S4 and S4′, which are in the channels and nanocavities of these zeolites. The presence of Ca2+ and Mg2+ at S4 and S4′sites causes an increased adsorption into the nanocavities and on the external area of the exchanged zeolites. Depending on the conditions of the exchange treatment, Ca2+, Mg2+, and Na+ were found to be most favorable, well distributed, and accessible for CO2, CH4, and H2 adsorption. Either protons or smaller ionic species can substitute for large blocking cations at the pore entrances of natural chabazite, facilitating access of different molecules into the channels of chabazite.
Author Contributions
Conceptualization, M.Á.H. and K.Q.-E.; methodology, K.Q.-E., J.D.S.-J., G.I.H.-S., R.I.P., E.R. and V.P.; formal analysis M.Á.H. and K.Q.-E.; investigation, M.Á.H., G.I.H.-S. and M.d.l.Á.V.; resources, J.D.S.-J., R.I.P., E.R.; M.d.l.Á.V. and V.P.; data curation, K.Q.-E., G.I.H.-S., J.D.S.-J. and M.d.l.Á.V.; writing—original draft preparation, M.Á.H. and J.D.S.-J. writing—review and editing, M.Á.H. and K.Q.-E., R.I.P., E.R. and V.P.; funding acquisition, M.Á.H. and J.D.S.-J. All authors have read and agreed to the published version of the manuscript.
Funding
This research was funded by “Investigación en Zeolitas” Academic Body, CA-95 (PROMEP-SEP) and “Facultad de Ingeniería Química”, BUAP.
Conflicts of Interest
The authors declare no conflict of interest.
References
- Quiroz-Estrada, K. Uso de Zeolitas Nanoporosas con Efecto Trapdoor Aplicadas a la Adsorción de CO2. Ph.D. Thesis, IPN, Mexico City, México, June 2020. [Google Scholar]
- Secretaría del Medio Ambiente de la Ciudad de México. Inventario de Emisiones de la Ciudad de México 2016. Dirección General de Gestión de la Calidad del Aire, Dirección de Programas de Calidad del Aire e Inventario de Emisiones. Ciudad de México. Septiembre 2018. Available online: http://www.aire.cdmx.gob.mx/descargas/publicaciones/flippingbook/inventario-emisiones-2016/mobile/inventario-emisiones-2016.pdf (accessed on 4 March 2022).
- Li, Y.D.; Yi, H.H.; Tang, X.L.; Li, F.R.; Yuan, Q. Adsorption separation of CO2/CH4 gas mixture on the commercial zeolites at atmospheric pressure. J. Chem. Eng. 2013, 229, 50–56. [Google Scholar] [CrossRef]
- Yuan, B.; Wu, X.; Chen, Y.; Huang, J.; Luo, H.; Deng, S. Adsorption of CO2, CH4, and N2 on Ordered mesoporous carbon: Approach for greenhouse gases capture and biogas up-grading. Environ. Sci. Technol. 2013, 47, 5474–5480. [Google Scholar] [CrossRef] [PubMed]
- Palomino, M.; Corma, A.; Rey, F.; Valencia, S. New Insights on CO2−CH4 Separation Using LTA Zeolites with Different Si/Al Ratios and a First Comparison with MOFs. Langmuir 2009, 26, 1910–1917. [Google Scholar] [CrossRef]
- Banaei, M.; Anbia, M.; Kazemipour, M. Enhancement of CO2/CH4 Adsorptive Selectivity by Functionalized Nano Zeolite. J. Ultrafine Grained Nanostructured Mater. 2018, 51, 174–182. [Google Scholar]
- Feng, L.; Shen, Y.; Wu, T.; Bing, L.; Zhang, D.; Tang, Z. Adsorption equilibrium isotherms and thermodynamic analysis of CH4, CO2, CO, N2 and H2 on NaY Zeolite. Adsorption 2020, 26, 1101–1111. [Google Scholar] [CrossRef]
- Becker, T.M.; Heinen, J.; Dubbeldam, D.; Lin, L.C.; Vlugt, T.J.H. Polarizable Force Fields for CO2 and CH4 Adsorption in M-MOF-74. J. Phys. Chem. C. 2017, 121, 4659–4673. [Google Scholar] [CrossRef] [PubMed] [Green Version]
- Palomino, M.; Corma, A.; Jordá, J.L.; Rey, F.; Valencia, S. Zeolite RHO: A highly selective adsorbent for CO2/CH4 separation induced by a structural phase modification. Chem. Commun. Camb. 2012, 48, 215–217. [Google Scholar] [CrossRef]
- Guo, Y.; Sun, T.; Gu, Y.; Liu, X.; Ke, Q.; Wei, X.; Wang, S. Rational Synthesis of Chabazite (CHA) Zeolites with Controlled Si/Al Ratio and Their CO2/CH4/N2 Adsorptive Separation Performances. Chem.–Asian J. 2018, 13, 3222–3230. [Google Scholar] [CrossRef]
- Yue, Q.; Halamek, J.; Rainer, D.N.; Opanasenko, M. Tuning the CHA framework composition by isomorphous substitution for CO2/CH4 separation. Chem. Eng. J. 2022, 429, 131277. [Google Scholar] [CrossRef]
- Pour, A.A.; Sharifnia, S.; Salehi, R.N.; Ghodrati, M. Performance evaluation of clinoptilolite and 13X zeolites in CO2 separation from CO2/CH4 mixture. J. Nat. Gas Sci. Eng. 2015, 26, 1246–1253. [Google Scholar] [CrossRef]
- Campo, M.C.; Ribeiro, A.M.; Ferreira, A.F.P.; Santos, J.C.; Lutz, C.; Loureiro, J.M.; Rodrigues, A.E. Carbon dioxide removal for methane upgrade by a VSA process using an improved 13X zeolite. Fuel Process. Technol. 2016, 143, 185–194. [Google Scholar] [CrossRef]
- Breck, D.W. Zeolite Molecular Sieves: Structure, Chemistry and Use; John Wiley & Sons Inc.: New York, USA, 1984; pp. 77–78. [Google Scholar]
- IZA. Commission of Natural Zeolites, Chabazite Series, (n. d.). Available online: http://www.iza-online.org/natural/Datasheets/Chabazite/Chabazite.html (accessed on 3 February 2022).
- Yakubovich, O.V.; Massa, W.; Gavrilenko, P.G.; Pekov, I.V. Crystal structure of chabazite K. Crystallogr. Rep. 2005, 50, 544–553. [Google Scholar] [CrossRef]
- Shang, J.; Li, G.; Singh, R.; Xiao, P.; Liu, J.Z.; Webley, P.A. Determination of composition range for “molecular trapdoor” effect in chabazite zeolite. J. Phys. Chem. C. 2013, 117, 12841–12847. [Google Scholar] [CrossRef]
- Reid, R.C.; Prausnitz, J.M.; Sherwood, T.K. The Properties of Gases and Liquids; McGraw-Hill: New York, NY, USA, 1977. [Google Scholar]
- Quiroz, K.; Pacella, A.; Ballirano, P.; Hernández, M.A.; Felipe, C.; Esparza, M. Crystal chemical and structural characterization of natural and cation-exchanged Mexican erionite. Mineral 2020, 10, 772. [Google Scholar] [CrossRef]
- Saeidi, N.; Parvini, M. Accuracy of Dubinin-Astakhov and Dubinin-Radushkevich adsorption isotherm models in evaluating micropore volume of bentonite. Period. Polytech. Chem. Eng. 2016, 60, 123–129. [Google Scholar]
- Hernández, V.; Quiroz, K.; Hernández, M. Evaluation of nanopore size distribution by adsorption differential curves of clinoptilolite zeolites chemically modified. Mex. J. Mater. Sci. Eng. 2016, 3, 49–53. [Google Scholar]
- Majd, M.M.; Kordzadeh-Kermani, V.; Ghalandari, V.; Askari, A.; Sillanpää, M. Adsorption isotherm models: A comprehensive and systematic review (2010–2020). Sci. Total Environ. 2022, 812, 151334. [Google Scholar] [CrossRef]
- Diaz, E.; Ordoñez, S.; Vega, A.; Coca, L. Adsorption Characterization of Different Volatile Organic Compounds over alumina, zeolites and activated carbon using gas chromatography. J. Chromatogr. A 2009, 1049, 139–146. [Google Scholar] [CrossRef] [PubMed]
- Hernandez, M.A.; Pestryakov, A.; Portillo, R.; Salgado, M.A.; Rojas, F.; Rubio, E.; Ruiz, S.; Petranovskii, V. CO2 Sequestration by Natural Zeolite for Greenhouse Effect Control. Procedia Chem. 2015, 15, 33–41. [Google Scholar] [CrossRef] [Green Version]
- Rouquerol, F.; Rouquerol, J.; Sing, K.S.W.; Llewellyn, P.; Maurin, G. Adsorption by Powders and Porous Solids: Principles, Methodology and Applications; Academic Press: Amsterdam, The Netherlands, 2014. [Google Scholar]
- Young, R.A. Introduction to the Rietveld method. In The Rietveld Method; Young, R.A., Ed.; Oxford University Press: Oxford, UK; New York, NY, USA, 1993; p. 298. [Google Scholar]
- Quiroz, K.; Hernández, M.A.; Rojas, F.; Portillo, R.; Rubio, E.; López, L. N2 and CO2 adsorption by soils with high kaolinite content from San Juan Amecac, Puebla, México. Minerals 2016, 6, 73–85. [Google Scholar] [CrossRef] [Green Version]
- Quiroz, K.; Hernández, M.Á.; Mendoza, C.F.; Santamaría, J.D.; Petranovskii, V.; Rubio, E. Critical Admission Temperature of H2 and CH4 in Nanopores of Exchanged ERI Zeolites. Nanomaterials 2019, 9, 160. [Google Scholar] [CrossRef] [Green Version]
- Subagyonoa, R.R.D.J.N.; Chaffeeb, A.L. CO2 adsorption on SBA-15: A molecular modelling. IOP Conf. Ser. Earth Environ. Sci. 2018, 144, 012045. [Google Scholar] [CrossRef]
- Thommes, M.; Kaneko, K.; Neimark, A.V.; Olivier, J.P.; Rodriguez-Reinoso, F.; Rouquerol, J.; Sing, K.S.W. Physisorption of gases, with special reference to the evaluation of surface area and pore size distribution (IUPAC Technical Report). Pure Appl. Chem. 2015, 87, 1051–1069. [Google Scholar] [CrossRef] [Green Version]
- Ackley, M.W.; Rege, S.U.; Saxena, H. Application of natural zeolites in the purification and separation of gases. Micro Mesoporous Mater. 2003, 61, 25–42. [Google Scholar] [CrossRef]
- Krishna, R.; van Baten, J.M. How Reliable Is the Ideal Adsorbed Solution Theory for the Estimation of Mixture Separation Selectivities in Microporous Crystalline Adsorbents? ACS Omega 2021, 6, 15499–15513. [Google Scholar] [CrossRef] [PubMed]

Publisher’s Note: MDPI stays neutral with regard to jurisdictional claims in published maps and institutional affiliations. |
© 2022 by the authors. Licensee MDPI, Basel, Switzerland. This article is an open access article distributed under the terms and conditions of the Creative Commons Attribution (CC BY) license (https://creativecommons.org/licenses/by/4.0/).