Article

Chemical Profiling and Characterization of Different Cultivars of Cannabis sativa L. Inflorescences by SPME-GC-MS and UPLC-MS

1
Toscana Life Sciences Foundation, Via Fiorentina 1, 53100 Siena, Italy
2
Department of Agricultural and Environmental Sciences, Università degli Studi di Milano, 20133 Milan, Italy
3
Phytochem Lab, Department of Agricultural and Environmental Sciences, Università degli Studi di Milano, 20133 Milan, Italy
4
National Interuniversity Consortium of Materials Science and Technology (INSTM), Università degli Studi di Milano, 20133 Milan, Italy
5
Department of Drug Chemistry and Technology, Sapienza University, 00185 Rome, Italy
*
Author to whom correspondence should be addressed.
Separations 2022, 9(4), 90; https://doi.org/10.3390/separations9040090
Submission received: 23 March 2022 / Revised: 31 March 2022 / Accepted: 31 March 2022 / Published: 2 April 2022

Abstract

:
The chemical profile of the Cannabis sativa L. female inflorescences is rather complex being characterized by a large number of molecules belonging to different chemical classes. Considering the numerous applications in various fields, including the medical and pharmaceutical sectors, that have seen a large use of Cannabis genus in recent years, a precise characterization of the matrices is essential. In this regard, the application of adequate and suitable sampling and analysis techniques becomes important in order to provide an identification of the metabolites characterizing the profile of the sample under examination. The goal of this work is to provide additional information on the chemical composition of the inflorescences of five C. sativa different cultivars grown in Emilia Romagna (Italy) through the application of sophisticated analysis techniques such as Solid-Phase Microextraction-Gas Chromatography-Mass Spectrometry and Ultra-Performance Liquid Chromatography-Mass Spectrometry (SPME-GC-MS and UPLC-MS). The obtained data highlighted the presence of a high number of volatile and non-volatile compounds, thus allowing a comparative evaluation of the different samples. Furthermore, an in-depth statistical survey by Principal Components Analysis (PCA) and HeatMap, Hierarchical luster Analysis (HCA) and Partial Least Squares Discriminant Analysis (PLS-DA-VIP), was conducted to consider any correlations between the investigated cultivars. The findings of this study may help to provide more information on the C. sativa inflorescences useful for potential applications of their metabolites in scientific research.

1. Introduction

Cannabis sativa L. (Cannabaceae) was one of the first non-food crops to be cultivated. It is an annual flowering herbaceous plant native to temperate central Asia, where its use seems to date back to around 4500 BC [1,2]. This species is found in different habitats ranging from sea level to the temperate and alpine foothills of the Himalayas [3]. The domestication probably occurred independently in several centers of East Asia in early Neolithic times [4]. Around 1000 BC, it rapidly spread throughout Asia and Europe following the migration of nomads and the movements of traders [2,5]. C. sativa has a long history as a medicinal plant, used, for example, in traditional Tibetan and Ayurvedic medicine as well as in social and religious rituals. The strong, mildew resistant fiber has long been used by humans in the construction of ropes and sails. In China, the seeds are still commonly eaten, roasted or raw [6,7]. In recent years, the renewed interest in the therapeutic effects of C. sativa has led to the legitimate medicinal use through clinical studies demonstrating its efficacy [8]. Moreover, currently, C. sativa is an agricultural commodity grown to be used in the production of foods and beverages, nutritional supplements, cosmetics and personal care products, textiles, paper, insulation materials, and other manufactured goods [9,10].
From a chemical point of view, C. sativa is a complex species with numerous (>500) reported secondary metabolites, both cannabinoid and non-cannabinoid constituents, obtained from all plant parts (leaves, flowers, bark, seeds, and roots) [11,12,13,14]. The former are a specific chemical class found in Cannabis genus, a group of compounds with a characteristic C21 terpenophenolic backbone and divided into several sub-classes [15]. The latter belong to various chemical classes including alkaloids, flavonoids, non-cannabinoid phenols, and terpenes as well as others [12,15,16,17]. While the stems provide cellulosic and woody fibers and the seeds are exploited in the feed and food industry for their high content of fatty acids and proteins, the leaves and inflorescences of C. sativa are a rich source of phytochemicals [18].
In this work, the inflorescences of five organic C. sativa commercial cultivars were chemically investigated. In particular, (i) V1 CBD, (ii) Banana Hybrid, (iii) Green Poison (iv), Candy BUD and (v) Gorilla CBD (Figure 1) were analyzed, all with a high cannabidiol content and characterized by medium/large sized buds, compact and containing a good amount of resin. They are obtained from greenhouse crops located in the Tuscan-Emilian Apennines (Italy), where the entire processing cycle is carried out strictly by hand and the tanning process is particularly long in order to obtain and enhance their unique taste. In detail, Green Poison gives off an unusual smell due to contrasting sugary and bitter aromas leaving a very pleasant aftertaste. As the name suggests, Banana Hybrid releases sweet banana fragrances. Both V1 CBD and Candy BUD have a dense and particularly fragrant smell with fruity notes reminiscent of citrus fruits. Gorilla CBD smells of grass and pine [19]. With the aim to provide a detailed description of their chemical composition, we applied the SPME-GC/MS and UPLC/MS techniques. The findings were useful for carrying out a comparative assessment also thanks to a sophisticated statistical survey that highlighted qualitative and quantitative differences in volatile and non-volatile chemical profile.

2. Materials and Methods
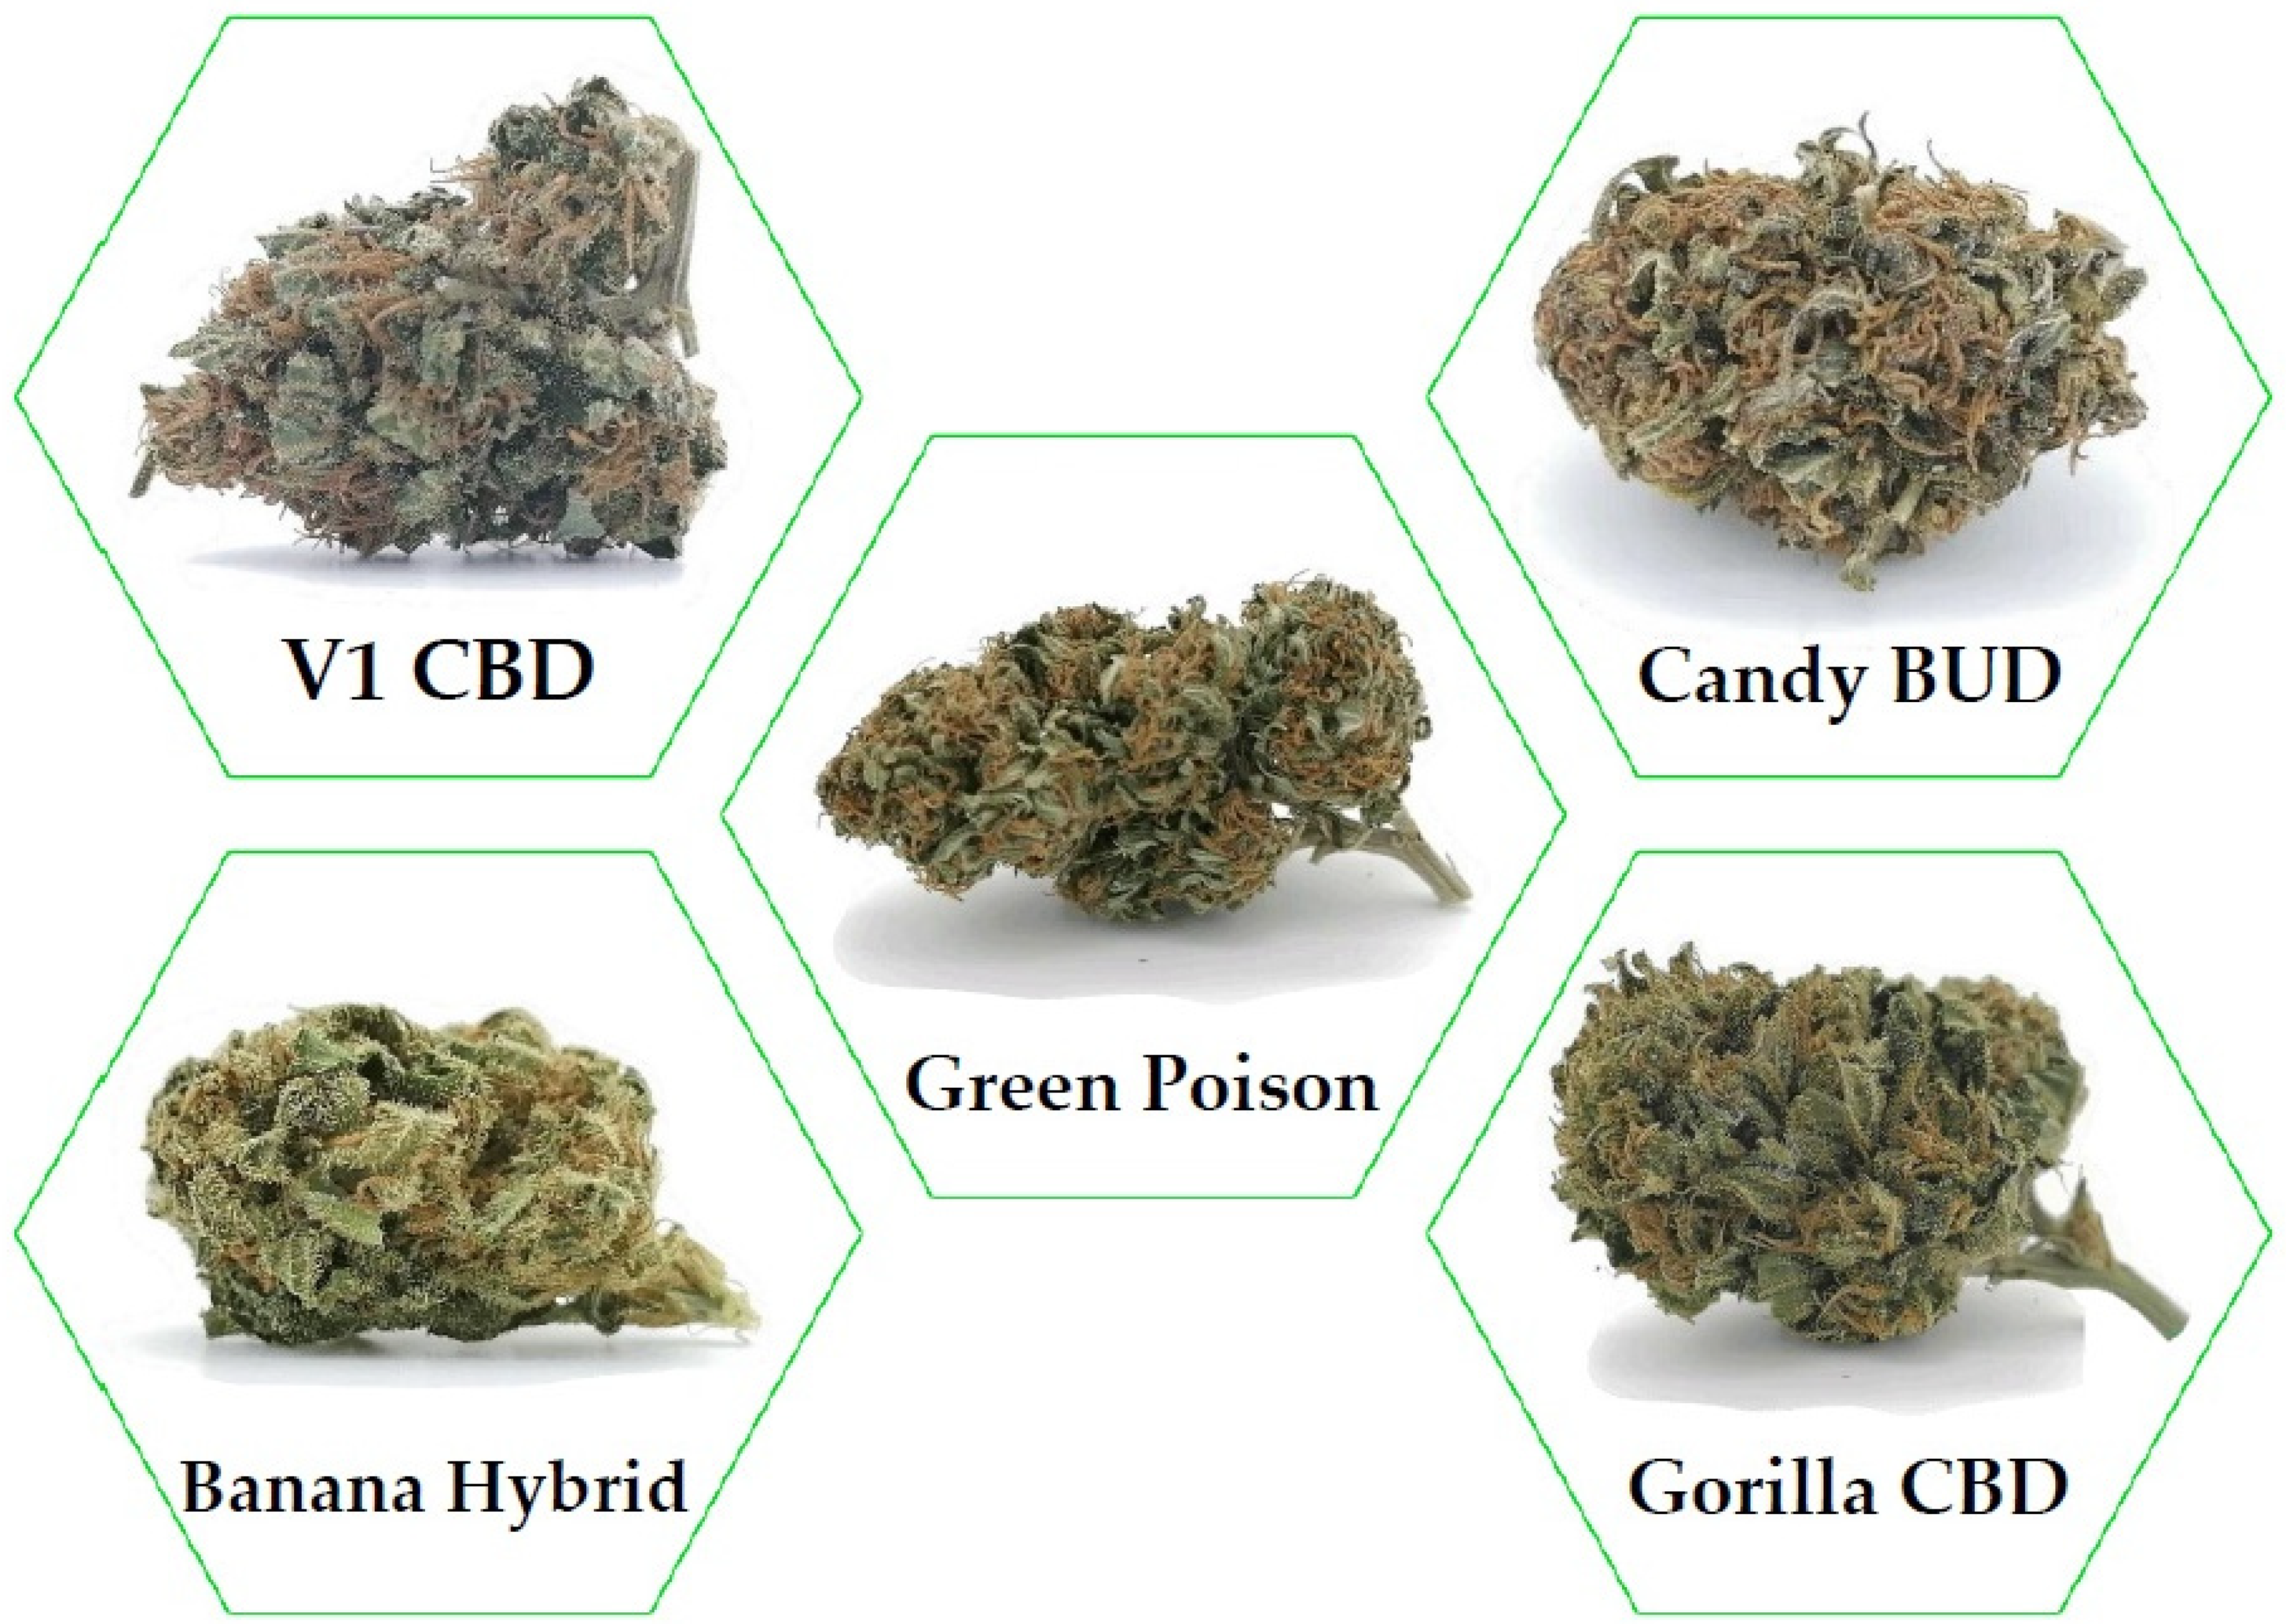
2.1. Materials

The inflorescences of C. sativa were a kind gift from the Apennino Farm—Gaggio Montano (BO) 40041, Italy. These are high quality samples collected from mature female plants of five cultivars grown in full compliance with the law and the environment without the use of pesticides or chemical additives. After slow drying, they were delivered to the laboratory during January 2021 packed in paper bags (5.0 g each), then stored in a dry and dark place until use. The voucher specimens (No. CSAFBO 130-134) were deposited at the Department of Agricultural and Environmental Sciences of the Milan State University (Milan, Italy).
Formic acid, acetonitrile, ethanol and water were purchased from Sigma–Aldrich (Milan, Italy) and they were all LC-MS grade.

2.2. SPME Sampling

To investigate the volatile chemical composition of the C. sativa inflorescences, SPME sampling technique was used following Vitalini et al. [20], with some modifications. About 2 g of each variety were placed inside a 20 mL glass vial with PTFE-coated silicone septum. A SPME device from Supelco (Bellefonte, PA, USA) with 1 cm fiber coated with 50/30 μm DVB/CAR/PDMS (divinylbenzene/carboxen/polydimethylsiloxane) was used to obtain the volatiles extraction. Before use, the fiber was conditioned at 270 °C for 30 min. The equilibration time for all samples of inflorescence was obtained heating to 50 °C for 10 min. After this time, the fiber was exposed to the headspace of the samples for 30 min at 50 °C to capture and concentrate the volatiles. Lastly, the SPME fiber was inserted in the GC injector maintained at 250 °C in split mode (1:20) for desorption of the collected compounds.

2.3. GC-MS Analysis

The analyses of the headspace from C. sativa inflorescences were carried out on Clarus 500 model Perkin Elmer (Waltham, MA, USA) gas chromatograph coupled with a mass spectrometer equipped with a FID (flame detector ionization). The capillary column was a Varian Factor Four VF-1. The GC and MS parameters were following Iannone et al. [21]. Briefly, the oven programmed temperature was set initially at 60 °C and then increased to 220 °C at 6°/min and finally held for 15 min. Helium was used as carrier gas at a constant rate of 1 mL/min. MS detection was performed with electron ionization (EI) at 70 eV operating in the full-scan acquisition mode in the m/z range 40–500 amu. The volatile compounds were identified by the comparison of the MS-fragmentation pattern of the analytes with those of pure components stored in the Wiley 2.2 and Nist 02 mass spectra libraries database. Further, the Linear Retention Indices (LRIs) were calculated using a series of alkane standards (C8–C25 n-alkanes) analyzed under the same chromatographic conditions described above. LRIs were then compared with available retention data reported in the literature. The relative amounts of the components were expressed as percent peak area relative to total peak area without the use of an internal standard and any factor correction. All analyses were carried out in triplicate.

2.4. UPLC-MS Analysis

All the samples were analyzed using an Ultimate 3000 UPLC system (Thermofisher Scientific) that was controlled with Thermo Xcalibur software Thermo Fisher Scientific, (Waltham, MA, USA). The samples were prepared by following this method: 100 mg of sample powder was ultrasonicated for 30 min with 5 mL of 70% ethanol, followed by centrifugation (15,000 rpm, 4 °C) for 10 min. The resulting supernatant of the samples was injected into the UPLC-Q-Exactive plus system. The samples were separated using a column Acquity UPLC BEH C18 (2.1 mm × 15 cm, 1.7 μm, Waters). The mobile phases consisted of solvent A (0.1% formic acid in water) and solvent B (0.1% formic acid in acetonitrile). The gradient started with 30% of B, that was maintained constant for 3 min. Then the organic phase was increased up to 60% in 50 min and then raised again up to 90% in 2 min. The phase B was maintained at 90% for other 2 min and then returned to the initial conditions. The flow rate was kept at 0.2 mL/min and the sample injection volume was 10 μL, and the column temperature was maintained at 50 °C.
Mass spectrometry analyses were performed on a Q-Exactive Plus™ quadrupole-Orbitrap mass spectrometer Thermo Fisher Scientific (Waltham, MA, USA) in negative and positive ion mode. The scan mass range was set at m/z 200–2000. HR-MS spectra were recorded in positive and negative ion mode using the following parameters: spray voltage 3.5 kV (positive) and 3.0 kV (negative), sheath gas 20 (arbitrary units), auxiliary gas 5.0 (arbitrary units), capillary temperature 320 °C and resolution 35,000. MS/MS spectra were obtained by a Higher Energy Collision Dissociation (HCD) of 30 (arbitrary units). The accuracy error threshold was fixed at 5 ppm. The final annotated metabolome dataset was generated by Compound Discoverer 3.3 (Demo version, Thermo Fisher, Waltham, MA, USA). The retention time RT = 0.2 min, mass = 10 ppm, and other parameters were selected as the default values for peak extraction and peak alignment.

2.5. Statistical Analysis

The resulting data matrix was imported into MetaboAnalyst 5.0 online platform [22] and graphically displayed by using several R packages (“ComplexHeatmap” version 2.11.1, “Circlize’ version 0.4.13, and “ColorRamps” version 2.3). The obtained data were normalized by sum. First, principal component analysis (PCA) was applied to provide an exploratory data analysis. PCA is effective for separating features into groups based on commonality and reports the weight of each component’s contribution to the separation. The mechanism underlying PCA is an orthogonal transformation transferring a set of correlated variables into a new set of uncorrelated variables. PCA is a preliminary step in a multivariate analysis to provide an unsupervised overview of the samples. An unsupervised PCA analysis on MetaboAnalyst 5.0 was carried out to determine how metabolites differ from each other, and which compounds contribute the most to this difference. Moreover, a hierarchical cluster analysis (HCA) was performed to obtain a dendrogram of varieties, based on Euclidean distance, using the metabolome dataset. Lastly, the differences in the metabolites were detected using PLS-DA. The corresponding VIP values were calculated using the PLS-DA model. The VIP value represents the difference between the considered variables. A VIP value above 1.5 indicated components that play an important role in differentiating between samples. Only components with VIP > 1.5 and p < 0.05 were selected as potential markers. Additionally, a heatmap was plotted to visualize the variations in potential markers for separating samples with processing times into different groups. To measure the linear correlation between datasets, a correlation matrix based on Pearson Correlation Coefficient was performed by using MetaboAnalyst 5.0. The result has a value between −1 (strong inverse correlation) and 1 (strong direct correlation).

3. Results

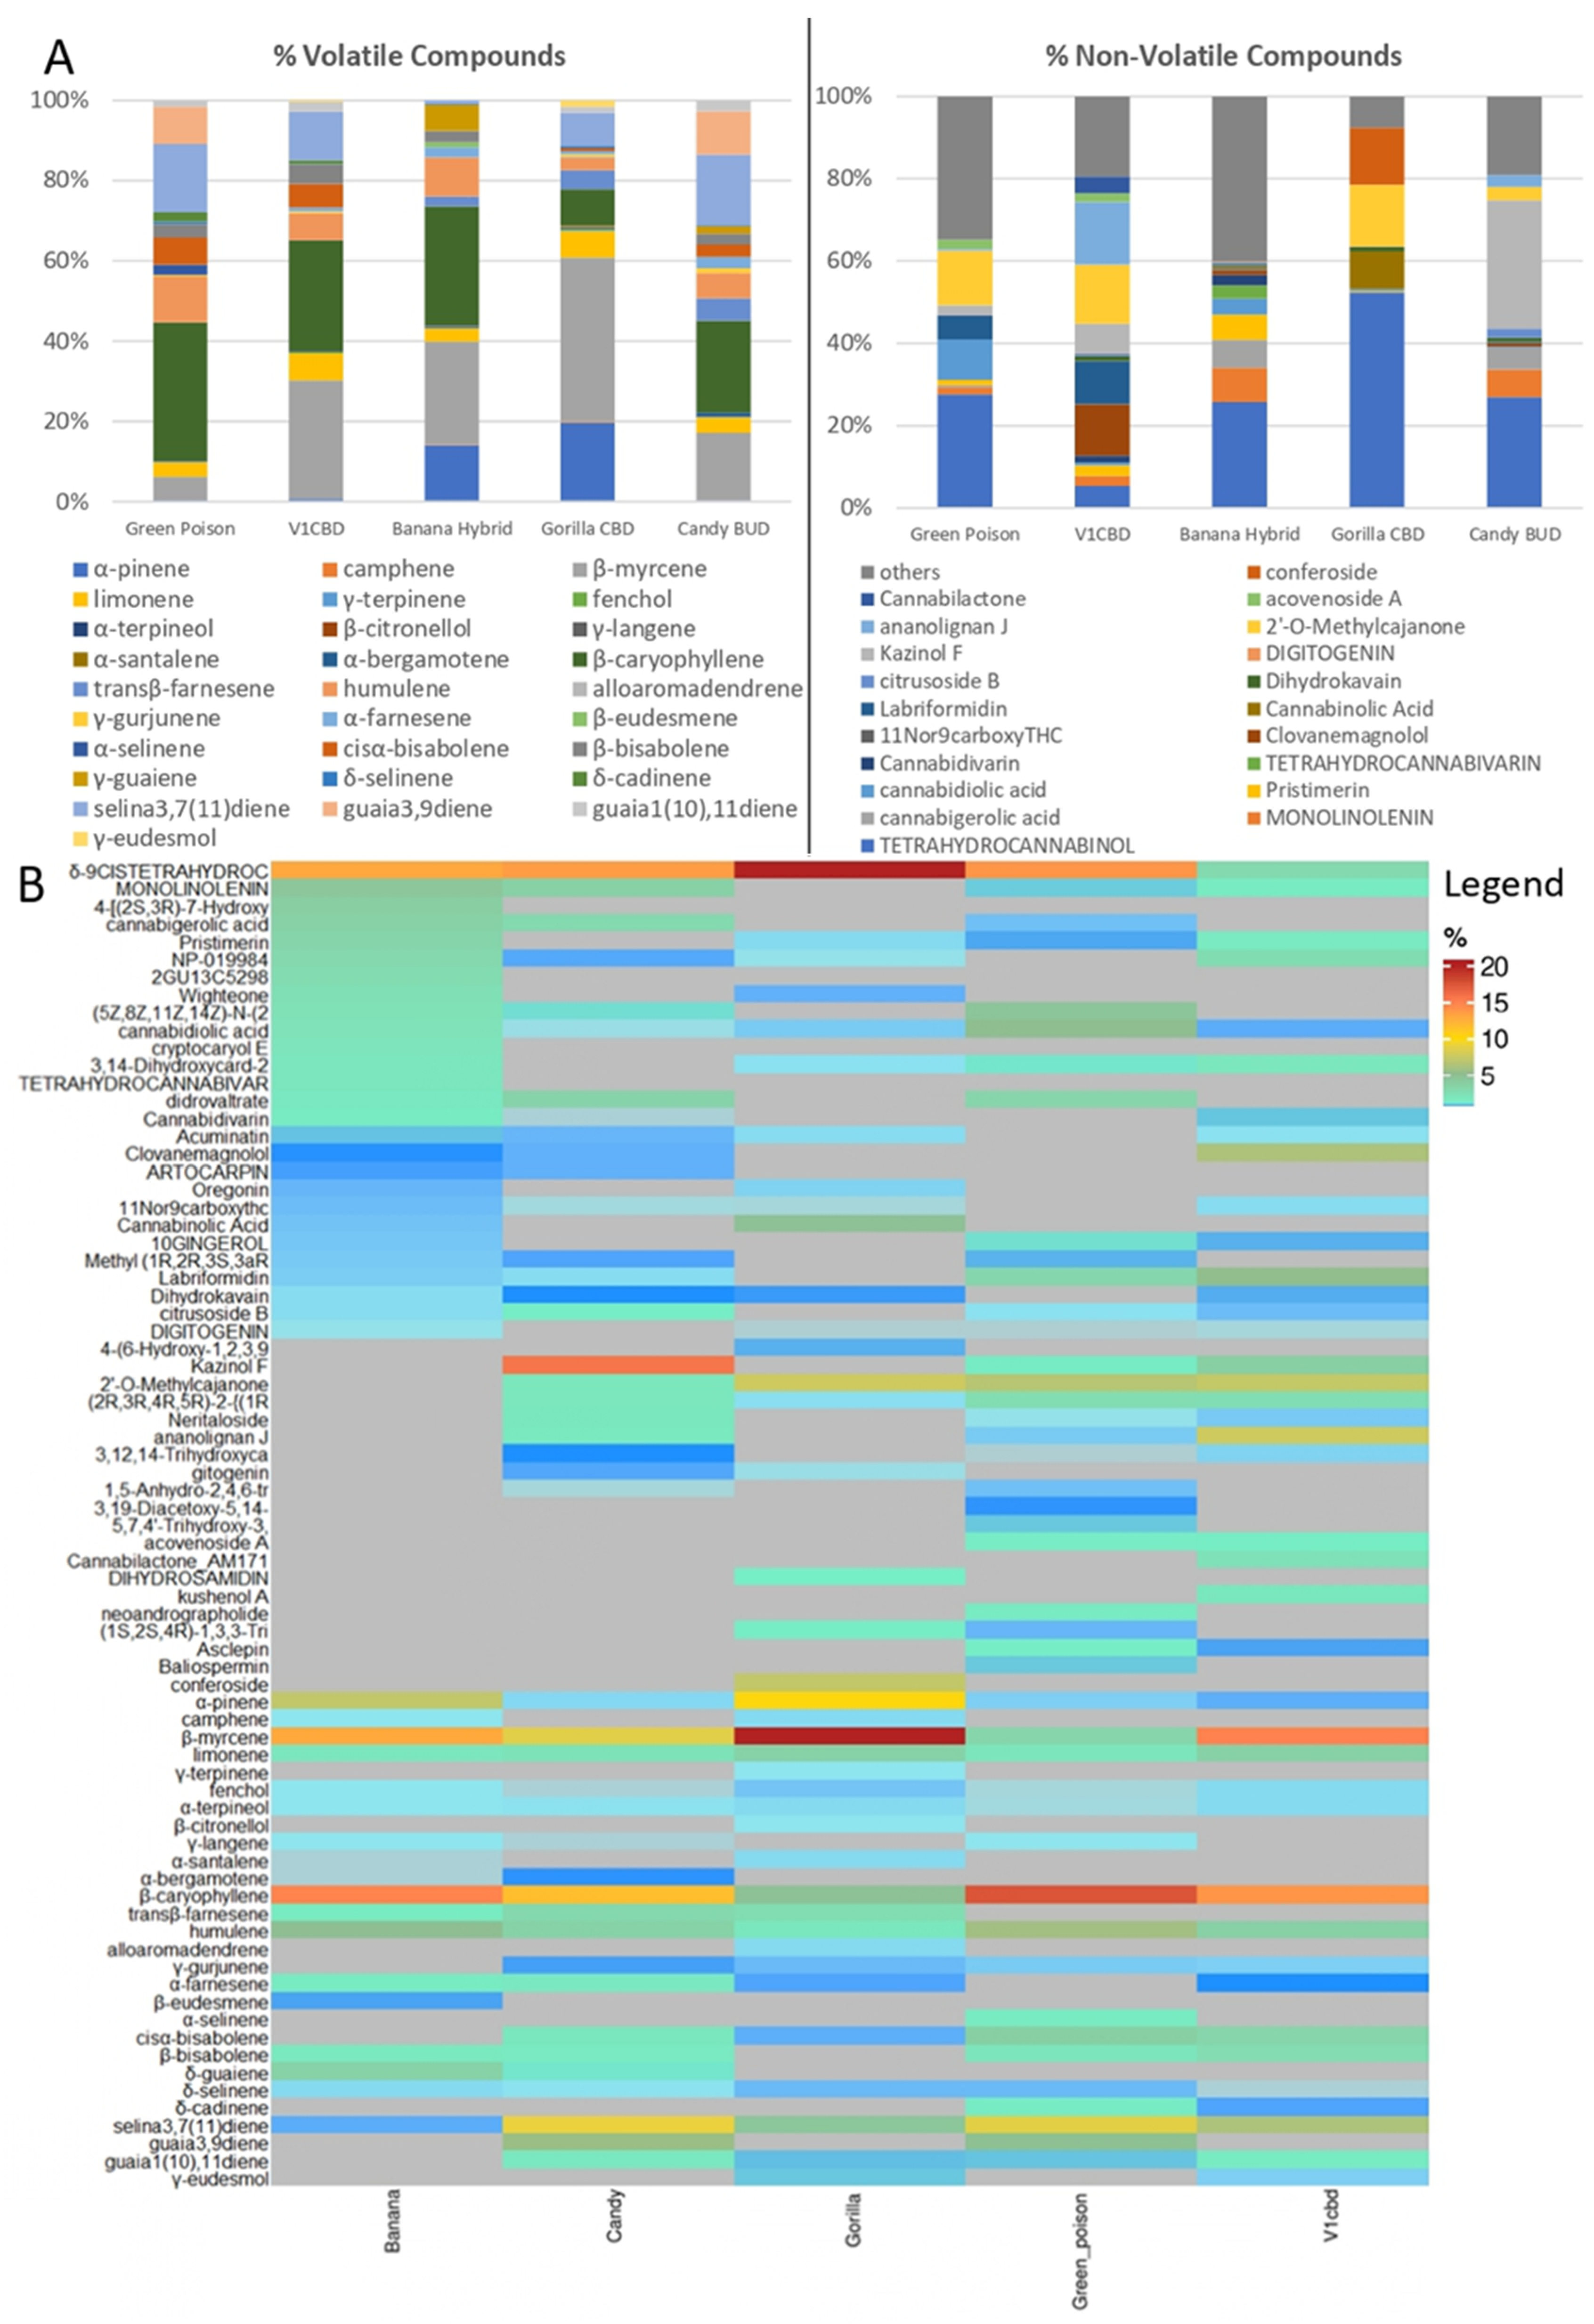
3.1. GC-MS Chemical Composition

The SPME-chromatographic analyses allowed the identification of 31 volatile components (Table 1). Sesquiterpenoids were the predominant class of compounds in Green Poison (89.8%), V1 CBD (62.4%), Banana Hybrid. (54.6%) and Candy BUD (73.6%); on the contrary, terpenoids prevailed in Gorilla CBD (68.4%). Quantitative differences were found between the investigated inflorescences. β-myrcene was the major component in V1 CBD (29.6%) and Gorilla CBD (40.8%) while β-caryophyllene was in Green Poison (34.5%), Banana Hybrid (28.9%) and Candy BUD (21.6 %). Other relevant differences concerned the percentage contents of α-pinene, humulene and selina-3,7(11)-diene. In detail, α-pinene reached 13.7% and 19.7% in Banana Hybrid and Gorilla CBD, respectively, compared to detected percentages less than 1% in the other cultivars. The percentage values of humulene ranged from 6.0% to 11.4% but a lower value equal to 3.1% in Gorilla BUD was recorded. Instead, for seline-3,7(11)-diene, the lowest value was recorded in Banana Hybrid (0.7%) contrary to the higher percentage contents found in Candy BUD (16.7%) and Green Poison (17.1%). From a qualitative point of view, it is interesting to highlight the differences due to the presence of compounds in some cultivars and absent in the others. In particular, guaia-3,9-diene was detected in Green Poison (9.3%) and Candy BUD (10.2%); δ-guaiene in Banana Hybrid (6.4%) and Candy BUD (1.8%) as well as δ-cadinene only in Green Poison (2.3%) and V1 CBD (0.8%). Further similar differences, visible in Table 1, concern detected compounds with percentage values lower than 1% such as camphene, y-langene, α-santalene and α-bergamotene. On the other hand, specific compounds were characteristic of only one species such as β-eudesmene (1.2%: Banana Hybrid) and α-selinene (2.5%: Green Poison). Furthermore, other components such as γ-terpinene (0.2%), β-citronellol (0.2%) and alloaromdendrene (0.3%) were found in Gorilla CBD cultivar and missing in the others.

3.2. UPLC-MS Chemical Composition

UPLC analyses allowed the identification of 47 non-volatile compounds listed in Table 2. Among these, δ-9-cis-tetrahydrocannabinol, (-)- was the major detected compound in Green Poison (27.4%), in Banana Hybrid (25.4%), in Gorilla CBD (51.9%) and in Candy BUD (26.7%) while its content reached 5.0% value in V1 CBD cultivar where the principal component was ananolignan J (14.1%).
5-Hydroxy-7-[4-hydroxy-2-methoxy-5-(3-methyl-2-butenyl)phenyl]-2,2-dimethyl-7,8-dihydro-2H,6H-pyrano[3,2-g]chromen-6-one (or 2′-O-methylcajanone) was the second most abundant compound in Green Poison (13.1%), V1 CBD (13.4%) and Gorilla CBD (14.8%) while, 1,2-benzenediol, 5-(3-(2,4-dihydroxyphenyl)propyl)-3,4-bis(3-methyl-2-butenyl)- (or kazinol F) was in Candy BUD (31.0%). Both compounds were missing in Banana Hybrid, in which 4-[(2S,3R)-7-hydroxy-3-(hydroxymethyl)-5-(3-hydroxypropyl)-2,3-dihydro-1-benzofuran-2-yl]-2-methoxyphenyl 6-deoxy-α-L-mannopyranoside (7.1%) and uscharidin (5.0%) were found, contrary to the other cultivars. Conferoside (13.8%) and small amounts of 4-(6-hydroxy-1,2,3,9a-tetrahydro-3ah-spiro[cyclopenta[b]chromene-9,1′-cyclopentan]-3a-yl)-1,3-benzenediol (1.3%) and cihydrosamidin (2.0%) were detected only in Gorilla CBD. In our study, we have found the precursor of cannabinoids, cannabigerolic acid, only in Green Poison (0.5%), Banana Hybrid (6.7%) and Candy BUD (5.3%).

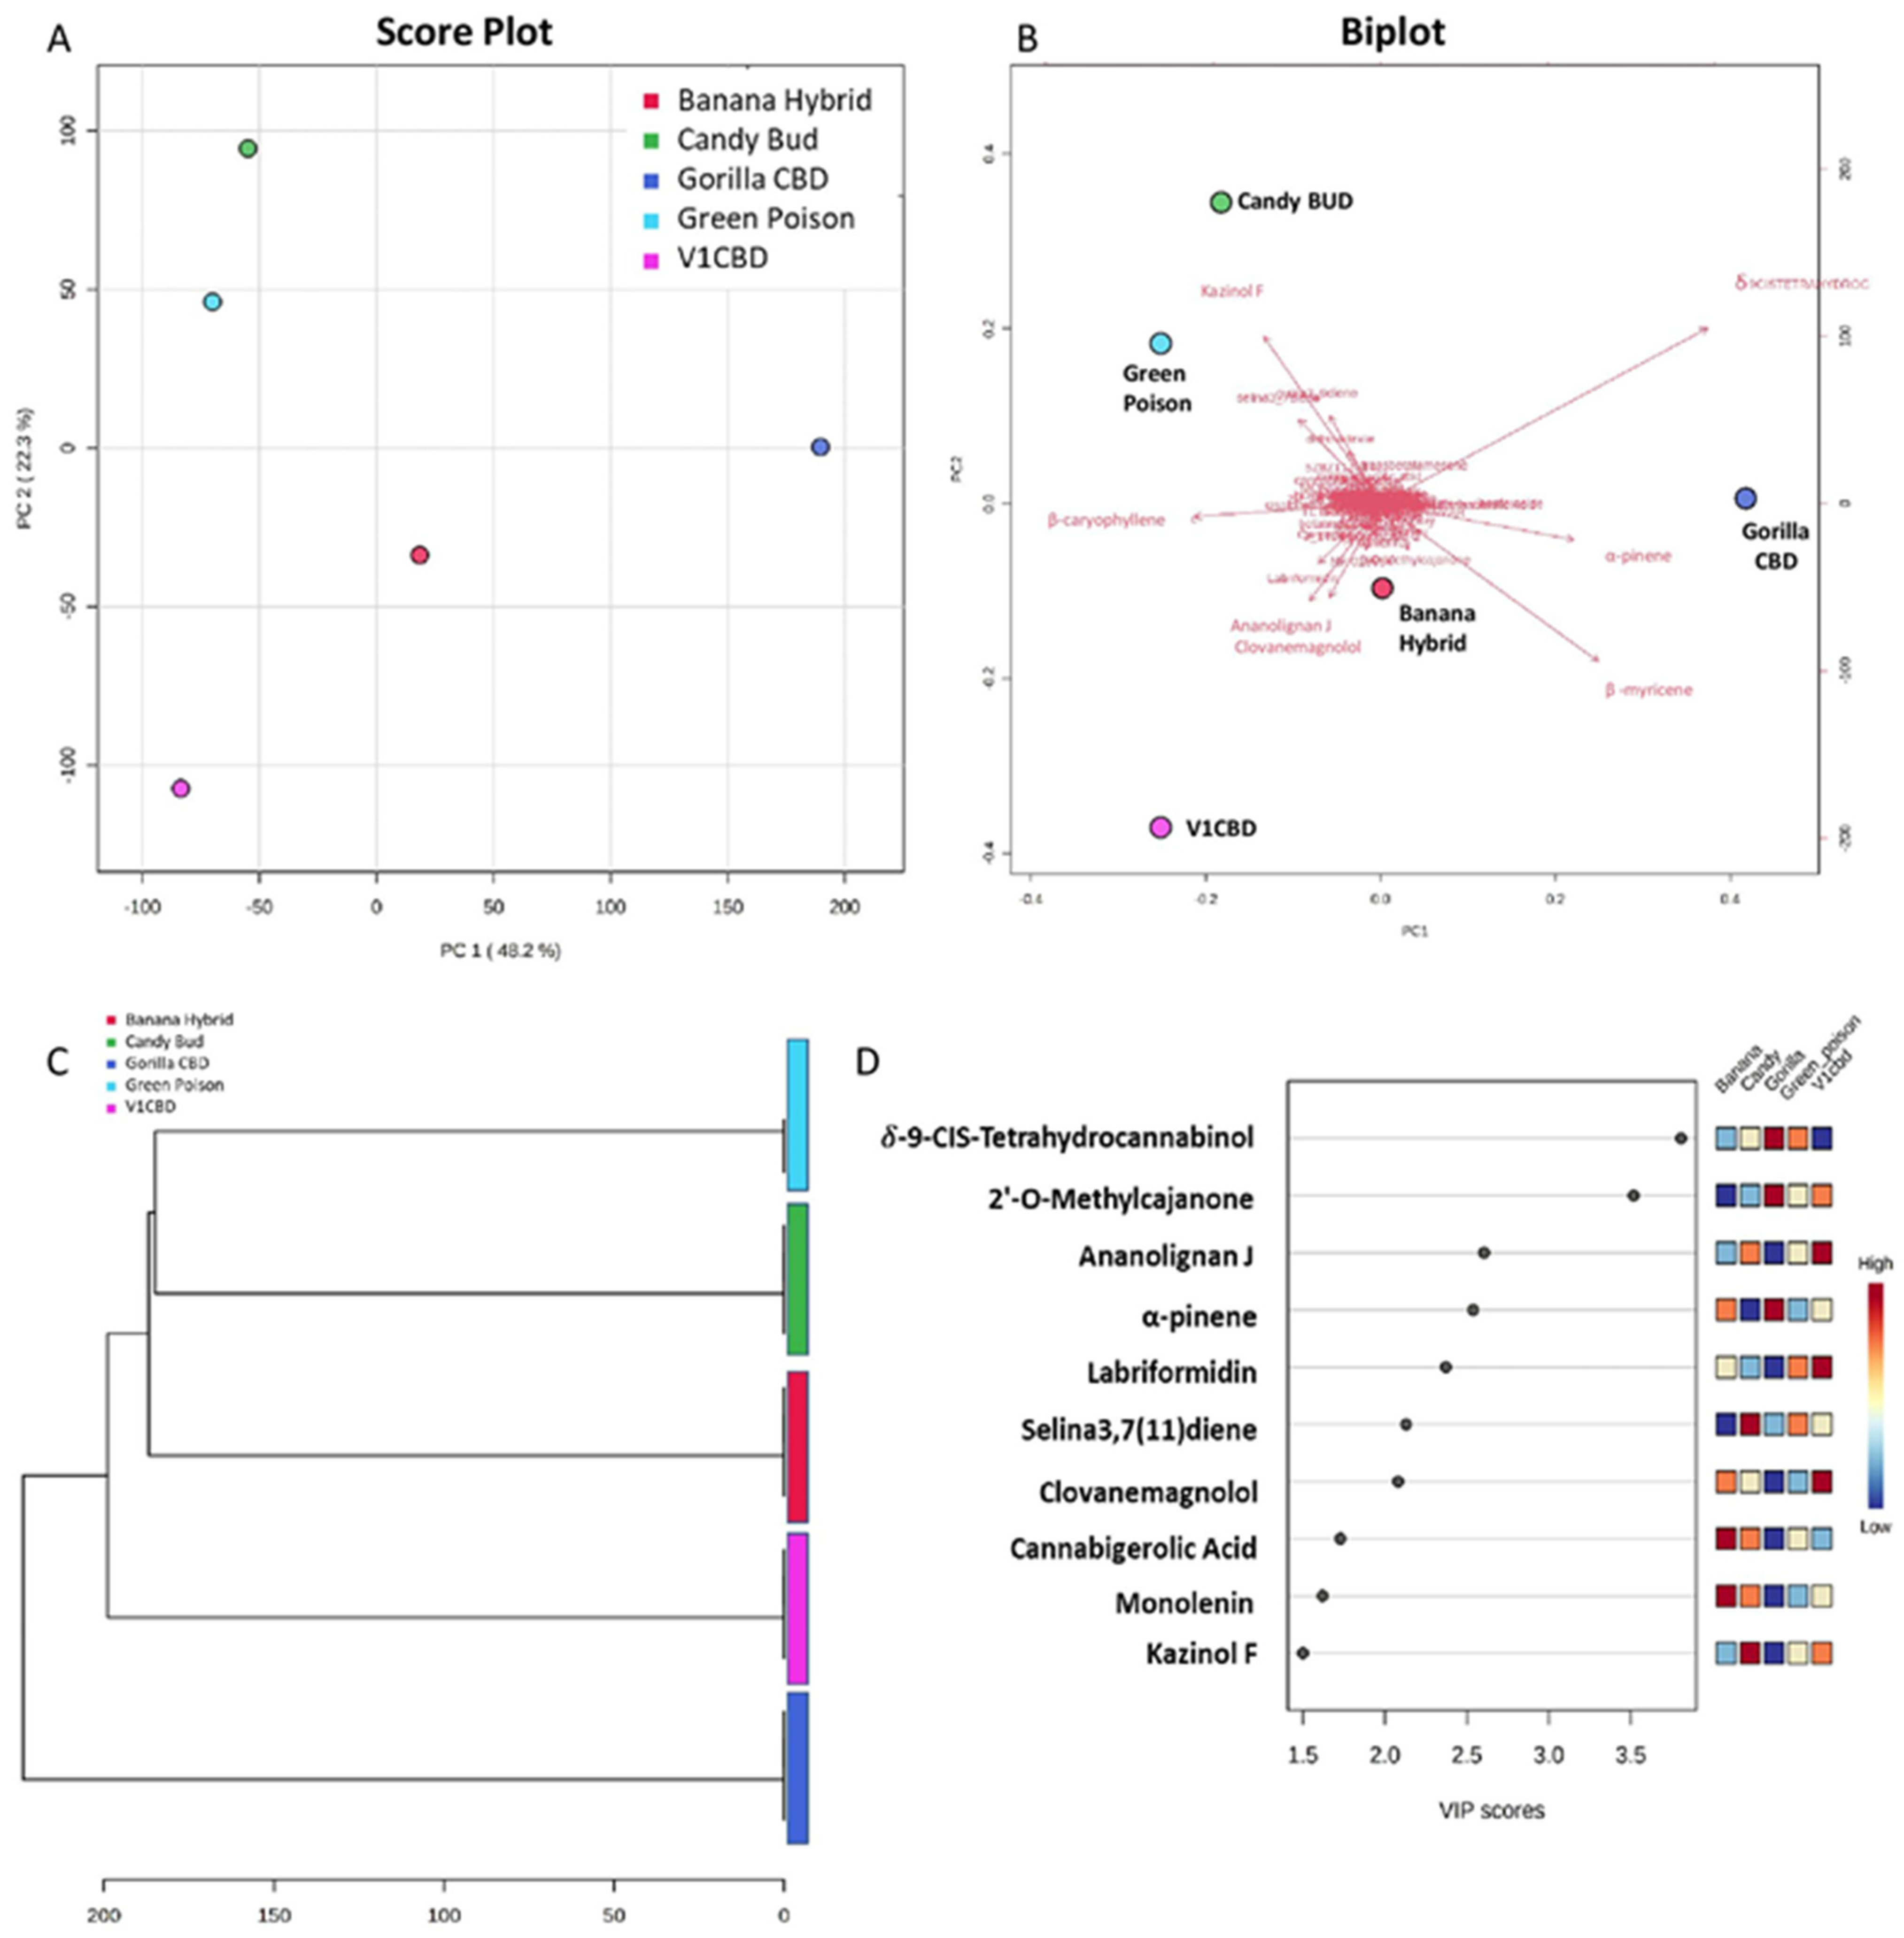
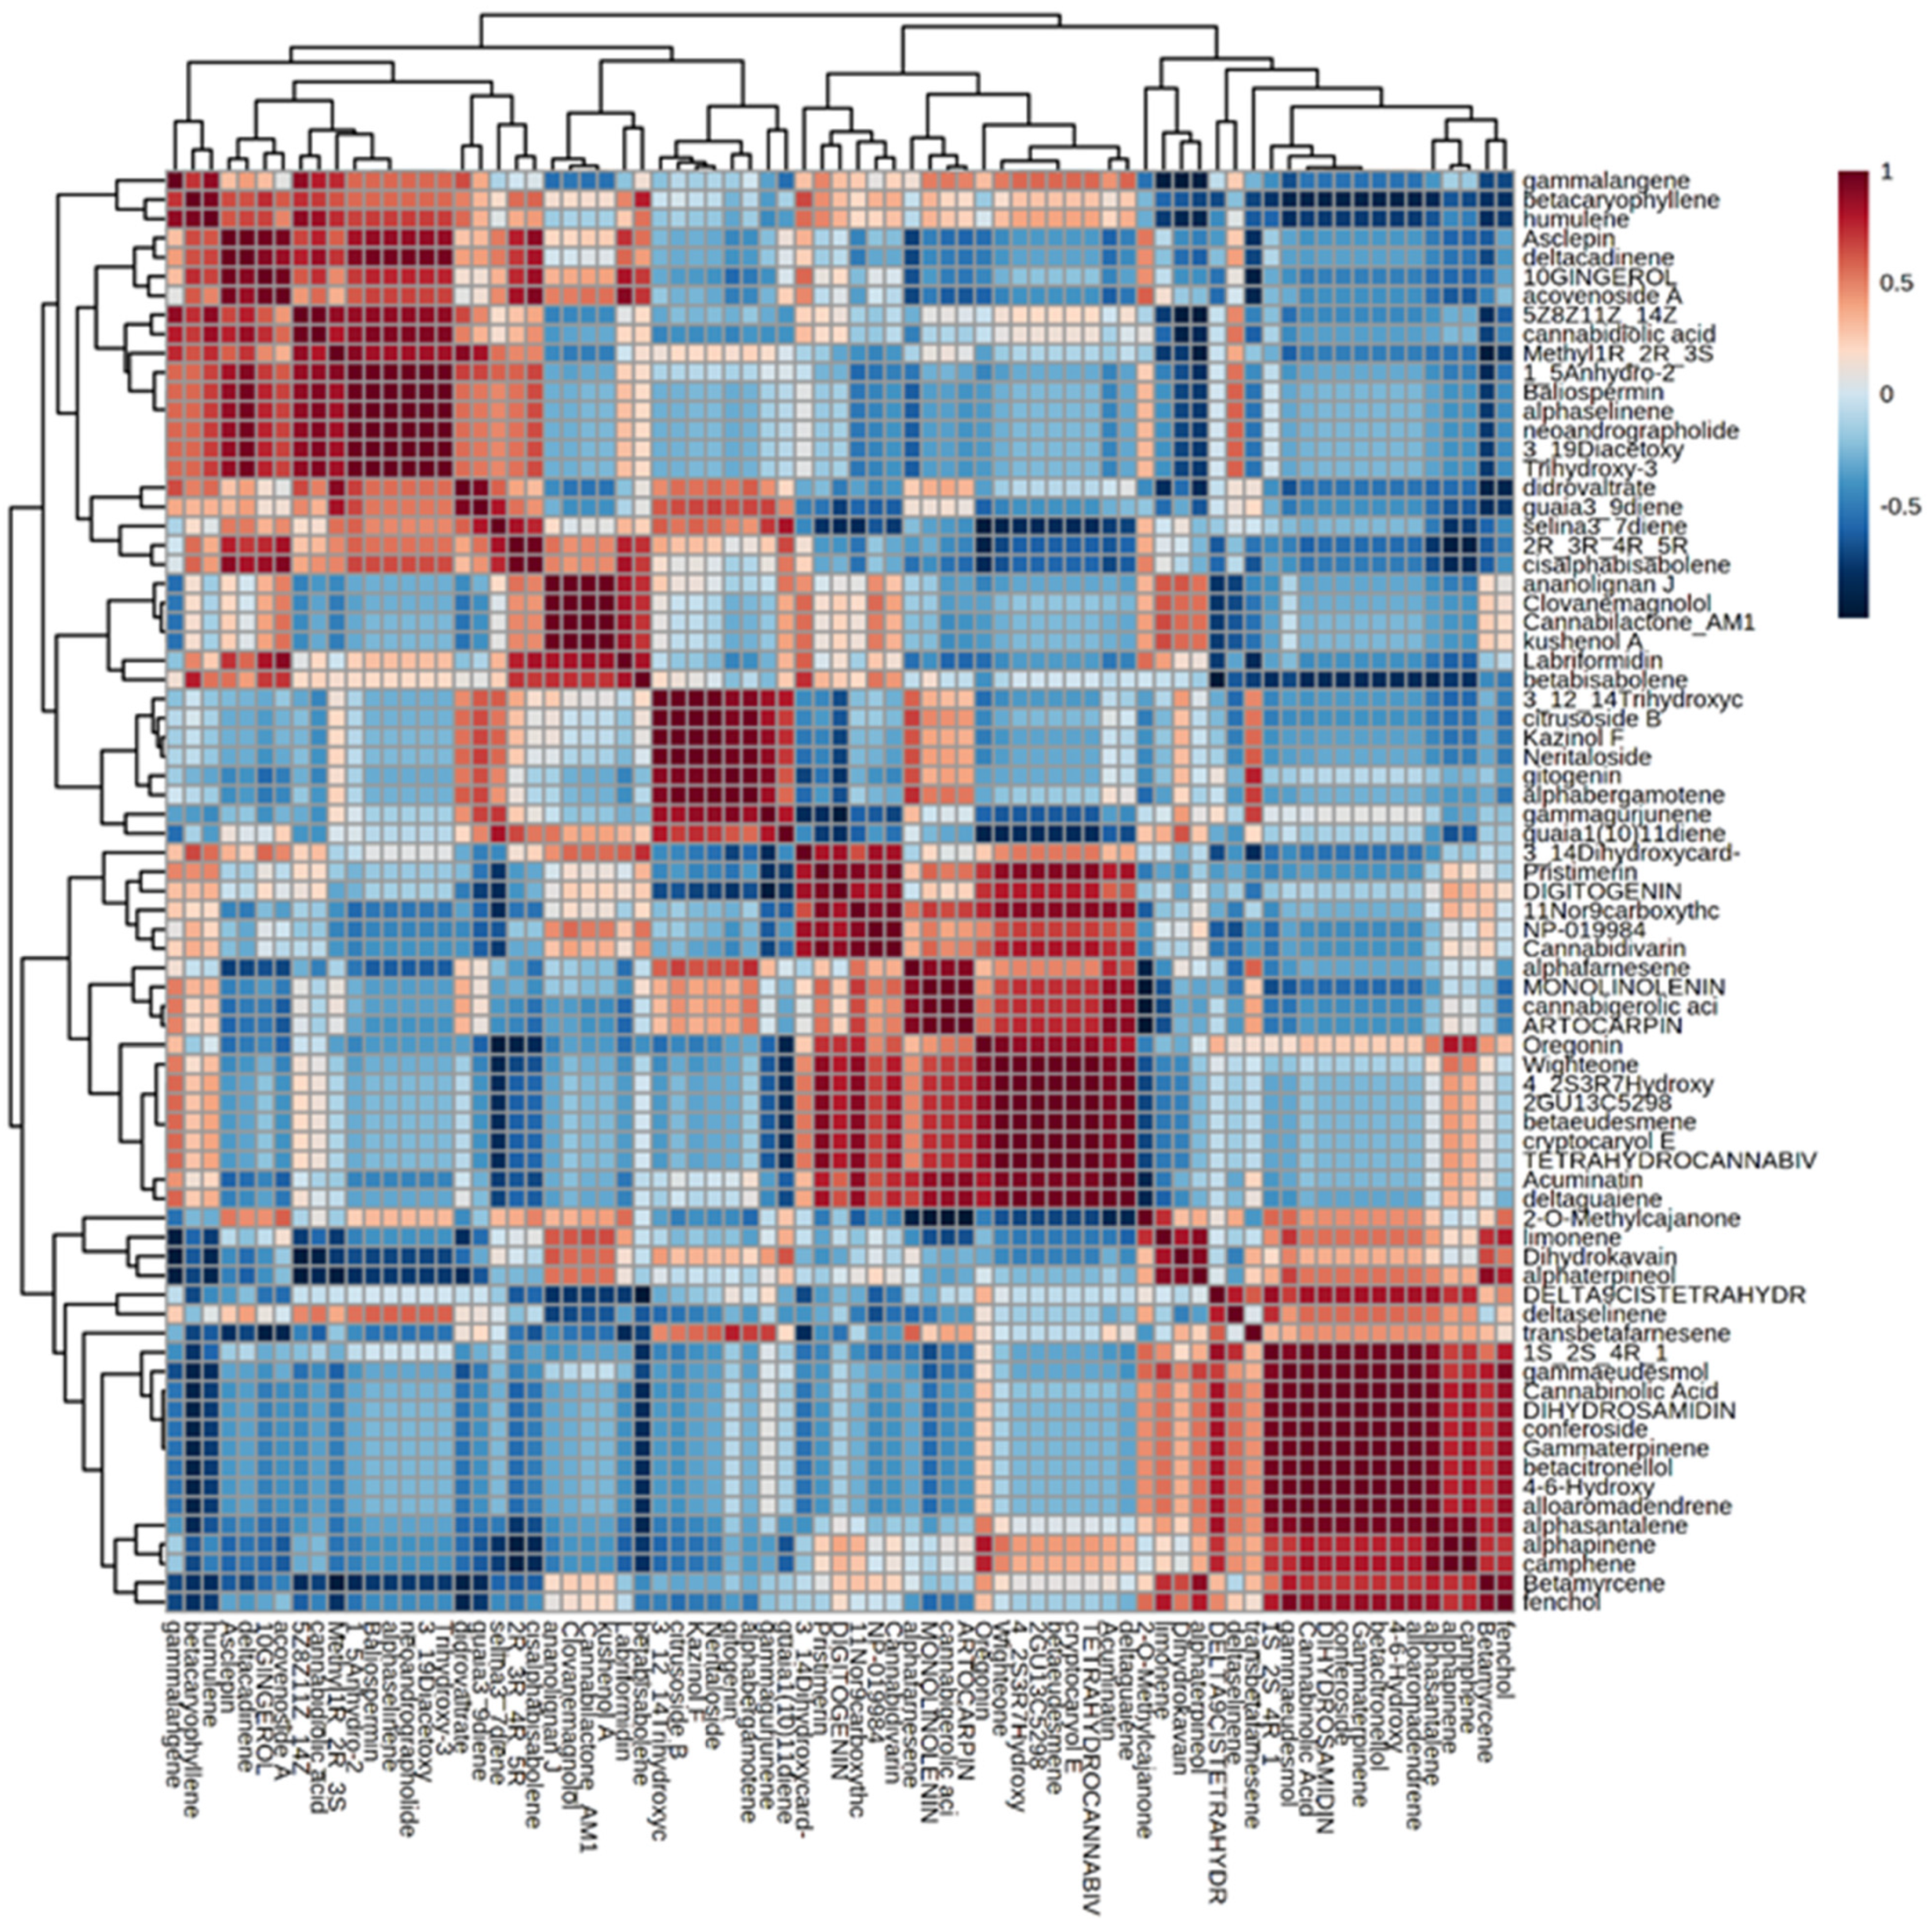
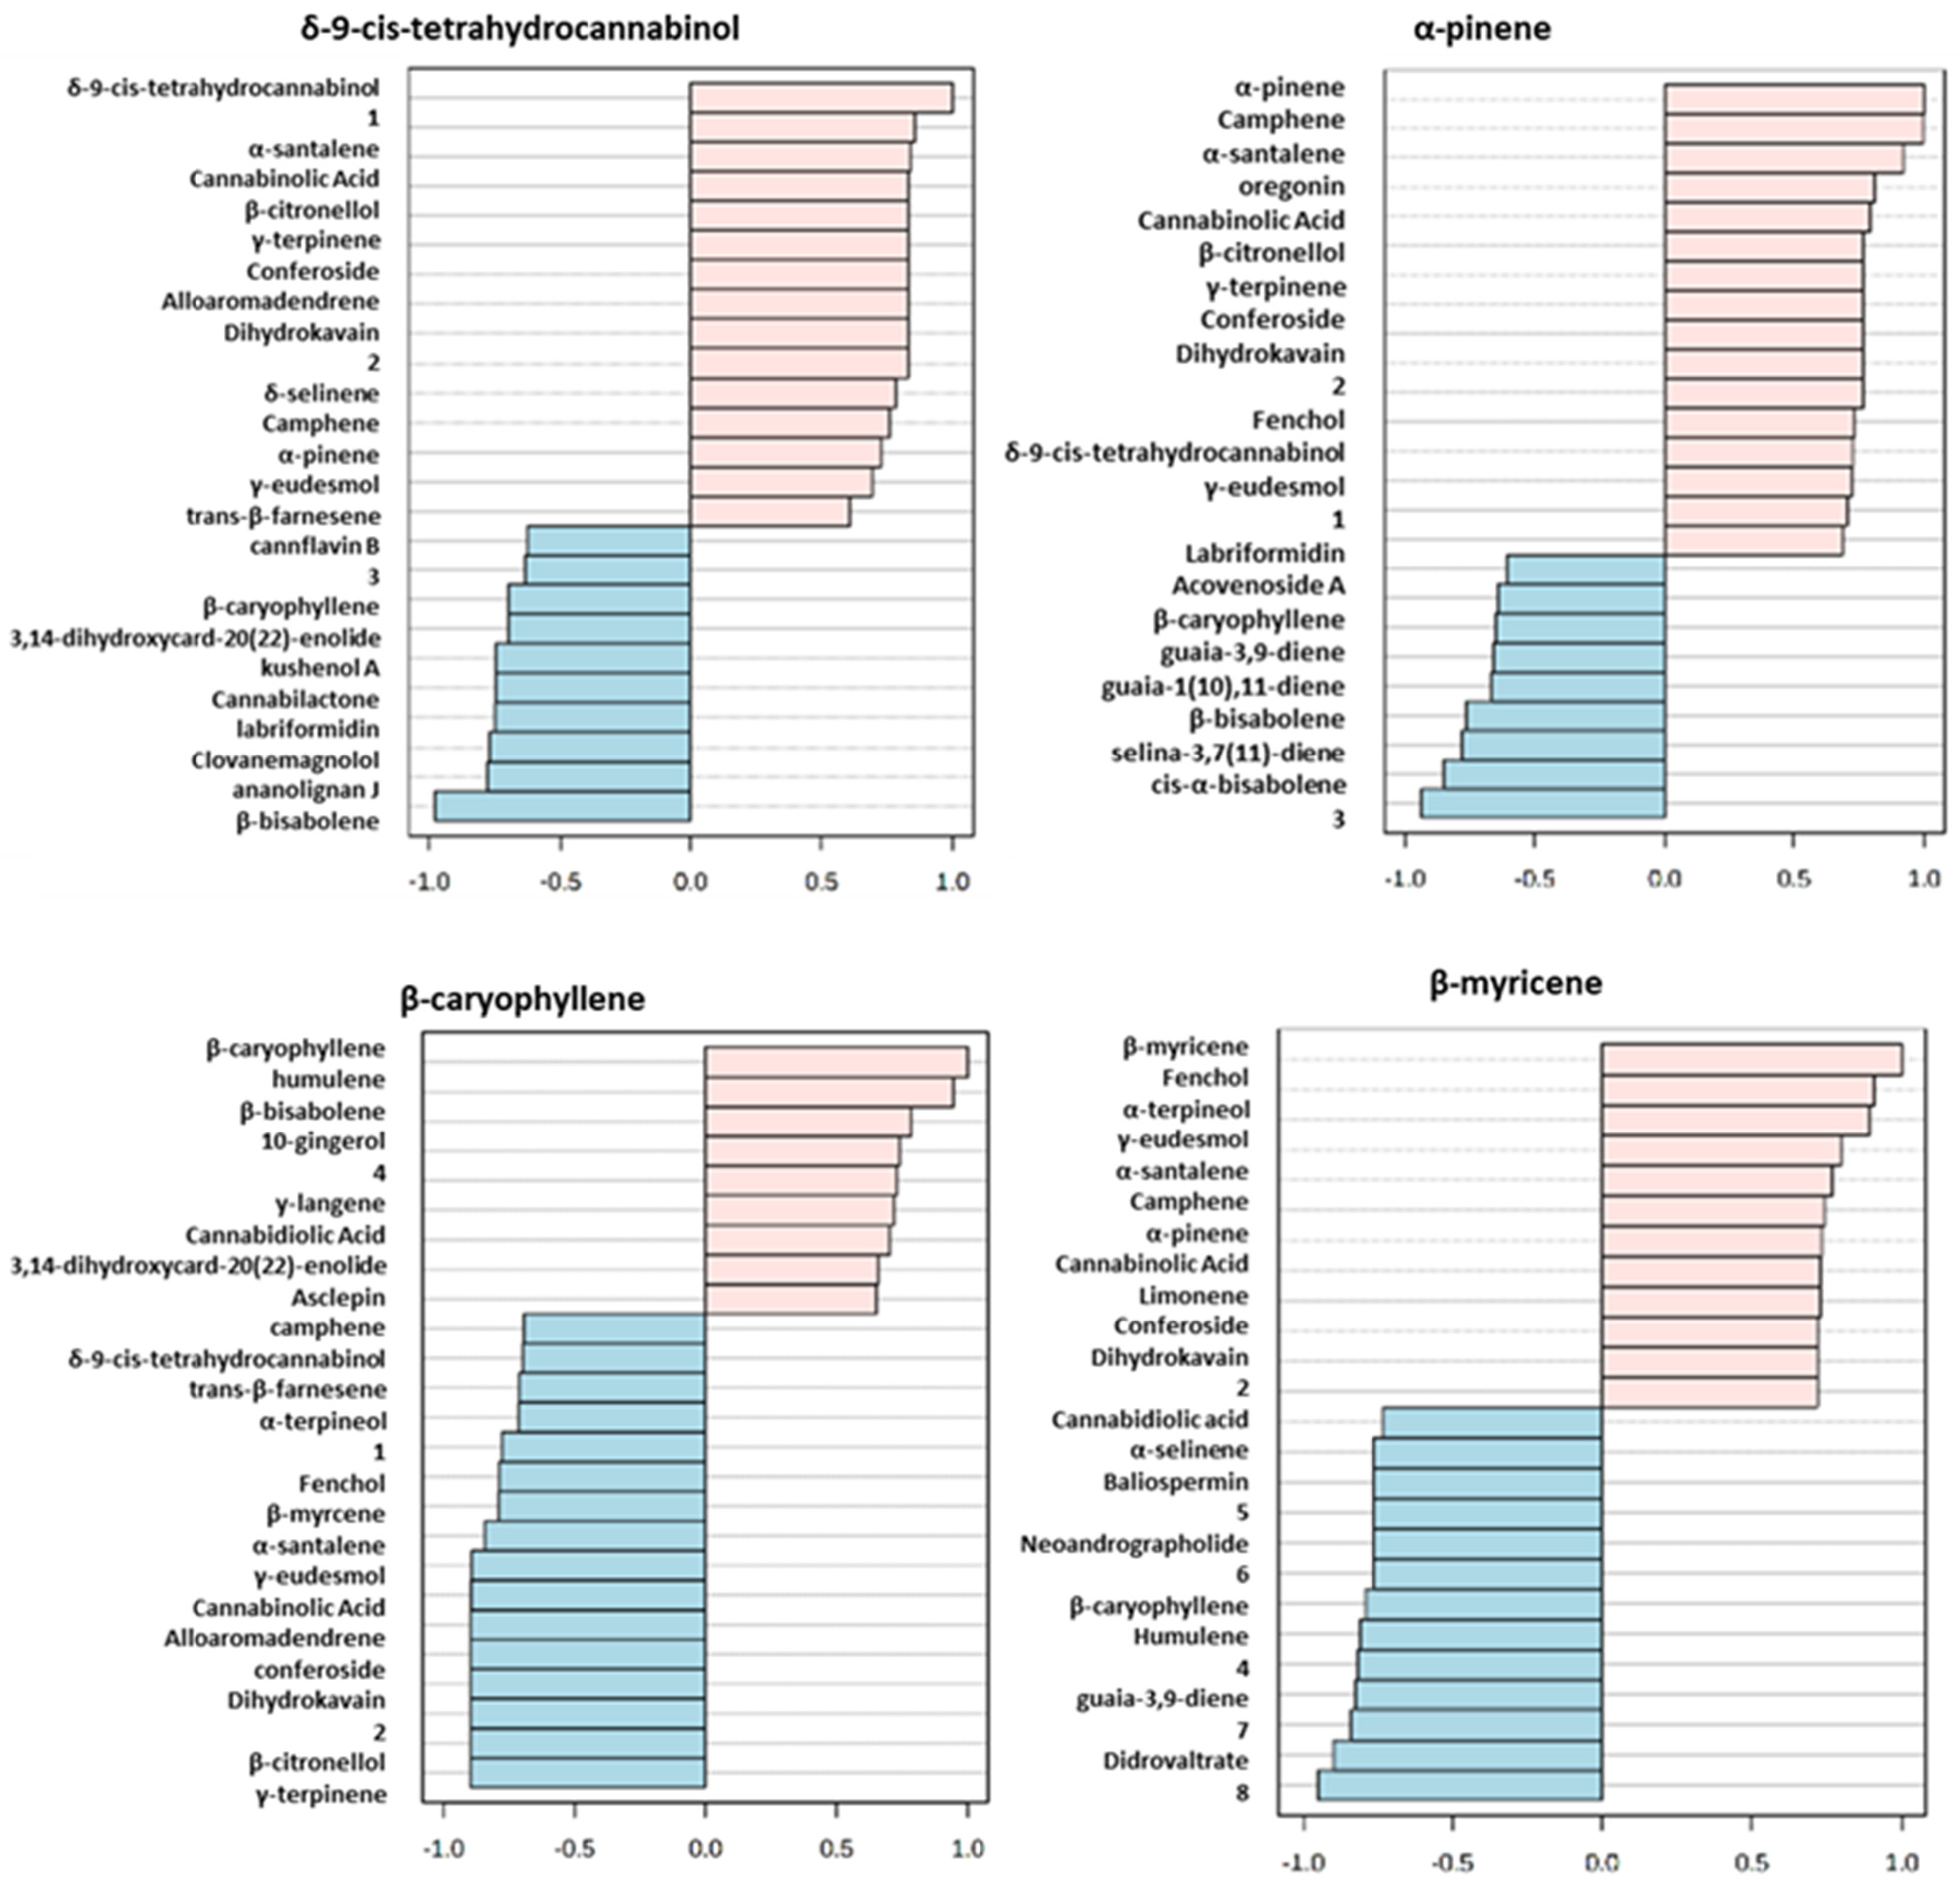
3.3. Multivariate Metabolomics Data Analysis

Metabolite profiling of inflorescences from five different cultivars of C. sativa revealed a large number of volatile and non-volatile compounds. These data were subjected to multivariate statistical analysis to understand the clustering and correlations between the investigated samples. In Figure 2A, an explorative overview of the chemical composition (mean percentage values) is reported to visualize the most representative volatile and non-volatile compounds in each cultivar. As far as is concerned the volatile components, the most relevant are β-myrcene, β-caryophyllene, humulene, selina-3,7(11)-diene and limonene, which are identified in all the cultivars. In Green Poison, 17 compounds were detected of which β-caryophyllene (34.5%), selina-3,7(11)-diene (17.1%) and humulene (11.4%) were the top three. β-Caryophyllene also reached the highest percentage value in Banana Hybrid (28.9%) followed by β-myrcene (25.0%) and α-pinene (13.7%) for a total of 18 identified components. As noticeable in Figure 2A, α-pinene was also detected in Gorilla CBD where a total amount of 19 compounds were identified including β-myrcene which reached 40.8% of the total amount. Similarly, β-myrcene with a percentage value of 29.6%, followed by β-caryophyllene (27.6%) and selina-3,7(11)-diene (12.2%) were found in V1 CBD. Candy BUD was characterized by 20 compounds and the most meaningful were β-caryophyllene (21.6%), selina-3,7(11)-diene (16.7%) and β-myrcene (15.9%). Regarding non-volatile compounds, the largest number of molecules was detected in both Banana Hybrid (27) and Green Poison (30). Otherwise, 26 metabolites in V1 CBD, 24 in Candy BUD and 19 in Gorilla CBD were revealed. Of all of them, δ-9-cis-tetrahydrocannabinol was the most significant with the only exception for V1 CBD in which the major component, ananolignan J, reached 14.1%.
The complete list of volatile and non-volatile metabolites, normalized by sum, was also reported in a heatmap (Figure 2B). Heatmap analysis of the five different cultivars revealed that the metabolites δ-9-cis-tetrahydrocannabinol, β-caryophyllene and β-myrcene showed the most significant percentage. Compounds under the detection threshold are represented in grey. They ranged from 38% of the total chemical compounds in Banana Hybrid to 46% in Gorilla CBD. In particular, the latter sample showed the lowest variety of detected compounds but the highest value percentages (in red) of δ-9-cis-tetrahydrocannabinol and β-myrcene.
After a preliminary sample’s examination, a multivariate analysis investigation of C. sativa obtained data, was performed. Principal component analysis (PCA) and partial least squares discriminant analysis (PLS-DA) segregated the samples on the basis of metabolite levels in each sample. Specifically, PCA unsupervised algorithm is an orthogonal linear transformation of possibly correlated variables into a smaller number of uncorrelated variables called principal components (PCs). This kind of application reveals group structure when within-group variation is sufficiently less than between-group variation. The PCA allows to determine the contribution of the original variables to the PC model. In this case, the performed PCA was based on the first two principal PCs scores: PC1 explained the 48.2%, and PC2 explained the 22.3%. The total variance amount was 70.5%. The PCA Score Plot (Figure 3A) showed a PC1 separation of Gorilla CBD in comparison with the other varieties. This was also confirmed by Hierarchical clustering (HCA). HCA was used as a complimentary data reduction and pattern recognition method for finding the underlying structure of objects through a repetitive process that associates (agglomerative methods) or dissociates (divisive methods) object by object until all are equally and completely processed [23,24]. Automated HCA was performed on the data and the resulting dendrogram was calculated using Euclidean distance method. The HCA dendrogram (Figure 3C) showed descriptively similar results to those ones of PCA; in particular, Candy BUD and Green Poison followed by Banana Hybrid and V1 CBD were the most similar as the height of the link that joins them together was the smallest. The other cluster was represented by Gorilla CBD.
The dendrogram showed that the metabolic composition of C. sativa inflorescences of Gorilla CBD resulted to have the most characteristic and dissimilar profile in comparison to all the other samples (confirming PCA results).
Additionally, supervised forms of discriminant analysis such as PLS-DA [25], that rely on the class membership of each observation, were also commonly applied in metabolic fingerprinting experiments [25,26]. To identify the most important metabolites allowing discrimination between samples, next to PCA, we performed a supervised PLS-DA based on the variable importance in projection values (VIP). PLS-DA was conducted using the top 50 features. Thus, a metabolite with a VIP >1.5 is regarded as significantly discriminant. The findings suggested that the C. sativa cultivars were characterized by a different volatile and non-volatile metabolic composition. To find out the metabolites responsible for such variation, a Biplot (Figure 3B) was generated from PCA model and VIP scores (Figure 3D) were found from PLS-DA model. In Biplot, it is observable that Gorilla CBD was mainly characterized by β-myrcene and α-pinene in the volatile fraction and by δ-9-cis-tetrahydrocannabinol in the non-volatile profile. 1,2-Benzenediol, 5-(3-(2,4-dihydroxyphenyl)propyl)-3,4-bis(3-methyl-2-butenyl)- (or kazinol F) contributed to the explanation of variability of Candy BUD and Green Poison which are additionally characterized by the presence of selina-3,7(11)-diene and guaia-3,9-diene. Instead, β-caryophyllene mainly described Green Poison, Banana Hybrid and V1 CBD while it was at the opposite side of Gorilla CBD.
VIP-plot (Figure 3D) analyzed ten metabolites with VIP score between 1.5 and 3.5 and carried metabolites such as δ-9-cis-tetrahydrocannabinol characterized by high levels (in red and orange) in Gorilla CBD and Green Poison with an opposite trend of clovanemagnolol which instead particularly high in V1 CBD and Banana Hybrid. Cannabigerolic acid (CBGA), precursor of cannabinoids, was another non-volatile compound mainly found in Banana Hybrid and Candy BUD inversely to the 5-hydroxy-7-[4-hydroxy-2-methoxy-5-(3-methyl-2-butenyl)phenyl]-2,2-dimethyl-7,8-dihydro-2H,6H-pyrano[3,2-g]chromen-6-one (or 2′-O-methylcajanone) dominant in Gorilla CBD and in V1 CBD. Among the top 10 most characteristic metabolites identified by PLS-DA (Figure 3D), two volatile compounds such as α-pinene and selina-3,7(11)-diene showed an opposite trend.
Further, Pearson’s correlation analysis was performed among various metabolites of C. sativa inflorescences. In Figure 4, it is shown a correlation matrix, a table representing correlation coefficients between variables. In this case, it is based on Pearson Correlation Coefficient which measures the linear correlation between two datasets defined as the ratio between the covariance of two variables and the product of their standard deviations. The results range from −1 (indicating a strong inverse correlation) to 1 (indicating a strong direct correlation). The dendrogram next to the correlation matrix clustered compounds is sharing a similar correlation trend; for instance, the cluster composed of y-langene, β-caryophyllene and humulene or the other group including alloaromadendrene, α-santalene, α-pinene, camphene and β-myrcene. Regarding non-volatile compounds, it is noticeable the subset formed by clovanemagnolol, cannabilactone and ananolignan J.
Specifically, in Figure 5 is described the analysis of the top 25 correlated compounds based on Pearson Correlation Coefficient for δ-9-cis-tetrahydrocannabinol, α-pinene, β-caryophyllene, β-myrcene which are some of the metabolites emerging from Biplot and VIP analysis. δ-9-cis-Tetrahydrocannabinol, particularly high in Gorilla CBD, resulted inversely correlated with the non-volatile compounds cannflavin B, cannabilactone, clovanemagnolol, ananolignan J. Regarding volatile metabolites, a strong inverse correlation arose with β-bisabolene which instead was directly correlated with α-pinene. This latter metabolite and δ-9-cis-tetrahydrocannabinol shared a positive correlation with cannabinolic acid, showing high levels in Gorilla CBD. α-Pinene revealed an inverse correlation trend with many other compounds such as β-caryophyllene, guaia-3,9-diene, guaia-1(10),11-diene, β-bisabolene, selina-3,7(11)-diene and cis-α-bisabolene. However, it resulted directly correlated with β-myrcene; in fact, they are both largely represented in Gorilla CBD and Banana Hybrid. Conversely, β-caryophyllene, characterized by low levels in Gorilla CDB, shared a similar trend with humulene and β-bisabolene but it was inversely correlated with cannabinolic acid and β-myrcene.

4. Discussion

In this work, inflorescences from five C. sativa cultivars were investigated by SPME-GC-MS and UPLC-MS techniques to determine and compare their content of volatile and non-volatile compounds. Many components characterizing in a different way the chemical profile of each analyzed cultivar, were identified. Among monoterpenes and sesquiterpenes, β-myrcene, β-caryophyllene, humulene and selina-3,7(11)-diene were the most representative while δ-9-cis-tetrahydrocannabinol, (-)- was the principal cannabinoid found.
Several chemical profiles of C. sativa have been previously described [27,28]. In fact, quantitative and qualitative composition of cannabis can vary in relation to different factors such as the place of growth, the intrinsic characteristics of the soil, the climatic conditions, the method used for harvesting, conservation, inflorescence position along the stem [29,30] but also the extraction process and the connected experimental conditions [31]. Lately, it has also been reported how the malting process affects the polyphenolic and protein content with repercussions on the nutritional characteristics of cannabis seeds [32]. In a recent work, the chemical composition of inflorescences belonging to 12 different cultivars was described [33]. The data showed a volatile profile similar to the one we reported but with an inverted trend; in fact, the monoterpene content was, contrary to results of our study, dominant over the sesquiterpene one. In detail, humulene and β-caryophyllene, which in our case reached important percentage values (up to 11.4% and 34.5%, respectively), were detected in lower relative amounts. Furthermore, selina-3,7(11)-diene that characterized all the cultivars we investigated, was missing. The cannabinoid content was also different. THC ranging from 5.0% to 51.9% in our samples, reached much lower relative percentages (from 0.03% to 0.29%). Moreover, in none of the 12 cultivars, the presence of CBNA, precursor of CBN, with important pharmacological properties and characterizing Banana Hybrid and Gorilla CBD, was detected. In general, the terpenoids, known as the main responsible for the aroma of plants, among the families of compounds found in C. sativa, occupy a large part of it [34]. These molecules are produced in glandular trichomes, which are abundant on the surface of the female inflorescence [35]. Within the terpenes class, β-myrcene, β-caryophyllene, limonene, α-pinene and linalool are the main compounds found in the different cultivars of C. sativa. Indeed, terpenoids as well as cannabinoids can be considered as markers for the recognition of a specific cultivar [36]. The beneficial potential of the identified compounds is known as deeply explored. In detail, anti-inflammatory, analgesic, antioxidant and anticonvulsant effects are reported for the terpene derivatives [37]. In particular, the inflorescences have been widely used in traditional oriental medicine to combat the pain, treat insomnia problems or to heal injured tissue [38]. In addition, cannabinoids have been reported as substances with a high therapeutic potential in balancing mental disorders and in the treatment of various diseases such as Parkinson’s and Alzheimer’s disease; moreover, they are also able to exert antiemetic and appetite stimulating activities [39]. Hence, considering all the biological effects of cannabinoids and that more than 60 of them have been detected in C. sativa [40], their identification and separation are increasingly of great interest and importance in the scientific community.
Among the flavonoids, a particular interest is addressed to cannflavin B and A, unique compounds of C. sativa whose biosynthetic pathway starting from luteolin has been studied by Rea et al. [41]. The main bioactive compounds of Cannabis genus are the cannabinoids which are divided into endocannabinoids, phytocannabinoids and synthetic cannabinoids and all of them derive from cannabigerolic acid that we have found in three of the investigated cultivars. Among all, phytocannabinoids are the most abundant and are synthesized in the glandular trichomes of female inflorescences.
In this study, we have used the unmodified inflorescences to provide a chemical characterization as realistic as possible, thus avoiding alterations and/or artifacts with the aim to describe their volatile profile and to identify the secondary metabolites with reduced adverse effects compared to cannabinoids. In fact, the different polarity of the solvents used for the extraction as well as the drying process can considerably modify the composition of the extract in terms of cannabinoids and terpene types [42]. Further, extraction processes such as hydrodistillation could dramatically influence the thermolabile or water-sensitive constituents. In particular, headspace sampling technique is the most suitable to describe the volatile profile of C. sativa samples [43]. Additionally, thanks to the above-described bioinformatics approach, it was possible to extrapolate important information about the investigated C. sativa inflorescences. We founded that Candy BUD and Green Poison were the most similar cultivars, followed by Banana Hybrid and V1 CBD. The other cluster was represented by Gorilla CBD characterized by the highest levels of δ-9-cis-tetrahydrocannabinol and β-myrcene. Conversely, β-caryophyllene, characterized by low percentage values in Gorilla CDB and high in Green Poison, was inversely correlated with β-myrcene. Moreover, α-pinene reached a high content in Gorilla CDB and Banana Hybrid and revealed an inverse correlation trend with many volatile compounds. The bioinformatic approach performed in this study highlighted detailed correlations between the most characteristic compounds of the inflorescences of five different cultivars of C. sativa.

5. Conclusions

After the significant changes in the legalization, production and use of C. sativa over the past 20 years, it has become the subject of numerous scientific studies, most of them centered on its chemical composition and medicinal properties. Various agricultural processing practices have been developed in order to produce cultivars of C. sativa with heterogeneous chemical content. Therefore, it is important to classify the different Cannabis cultivars based on their chemistry (i.e., chemovar). Further, considering the use of C. sativa as a legitimate medical substance, a more and more in-depth knowledge of its chemical composition becomes of relevant importance for the development of new products for pharmaceutical, medical and other uses. In our study, the data obtained highlighted a peculiar qualitative and quantitative chemical composition of the investigated inflorescences due to the significant predominance of sesquiterpenes and the high cannabinoid content. In conclusion, the findings of this exploratory study provide more information on C. sativa inflorescences from five different cultivars that may be useful for further investigations of metabolite applications in scientific research.

Author Contributions

Conceptualization, L.S. and S.G.; methodology, V.C., L.S. and S.G. investigation, V.C., L.S. and S.G.; resources, S.G.; writing—original draft preparation, V.C., L.S., S.V. and S.G.; writing—review and editing, V.C., L.S., S.V. and S.G.; supervision, L.S. and S.G.; funding acquisition, S.G. All authors have read and agreed to the published version of the manuscript.

Funding

This research received no external funding.

Institutional Review Board Statement

Not applicable.

Informed Consent Statement

Not applicable.

Data Availability Statement

All generated data are included in this article.

Acknowledgments

The authors are thankful to Appennino Farm, Bologna, Italy, for providing Cannabis sativa L. inflorescences.

Conflicts of Interest

The authors declare no conflict of interest.

References

  1. Small, E. Evolution and classification of Cannabis sativa (marijuana, hemp) in relation to human utilization. Bot. Rev. 2015, 81, 189–294. [Google Scholar] [CrossRef]
  2. CABI. Invasive Species Compendium. Cannabis Sativa (Hemp). Available online: https://www.cabi.org/isc/datasheet/14497 (accessed on 5 March 2022).
  3. Thomas, B.F.; ElSohly, M.A. The botany of Cannabis sativa L. In The Analytical Chemistry of Cannabis; Thomas, B.F., Ed.; Elsevier: Oxford, UK, 2016; pp. 1–26. [Google Scholar]
  4. Ren, G.; Zhang, X.; Li, Y.; Ridout, K.; Serrano-Serrano, M.L.; Yang, Y.; Liu, A.; Ravikanth, G.; Nawaz, M.A.; Mumtaz, A.S.; et al. Large-scale whole-genome resequencing unravels the domestication history of Cannabis sativa. Sci. Adv. 2021, 7, eabg2286. [Google Scholar] [CrossRef] [PubMed]
  5. Hurgobin, B.; Tamiru-Oli, M.; Welling, M.T.; Doblin, M.S.; Bacic, A.; Whelan, J.; Lewsey, M.G. Recent advances in Cannabis sativa genomics research. New Phytol. 2020, 230, 73–89. [Google Scholar] [CrossRef] [PubMed]
  6. Farinon, B.; Molinari, R.; Costantini, L.; Merendino, N. The seed of industrial hemp (Cannabis sativa L.): Nutritional quality and potential functionality for human health and nutrition. Nutrients 2020, 12, 1935. [Google Scholar] [CrossRef]
  7. Balant, M.; Gras, A.; Ruz, M.; Vallès, J.; Vitales, D.; Garnatje, T. Traditional uses of Cannabis: An analysis of the CANNUSE database. J. Ethnopharmacol. 2021, 279, 114362. [Google Scholar] [CrossRef] [PubMed]
  8. Pauli, C.S.; Conroy, M.; Vanden Heuvel, B.D.; Park, S.-H. Cannabidiol drugs clinical trial outcomes and adverse effects. Front. Pharmacol. 2020, 11, 63. [Google Scholar] [CrossRef] [PubMed]
  9. Johnson, R. Hemp as an Agricultural Commodity; CRS Report RL32725; Congressional Research Service: Washington, DC, USA, 2018; Available online: https://fas.org/sgp/crs/misc/RL32725.pdf (accessed on 11 March 2022).
  10. Lu, Y.; Young, S.; Linder, E.; Whipker, B.; Suchoff, D. Hyperspectral imaging with machine learning to differentiate cultivars, growth stages, flowers, and leaves of industrial hemp (Cannabis sativa L.). Front. Plant Sci. 2022, 12, 810113. [Google Scholar] [CrossRef] [PubMed]
  11. El Sohly, M.A.; Radwan, M.A.; Gul, W.; Chandra, S.; Galal, A. Phytochemistry of Cannabis sativa L. Prog. Chem. Org. Nat. Prod. 2017, 103, 1–36. [Google Scholar]
  12. Gonçalves, J.; Rosado, T.; Soares, S.; Simão, A.Y.; Caramelo, D.; Luís, A.; Fernández, N.; Barroso, M.; Gallardo, E.; Duarte, A.P. Cannabis and its secondary metabolites: Their use as therapeutic drugs, toxicological aspects, and analytical determination. Medicines 2019, 6, 31. [Google Scholar] [CrossRef] [Green Version]
  13. Jin, D.; Dai, K.; Xie, Z.; Chen, J. Secondary metabolites profiled in Cannabis inflorescences, leaves, stem barks, and roots for medicinal purposes. Sci. Rep. 2020, 10, 3309. [Google Scholar] [CrossRef] [PubMed]
  14. Lowe, H.; Steele, B.; Bryant, J.; Toyang, N.; Ngwa, W. Non-cannabinoid metabolites of Cannabis sativa L. with therapeutic potential. Plants 2021, 10, 400. [Google Scholar] [CrossRef] [PubMed]
  15. Radwan, M.M.; Chandra, S.; Gul, S.; ElSohly, M.A. Cannabinoids, phenolics, terpenes and alkaloids of Cannabis. Molecules 2021, 26, 2774. [Google Scholar] [CrossRef] [PubMed]
  16. Andre, C.M.; Hausman, J.-F.; Guerriero, G. Cannabis sativa: The plant of the thousand and one Molecules. Front. Plant Sci. 2016, 7, 19. [Google Scholar] [CrossRef] [PubMed] [Green Version]
  17. Solymosi, K.; Köfalvi, A. Cannabis: A treasure trove or pandora’s box? Mini-Rev. Med. Chem. 2017, 16, 1223–1291. [Google Scholar] [CrossRef] [PubMed]
  18. Kornpointner, C.; Martinez, A.S.; Marinovic, S.; Haselmair-Gosch, C.; Jamnik, P.; Schröder, K.; Löfke, C.; Halbwirth, H. Chemical composition and antioxidant potential of Cannabis sativa L. roots. Ind. Crops Prod. 2021, 165, 113422. [Google Scholar] [CrossRef]
  19. Appennino FARM. Available online: https://cannabislight.guru/ (accessed on 7 March 2022).
  20. Vitalini, S.; Iriti, M.; Vinciguerra, V.; Garzoli, S. A comparative study of the chemical composition by SPME-GC/MS and antiradical activity of less common citrus species. Molecules 2021, 26, 5378. [Google Scholar] [CrossRef]
  21. Iannone, M.; Ovidi, E.; Vitalini, S.; Laghezza Masci, V.; Marianelli, A.; Iriti, M.; Tiezzi, A.; Garzoli, S. From hops to craft beers: Production process, vocs profile characterization, total polyphenol and flavonoid content determination and antioxidant activity evaluation. Processes 2022, 10, 517. [Google Scholar] [CrossRef]
  22. Chong, J.; Wishart, D.S.; Xia, J. Using MetaboAnalyst 4.0 for comprehensive and integrative metabolomics data analysis. Curr. Protoc. Bioinform. 2019, 68, e86. [Google Scholar] [CrossRef] [PubMed]
  23. Downs, G.M.; Barnard, J.M. Clustering methods and their uses in computational chemistry. In Reviews in Computational Chemistry; Lipkowitz, K.B., Boyd, D.B., Eds.; Wiley: London, UK, 2002; pp. 1–40. [Google Scholar]
  24. Steinbach, M.; Ertoz, L.; Kumar, V. The challenges of clustering high dimensional data. In New Directions in Statistical Physics; Springer: Berlin/Heidelberg, Germany, 2004; pp. 273–309. [Google Scholar]
  25. Powell, W.; Morgante, M.; Andre, C.; Hanafey, M.; Vogel, J.; Tingey, S.; Rafalski, A. The comparison of RFLP, RAPD, AFLP and SSR (microsatellite) markers for 715 germplasm analysis. Mol. Breed. 1996, 2, 225–238. [Google Scholar] [CrossRef]
  26. Barker, M.; Rayens, W. Partial least squares for discrimination. J. Chemom. 2003, 17, 166–173. [Google Scholar] [CrossRef]
  27. Hood, L.V.S.; Barry, G.T. Headspace volatiles of marihuana and hashish: Gas chromatographic analysis of samples of different geographic origin. J. Chromatogr. 1978, 166, 499–506. [Google Scholar] [CrossRef]
  28. Rather, M.A.; Dar, B.A.; Sofi, S.N.; Hassan, T.; Ali, N.; Lone, A.H.; Shawl, A.S.; Shah, W.A.; Qurishi, M.A.; Prakash, P. Headspace solid phase microextraction (HS-SPME) gas chromatography mass spectrometric analysis of the volatile constituents of Cannabis sativa L. from Kashmir. J. Pharm. Res. 2011, 4, 2651–2653. [Google Scholar]
  29. Sheard, G.F. The chemical composition of the plant growing-point and its relation to the daily light exposure. Ann. Appl. Biol. 1940, 27, 305–310. [Google Scholar] [CrossRef]
  30. Namdar, D.; Mazuz, M.; Ion, A.; Kolta, H. Variation in the compositions of cannabinoid and terpenoids in Cannabis sativa derived from inflorescence position along the stem and extraction methods. Ind. Crops Prod. 2018, 113, 376–382. [Google Scholar] [CrossRef]
  31. Hilig, K.W. A chemotaxonomic analysis of terpenoid variation in Cannabis. Biochem. Syst. Ecol. 2004, 32, 875–891. [Google Scholar] [CrossRef]
  32. Farinon, B.; Costantini, L.; Molinari, R.; Di Matteo, G.; Garzoli, S.; Ferri, S.; Ceccantoni, B.; Mannina, L.; Merendino, N. Effect of malting on nutritional and antioxidant properties of the seeds of two industrial hemp (Cannabis sativa L.) cultivars. Food Chem. 2022, 370, 131348. [Google Scholar] [CrossRef]
  33. Palmier, S.; Fanti, F.; Oliva, E.; Viteritti, E.; Sergi, M.; Pepe, A.; Compagnone, D. Chemical characterization and evaluation of antioxidant activity from different cultivars of Cannabis sativa L. of Abruzzo’s region. Nat. Prod. Res. 2022, 15, 1–5. [Google Scholar] [CrossRef]
  34. Booth, J.K.; Bohlmann, J. Terpenes in Cannabis sativa—From plant genome to humans. Plant Sci. 2019, 284, 67–72. [Google Scholar] [CrossRef]
  35. Booth, J.K.; Page, J.E.; Bohlmann, J. Terpene synthases from Cannabis sativa L. PLoS ONE 2017, 12, e0173911. [Google Scholar] [CrossRef] [Green Version]
  36. Addo, P.W.; Brousseau, D.; Morello, V.; MacPherson, S.; Paris, M.; Lefsrud, M. Cannabis chemistry, post-harvest processing methods and secondary metabolite profiling: A review. Ind. Crop. Prod. 2021, 170, 113743. [Google Scholar] [CrossRef]
  37. Zhou, X.; Wang, F.; Zhou, R.; Song, X.; Xie, M. Apigenin: A current review on its beneficial biological activities. J. Food Biochem. 2017, 41, e12376. [Google Scholar] [CrossRef]
  38. Ryz, N.R.; Remillard, D.J.; Russo, E.B. Cannabis roots: A traditional therapy with future potential for treating inflammation and pain. Cannabis Cannabinoid Res. 2017, 2, 210–216. [Google Scholar] [CrossRef]
  39. Ben Amar, M. Cannabinoids in medicine: A review of their therapeutic potential. J. Ethnopharmacol. 2006, 105, 1–25. [Google Scholar] [CrossRef]
  40. Atakan, Z. Cannabis, a complex plant: Different compounds and different effects on individuals. Ther. Adv. Psychopharmacol. 2012, 2, 241–254. [Google Scholar] [CrossRef] [Green Version]
  41. Rea, K.A.; Casaretto, J.A.; Al-Abdul-Wahid, M.S.; Sukumaran, A.; McAlister, J.G.; Rothstein, S.J.; Akhtar, T.A. Biosynthesis of cannflavins A and B from Cannabis sativa L. Phytochemistry 2019, 164, 162–171. [Google Scholar] [CrossRef]
  42. Namdar, D.; Voet, H.; Ajjampura, V.; Nadarajan, S.; Mayzlish Gati, E.; Mazuz, M.; Shalev, N.; Koltai, H. Terpenoids and phytocannabinoids co-produced in Cannabis Sativa strains show specific interaction for cell cytotoxic activity. Molecules 2019, 24, 3031. [Google Scholar] [CrossRef] [Green Version]
  43. Marchini, M.; Charvoz, C.; Dujourdy, L.; Baldovini, N.; Filippi, J.J. Multidimensional analysis of cannabis volatile constituents: Identification of 5,5-dimethyl-1-vinylbicyclo[2.1.1]hexane as a volatile marker of hashish, the resin of Cannabis sativa L. J. Chromatogr. A 2014, 1370, 200–215. [Google Scholar] [CrossRef]
Figure 1. Inflorescences from five different Cannabis sativa L. cultivars.
Separations 09 00090 g001
Figure 2. (A). Bar plot of the chemical composition (percentage mean value) of C. sativa inflorescences for volatile and non-volatile compounds. (B). Heatmap of normalized by sum metabolites percentage in five cultivars of C. sativa L. Each cultivar is indicated in the column, every row indicates a compound. Red indicates high abundance, whereas compounds under the detection threshold are in gray.
Separations 09 00090 g002
Figure 3. (A). Principal component Analysis (PCA) Score Plot. Two dimensional 2D PCA scores plot demonstrates statistical clustering for C. sativa inflorescences cultivars. (B). Principal component Analysis (PCA) BiPlot. A biplot provides information on both metabolites and samples of a data matrix to be displayed graphically. Metabolites grouped at the origin of the graph do not contribute to samples variability. (C). Hierarchical clustering (HCA). It shows the dendrogram based on Euclidean distance. (D). PLS-DA and Variable importance in projection (VIP) plot. It displays the top 10 most important metabolite features identified by PLS-DA. Colored boxes on right indicate relative mean percentage of corresponding metabolite for C. sativa inflorescences. VIP is a weighted sum of squares of the PLS-DA loadings considering the amount of explained Y-variable in each dimension.
Separations 09 00090 g003
Figure 4. Correlation matrix. Correlation matrix based on Pearson Correlation coefficient among different volatile and non-volatile compounds of C. sativa inflorescences with dendrogram.
Separations 09 00090 g004
Figure 5. Analysis of the top 25 correlated compounds based on Pearson Correlation Coefficient for δ-9-cis-tetrahydrocannabinol, α-pinene, β-caryophyllene, β-myrcene. The numbers in the figure represent: 1: (1S,2S,4R)-1,3,3-trimethylbicyclo[2.2.1]hept-2-yl (6ar,10ar)-1-hydroxy-6,6,9-trimethyl-3-pentyl-6a,7,8,10a-tetrahydro-6H-benzo[c]chromene-2-carboxylate; 2: 4-(6-hydroxy-1,2,3,9a-tetrahydro-3ah-spiro[cyclopenta[b]chromene-9,1′-cyclopentan]-3a-yl)-1,3-benzenediol; 3:(2R,3R,4R,5R)-2-{(1R)-5-[(5R,7R)-1,6-dioxaspiro[4.5]dec-7-yl]-1-hydroxypentyl}-5-(hydroxymethyl)-3,4-pyrrolidinediol; 4: (5Z,8Z,11Z,14Z)-N-(2-furylmethyl)-5,8,11,14-icosatetraenamide; 5: 3,19-diacetoxy-5,14-dihydroxycard-20(22)-enolide; 6: 5,7,4′-trihydroxy-3,6-dimethoxy-3′,5′-diprenylflavone; 7: 1,5-anhydro-2,4,6-tris-O-(3,4,5-trihydroxybenzoyl)-D-glucitol; 8: methyl (1R,2R,3S,3ar,8bs)-2,3,3a,8b-tetrahydro-1,6,8b-trihydroxy-8-methoxy-3a-(4-methoxyphenyl)-3-phenyl-1H-cyclopenta[b]benzofuran-2-carboxylate.
Separations 09 00090 g005
Table 1. Chemical volatile composition (percentage mean value ± standard deviation) of Cannabis sativa L. inflorescences.
No.COMPONENT 1LRI 2LRI 3Green PoisonV1 CBDBanana HybridGorilla CBDCandy BUD
1α-pinene9419430.4 ± 0.010.7 ± 0.0213.7 ± 0.0519.7 ± 0.040.3 ± 0.02
2camphene945944--0.2 ± 0.020.3 ± 0.01-
3β-myrcene9909875.9 ± 0.0129.6 ± 0.0225.0 ± 0.0740.8 ± 0.1115.9 ± 0.02
4limonene103110233.5 ± 0.016.7 ± 0.023.1 ± 0.046.4 ± 0.023.6 ± 0.02
5γ-terpinene10681065---0.2 ± 0.02-
6fenchol110511000.1 ± 0.010.3 ± 0.010.2 ± 0.020.5 ± 0.020.1 ± 0.02
7α-terpineol118611830.1 ± 0.010.3 ± 0.020.2 ± 0.020.3 ± 0.020.2 ± 0.02
8β-citronellol12161212---0.2 ± 0.02-
9y-langene137413760.2 ± 0.00-0.2 ± 0.02-0.1 ± 0.02
10α-santalene14181420--0.1 ± 0.02-0.9 ± 0.02
11α-bergamotene14331430--0.1 ± 0.01-0.9 ± 0.02
12β-caryophyllene1447144034.5 ± 0.0827.6 ± 0.0428.9 ± 0.059.1 ± 0.0321.6 ± 0.04
13trans-β-farnesene14491441--2.4 ± 0.034.7 ± 0.035.3 ± 0.03
14humulene1475147311.4 ± 0.026.7 ± 0.039.5 ± 0.023.1 ± 0.026.0 ± 0.03
15γ-gurjunene148114790.4 ± 0.010.4 ± 0.02-0.6 ± 0.021.1 ± 0.02
16alloaromadendrene14841483---0.3 ± 0.02-
17β-eudesmene14881486--1.2 ± 0.02--
20α-selinene149014892.5 ± 0.01----
21α-farnesene14931494-1.0 ± 0.012.4 ± 0.020.8 ± 0.032.7 ± 0.02
22cis-α-bisabolene149814966.8 ± 0.025.9 ± 0.02-0.7 ± 0.032.9 ± 0.02
23β-bisabolene150415013.4 ± 0.014.9 ± 0.082.8 ± 0.02-2.5 ± 0.01
24δ-guaiene15101508--6.4 ± 0.03-1.8 ± 0.02
25δ-selinene151215090.6 ± 0.010.1 ± 0.020.3 ± 0.020.6 ± 0.020.2 ± 0.02
26δ-cadinene153315302.3 ± 0.030.8 ± 0.01---
28selina-3,7(11)-diene1537154017.1 ± 0.0612.2 ± 0.020.7 ± 0.028.2 ± 0.0516.7 ± 0.02
29guaia-3,9-diene156015569.3 ± 0.01---10.2 ± 0.02
30γ-eudesmol16331630-0.4 ± 0.01-1.6 ± 0.02-
31guaia-1(10),11-diene1760*1.5 ± 0.022.4 ± 0.02-1.5 ± 0.032.6 ± 0.02
SUM 100.0100.097.499.695.6
Terpenoids 10.237.642.868.422.0
Sesquiterpenoids 89.862.454.631.273.6
1 the components are reported according to their elution order on apolar column; 2 Linear Retention Indices measured on apolar column; 3 Linear Retention indices from literature; * LRI not available; - Not detected.
Table 2. Chemical non-volatile composition (percentage mean value ± standard deviation) of Cannabis sativa L. inflorescences.
No.COMPONENT 1Green PoisonV1 CBDBanana HybridGorilla CBDCandy BUD
1δ-9-cis-tetrahydrocannabinol, (-)- (THC)27.4 ± 3.045.0 ± 0.6725.4 ± 0.9251.9 ± 3.1026.7 ± 2.38
2monolinolenin1.6 ± 0.072.3 ± 0.038.3 ± 0.10-6.7 ± 0.59
34-[(2S,3R)-7-hydroxy-3-(hydroxymethyl)-5-(3-hydroxypropyl)-2,3-dihydro-1-benzofuran-2-yl]-2-methoxyphenyl 6-deoxy-α-L-mannopyranoside--7.1 ± 0.09--
4cannabigerolic acid (CBGA)0.5 ± 0.05-6.7 ± 0.08-5.3 ± 0.24
5pristimerin1.3 ± 0.062.4 ± 0.286.0 ± 0.080.3 ± 0.01-
6cannflavin B-4.5 ± 0.065.5 ± 0.070.2 ± 0.030.8 ± 0.03
7uscharidin--5.0 ± 0.06--
8wighteone--4.4 ± 0.050.7 ± 0.04-
9(5Z,8Z,11Z,14Z)-N-(2-furylmethyl)-5,8,11,14-icosatetraenamide8.5 ± 0.37-4.3 ± 0.05-1.8 ± 0.08
10cannabidiolic acid (CBDA)9.7 ± 0.430.7 ± 0.083.9 ± 0.050.4 ± 0.030.2 ± 0.03
11cryptocaryol Etrtr3.5 ± 0.04--
123,14-dihydroxycard-20(22)-enolide1.9 ± 0.083.1 ± 0.043.2 ± 0.040.2 ± 0.02-
13tetrahydrocannabivarin (THCV)--3.1 ± 0.04--
14didrovaltrate5.9 ± 0.26-2.7 ± 0.03-6.2 ± 0.00
15cannabidivarin (CBDV)-1.5 ± 0.022.5 ± 0.03-0.1 ± 0.00
16acuminatin-0.2 ± 0.031.5 ± 0.020.3 ± 0.020.6 ± 0.03
17clovanemagnolol-11.5 ± 0.141.0 ± 0.01-0.7 ± 0.03
18artocarpin--0.8 ± 0.01-0.7 ± 0.03
19oregonin--0.6 ± 0.010.3 ± 0.02-
2011-nor-9-carboxy-tetrahydrocannabinol -0.3 ± 0.000.6 ± 0.010.1 ± 0.010.1 ± 0.00
21cannabinolic acid (CBNA)--0.5 ± 0.019.0 ± 0.60-
2210-gingerol1.8 ± 0.081.3 ± 0.020.5 ± 0.01--
23methyl (1R,2R,3S,3ar,8bs)-2,3,3a,8b-tetrahydro-1,6,8b-trihydroxy-8-methoxy-3a-(4-methoxyphenyl)-3-phenyl-1H-cyclopenta[b]benzofuran-2-carboxylate1.4 ± 0.06-0.4 ± 0.01-0.8 ± 0.04
24labriformidin5.7 ± 0.259.6 ± 0.120.4 ± 0.00-0.3 ± 0.01
25dihydrokavaintr1.2 ± 0.020.3 ± 0.001.1 ± 0.071.0 ± 0.05
26citrusoside B0.2 ± 0.020.5 ± 0.010.3 ± 0.00-2.2 ± 0.10
27digitogenin0.1 ± 0.000.1 ± 0.000.2 ± 0.000.1 ± 0.00-
284-(6-hydroxy-1,2,3,9a-tetrahydro-3ah-spiro[cyclopenta[b]chromene-9,1′-cyclopentan]-3a-yl)-1,3-benzenedioltr--1.3 ± 0.09-
291,2-benzenediol, 5-(3-(2,4-dihydroxyphenyl)propyl)-3,4-bis(3-methyl-2-butenyl)-2.3 ± 0.106.5 ± 0.08--31.0 ± 1.4
305-hydroxy-7-[4-hydroxy-2-methoxy-5-(3-methyl-2-butenyl)phenyl]-2,2-dimethyl-7,8-dihydro-2H,6H-pyrano[3,2-g]chromen-6-one13.1 ± 0.5713.4 ± 0.17-14.8 ± 0.993.2 ± 0.016
31(2R,3R,4R,5R)-2-{(1R)-5-[(5R,7R)-1,6-dioxaspiro[4.5]dec-7-yl]-1-hydroxypentyl}-5-(hydroxymethyl)-3,4-pyrrolidinediol4.7 ± 0.214.2 ± 0.05-0.3 ± 0.013.2 ± 0.15
32neritaloside0.2 ± 0.010.4 ± 0.01--3.0 ± 0.14
33ananolignan J0.4 ± 0.0214.1 ± 0.17--2.8 ± 0.13
343,12,14-trihydroxycard-20(22)-enolide0.1 ± 0.000.3 ± 0.00--1.0 ± 0.05
35gitogenin---0.2 ± 0.010.8 ± 0.03
361,5-anhydro-2,4,6-tris-O-(3,4,5-trihydroxybenzoyl)-D-glucitol0.5 ± 0.02---0.1 ± 0.01
373,19-diacetoxy-5,14-dihydroxycard-20(22)-enolide1.1 ± 0.05----
385,7,4′-trihydroxy-3,6-dimethoxy-3′,5′-diprenylflavone1.6 ± 0.077----
39acovenoside A2.3 ± 0.102.0 ± 0.02---
40cannabilactone-3.8 ± 0.05---
41cihydrosamidin- -2.0 ± 0.13-
42kushenol A-2.9 ± 0.04---
43neoandrographolide2.4 ± 0.11----
44(1S,2S,4R)-1,3,3-trimethylbicyclo[2.2.1]hept-2-yl (6ar,10ar)-1-hydroxy-6,6,9-trimethyl-3-pentyl-6a,7,8,10a-tetrahydro-6H-benzo[c]chromene-2-carboxylate0.6 ± 0.03--2.1 ± 0.14-
45asclepin2.2 ± 0.101.1 ± 0.01---
46baliospermin1.6 ± 0.07----
47conferoside- -13.8 ± 0.92-
SUM99.192.998.799.199.1
1 the listed components were identified by UPLC/MS analyses. tr: traces (mean value < 0.1%); - Not detected.
Publisher’s Note: MDPI stays neutral with regard to jurisdictional claims in published maps and institutional affiliations.

