Article

Application of a Validated Method for the Identification and Quantification of Mycotoxins in Wines Using UPLC-MS/MS

by
Artemis P. Louppis
* and
Michalis S. Constantinou
Analytical Department, MC Analysis Center Ltd., Nicosia 2563, Cyprus
*
Author to whom correspondence should be addressed.
Separations 2022, 9(4), 102; https://doi.org/10.3390/separations9040102
Submission received: 5 April 2022 / Revised: 12 April 2022 / Accepted: 12 April 2022 / Published: 15 April 2022
(This article belongs to the Section Analysis of Food and Beverages)

Abstract

:
The aim of the present study was to develop a rapid, simple and reliable method for the identification and quantification of six mycotoxins in wine using liquid chromatography with electrospray ionization tandem mass spectrometry. The analytical method was fully validated, and calibration curves were made with correlation coefficients >0.9970. A short analysis time and acceptable extraction efficiency were achieved by a direct extraction method of analytes (ochratoxin A, aflatoxin B1, B2, G1, G2 and Zearalenone) with acetonitrile. LOD values were from 0.03 to 0.27 μg kg−1, and LOQ values were from 0.08 to 0.81 μg kg−1, with recoveries at various values from 77 to 108%. The expanded uncertainty was 5–21% expressed at a coverage level of k = 2, at a confidence level of approximately 95%. The performance criteria of the method were fully met according to European legislation (EC) 401/2006. The method was successfully applied to wine samples from Cyprus. The method was simple, low cost, quick, accurate, and sensitive.

1. Introduction

Mycotoxins are toxic compounds that are naturally produced by different types of fungi. The presence of mycotoxins in food and feed may cause adverse health effects in humans and animals, ranging from gastrointestinal and kidney disorders to immune deficiency and cancer. The exposure to mycotoxins can occur through the consumption of contaminated food or from animals fed with contaminated feed. The most common mycotoxins that pose a concern to human or animal health include aflatoxins, ochratoxin A (OTA), and Fusarium toxins such as deoxynivalenol. Environmental parameters, namely temperature and humidity, are important parameters for the growth of fungi in food and feed samples.
Mycotoxins are the main products of filamentous fungi (of the Aspergillus, Penicillium and Fusarium genera) found in food and feed [1,2]. OTA is a naturally occurring foodborne mycotoxin found in a wide variety of agricultural commodities worldwide, ranging from cereal grains and dried fruits to wine and coffee. OTA is the most studied mycotoxin in grape products, and can represent a concern for the industry. It is produced by several different fungi, including Aspergillus ochraceus, A. carbonarius, A. niger and Penicillium verrucosum. Aflatoxin B1 and B2 (AFB) are produced by Aspergillus flavus and A. parasiticus, while Aflatoxin G1 and G2 (AFG), produced by Aspergillus flavus and A. parasiticus. Zearalenone (ZEN), also known as RAL and F-2 mycotoxin, are potent estrogenic metabolites produced by some Fusarium and Gibberella species. The sources of mycotoxin contamination in wine may be different across wine production stages, especially in the vinification process of red wine. The maximum level of ochratoxin A in wine is 2 μg L−1, according to European regulations [3], and 0.12 μg kg−1 body weight is the tolerable weekly intake of OTA according to the EFSA [4].
Wine is defined by the Organisation Internationale de la Vigne et du Vin (OIV) (http://www.oiv.int; accessed on 10 July 2017) as being obtained from grape [5]. The alcoholic fermentation of grape and yeast provides wine [6,7,8,9]. It has health benefits due to its high amount of polyphenolic compounds (especially resveratrol, quercetin and flavonol), anti-inflammatory effects, and is associated with a lower risk of mortality from chronic conditions and cardiovascular diseases [10,11,12,13,14,15]. Additionally, red wine is promoted in the Mediterranean diet. Health organizations suggest the amount of 150 mL for women and 300 mL for men, daily [16,17]. Additionally, data from clinical studies have shown that polyphenols exhibit prebiotic properties and function as antimicrobials against pathogenic gut microflora [18]. Nevertheless, the mechanisms for the above effects have not been fully clarified [18,19].
The presence of minerals, antioxidants and water-soluble vitamins (especially vitamin complex B) in wine make it nutritionally attractive to consumers. Additionally, wine contain sugars (0.6–8.0 g/100 g), and a small amount of proteins (0.1–0.5 g/100 g). However, its energy content is high (300–360 kcal/100 g) [20].
Wine significantly contributes to the economies of many countries, such as France, Italy, Spain, the USA, Argentina, and South Africa, which are the primary wine producers globally [21]. During 2015–2017, domestic wine sales in Cyprus recorded an upward trend. In 2017, sales amounted to 9265 million lt worth EUR 25.75 million. In 2017, sales of domestically produced wine recorded an increase of 13.8% [22]. The most popular grape varieties grown in Cyprus are Black (red) and Xinisteri (white), the mixture of which produces the well-known Commandaria and Zivania wines, considered the national drinks of Cyprus. Additionally, the varieties Maratheftiko, Chardonnay, Sauvignon Blanc, Cabernet Sauvignon, Shiraz, etc., are also cultivated. A large number of wineries (103) operate in relation to the small size of the country, according to data from the Ministry of Agriculture. The cultivated area of wine vineyards amounts to 7677 hectares [23].
Analytical methodologies for the quantification of mycotoxins should be fast, selective, simple, accurate, and sensitive. Liquid chromatography (LC) methods with different detectors (e.g., MS, DAD and FLD) are the core of mycotoxins analysis [24]. Additionally, methods have been developed based on HPLC, according to the Association of Analytical Communities (AOAC). Gas chromatography (GC) is also employed for the determination of mycotoxins, but it is less widely used. HPLC-MS/MS technology has become the first choice for mycotoxin determination. Furthermore, some other different analytical methods have also been used to analyze mycotoxins with high sensitivity and accuracy, including HPLC-FLD, HPLC-DAD, and LC-PDA [25,26,27]. Instrumental methods, such as gas chromatography (GC) with flame ionization detection (GC-FID) [28] and gas chromatography with tandem mass spectrometry (GC-MS/MS), have been used for the screening of mycotoxins in food samples [29]. The immunoaffinity column (IAC) is a purification technique that relies on specific recognition from antibodies and complementary analytes. IAC, owing to its high selectivity and efficiency, is most frequently used for the determination of mycotoxins.
The recommended analytical method is fast and cost-effective, with no clean-up steps, and is a simple process for the determination of mycotoxins in wine. UPLC-MS/MS is a state-of-the-art analytical technique providing high resolution (the ability to distinguish two peaks of slightly different mass-to-charge ratios), reproducibility, accuracy, and the fast quantification of numerous compounds. Additionally, low detection and quantification limits have been achieved with this technique, and numerous compounds such as cannabinoids, antibiotics, antioxidants and pesticides can be identified with this technique [30,31,32,33,34,35]. In this work, a UPLC-MS/MS method for the identification and quantification of mycotoxins was developed (Ochratoxin A, aflatoxins B1, B1, G1 and G2 and zearalenone) and applied to Cypriot wines.

2. Materials and Methods

2.1. Chemicals and Reagents

Aflatoxins B1, B2, G1 and G2 (purity > 99) were purchased from Trilogy (Austin, TX, USA). Zearalenone (purity > 99.9%) was purchased from Notox (Anglet, France). Sodium chloride for analysis, magnesium sulfate anhydrous, solvents, acetonitrile (ACN), and water (H2O) (LC-MS grade) were purchased from Merck (Darmstadt, Germany), while formic acid 99% (HCOOH) for LC-MS was purchased from Carlo Erba (Val-de-Reuil, France). Acetonitrile is the solvent for the preparation of all stock standard solutions. The construction of calibration curves was achieved by the appropriate dilution of stock solutions. All standard solutions were stored in dark solid-walled glass bottles at −20 °C. After the appropriate dilution of stock solution (5 mg mL−1) with acetonitrile, working solutions were prepared.

2.2. Samples

Twenty-four samples of wine were collected from Cyprus. Different wine samples were collected from local market and details on its characteristics are given in Table 1.

2.3. Instrument Conditions

The Xevo TQ-XS ACQUITY I-Class LC System was used; a triple quadrupole mass spectrometer (Waters, USA) and MassLynx/TargetLynx Software were used for the chromatographic separation and processing of the data, respectively. The mobile phase, operated in gradient mode, and the samples were put into a thermostatic auto sampler. A column ACQUITY UPLC BEH C18 (2.1 × 100 mm 1.7 μm particle size) (Waters, Milford, MA, USA) was used and optimum separation was achieved with 0.1% formic acid in water for phase A, and 0.1% formic acid in acetonitrile for phase B. The optimized flow rate for the mobile phase was 0.50 mL min−1, and the injection volume was 5 μL. The mobile phase, with a gradual increase in the organic phase B from 90 to 30% within 5.75 min, followed by a decrease from 30 to 10% within 1.30 min, was followed by an increase from 10 to 90% within 0.5 min, and held for 1 min. The experimental range of the column temperature was varied from 30 to 50 °C to achieved good retention times and selectivity. The optimum column temperature was 30 °C. For the mass spectrometric method, a triple quadrupole MS equipped with an electrospray ionization (ESI) source was used. The ESI was operated with both negative and positive modes, resulting in multiple reaction monitoring (MRM). Two transitions of each compound were selected (the quantifier and the qualifier ions). The parameters of the ion source were: capillary voltage, 3.0 kV; cone voltage, 10.0 V; source temperature, 150 °C; desolvation gas temperature, 500 °C; desolvation gas flow, 1000 L h−1; cone gas flow, 150 L h−1 (both were nitrogen gas). Samples were kept in a temperature-controlled autosampler operating at 10 °C.

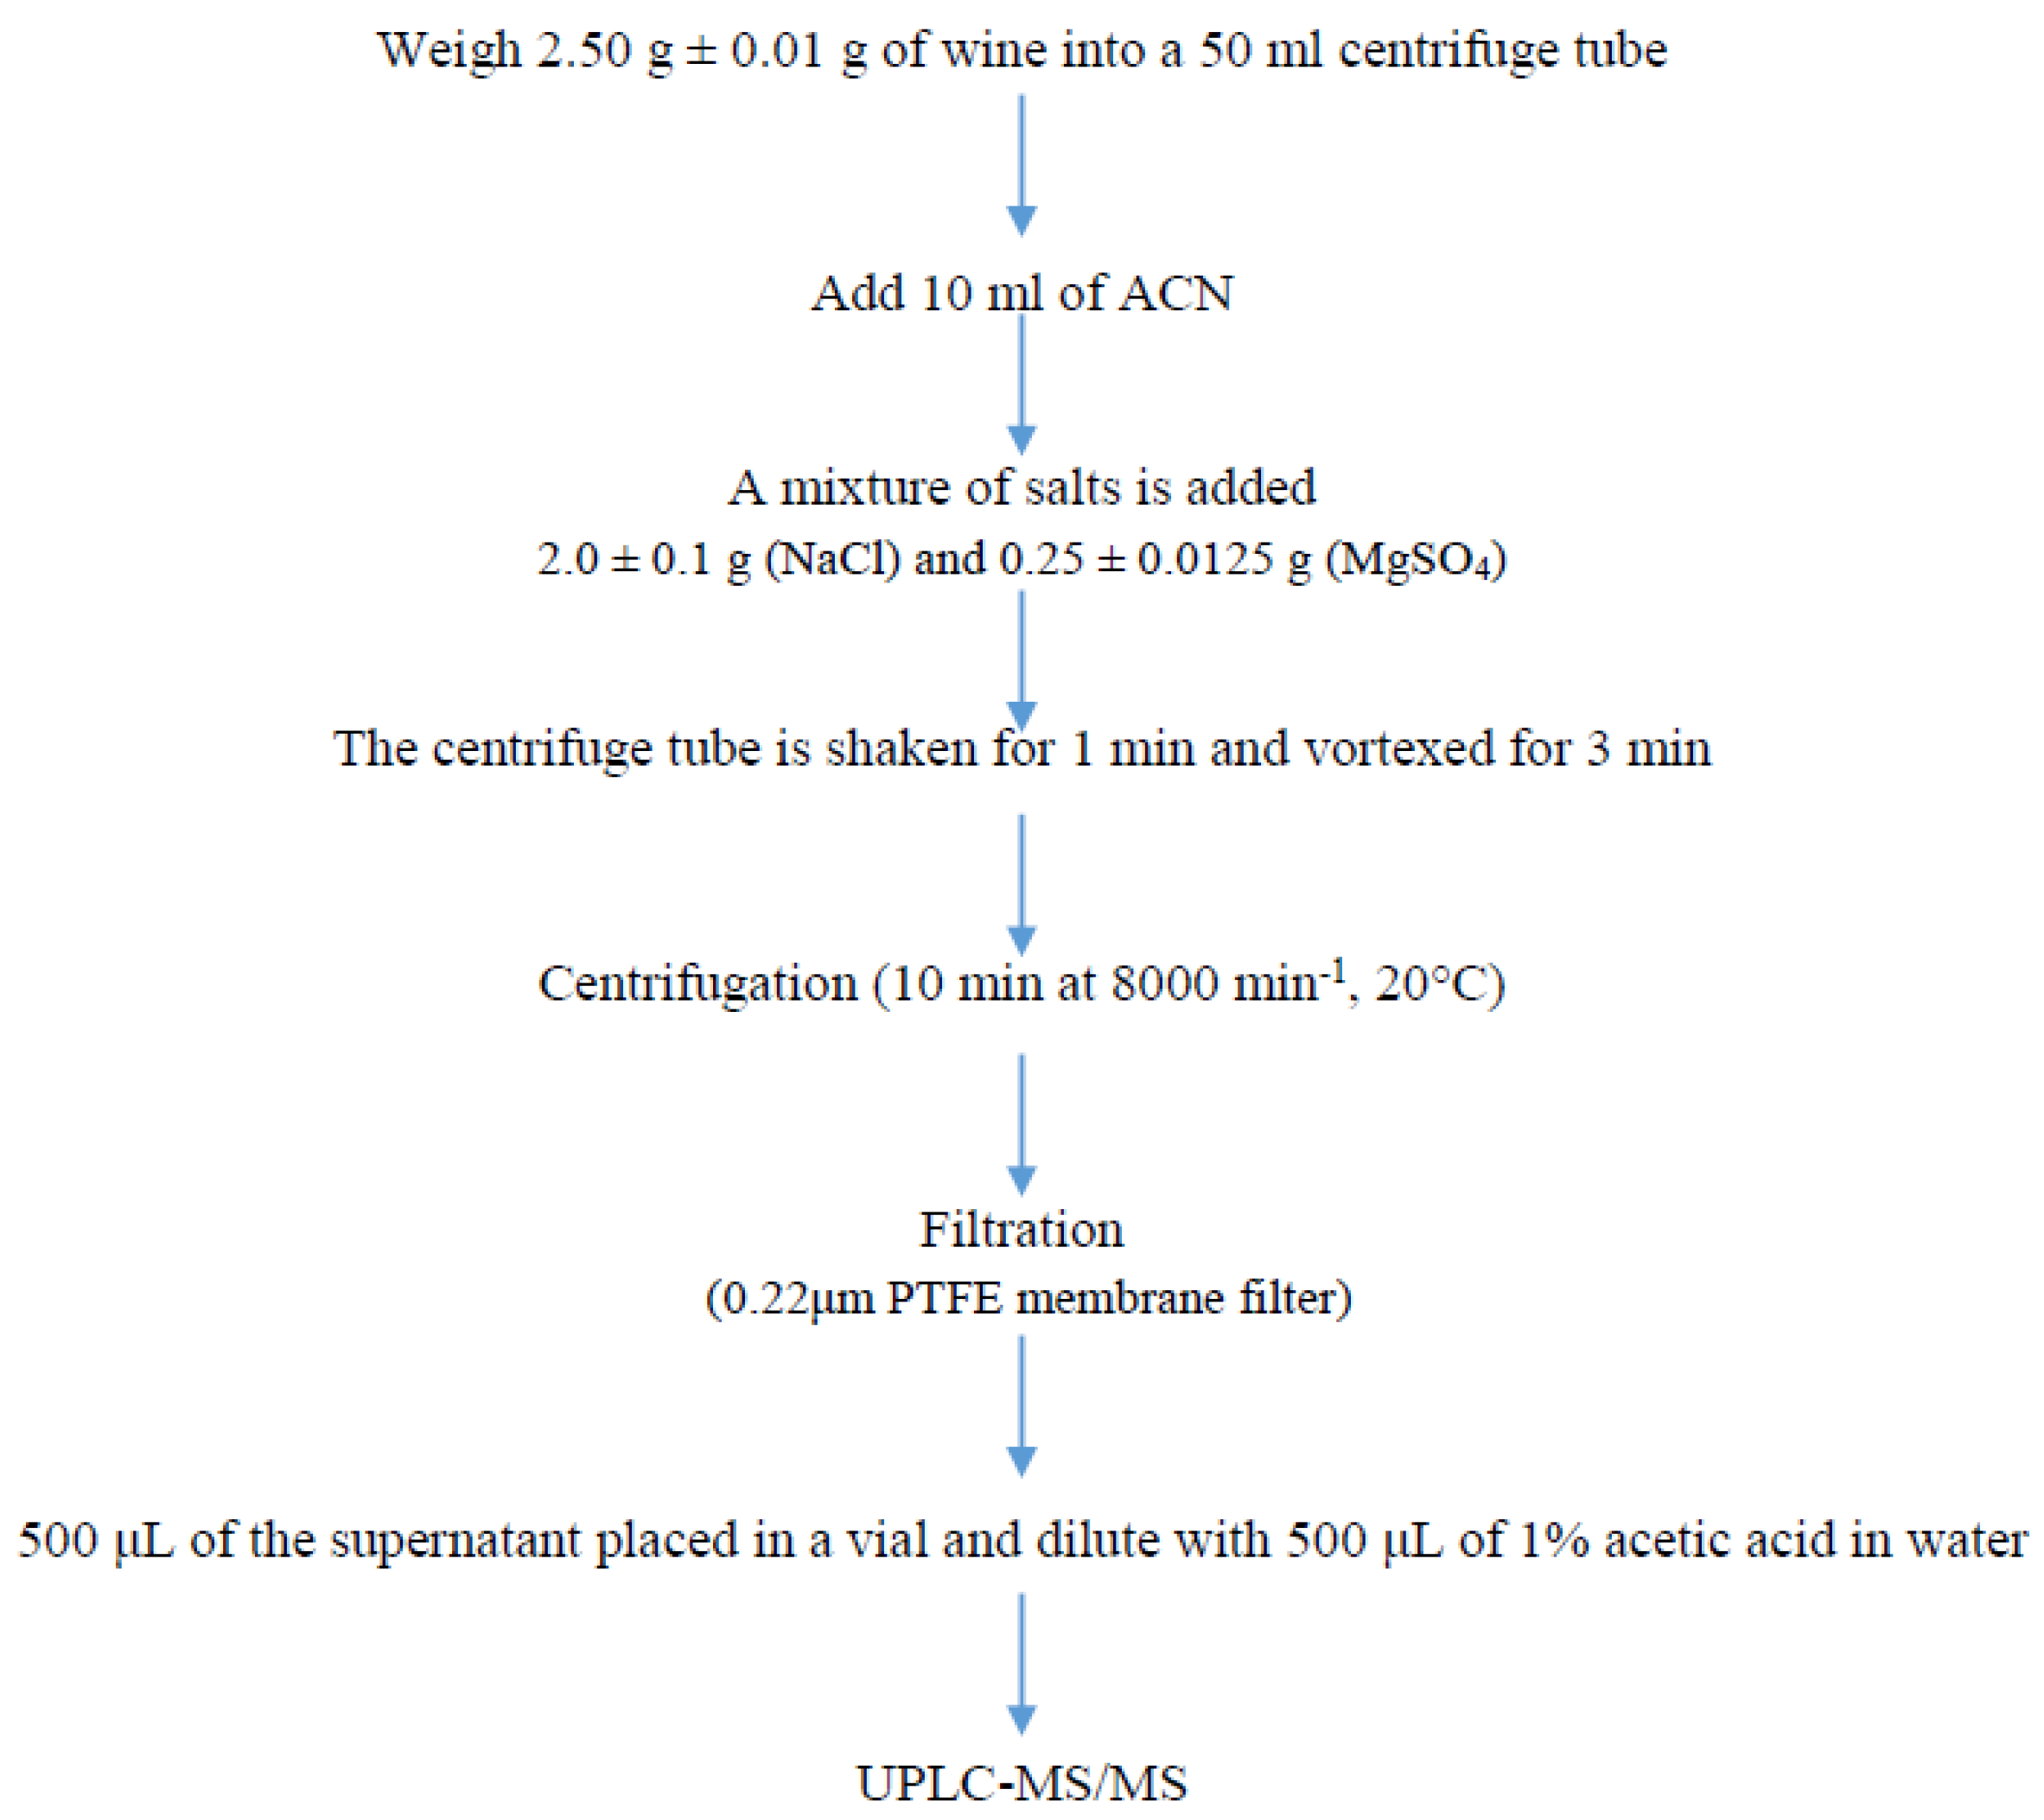
2.4. Sample Preparation

Wine (2.50 ± 0.01 g) was extracted with 10 mL of acetonitrile. The samples were shaken after the salts were added, and the samples were vortexed for 3 min. Then, the sample was centrifuged for 10 min at 8000 rpm, 20 °C. Afterwards, 1 mL of the supernatant layer was filtered (0.20 μm PTFE syringe filters, Agilent Technologies, Santa Clara, CA, USA) and the sample was diluted with 1% acetic acid in water. Finally, 5 μL of the sample was injected into the UPLC-MS/MS system (Figure 1).

2.5. Method Validation

Numerous parameters were evaluated for the method validation, such as linearity, selectivity, repeatability, intermediate precision, accuracy, limit of detection (LOD), and limit of quantification (LOQ). In addition, robustness and ruggedness were investigated and calculations for uncertainty were carried out.

2.5.1. Linearity

The individual stock solution (5 mg mL−1) was used to make two working solutions of 1 mg L−1 and 10 μg L−1 after the dilution with acetonitrile. The quantification was achieved by the matrix (blank wine extract) spiked with a specific amount of mycotoxin compound concentration. The measurements obtained from the matrix-matched calibration curve (5 data points) were compared to evaluate the quantification results.

2.5.2. LOD and LOQ

The limits of detection (LODs) and quantification (LOQs) were calculated using the standard deviation of response (peak area) (σ) and the slope (S) of the matrix-matched calibration curve for each mycotoxin, according to the equations: LOD = 3.3 (σ/S) and LOQ = 10 (σ/S). The calculation of the standard deviation of the response was calculated based on the standard deviation of the y-intercepts of the regression lines.

2.5.3. Method Recovery

A specific amount (low, medium and high) of a working solution was added in spiked samples. Afterwards, the weighed samples were allowed to stand for equilibration before the extraction. The recovery experiments were run at three different concentrations, each carried out in six samples (n = 6).

2.5.4. Uncertainty Measurement

The measurement uncertainty was carried out according to the [36]. The uncertainties were calculated according to the equation of [31].

3. Results and Discussion

3.1. UPLC-MS/MS Method Development

Table 2 shows the multiple product ions for the fragmentation reactions for the identification and quantification of mycotoxin compounds. Two MRM transitions were chosen (the quantifier and qualifier ions) from the in-house developments for each compound, according to the table. Solvents with different mobile phases and chromatographic parameters (such as column temperature, gradient time and volume, flow rate, and injection volume) were evaluated. These experiments were carried out in order to achieve a better shaped peak, adequate resolution, and high sensitivity for the compounds. For the mobile phases, organic phases (methanol and acetonitrile), and inorganic phase (water), three specific concentrations of formic acid (0.0, 0.1, 0.2%) were tested and evaluated. The optimum mobile phase contained acetonitrile and water both acidified with 0.1% formic acid. Additionally, the optimum flow rate from three different testing rates was 5 mL min−1 (0.1, 0.5, 1.0 mL min−1), which provided the best peak shape and retention time of the compounds. Finally, the optimum column temperature of 30 °C was chosen from three different column temperatures (30, 40, 50 °C) for the best retention time and selectivity. After the optimization, the run time of the method was 9 min. ESI+ was selected for all compounds. The basic chromatographic profiles are shown in Supplementary Figure S1A.

3.2. Sample Extraction Method

The experiments for sample extraction were completed for each extraction parameter specifically, with various solvents and combinations, sample weights (1, 2.5 and 5 g), sonication times (0, 2, 10 min), and extraction volumes. For the extraction procedure, acetonitrile, ethyl acetate, methanol, and water were used as solvents. The optimum solvent was acetonitrile based on the recovery experiments (best extraction efficiency of all mycotoxins). Moreover, the sample weight, extraction volume and sonication time for the optimum extraction of mycotoxins were also tested. The optimized sample weight and solvent volume was 2.5 g and 10 mL, respectively. The sonication time was varied between 0 and 10 min at a temperature below 15 °C. According to the experiments, the sonication time was not affected by the extraction of mycotoxins.

3.3. Method Validation

Analytical characteristics, namely linearity, selectivity, LOD, LOQ, accuracy, and precision, were determined using wine samples. The parameters of the validated methods were assessed by spiking blank wine samples with known concentrations of mycotoxins.

3.3.1. Linearity

The construction of the matrix-matched calibration curves was in the range of 0.1–2.0 μg L−1 for all mycotoxins. Correlation coefficient (R2) values were greater than 0.9970 (Table 3).

3.3.2. Selectivity, LOD and LOQ

Blank matrix samples were used for the selectivity of the method. The absence of any chromatographic peak at the retention time where the target mycotoxin was eluted indicates the absence of interference in the region of interest, which may give a false positive signal in the blank samples (Supplementary Figure S1B) [37]. The LODs and LOQs were dictated from the calibration curve in accordance with ISO 11843. The values of LOD and LOQ for the mycotoxins were found to be between 0.03 and 0.27 μg kg−1, and 0.08 and 0.81 μg kg−1, respectively (Table 4).

3.3.3. Accuracy, Precision, Matrix Effect

The precision of the method was calculated through intra-laboratory relative standard deviation (RSD). Quality control samples were analyzed for the determination of the accuracy of the method. The recovery values varied from 77 to 108%, whereas the RSDs ranged from 1.26 to 7.35%, complying with the requirements of the EU Commision Decision 2006/401/EC (Table 4, Table 5 and Table 6). It is well-known that the application of the UPLC-MS/MS technique displays a matrix effect [38,39]. So, the calibration curves were carried out using matrix extracts and the matrix effect was compensated. According to the literature, matrix-matched calibration has been used for the determination of pesticides in fruits and vegetables, antibiotics and aflatoxins, etc. [40,41,42,43].

3.3.4. Uncertainty Measurement

The uncertainty measurement is important in the analysis of chemical compounds. Thus, the validity of the results was found to have increased. The agreement of the expected results to the real results is the term of uncertainty, and all relevant possible factors affecting the measurement results were used. In this study, the expanded uncertainty was 5–21%, expressed at a coverage level of k = 2 and a confidence level of approximately 95% (Table 5).

3.4. Method Application to Wine Samples

The proposed method was applied to the analysis of mycotoxins in 24 wine samples from Cyprus. Different types of Cypriot wines (white, rose and red) from nine production years (2006, 2009, 2010, 2012, 2016–2020) were analyzed. Additionally, wines from local grape varieties, such as xinisteri and maratheftiko, as well as from two different containers (glass and PET) were analyzed. The alcohol strength of the wines varied from 11.5 to 13.5% (Table 1). Mycotoxins were not detected in the samples (<LOD). Additionally, no correlation could be drawn with any parameter such as type of wine, production year, type of container, or alcohol strength.

3.5. Comparison of Present Method to Other Methods Reported in the Literature

Nowadays, consumers select food and drink that are natural, nutritious (with high levels of antioxidants), and free of contaminants. This makes it important to develop new analytical methods to identify contaminants in food. The proposed method is characterized by sufficient accuracy, short run time, low cost, and simplicity. A state-of-the-art UPLC-MS/MS technique was used to determine numerous contaminants in wine samples; however, this extraction process is an important issue for many scientists. A good extraction process is when the maximum amount of a known compound from a wine sample is extracted with high recovery and low cost. The present UPLC-MS/MS method proposed the identification and quantification of six mycotoxins in 9 min. The proposed method is an innovative method. It comprises rapid sample preparation, with no clean-up steps, and the determination of the mycotoxins is carried out within 9 min.
Most studies in the literature dealt with the determination of OTA in wines using an immunoaffinity column for sample preparation, and HPLC with a fluorescence detector for the sample determination (Table 7). According to the method of [44], the limit of detection was 0.01 μg L−1, and the limit of quantification was 0.02 μg L−1. The recovery values obtained were 78 and 70% for white and red wines, respectively. [45] proposed an HPLC method for the determination of OTA in organic and conventional wines. The extraction of the compound was carried out using an immunoaffinity column. The limit of quantification was 0.5 μg L−1 and the gradient elution run was 18 min. OTA were found at concentrations between 0.01 and 0.24 μg L−1 in eight samples. [46] determined OTA with a 96% recovery rate, and the limits of detection and quantification of the method were 0.05 and 0.08 μg L−1, respectively. [47] determined OTA in samples from the Mediterranean area. OTA was detected in samples from Croatia, Greece, Spain, North Africa, Israel, Turkey, Italy and Croatia in low concentrations (below the EU limit), and it was not detected at all in samples from France. Recovery was found to be between 74 and 93%. A key difference between our proposed method and the above studies is the number of compounds analyzed. Only one compound was analyzed, and no other mycotoxins. Second, the extraction method and the analytical methodology were completely different. It is well known that the immunoaffinity technique is time consuming and increases the analysis cost. The quantification limits of our proposed method (0.81 μg kg−1) were similar to those of [45], but higher than the others, and the recovery rates (92%) were better than the others. Another advantage of our study was the shorter chromatographic run time of the compounds compared to the above studies.
The same sample preparation with a different analytical methodology was applied by [48]. According to this method, ochratoxin A and fumonisins were determined in wine and grape samples using LC-MS/MS. The extraction of the compounds was based on two different extraction methods. Acetonitrile and formic acid were used for the extraction of Ochratoxin A, and phosphate buffer was used for the determination of fumonisins. In both extraction procedures a clean-up step was applied. In the first, a reversed-phase column was used, while in latter an immunoaffinity column was used. The detection limits were between 0.1 and 10 μg L−1 for Ochratoxin A and fumonisin B1, B2, and B3. The compounds eluted run times of 8 min. Ochratoxin A were determined in 4 of 157 wine samples (concentrations from 0.1 to 0.4 μg L−1). The quantification limits of our proposed method (0.08–2.43 μg kg−1) were better than those of [48], while the run times were similar in both studies. A disadvantage of [48] method was the two different extraction procedures used (acetonitrile and immunoaffinity column). The authors determined fumonisins instead of other mycotoxins, as determined in our method.
Ref. [49] determined 11 mycotoxins in wine using UPLC-MS/MS. The above method was based on the extraction of mycotoxins with an acetonitrile and methanol mixture. The LOQs for mycotoxins were between 1 and 50 μg kg−1, except for aflatoxins B2 and G2. Aflatoxin B2 was not quantified due to the high RSD for all concentrations, and aflatoxin G2 was not detected at any concentration studied. The run time was 10 min. The detection limits of our proposed method (0.03–0.27 μg kg−1) were better than those of [49], although the number of substances used was larger than our method. Another advantage of our study was the smaller RSD values (1.37–7.35%) of compounds compared to the above study. Ref. [50] investigated the presence of Ochratoxin A in different winemaking steps using UPLC-MS/MS. Sample preparation was performed based on the original QuEChERS method and a dispersive solid-phase extraction (d-SPE) cleanup procedure. The time of the sample preparation was 30 min, and the run time was 5 min. The limits of detection and quantification were 1 and 2 μg kg−1, respectively, and the recovery was 79–105%. A major difference between our proposed method and that of Freire et al. (2020) was the determination of the number of mycotoxins. Based on the above method, only one compound was quantified, while aflatoxins B1, B2, G1, G2 and zearalenone were not. Furthermore, the limits of detection and quantification were better in our method (0.03–0.81 μg kg−1), while the extraction time required to complete the analysis in this method was greater (up to 50%) than our method (14 min).
There are no reference methods to determine mycotoxin levels in food required by the European community, but the EU has adopted legislation ((EC) No 401/2006) [51] on the specific requirements of mycotoxin yield criteria. These criteria concern recovery and RSD rates depending on the level of specific mycotoxin concentration. A major advantage of the proposed method is that these criteria are fully met (Table 6).
The simple sample preparation of the proposed analytical method provides acceptable accuracy and sensitivity for the target compounds. The main advantages of the presented method are: (i) the simplicity of the sample preparation; (ii) its good analytical characteristics; (iii) high extraction speed; (iv) the reagents are cheap, suitable for fast use (elution of mycotoxins takes only 9 min), and can efficiently determine the mycotoxins in wine; and (v) the performance of the method fully meets European legislation ((EC) 401/2006).

4. Conclusions

The proposed UPLC-MS/MS method was validated and developed for the quantification of six mycotoxins in wine. This method is simple, low cost, quick, accurate, and sensitive. Compounds were extracted using acetontile without the need for sample clean-up steps (rapid, simple and inexpensive extraction). The method is accurate, highly sensitive, and precise. To the best of our knowledge, the determination of specific mycotoxins in wine, particularly in Cypriot wines, using a fully validated analytical method was carried out for the first time in this study. Moreover, LOQ values were adequately low, and this study may be used for the determination of these substances in other food commodities.

Supplementary Materials

The following supporting information can be downloaded at: https://www.mdpi.com/article/10.3390/separations9040102/s1, Figure S1: (A) Ion Chromatograms for Aflatoxin B1, B2, G1, G2, Ochratoxin A and Zearalenone (B) Ion Chromatograms for blank sample.

Author Contributions

Conceptualization, A.P.L.; Data curation, A.P.L.; Formal analysis, A.P.L. and M.S.C.; Methodology, A.P.L. and M.S.C.; Project administration, A.P.L.; Resources, A.P.L. and M.S.C.; Supervision, A.P.L.; Validation, A.P.L. and M.S.C.; Writing—original draft, A.P.L. All authors have read and agreed to the published version of the manuscript.

Funding

This research received no external funding.

Institutional Review Board Statement

Not applicable.

Informed Consent Statement

Not applicable.

Data Availability Statement

Not applicable.

Conflicts of Interest

The authors declare no conflict of interest.

References

  1. Gruber-Dorninger, C.; Novak, B.; Nagl, V.; Berthiller, F. Emerging Mycotoxins: Beyond Traditionally Determined Food Contaminants. J. Agric. Food Chem. 2017, 65, 7052–7070. [Google Scholar] [CrossRef] [PubMed]
  2. Rai, A.; Das, M.; Tripathi, A. Occurrence and toxicity of a fusarium mycotoxin, zearalenone. Crit. Rev. Food Sci. Nutr. 2020, 60, 2710–2729. [Google Scholar] [CrossRef] [PubMed]
  3. European Commission. Commission Regulation (EC) No 1881/2006 of 19 December 2006 Setting Maximum Levels for Certain Contaminants in Foodstuffs (Text with EEA Relevance); European Commission: Brussels, Belgium, 2006. [Google Scholar]
  4. EFSA Panel on Contaminants in the Food Chain. Statement on recent scientific information 616 on the toxicity of Ochratoxin A. EFSA J. 2010, 8, 1626. [Google Scholar]
  5. OIV. International Code of Oenological Practices. OIV Code Sheet Issue 2015/01, Chapter I.1.3–1. 2016. Available online: http://www.oiv.int/en/technical-standards-and-documents/oenologicalpractices/international-code-of-oenological-practices (accessed on 15 August 2017).
  6. Anesi, A.; Stocchero, M.; Dal Santo, S.; Commisso, M.; Zenoni, S.; Ceoldo, S.; Tornielli, G.B.; Siebert, T.E.; Herderich, M.; Pezzotti, M.; et al. Towards a scientific interpretation of the terroir concept: Plasticity of the grape berry metabolome. BMC Plant Biol. 2015, 15, 191. [Google Scholar] [CrossRef] [PubMed] [Green Version]
  7. Sohaib, H.; Bryce, A.; Adrian, B. Wine and Cardiovascular Health. Circulation 2017, 136, 1434–1448. [Google Scholar]
  8. Jara-Palacios, M.J. Wine Lees as a Source of Antioxidant Compounds. Antioxidants 2019, 8, 45. [Google Scholar] [CrossRef] [Green Version]
  9. Joseph, S.V.; Edirisinghe, I.; Burton-Freeman, B.M. Fruit Polyphenols: A Review of Anti-inflammatory Effects in Humans. Crit. Rev. Food Sci. Nutr. 2016, 56, 419–444. [Google Scholar] [CrossRef]
  10. Artero, A.; Tarín, J.J.; Cano, A. The impact of moderate wine consumption on health. Maturitas 2015, 80, 3–13. [Google Scholar] [CrossRef]
  11. Bonaccio, M.; Di Castelnuovo, A.; Costanzo, S.; Persichillo, M.; De Curtis, A.; Donati, M.B.; de Gaetano, G.; Iacoviello, L.; MOLI-SANI Study Investigators. Adherence to the traditional Mediterranean diet and mortality in subjects with diabetes. Prospective results from the MOLI-SANI study. Eur. J. Prev. Cardiol. 2016, 23, 400–407. [Google Scholar] [CrossRef]
  12. Di Lorenzo, A.; Bloise, N.; Meneghini, S.; Sureda, A.; Tenore, G.C.; Visai, L.; Arciola, C.R.; Daglia, M. Effect of Winemaking on the Composition of Red Wine as a Source of Polyphenols for Anti-Infective Biomaterials. Materials 2016, 9, 316. [Google Scholar] [CrossRef] [Green Version]
  13. Gepner, Y.; Golan, R.; Harman-Boehm, I.; Henkin, Y.; Schwarzfuchs, D.; Shelef, I.; Durst, R.; Kovsan, J.; Bolotin, A.; Leitersdorf, E.; et al. Effects of Initiating Moderate Alcohol Intake on Cardiometabolic Risk in Adults with Type 2 Diabetes: A 2-Year Randomized, Controlled 494 Trial. Ann. Intern. Med. 2015, 163, 569–579. [Google Scholar] [CrossRef] [PubMed] [Green Version]
  14. Giacosa, A.; Barale, R.; Bavaresco, L.; Faliva, M.A.; Gerbi, V.; La Vecchia, C.; Negri, E.; Opizzi, A.; Perna, S.; Pezzotti, M.; et al. Mediterranean Way of Drinking and Longevity. Crit. Rev. Food Sci. Nutr. 2016, 56, 635–640. [Google Scholar] [CrossRef] [PubMed]
  15. Giovinazzo, G.; Grieco, F. Functional Properties of Grape and Wine Polyphenols. Plant Foods Hum. Nutr. 2015, 70, 454–462. [Google Scholar] [CrossRef] [PubMed]
  16. De Salvo, K.B.; Olson, R.; Casavale, K.O. Dietary Guidelines for Americans. JAMA 2016, 315, 457–458. [Google Scholar] [CrossRef] [PubMed] [Green Version]
  17. Lichtenstein, A.H.; Appel, L.J.; Brands, M.; Carnethon, M.; Daniels, S.; Franch, H.A.; Franklin, B.; Kris-Etherton, P.; Harris, W.S.; Howard, B.; et al. Diet and Lifestyle Recommendations Revision 2006. Circulation 2006, 114, 82–96. [Google Scholar] [CrossRef] [Green Version]
  18. Kumar Singh, A.; Cabral, C.; Kumar, R.; Ganguly, R.; Kumar Rana, H.; Gupta, A.; Rosaria Lauro, M.; Carbone, C.; Reis, F.; Pandey, A.K. Beneficial Effects of Dietary Polyphenols on Gut Microbiota and Strategies to Improve Delivery Efficiency. Nutrients 2019, 11, 2216. [Google Scholar] [CrossRef] [Green Version]
  19. Fraga, C.G.; Santos, J.A.; Moutinho-Pereira, J.; Carlos, C.; Silvestre, J.; Eiras-Dias, J.; Mota, T.; Malheiro, A.C. The effects of polyphenols and other bioactives on human health. Food Funct. 2019, 10, 514–528. [Google Scholar] [CrossRef] [Green Version]
  20. USDA. Nutrient Database. Available online: https://fdc.nal.usda.gov/ (accessed on 5 April 2022).
  21. OIV. World Vitiviniculture Situation. Wine Producers, 38th World Congress of Vine and Wine, Mainz. 2016. Available online: http://www.oiv.int/public/medias/5029/world-vitiviniculture-situation-2016.pdf (accessed on 15 August 2017).
  22. CYSTAT. Cyprus External Trade Statistics 2020 VOLUME IV Exports/Dispatches by Commodity and Country; CYSTAT: Lefkosia, Cyprus, 2020. [Google Scholar]
  23. CYSTAT. Cyprus External Trade Statistics 2019 Volume IV Exports/Dispatches by Commodity and Country; CYSTAT: Lefkosia, Cyprus, 2019. [Google Scholar]
  24. Khaneghah, A.M.; Fakhri, Y.; Abdi, L.; Coppa, C.F.S.C.; Franco, L.T.; de Oliveira, C.A.F. Mycotoxins in cereal-based products during 24 years (1983–2017): A global systematic review. Trends Food Sci. Technol. 2019, 91, 95–105. [Google Scholar] [CrossRef]
  25. Karakose, A.; Sanli, S.; Sanli, N.; Bulduk, I. Evaluation of patulin in commercial baby foods by solid phase extraction and liquid chromatography PDA detection. Czech J. Food Sci. 2015, 33, 52–57. [Google Scholar] [CrossRef] [Green Version]
  26. Sadok, I.; Szmagara, A.; Staniszewska, M.M. The validated and sensitive HPLC-DAD method for determination of patulin in strawberries. Food Chem. 2018, 245, 364–370. [Google Scholar] [CrossRef]
  27. Zhu, W.; Ren, C.; Nie, Y.; Xu, Y. Quantification of ochratoxin A in Chinese liquors by a new solid-phase extraction clean-up combined with HPLC-FLD method. Food Control 2016, 64, 37–44. [Google Scholar] [CrossRef]
  28. Eke, Z.; Torkos, K. N,N-dimethyl-trimethylsilyl-carbamate as a derivatizing agent in gas chromatography of trichothecene mycotoxins. Microchem. J. 2004, 77, 43–46. [Google Scholar] [CrossRef]
  29. Mahmoud, A.F.; Escrivá, L.; Rodríguez-Carrasco, Y.; Moltó, J.C.; Berrada, H. Determination of trichothecenes in chicken liver using gas chromatography coupled with triple-quadrupole mass spectrometry. LWT 2018, 93, 237–242. [Google Scholar] [CrossRef]
  30. Kiszkiel-Taudul, I. Determination of antihistaminic pharmaceuticals in surface water samples by SPE-LC-MS/MS method. Microchem. J. 2021, 162, 105874. [Google Scholar] [CrossRef]
  31. Louppis, A.; Michalis, S.C.; Michael, G.K. An ultra-performance liquid chromatography-tandem mass spectrometric method for the identification and quantification of selected natural antioxidants in prickly pear samples. J. Food Compos. Anal. 2021, 104, 104155. [Google Scholar] [CrossRef]
  32. Naik, R.H.; Pallavi, M.S.; Bheemanna, M.; PavanKumar, K.; Reddy, V.C.S.; Udaykumar, N.R.; Paramasivam, M.; Yadav, S. Simultaneous determination of 79 pesticides in pigeon pea grains using GC–MS/MS and LC–MS/MS. Food Chem. 2021, 347, 128986. [Google Scholar]
  33. Nicolaou, A.G.; Stavrou, I.J.; Louppis, A.P.; Constantinou, M.S.; Kapnissi-Christodoulou, C. Application of an ultra-performance liquid chromatography-tandem mass spectrometric method for the detection and quantification of cannabis in cerumen samples. J. Chromatogr. A 2021, 1642, 462035. [Google Scholar] [CrossRef]
  34. Orso, D.; Floriano, L.; Ribeiro, L.C.; Bandeira, N.M.G.; Prestes, O.D.; Zanella, R. Simultaneous determination of multiclass pesticides and antibiotics in honey samples based on ultra-high performance liquid chromatography-tandem mass spectrometry. Food Anal. Methods 2015, 9, 1638–1653. [Google Scholar] [CrossRef]
  35. Zhou, H.; Liu, P.; Su, X.-C.; Liao, Y.-H.; Lei, N.-S.; Liang, Y.-H.; Zhou, S.-H.; Lin, W.-S.; Chen, J.; Feng, Y.-Q. Development and validation of the one-step purification method coupled to LC-MS/MS for simultaneous determination of four aflatoxins in fermented tea. Food Chem. 2021, 354, 129497. [Google Scholar] [CrossRef]
  36. Ellison, S.L.R.; Williams, E. EURACHEM/CITAC Guide. Quantifying Uncertainty in Analytical Measurement, 3rd ed.; EURACHEM/CITAC: London, UK, 2011; pp. 1–52. [Google Scholar]
  37. Galarini, R.; Moretti, S.; Saluti, G. Quality assurance and validation: General considerations and trends. In Chromatographic Analysis of the Environment: Mass Spectrometry Based Approaches, 4th ed.; Nollet, L.M.L., Lambropoulou, D.A., Eds.; CRC Press: Boca Raton, FL, USA, 2017; pp. 325–369. [Google Scholar]
  38. Silvestro, L.; Tarcomnicu, I.; Savu, S.R. Matrix Effects in Mass Spectrometry Combined with Separation Methods—Comparison HPLC, GC and Discussion on Methods to Control these Effects. In Tandem Mass Spectrometry-Molecular Characterization, 1st ed.; IntechOpen: London, UK, 2013. [Google Scholar]
  39. Van de Steeny, J.C.; Lambert, E.W. Comparison of Matrix Effects in HPLC-MS/MS and UPLC-MS/MS Analysis of Nine Basic Pharmaceuticals in Surface Waters. J. Am. Soc. Mass Spectrom. 2008, 19, 713–718. [Google Scholar] [CrossRef] [Green Version]
  40. Beltran, E.; Ibáñez, M.; Sancho, J.V.; Hernández, F. Determination of mycotoxins in different food commodities by ultra-high-pressure liquid chromatography coupled to triple quadrupole mass spectrometry. Rapid Commun. Mass Spectrom. 2009, 23, 1801–1809. [Google Scholar] [CrossRef] [PubMed]
  41. Giacinti, G.; Raynaud, C.; Capblancq, S.; Simon, V. Matrix-Matching as an Improvement Strategy for the Detection of Pesticide Residues. J. Food Sci. 2016, 5, 1342–1350. [Google Scholar] [CrossRef] [PubMed] [Green Version]
  42. Lafontaine, C.; Shi, Y.; Espourteille, F.A. Multi-Class Antibiotic Screening of Honey Using Online Extraction with LC-MS/MS. Application Note 464; Thermo Fisher Scientific Inc.: Waltham, MA, USA, 2009. [Google Scholar]
  43. European Commission. Analytical Quality and Method Validation Procedures for Pesticide Residues Analysis in Food and Feed. SANTE/2017/11813. Implemented by 1 January 2020; European Commission: Brussels, Belgium, 2017. [Google Scholar]
  44. Torovic, L.; Lakatoša, I.; Majkićc, T.; Bearac, I. Risk to public health related to the presence of ochratoxin A in wines from Fruška Gora. LWT 2020, 129, 109537. [Google Scholar] [CrossRef]
  45. Čepo, D.; Pelajić, M.; Vrček, I.V.; Krivohlavek, A.; Žuntar, I.; Karoglan, M. Differences in the levels of pesticides, metals, sulphites and ochratoxin A between organically and conventionally produced wines. Food Chem. 2018, 246, 394–403. [Google Scholar] [CrossRef]
  46. Dachery, B.; Veras, F.F.; Magro, L.D.; Manfroi, V.; Welke, J.E. Exposure risk assessment to ochratoxin A through consumption of juice and wine considering the effect of steam extraction time and vinification stages. Food Chem. Toxicol. 2017, 109, 237–244. [Google Scholar] [CrossRef]
  47. Remiro, R.; Irigoyen, A.; González-Peñas, E.; Lizarraga, E.; de Cerain, A.L. Levels of ochratoxins in Mediterranean red wines. Food Control 2013, 32, 63–68. [Google Scholar] [CrossRef]
  48. Bolton, S.; Mitchell, T.; Brannen, P.M.; Glenn, A.E. Assessment of Mycotoxins in Vitis vinifera Wines of the Southeastern United States. Am. J. Enol. Vitic. 2017, 68, 336–343. [Google Scholar] [CrossRef]
  49. Dias, J.V.; Maria da Graça, P.N.; Pizzutti, I.R.; Reichert, B.; Jung, A.A.; Cardoso, C.D. Simultaneous determination of pesticides and mycotoxins in wine by direct injection and liquid chromatography-tandem mass spectrometry analysis. Food Chem. 2019, 293, 83–91. [Google Scholar] [CrossRef]
  50. Freire, L.; Braga, P.A.; Furtado, M.M.; Delafiori, J.; Dias-Audibert, F.L.; Pereira, G.E.; Reyes, F.G.; Catharino, R.R.; Sant’Ana, A.S. From grape to wine: Fate of ochratoxin A during red, rose, and white winemaking process and the presence of ochratoxin derivatives in the final products. Food Control 2020, 113, 107167. [Google Scholar] [CrossRef]
  51. European Commission. Commission Regulation (EC) No 401/2006 of 23 February 2006 Laying Down the Methods of Sampling and Analysis for the Official Control of the Levels of Mycotoxins in Foodstuffs; European Commission: Brussels, Belgium, 2006. [Google Scholar]
Figure 1. Experimental procedure for sample analysis.
Separations 09 00102 g001
Table 1. Data for each Cypriot wine.
Wine TypeProduction YearContainer TypeAlcohol Strength
Rose Dry2020G12.5
White Dry Xinisteri2020G13.5
White Dry Xinisteri2020G12.5
Lefkadha, Shivas (Dry Rose)2010G13.0
Xinisteri2020G13.0
Xinisteri2019G12.0
Red Dry2018G13.5
Maratheftiko, Lefkada2020G13.0
Rose dry2019G13.5
Red dry2019G13.0
Cabernet Sauvignon2009G13.0
White Dry---G12.0
Maratheftiko Red dry2017G13.0
Maratheftiko Red dry2019G13.0
Maratheftiko, Shiraz, dry2019G13.5
Dry Rose2016P11.5
Dry White2009P11.0
Dry Red2006P11.5
Medium sweet red2016P11.5
White medium dry2012P11.5
Medium red---P12.0
Dry red---P12.0
Red medium sweet2018P13.0
Red dry2012P12.5
G: glass, P: PET.
Table 2. Mass spectrometric conditions and MRM transitions.
AnalytePrecursor IonQuantifier IonCollision Energy (eV)Qualifier IonCollision Energy (eV)
Ochratoxin A404.10358.1023239.0513
Aflatoxin B1313.25241.0535285.1521
Aflatoxin B2315.10259.1030287.1025
Aflatoxin G1329.10283.1025243.1025
Aflatoxin G2331.10257.1020245.1030
Zearalenone319.20185.1023187.1520
Table 3. Calibration curves, linear regression, and retention time for all compounds.
AnalyteLinear Regression (R2)Retention Time (min)
Ochratoxin A0.99864.94
Aflatoxin B10.99843.44
Aflatoxin B20.99793.20
Aflatoxin G10.99853.21
Aflatoxin G20.99823.01
Zearalenone0.99864.92
Table 4. Limits of detection, limits of quantification and recovery at three different concentrations for all analytes in the wine samples (n = 6 samples).
Recovery (%)
AnalyteLOD (μg kg−1)LOQ (μg kg−1)Conc. A (1 μg kg−1)Conc. B (5 μg kg−1)Conc. C (12 μg kg−1)
Ochratoxin A0.270.8181103100
Aflatoxin B10.030.0886106107
Aflatoxin B20.120.3677104107
Aflatoxin G10.030.1082108103
Aflatoxin G20.030.1094108107
Zearalenone0.060.1991107103
Table 5. Method performance data at three different concentrations for all analytes.
Conc. AConc. BConc. C
AnalyteMean Concetration (μg kg−1)SD (μg kg−1)RSD (%)MU (%)Mean Concetration (μg kg−1)SD (μg kg−1)RSD (%)MU (%)Mean Concetration (μg kg−1)SD (μg kg−1)RSD (%)MU (%)
Ochratoxin A0.810.044.6265.150.071.37611.980.231.926
Aflatoxin B10.860.056.07155.340.163.07812.830.403.107
Aflatoxin B20.770.044.90215.370.162.931512.850.161.268
Aflatoxin G10.820.045.02105.420.122.16512.410.362.927
Aflatoxin G20.940.077.3575.380.132.47812.840.503.887
Zearalenone0.910.066.59155.360.152.82812.410.262.136
Table 6. Comparative table of performance characteristics of the proposed method with EU regulation 401/2006.
Performance CharacteristicEU Regulation 401/2006Proposed Method
Recovery (B1, B2, G1, G2) 1 ppb70–110%77–94%
Recovery (B1, B2, G1, G2) 5 ppb70–110%104–108%
Recovery (B1, B2, G1, G2) 12 ppb80–110%103–107%
RSD0.66 × x RSDR (<15%)1.26–7.35%
Recovery ΖΕΝ (<50 ppb)60–120%91–107%
Recovery OΤA (≥1 ppb)70–110%81–103%
RSD (OTA)≤20%1.37–4.62%
RSD (ZEN)≤40%2.13–6.59%
Table 7. Data from different analytical methodologies for the determination of mycotoxins.
MycotoxinsDetection MethodLimit of DetectionLimit of QuantificationExtraction MethodRecoveriesRun TimeReference
Aflatoxin B1, B2, G1, G2, Diacetoxyscirpenol, Deoxynivalenol, Fumonisin B1, B2, HT2-toxin, Ochratoxin A, T2-toxin, ZearalenoneUPLC-MS/MS-1 and 50 μg kg−1acetonitrile and methanol mixture70–120%10 min[49]
Ochatoxin AHPLC-FLD0.01 μg L−10.02 μg L−1Immunoafinity column78% (white wine) and 70% (red wine)-[44]
Ochratoxin AUPLC-MS/MS1 μg L−12 μg L−1dispersive solid-phase extraction (d-SPE) cleanup79–105%5 min[50]
Ochratoxin A and fumonisinsLC-MS/MS0.1–10 μg L−1-Immunoafinity column-8 min[48]
Ochatoxin AHPLC-FLD-0.5 μg L−1Immunoafinity column-18 min[45]
Ochatoxin AHPLC-FLD0.05 μg L−10.08 μg L−1Immunoafinity column96%-[46]
Ochatoxin AHPLC-FLD0.16 μg L−10.50 μg L−1Immunoafinity column74–93%-[47]
Ochratoxin A
Aflatoxin B1, B2, G1, G2, Zearalenone
UPLC-MS/MS0.03–0.27 μg kg−10.08–2.43 μg kg−1Acetonitrile77–108%9 minProposed method
Publisher’s Note: MDPI stays neutral with regard to jurisdictional claims in published maps and institutional affiliations.

