Article

Multivariate Optimization of Chromatographic Conditions for Rapid Simultaneous Quantification of Antidiarrheal Drugs in Formulation Using Surface Response Methodology

by
Mahesh Attimarad
1,*,
Katharigatta Narayanaswamy Venugopala
1,2,
Muhammad S. Chohan
3,
Pottathil Shinu
3,
Marysheela David
4,
Effren II Plaza Molina
5,
Anroop Balachandran Nair
1,
Nagaraja Sreeharsha
1,6,
Abdulrahman Ibrahim Altaysan
1 and
Abdulmalek Ahmed Balgoname
1
1
Department of Pharmaceutical Sciences, College of Clinical Pharmacy, King Faisal University, Al-Ahsa 31982, Saudi Arabia
2
Department of Biotechnology and Food Technology, Faculty of Applied Sciences, Durban University of Technology, Durban 4000, South Africa
3
Department of Biomedical Sciences, College of Clinical Pharmacy, King Faisal University, Al-Ahsa 31982, Saudi Arabia
4
Department of Nursing, College of Applied Medical Sciences, King Faisal University, Al-Ahsa 31982, Saudi Arabia
5
Department of Pharmacy Practice, College of Clinical Pharmacy, King Faisal University, Al-Ahsa 31982, Saudi Arabia
6
Department of Pharmaceutics, Vidya Siri College of Pharmacy, Off Sarjapura Road, Bangalore 560035, India
*
Author to whom correspondence should be addressed.
Separations 2022, 9(5), 103; https://doi.org/10.3390/separations9050103
Submission received: 4 April 2022 / Revised: 16 April 2022 / Accepted: 18 April 2022 / Published: 21 April 2022

Abstract

:
A combination of antibiotics and antiprotozoal and antisecretory medicines has been prescribed for the treatment of diarrhea. A rapid, reproducible liquid chromatographic procedure was established for the concurrent analysis of metronidazole (MET), ofloxacin (OFL), and racecadotril (RAC) in suspension. The Box–Behnken design, a full factorial multivariate optimization technique, was utilized to optimize chromatographic parameters with fewer runs. The separation of MET, OFL, and RAC was accomplished within 3.2 min, using a Zorbax C18 high-performance liquid chromatography column with a simple mobile phase comprising acetonitrile (55 vol.%): methanol (10 vol.%):20 mM phosphate buffer (35 vol.%, pH 6, regulated with ortho-phosphoric acid). The mobile phase was pumped in the isocratic mode at a rate of 1.4 mL/min at ambient temperature. Analytes were monitored by adjusting the wavelength at 295 nm for MET and OFL and 231 nm for RAC. Validation of the proposed HPLC method exhibited linearity in the concentration of 20–250 µg/mL, 10–150 µg/mL, and 5–80 µg/mL for MET, OFL, and RAC respectively, along with an excellent regression coefficient (r2 > 0.999). The accuracy and precision of the chromatographic procedure were also evidenced by the low percent relative error and relative standard deviation. A Pareto chart developed by the two-factor interaction (2FI) study confirmed that the method was robust, as the slight variation in a single factor had no significant influence on the assay outcomes. Lastly, the developed HPLC process was utilized for the concurrent quantification of MET, OFL, and RAC in liquid oral preparation. Furthermore, when the assay results were compared to the described techniques, it was discovered that there was no significant difference in the accuracy and precision of the results. Hence, the developed rapid HPLC method could be employed for the quality control study of a preparation comprising of MET, OFL, and RAC in industries and regulatory authority laboratories.

1. Introduction

In developing countries, acute diarrhea is one of the major health problems in children under the age of 5, and it is estimated that 2 million children die every year due to diarrhea [1]. A combination of antibiotics, antiemetics and antiprotozoal drugs is prescribed for the treatment of diarrhea due to gastroenteritis [2,3]. To reduce the loss of body fluid and electrolytes, anti-secretary drugs are added with antimicrobials. Recently, the introduced drug racecadotril has been prescribed over loperamide due to better safety and tolerability in children [4]. A combination of metronidazole (MET, Figure 1A), ofloxacin, (OFL, Figure 1B), and racecadotril (RAC, Figure 1C) has been introduced for the management of pediatric acute diarrhea. Ofloxacin is an orally active second-generation fluoroquinolone class of antibiotic that acts by inhibiting the replication of microorganisms and revamping themselves. It is a broad-spectrum antibiotic active against Gram-positive and Gram-negative bacteria including anaerobes [5,6]. Metronidazole is cytotoxic and has both antibacterial and antiprotozoal properties. It destroys microorganisms by entering inside the organism and binds with DNA, followed by causing breakage of the DNA helix and finally inhibiting protein synthesis [7]. Racecadotril inhibits the intestinal secretion of body fluids by different means compared to the existing antidiarrheal agents. RAC produces antisecretory activity by inhibiting enkephalinase, a peptidase enzyme present in the cell membrane, thereby reducing the breakdown of endogenous enkephalins and reducing the secretion of water and electrolytes in the small intestine [8,9].
Several analytical practices were described for the assay of OFL, MET, and RAC as an individual analyte and with other drugs in the formulation and biological samples. OFL alone and in combination with other drugs has been estimated using UV–spectrophotometric [10,11], spectrofluorometric [12], high-performance liquid chromatography (HPLC) [13,14,15,16], capillary electrophoresis [17,18], and HPLC-MS [19] methods. Determination of OFL along with MET has been reported in the literature using spectrophotometric methods [20] and HPLC methods [21,22]. MET alone was determined using the IR spectrophotometric method [23] and, along with 2–hydroxyl metronidazole, was determined by HPLC in plasma [24]. The binary combination of OFL and RAC analysis by HPLC [25,26,27] and high-performance thin-layer chromatography (HPTLC) [28,29] methods was reported in the literature. The quantification of RAC was reported using spectroscopic [30,31], spectrofluorometric [31], and HPLC methods [32]. Analysis of RAC metabolites in biological samples by LC–MS/MS was reported in the literature [33]. However, the assay procedure for the concurrent quantification of OFL, MET, and RAC in the formulation has not been reported. To monitor the quantity of analytes and quality of the formulation, and for a regular quality control study of a formulation consisting of OFL, MET, and RAC, a rapid and validated analytical method is required.
Multivariate optimization using surface response analysis demonstrates a better picture of the effect of different variable factors on the separation of analytes by chromatography [34,35]. Hence, the multivariate optimization approach has been extensively used for the optimization of analytical conditions in HPLC and CE methods [34,35,36,37,38]. Furthermore, it reduces the time and effort in developing an effective analytical method without losing the resolution between the analyte peaks [34]. In the current study, we developed a rapid, and effective liquid chromatographic method by optimizing chromatographic separation features by adopting the Box–Behnken design with response surface analysis and effectively applied it for the concurrent quantification of OFL, MET, and RAC in the pharmaceutical formulation. This is the first analytical method for the simultaneous determination of OFL, MET, and RAC in the formulation.

2. Materials and Methods

2.1. Materials

OFL, MET, and RAC standards were procured from Biokemix India Ltd. (Hyderabad, India). Pure potassium dihydrogen phosphate (monobasic), and potassium hydrogen phosphate (dibasic) used for the preparation of the mobile phase were procured from Sigma Aldrich (Chemie GmbH, 131 Steinheim, Germany). Analytically pure organic modifiers acetonitrile and methanol were acquired from Fisher Scientific (Loughborough, UK). Orthophosphoric acid used for the fine adjustment of pH was purchased from S.D. Fine Chem Ltd. (Mumbai, India). The pharmaceutical preparation assayed was suspension consisting of 50 mg/5 mL of OFL, 100 mg/5 mL of MET, and 15 mg/5 mL of RAC, purchased from the Indian market.

2.2. Instrumentation

The separation of OFL, MET, and RAC was performed on high-performance liquid chromatograph (1200 series, Agilent Technologies, Ratingen, Germany) employing the reversed-phase (RP) technique. The HPLC system was fitted with an autosampler, vacuum degasser, quaternary pump, and diode array detector connected to the computer system. The analyte elutes were managed using Chem–station software (Ver B.04.03.SP1 Agilent Technologies, Waldbronn, Germany).

2.3. Chromatographic Procedure

Agilent high-performance liquid chromatographic system with Zorbax C18 (150 mm × 4.6 mm i.d, 5 µm) column was employed for the chromatographic separation of OFL, MET, and RAC. The mobile phase consisting of 55% acetonitrile:10% methanol 35% 20 mM phosphate buffer (pH 6) was forced isocratically with a speed of 1.4 mL/min. The detector wavelengths were set at 395 nm for MET and OFL, and 231 nm for RAC with the help of a PDA detector. Analysis was performed by introducing 20 µL of analyte solutions at room temperature.

2.4. Preparation of Primary Standard Solutions

Primary standard solutions of OFL, MET, and RAC were prepared separately by adding 50 mL methanol to previously weighed 50 mg each of OFL, MET, and RAC to attain a concentration of 1 mg/mL. Primary standard solutions were further diluted with the mobile phase to bring the concentration of analytes to the linearity range before injecting them into the HPLC system.

2.5. Preparation of Sample Solution

The suspension (1 mL) comprising OFL (50 mg/5 mL), MET (100 mg/5 mL), and RAC (15 mg/ 5mL) was measured, after shaking the bottle for 5 min, into a 50 mL graduated flask consisting of methanol (25 mL). The solution was subjected to sonication for 10 min to completely dissolve the drugs in the solvent. Then, the solution was filtered into another graduated flask and the total volume was adjusted to 50 mL with the same solvent. A sufficient amount of mobile phase solvent was added to an aliquot of sample solution to adjust the concentration of compounds to the linearity range just before estimation by the optimized HPLC procedure.

3. Results and Discussion

3.1. Optimization of Chromatographic Condition

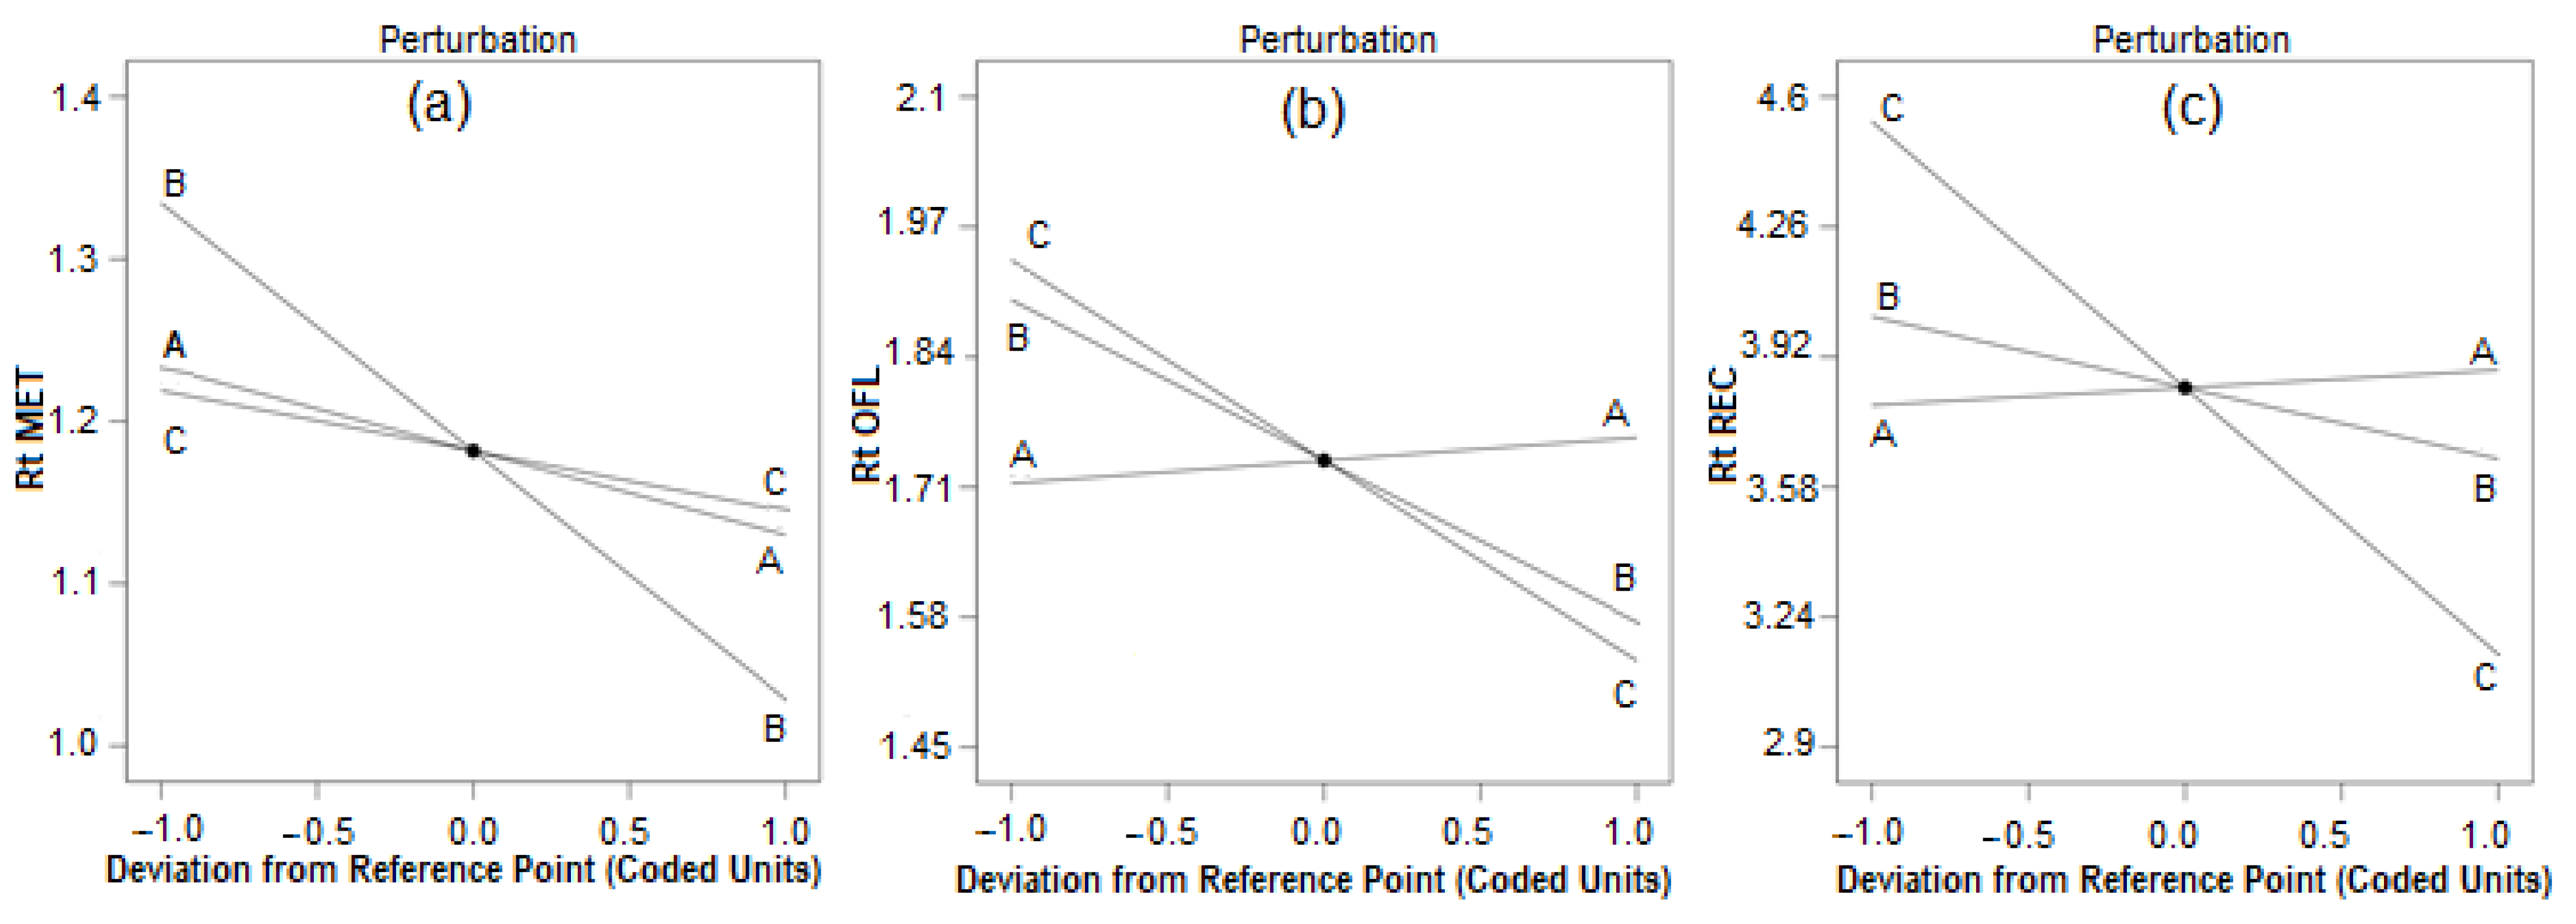
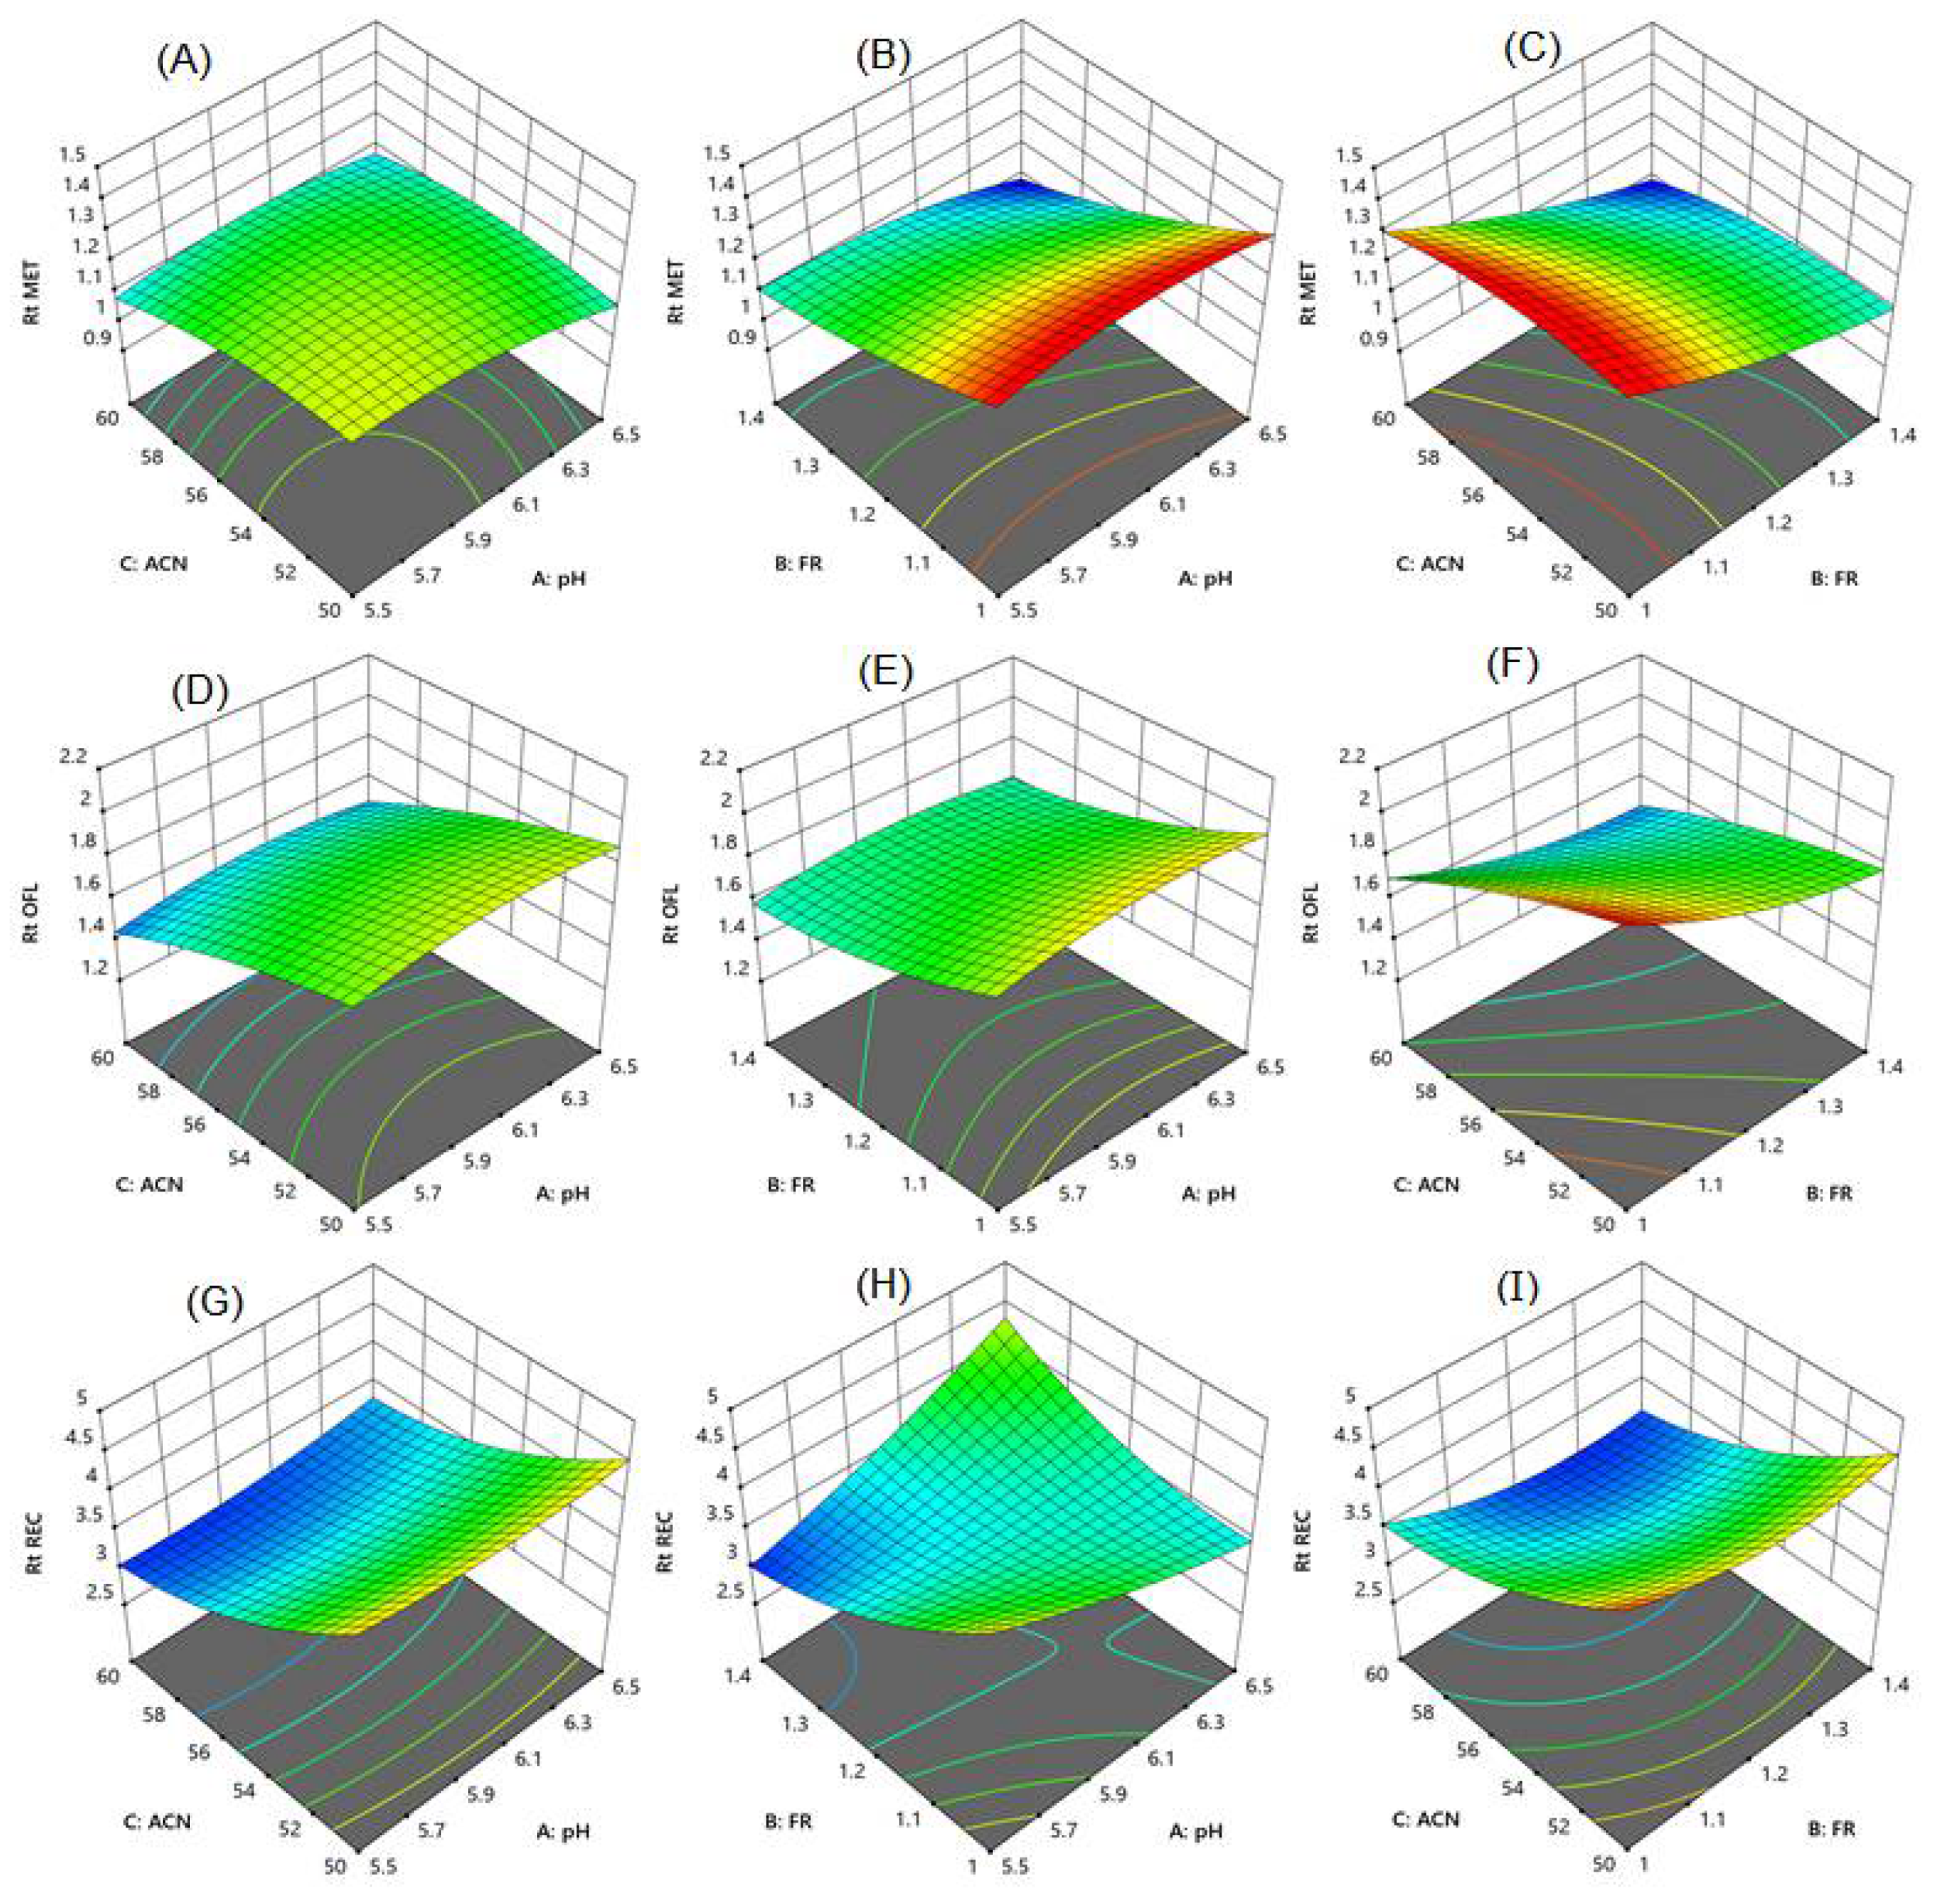
Optimization of the chromatographic condition is crucial for the development of a rapid HPLC process with excellent baseline separation of analytes, accuracy, and precision in fewer trail runs. To establish a rapid RP HPLC procedure, a small C18 HPLC column was selected, and based on the pKa values of the analytes (MET:2.63, OFL:5.45, REC:12.60), for good separation, acidic phosphate buffer was selected. For the baseline separation of OFL and MET, the ideal mobile phase was 90% organic solvent and 10% aqueous phase with pH above 5 [20,21], whereas for the separation of OFL and RAC, it is the opposite, that is, 10% organic phase and 90% water with pH below 3 [25,26,27]; hence, the selection of mobile phase and pH was challenging. In the preliminary study, the concentration of phosphate buffer had less influence on the separation of compounds and 20 mM phosphate demonstrated a good peak shape and separation. With the acetonitrile and phosphate buffer, baseline separation between the MET and OFL peaks was not achieved; however, the addition of 10% methanol separated these two peaks with a resolution of more than 2; hence, 10% methanol was used in the mobile phase. However, with more than 10% of methanol, there was no improvement in the resolution, and the peak shape of ofloxacin deteriorated. Hence, the concentration of methanol was fixed at 10%. Thereafter, the amount of acetonitrile, mobile phase pH, and flow rate showed a vast change in the retention time of analytes, and hence were optimized to establish a fast liquid chromatographic process with excellent baseline separation of peaks using the Box–Behnken design (BBD) using Design Expert 12 software (Stat-Ease, Minneapolis, MN, USA). BBD is a surface response model that uses 22 full factorial designs, generating a higher number of factors using three levels of the factors. Hence, according to the BBD, three factors (amount of acetonitrile and mobile phase pH, and flow rate) at three levels (low, medium, and high) of chromatographic conditions require 17 runs including three center points. BBD requires fewer runs and is a three-level factorial design. Three levels of pH (5.5, 6.0, and 6.5), acetonitrile concentration (50, 55, and 60%), and flow rate (1, 1.2, and 1.4 mL) were used for the optimization. The retention time of all three analytes was considered as response measurements. Using design expert software, perturbation plots and surface response models were generated to know the impact of the parameters on the selected response. Figure 2a–c shows that flow rate had an impact on the retention time of MET, OFL, and RAC, while with an increase in the concentration of acetonitrile in the mobile phase, the retention time of RAC reduced drastically compared to MET and OFL due to its high solubility in acetonitrile and insolubility in water.
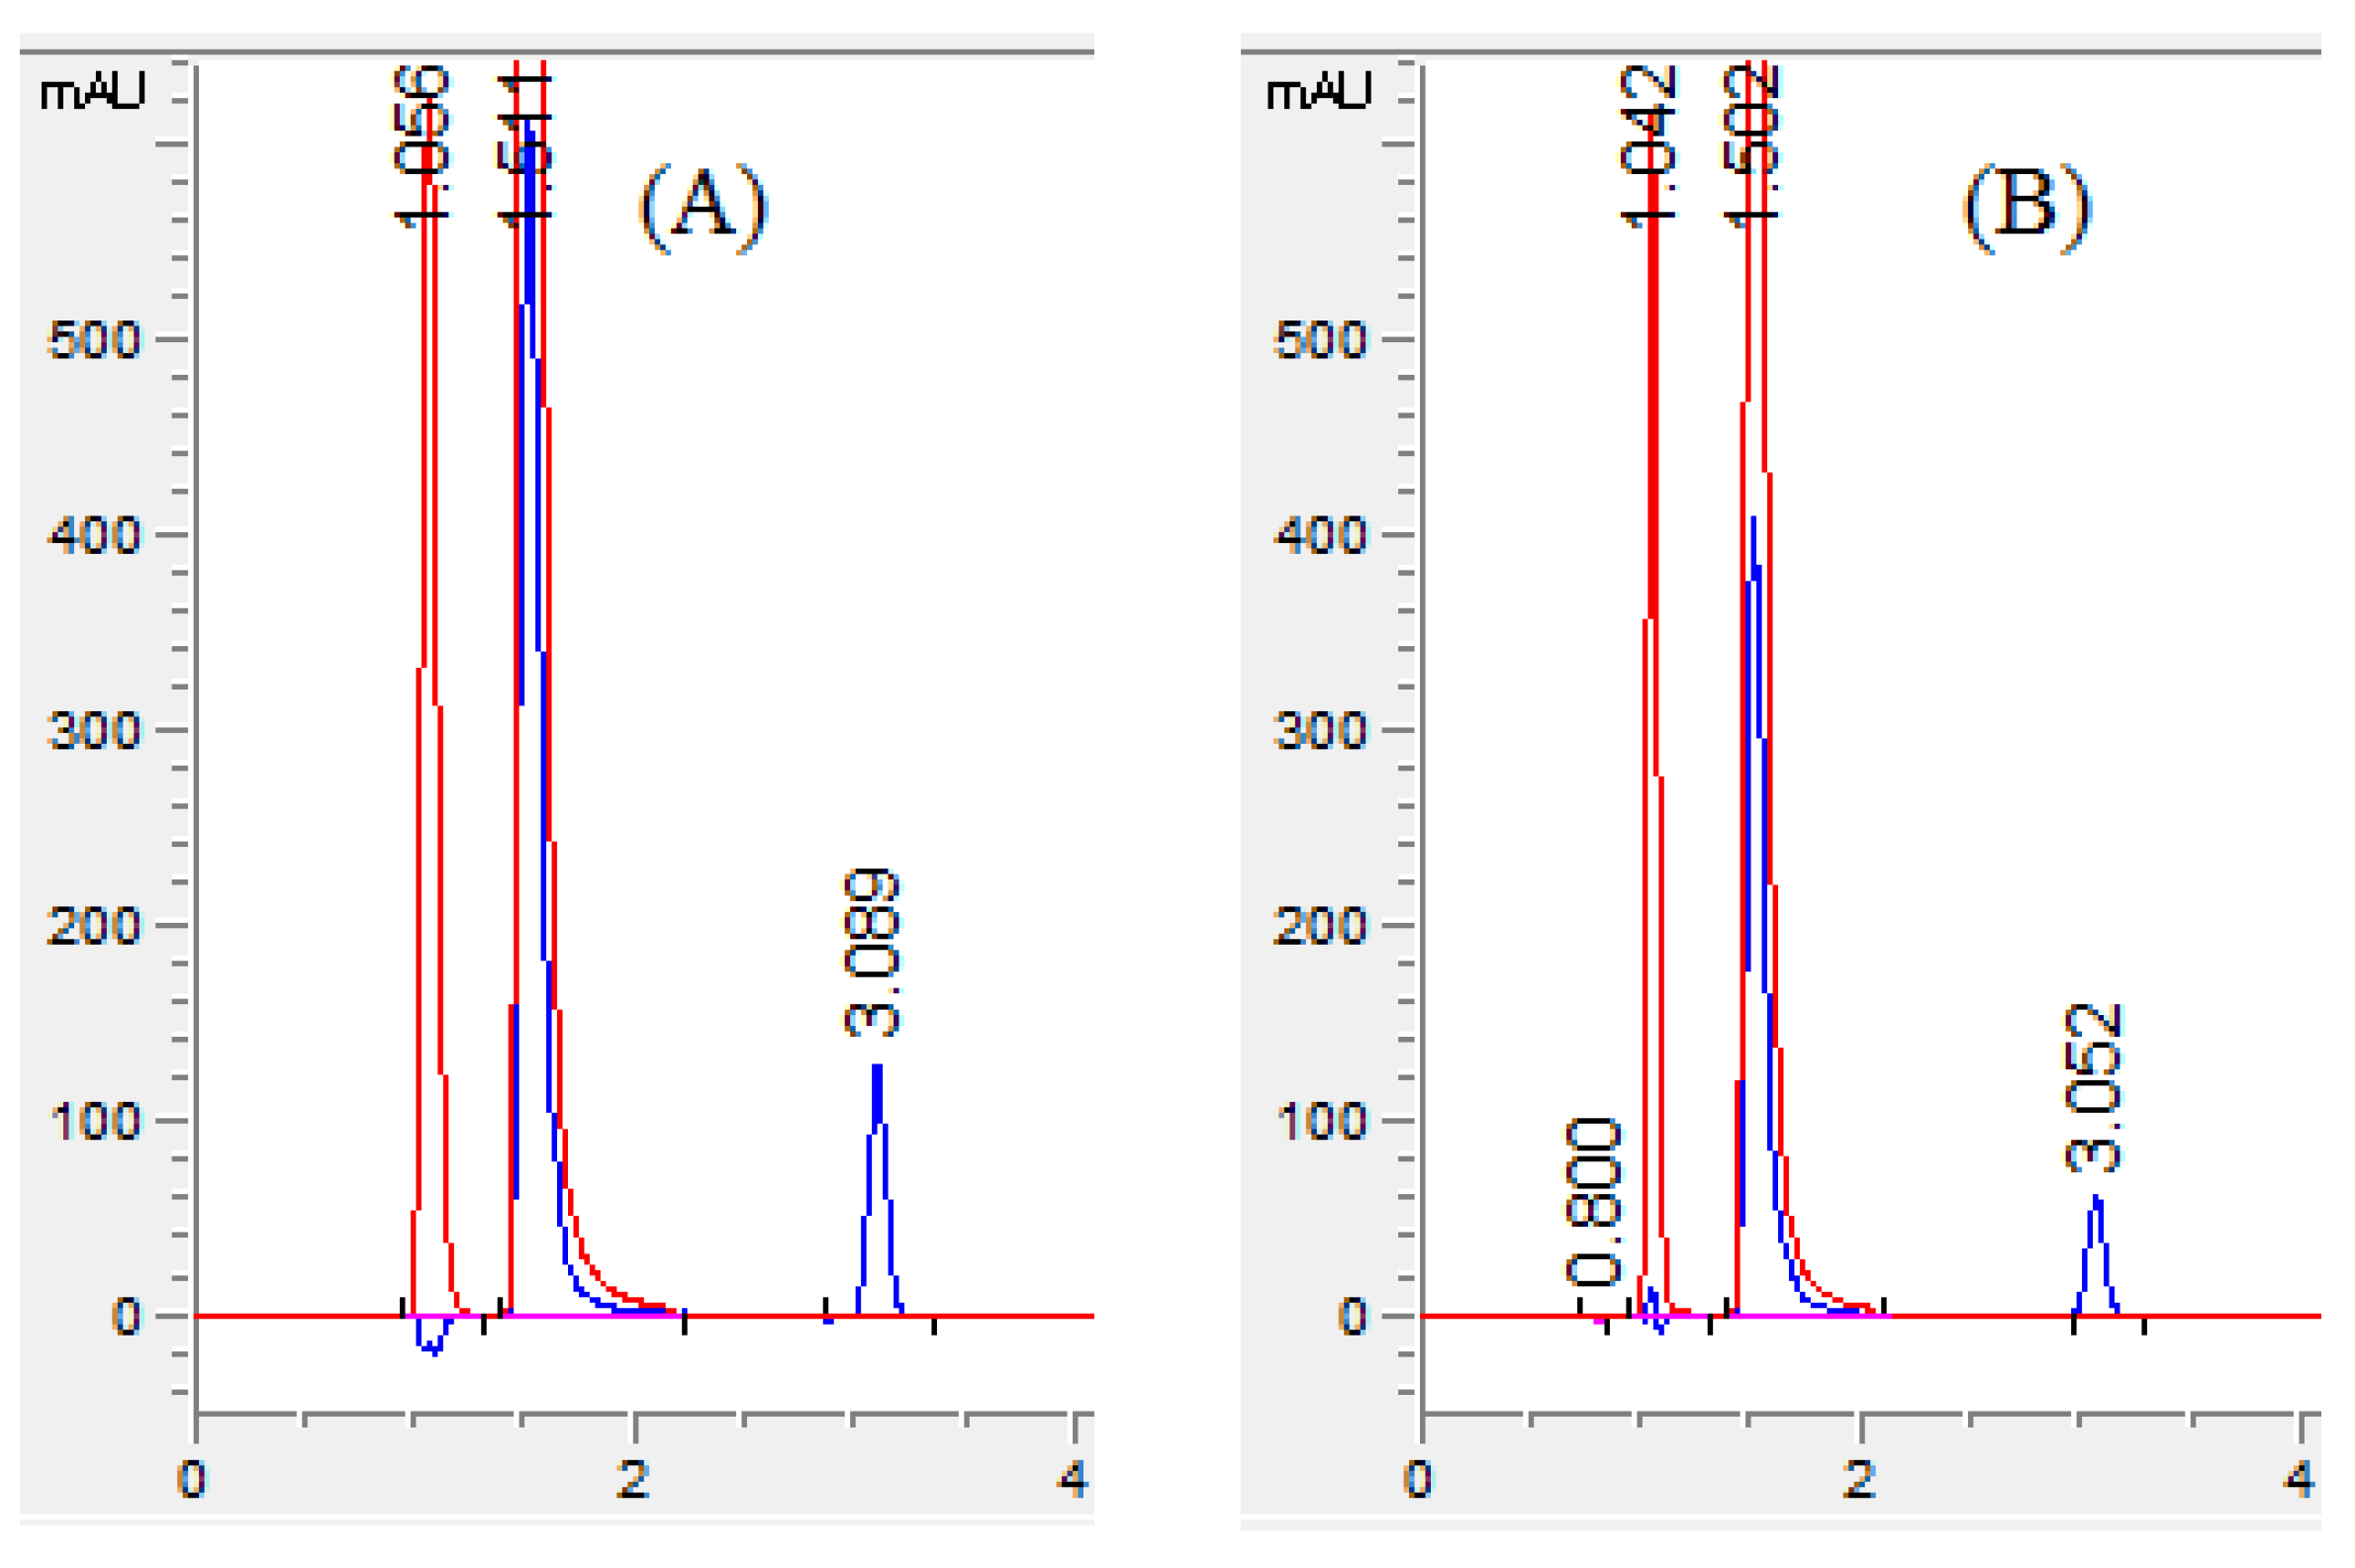
The response surface model shows the effect of two variable parameters. Figure 3A–F surface response curve for MET shows that an increase in the flow rate with a rise in the percentage of acetonitrile and pH reduced the retention time of MET. However, 60% of acetonitrile resolution among MET and OLF was lower than 2. Using 50% acetonitrile along with a speed of 1.0 mL/min showed good resolution between MET and OLF, but the RAC was eluted after 4.5 min, taking a longer analysis time. RAC showed a long retention time with an increase in flow rate with a decrease in mobile phase pH (Figure 3G–I). The percentage of acetonitrile had a prominent effect on the retention time of RAC. An increase in the flow rate and acetonitrile concentration reduced the retention time of RAC. The combined effect of pH and acetonitrile concentration was not significant on the retention time of MET and RAC. Finally, in the present work, the mobile phase consisting of 55% acetonitrile, 10% methanol, and 35% phosphate buffer with pH 6 and a speed of mobile phase 1.4 mL/min eluted all three compounds in a short time with good baseline separation and peak shape. The retention time of MET, OFL, and RAC was found to be 1.05, 1.51, and 3.05 min, respectively (Figure 4A).

3.2. Selection of Wavelength

The UV–Vis absorption spectra of RAC showed λmax at 231 nm and no absorption above 250 nm. However, OFL and MET showed an isosbestic absorption point at 295 nm. Furthermore, OFL had some absorption below 250 nm, but MET did not show any absorption below 250 nm. Hence, two separate wavelengths, 231 nm for RAC and 295 for OFL and MET, were selected using a diode array detector to record the analytes’ peaks. The developed HPLC method can also be performed using a photomultiplier tube detector by programming the wavelength: 295 nm until 1.8 min then changing to 231 nm.

3.3. Method Validation

HPLC method was validated for various criteria such as linearity, sensitivity, accuracy, precision, selectivity, stability, and robustness. The validation was performed by analyzing the mixture of all three analytes in triplicate, as per the validation guidelines provided in the International Council for Hominization (ICH) [39].

3.3.1. System Suitability Test

The HPLC system suitability parameters retention time, peak area, resolution, tailing factor, and theoretical plate were calculated (Supplementary Figures S5–S7) by analyzing the standard solutions of analytes in six replicates. The average system suitability parameters, along with standard deviation, are presented in Table 1. The standard deviation is well within the acceptable range along with high resolution, theoretical place, and acceptable tailing factor for all three analytes.

3.3.2. Linearity of a Calibration Curve

Linearity is the direct correlation between the amount of the analyte and the peak area of the analyte chromatogram. The concentration of all three analytes for the linearity range was selected depending on the anticipated concentration of analytes in the formulation. OFL, MET, and RAC demonstrated linearity with a series of solutions consisting of 10–150 µg/mL, 20–250 µg/mL, and 5–80 µg/mL, respectively. The calibration curve was designed using six diverse concentrations in the range against the corresponding peak area of analytes. The regression equation of the standard curve was determined by Microsoft excel software and intercept slope, and the regression coefficient was computed and tabulated in Table 1 (Supplementary Figures S1–S3).

3.3.3. Sensitivity

Lower limit of detection (LLOD) and quantification (LLOQ) are the parameters that specify the sensitivity of the assay procedure. LLOD and LLOQ of the proposed method were performed using a signal-to-noise ratio. LLOD and LLOQ were determined by analyzing the low concentration of analytes and comparing the chromatograms against blank in the ratio of 3:1 and 10:1, respectively. The low LLOD and LLOQ (Table 1) confirmed the sensitivity of the proposed HPLC method. LLOQ is the concentration of the analyte, which can be quantified with accuracy and precision. Further, the concentration of the linearity range was selected above the LLOQ to accurately quantify the analytes.

3.3.4. Precision and Accuracy

Precision is the closeness among multiple measurements of the analyte when different aliquots of individual homologs solutions are analyzed. The precision of the HPLC procedure was performed considering the within-day and between-day precision by performing the assay at three different concentrations (low, medium, and high) of all three compounds in the linearity concentration. The precision of the analysis was stated as a percentage relative standard deviation, and the mean %RSD was found to be 0.76 to 1.55%, 0.56 to 1.96%, and 0.59% to 1.61% for OFL, MET, and RAC, respectively, endorsing the precision of the developed HPLC procedure (Table 2).
The accuracy of any measurement refers to the closeness of the mean determination to the real quantity of analyte. Hence, the accuracy was established by calculating the percentage recovery and percentage relative error from the above solutions. The mean % recovery ranged from 98.45% to 100.10%, 99.22% to 100.60%, and 98.05% to 100.20% for OFL, MET, and RAC, respectively. The % relative errors were also within the acceptable range, confirming the accuracy of the HPLC method (Table 2).

3.3.5. Selectivity

Selectivity was performed to ensure the complete baseline separation of analytes and the absence of any intervention from the formulation excipients during the analysis of the analytes. The resolution value above 2 (Table 1) confirmed the baseline separation of analytes and separation selectivity. For the determination of separation of analytes from the formulation excipients, the chromatogram of the blank solution was obtained by analyzing the excipient solution and compared with the chromatogram of the standard solution of analytes. The blank solution chromatogram did not show any interfering peaks at the retention time of all three analytes. Furthermore, the chromatograms of formulation solutions of OFL, MET, and RAC had well-separated neat discrete peaks, indicating the selectivity of the proposed HPLC method (Figure 4B).

3.3.6. Stability of Solutions

To study the stability of standard stock solutions of OFL, MET, and RAC, 1 mg/mL in methanol stored in the refrigerator at 4 °C was mixed using a mobile phase to bring the amount of drugs in the linearity range and was analyzed every day. OFL was stable for at least 5 days, whereas MET and RAC were stable for more than 7 days under refrigerator conditions. Additionally, the working standard solutions prepared in the mobile phase were evaluated by analyzing them every hour for 8 h on the same day. The peak area of all three analytes was unchanged, confirming the stability of the working standard solutions in the mobile phase for at least 8 h, which is sufficient to complete the daily analysis.

3.3.7. Robustness

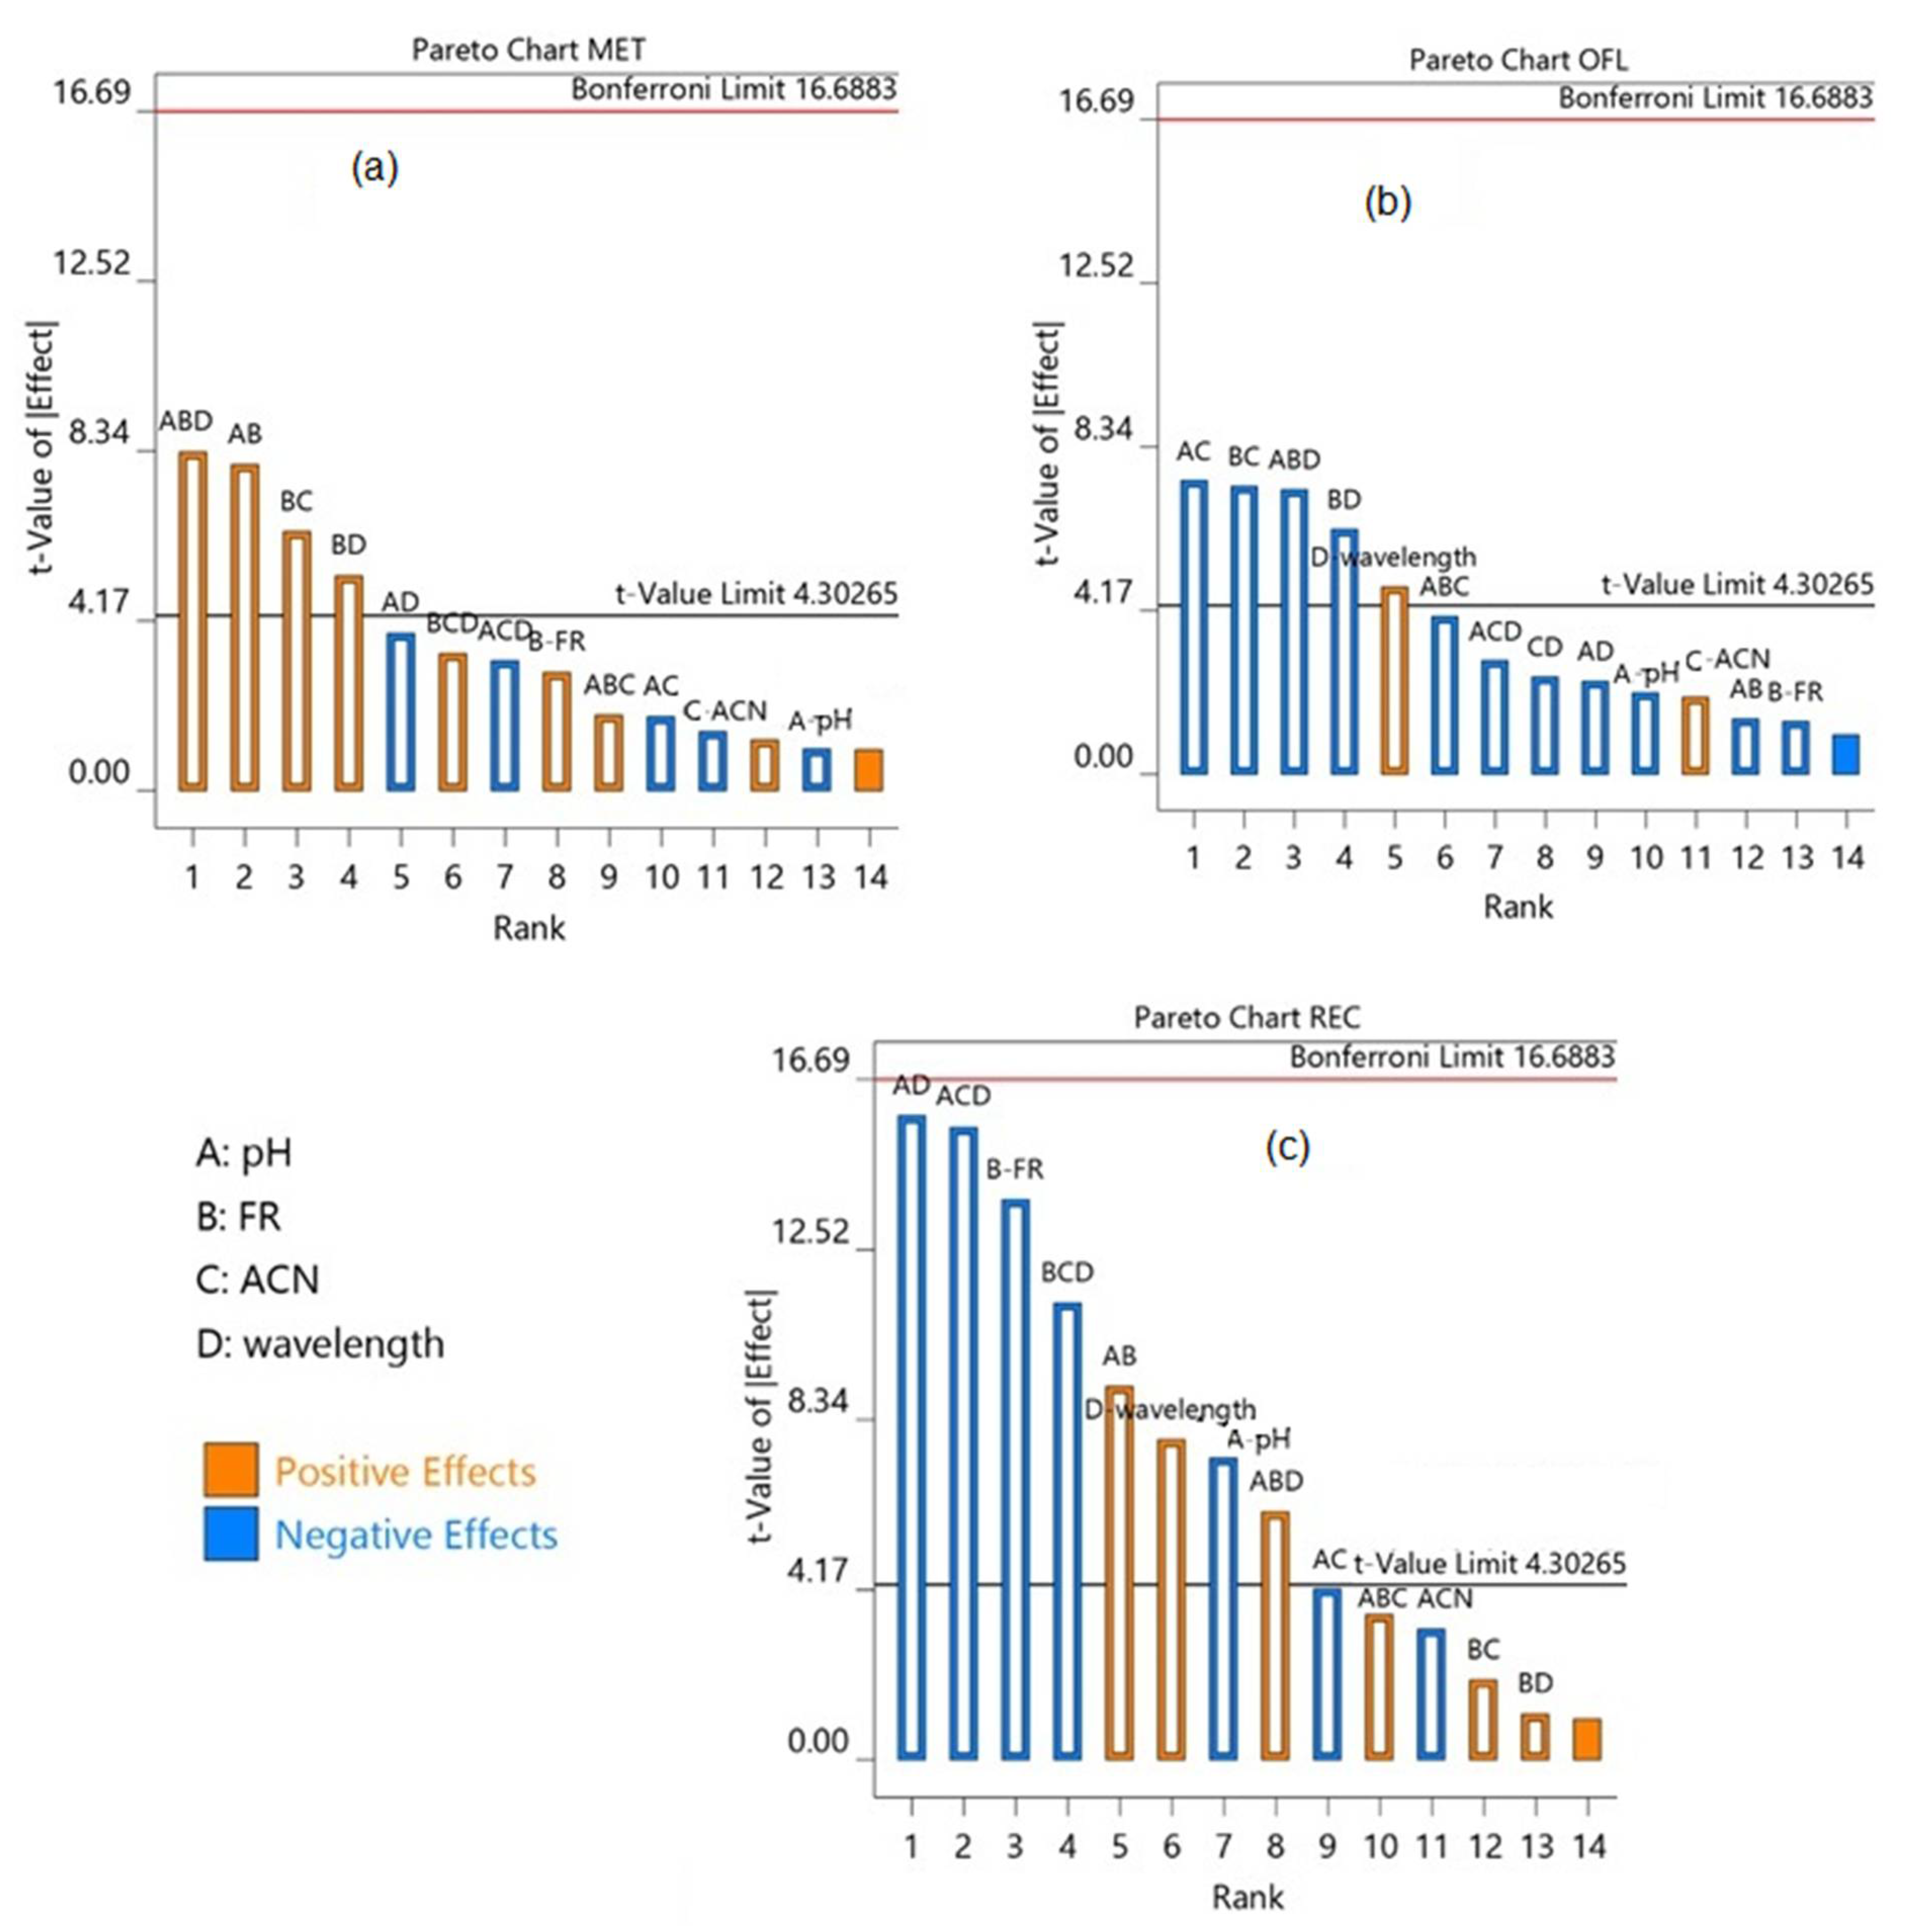
The robust analytical method is the one in which the analysis result remains unchanged with a minor variation in the experimental parameters. Hence, to endorse the robustness, the stock solution of OFL, MET, and RAC was analyzed by slightly changing the optimized experimental condition. A multivariate approach, the full factorial 2n factorial method, where n is the number of independent factors, was adopted to identify the effect of simultaneous variation in the independent variables on the analysis results. The minor changes were made in wavelength (±2 nm), flow rate (±0.1 mL/min), pH (±0.1), and mobile phase composition (±2 mL of acetonitrile). The percentage assay calculated demonstrated that the assay results did not change with small deviations in the experimental parameters. However, the Pareto charts demonstrate the effects of independent and collective effects of variable parameters on the assay results. The parameters’ values beyond the Bonferroni perimeter were extremely significant; however, the values beyond the t-value were significant.
The combined effect of all four parameters showed a significant effect on the assay of MET; however, slight changes in the individual parameters did not show any effect (Figure 5a. Similarly, the assay results of OFL were slightly affected by changes in the wavelength, and hence need to be carefully controlled (Figure 5b). The combined effect of pH, the concentration of acetonitrile, and wavelength was significant in the assay of RAC. Flowrate showed a positive effect, whereas pH and wavelength showed a negative effect on the assay of RAC; hence, they should be carefully controlled during the analysis (Figure 5c).

3.4. Analysis of Formulation

The developed RP HPLC system was used for the concurrent quantification of MET, OLF, and RAC in the formulation. The amount of all three analytes was calculated using corresponding regression equations. The results are in agreement with the number of analytes in the formulation label, (Table 3) confirming the absence of any interference from the formulation excipients (Supplementary Figures S4 and S5). Furthermore, assay results were compared with the reported methods [24,25] in terms of correctness and precision. The computed t-value and F value for the proposed HPLC method were less than the critical value of the Student’s t-test and F test (Table 3). This confirmed that no significant variation was observed in the inferences in terms of accuracy and precision (Table 3).

4. Conclusions

A fast, reproducible, and robust RP HPLC method was established for the concurrent determination of metronidazole, ofloxacin, and racecadotril in antidiarrheal suspension. This is the first analytical method for the simultaneous determination of OFL, MET, and RAC in the formulation. Chromatographic conditions for the baseline separation of analyte peaks with a good resolution were achieved with fewer runs using the Box–Behnken design, a full factorial multivariate optimization technique. Further validated HPLC methodseparated all three analytes in 3.2 min with high accuracy and precision. A Pareto chart developed by the two-factor interaction (2FI) study confirmed that the method was robust, as the slight variation in a single factor had no significant effect on the assay results. Furthermore, the evaluation of assay results using the provided method revealed that there was no significant difference in inferences about accuracy and precision. Hence, the developed rapid HPLC method could be utilized for the quality control study of a pharmaceutical preparation comprising MET, OFL, and RAC in pharma industries and regulatory authority laboratories.

Supplementary Materials

The following supporting information can be downloaded at: https://www.mdpi.com/article/10.3390/separations9050103/s1, Figures S1–S3: Calibration curves for standard solutions of metronidazole, ofloxacin, and racecadotril, respectively; Figure S4: Chromatograms of standard solution; Figure S5: Chromatograms of formulation solution; Figures S6–S8: Equations used for calculation of tailing factor, theoretical plate, and resolution.

Author Contributions

Conceptualization, M.A., P.S., A.B.N., N.S. and A.I.A.; Data curation, K.N.V. and M.S.C.; Formal analysis, K.N.V., P.S., M.D., E.II.P.M., A.B.N., A.A.B. and N.S.; Funding acquisition, M.A.; Investigation, K.N.V., M.S.C., M.D., E.II.P.M., A.A.B., A.B.N. and A.I.A.; Methodology, M.A., K.N.V., P.S., E.II.P.M., A.A.B., N.S., and A.I.A.; Project administration, M.S.C., M.D. and A.B.N.; Resources, K.N.V., P.S., A.A.B., E.II.P.M. and N.S.; Supervision, A.B.N. and N.S.; Validation, M.A., M.S.C., A.A.B., M.D. and A.I.A.; Visualization, M.S.C. and A.I.A.; Writing—original draft, M.A., K.N.V., M.S.C., P.S., M.D., E.II.P.M. and A.I.A.; Writing—review and editing, M.A., A.A.B., N.S. and A.B.N. All authors have read and agreed to the published version of the manuscript.

Funding

The authors are thankful to the Deanship of Scientific Research, King Faisal University, Al-Ahsa, Saudi Arabia for financial support under the Nasher Track (Grant #NA000125). The APC was funded by the Deanship of Scientific Research, King Faisal University, Al-Ahsa.

Institutional Review Board Statement

Ethical approval is not required for this study.

Informed Consent Statement

The study did not require an Informed Consent Statement.

Data Availability Statement

The data generated during this work were included in the manuscript and submitted as Supplementary Files.

Acknowledgments

This work was supported through the Nasher track by the Deanship of Scientific Research, Vice Presidency for Graduate Studies and Scientific Research, King Faisal University, Saudi Arabia.

Conflicts of Interest

The authors declare that they have no known competing financial interests or personal relationships that could have appeared to influence the work reported in this paper.

References

  1. World Gastroenterology Global Guidelines: Acute Diarrhea in Adults and Children: A Global Perspective. Available online: https://www.worldgastroenterology.org/guidelines/acute-diarrhea/acute-diarrhea-english (accessed on 20 April 2022).
  2. Bhaveshaikh, N.; Sukumaran, S.; Vyas, U. Drug prescribing pattern in acute gastroenteritis in an in–patient setting in a private hospital. Int. J. Res. Med. Sci. 2017, 5, 1256–1259. [Google Scholar] [CrossRef] [Green Version]
  3. Joshi, A.S.; Shah, R.K.; Suthar, M.H.; Keharia, U.H. Evaluation of rationality of antimicrobial and antidiarrheal fixed dose combination available in Indian market. Natl. J. Physiol. Pharm. Pharmacol. 2021, 11, 222–226. [Google Scholar] [CrossRef]
  4. Fischbach, W.; Andresen, V.; Eberlin, M.; Mueck, T.; Layer, P. A Comprehensive Comparison of the Efficacy and Tolerability of Racecadotril with Other Treatments of Acute Diarrhea in Adults. Front. Med. 2016, 4, 44. [Google Scholar] [CrossRef] [Green Version]
  5. Blondeau, J.M. Fluoroquinolones: Mechanism of action, classification, and development of resistance. Surv. Ophthalmol. 2004, 49, S73–S78. [Google Scholar] [CrossRef] [PubMed]
  6. Hooper, D.C. Mechanisms of action of antimicrobials: Focus on fluoroquinolones. Clin. Infect. Dis. 2001, 32, S9–S15. [Google Scholar] [CrossRef]
  7. Dingsdag, S.A.; Hunter, N. Metronidazole: An update on metabolism, structure–cytotoxicity and resistance mechanisms. J. Antimicrob. Chemother. 2018, 73, 265–279. [Google Scholar] [CrossRef] [Green Version]
  8. Eberlin, M.; Chen, M.; Mueck, T.; Dabritz, J. Racecadotril in the treatment of acute diarrhea in children: A systematic, comprehensive review and meta–analysis of randomized controlled trials. BMC Pediatr. 2018, 18, 124. [Google Scholar] [CrossRef]
  9. Eberlin, M.; Mück, T.; Michel, M.C. A comprehensive review of the pharmacodynamics, pharmacokinetics, and clinical effects of the neutral endopeptidase inhibitor racecadotril. Front. Pharmacol. 2012, 3, 93. [Google Scholar] [CrossRef] [Green Version]
  10. Gandhi, S.V.; Patil, D.; Baravkar, A.A. Comparison of Chemometric assisted UV Spectrophotometric and RP–HPLC Method for the simultaneous determination of Ofloxacin and Tinidazole in their Combined dosage form. Res. J. Pharm. Tech. 2021, 14, 5713–5718. [Google Scholar] [CrossRef]
  11. Bodiwala, K.; Shah, S.; Patel, Y.; Prajapati, P.; Marolia, B.; Kalyankar, G. Simultaneous Estimation of Ofloxacin, Clotrimazole, and Lignocaine Hydrochloride in Their Combined Ear–Drop Formulation by Two Spectrophotometric Methods. J. AOAC Int. 2017, 100, 38–44. [Google Scholar] [CrossRef]
  12. Pulgarín, J.A.; Molina, A.A.; Boras, N. Development of a spectrofluorimetric method for the determination of ofloxacin in urine. Appl. Spectrosc. 2013, 67, 1029–1035. [Google Scholar] [CrossRef] [PubMed]
  13. Attimarad, M.V.; Sreeharsha, N.; Setty, R.S. Simultaneous Determination Of Ofloxacin Additionally, Flavoxate Hydrochloride In Human Plasma By RP HPLC. J. Liq. Chromatogr. Relat. Technol. 2012, 35, 768–777. [Google Scholar] [CrossRef]
  14. D’Souza, K.; Syeda, A.; Khatal, P.; Muddukrishna, B.S.; Vasantharaju, S.G. Stability Indicating Assay Method Development and Validation for Simultaneous Estimation of Ofloxacin and Ornidazole by RP–HPLC in Bulk: An Application to Tablet Formulation and Dissolution Studies. Indian J. Pharm. Edu. Res. 2021, 55, 607–613. [Google Scholar] [CrossRef]
  15. Patel, D.M.; Soneji, J.A.; Patel, P.B.; Patel, C.N. Development and validation of a method for simultaneous estimation of ofloxacin and ornidazole in different dissolution media. Pharm. Methods. 2012, 3, 102–105. [Google Scholar] [CrossRef] [PubMed] [Green Version]
  16. Hussein, L.A.; Hussien, E.M.; Magdy, N.; Mohamed, H.S. Simultaneous estimation of Ofloxacin and Cefixime in tablet form in presence of the inactive Ofloxacin USP Related compound A. Bull. Fac. Pharm. Cairo Univ. 2017, 55, 171–176. [Google Scholar] [CrossRef]
  17. Ko´ska, I.; Purgat, K.; Głowacki, R.; Kubalczyk, P. Simultaneous Determination of Ciprofloxacin and Ofloxacin in Animal Tissues with the Use of Capillary Electrophoresis with Transient Pseudo–Isotachophoresis. Molecules 2021, 26, 6931. [Google Scholar] [CrossRef]
  18. Alnajjar, A.O. Simultaneous Determination Of Ofloxacin Additionally, Cefixime In Tablet Formulation Using Capillary Electrophoresis. J. Liq. Chromatogr. Rel. Technol. 2013, 36, 2687–2697. [Google Scholar] [CrossRef]
  19. Attimarad, M.V.; Alnajjar, A.O. A conventional HPLCMS method for the simultaneous determination of ofloxacin and cefixime in plasma: Development and validation. J. Basic Clin. Pharm. 2013, 4, 36–41. [Google Scholar] [CrossRef] [Green Version]
  20. Patel, N.B.; Aravdiya, A.C.; Desai, H.T. Development Additionally, Validation Of Two Spectrophotometric Method For Simultaneous Estimation Of Metronidazole Additionally, Ofloxacin In Suspension. Int. J. Pharm. Sci. Res. 2011, 2, 3202–3206. [Google Scholar] [CrossRef]
  21. Maslarska, V.; Tsvetkova, B.; Peikova, L.; Bozhanov, S. RP-HPLC Method For Simultaneous Determination Of Metronidazole Additionally, Ofloxacin In Synthetic Mixture. CBU Int. Conf. Proc. ISE Res. Inst. 2016, 4, 900–905. [Google Scholar] [CrossRef] [Green Version]
  22. Challa, R.; Ramachandra, B.; Naidu, N.V.S. Development and validation of stability indicating assay method for simultaneous determination of Metronidazole and Ofloxacin in pharmaceutical dosage form by using RP-HPLC. Ana. Chem. An. Indian J. 2016, 16, 519–531. [Google Scholar]
  23. Sakira, A.K.; Mees, C.; Braekeleer, K.D.; Delporte, C.; Yameogo, J.; Yabre, M.; Some, T.I.; Antwerpen, P.V.; Mertens, D.; Kauffmann, J.M. Determination of the quality of metronidazole formulations by near–infrared spectrophotometric analysis. Talanta Open 2021, 3, 100027. [Google Scholar] [CrossRef]
  24. Zemanová, N.; Anzenbacher, P.; Hudcovic, T.; Anzenbacherová, E. Rapid Determination of Metronidazole and 2–Hydroxymetronidazole in Murine Blood Plasma. J. Chromatogr. Sci. 2022, 60, 81–87. [Google Scholar] [CrossRef] [PubMed]
  25. Kamel, M. Application of High–Performance Liquid Chromatographic Method For Simultaneous Determination of Racecadotril and Ofloxacin in Their Pharmaceutical Dosage Form. Al–Azhar J. Pharm. Sci. 2019, 60, 95–110. [Google Scholar] [CrossRef] [Green Version]
  26. Makadiya, A.S.; Prajapati, L.M.; Joshi, A.K.; Jethara, S.H.I.; Kharodiya, M.A.L. Development and Validation of Simultaneous Estimation of Racecadotril and Ofloxacin in Bulk and Combined Tablet Dosage Form. Inventi. Rapid Pharm. Ana. Qua. Assu. 2015, 2, 1–5. [Google Scholar]
  27. Gupta, K.; Sharma, D.; Chawla, P. Simultaneous Estimation of Racecadotril and Ofloxacin by Reverse Phase High Performance Liquid Chromatography Method in Pharmaceutical Dosage Forms. J. Drug Deliv. Ther. 2019, 9, 165–170. [Google Scholar] [CrossRef]
  28. Singh, N.P.; Damahe, D.P.; Narkhede, S.B. Analytical method development & validation for simultaneous estimation of ofloxacin, ornidazole & racecadotril in pharmaceutical dosage form by HPTLC. Pharm. Innov. J. 2019, 8, 228–234. [Google Scholar]
  29. Salama, F.M.; El–Abasawi, N.M.; El–Olemy, A.; Hasan, M.A.; Kamel, M. Application of High–Performance Thin–layer Chromatographic Method for Simultaneous Determination of Co–formulated Ofloxacin and Racecadotril in their Oral Dosage Form. J. Adv. Pharm. Res. 2020, 4, 25–32. [Google Scholar] [CrossRef]
  30. Ukirde, R.D.; Sawant, R.L.; Barkade, G.D. Development and validation of simple uv spectrophotometric method for the determination of racecodotril both in bulk and marketed dosage formulations. Int. J. Pharm. Qual. Assur. 2020, 11, 334–337. [Google Scholar] [CrossRef]
  31. Ali, N.W.; Elghobashy, M.R.; Mahmoud, M.G.; Mohammed, M.A. Spectrophotometric and spectrofluorimetric methods for determination of Racecadotril. Pak. J. Pharm. Sci. 2011, 24, 19–23. [Google Scholar]
  32. Mohamed, A.O.; Fouad, M.M.; Hasan, M.M.; Abdel Razeq, S.A.; Elsherif, Z.A. Stability–indicating methods for the determination of racecadotril in the presence of its degradation products. Biosci. Trends 2009, 3, 247–252. [Google Scholar] [PubMed]
  33. Yu, X.; Jinchang, H.; Fei, L.; Shu, G.; Guo, Q. Quantitative analysis of racecadotril metabolite in human plasma using a liquid chromatography/tandem mass spectrometry. J. Chromatogr. B Anal. Technol. Biomed. Life Sci. 2007, 852, 101–107. [Google Scholar] [CrossRef]
  34. Lopes, W.A.; da Rocha, G.O.; Pereira, P.A.; Oliveira, F.S.; Carvalho, L.S.; Bahia, N.; Conceição, L.S.; de Andrade, J.B. Multivariate optimization of a GC–MS method for determination of sixteen priority polycyclic aromatic hydrocarbons in environmental samples. J. Sep. Sci. 2008, 31, 1787–1796. [Google Scholar] [CrossRef] [PubMed]
  35. Gurrala, S.; Raj, S.; Subrahmanyam, C.V.S.; Anumolu, P.D. Multivariate optimization of liquid chromatographic conditions for determination of dapagliflozin and saxagliptin, application to an in vitro dissolution and stability studies. Future J. Pharm. Sci. 2021, 7, 85. [Google Scholar] [CrossRef]
  36. Hemdan, A.; Al–Tannak, N.F.; Mohamed, E.H. Development of a multivariate model with desirability–based optimization for determination of atenolol and hydrochlorothiazide by eco–friendly HPLC method with fluorescence detection. J. Sep. Sci. 2022, 45, 824–831. [Google Scholar] [CrossRef]
  37. Orlandini, S.; Gotti, R.; Furlanetto, S. Multivariate optimization of capillary electrophoresis methods: A critical review. J. Pharm. Biomed. Anal. 2014, 87, 290–307. [Google Scholar] [CrossRef]
  38. Attimarad, M. Multivariate optimization of a capillary zone electrophoresis assay method for simultaneous quantification of metformin and vildagliptin from a formulation. J. Liq. Chromatogr. Relat. Technol. 2016, 39, 401–407. [Google Scholar] [CrossRef]
  39. ICH. Q2B, Validation of Analytical Procedures: Methodology. In Proceedings of the International Conference on Harmonization, Geneva, Switzerland, 15–16 November 1996; pp. 1–17. [Google Scholar]
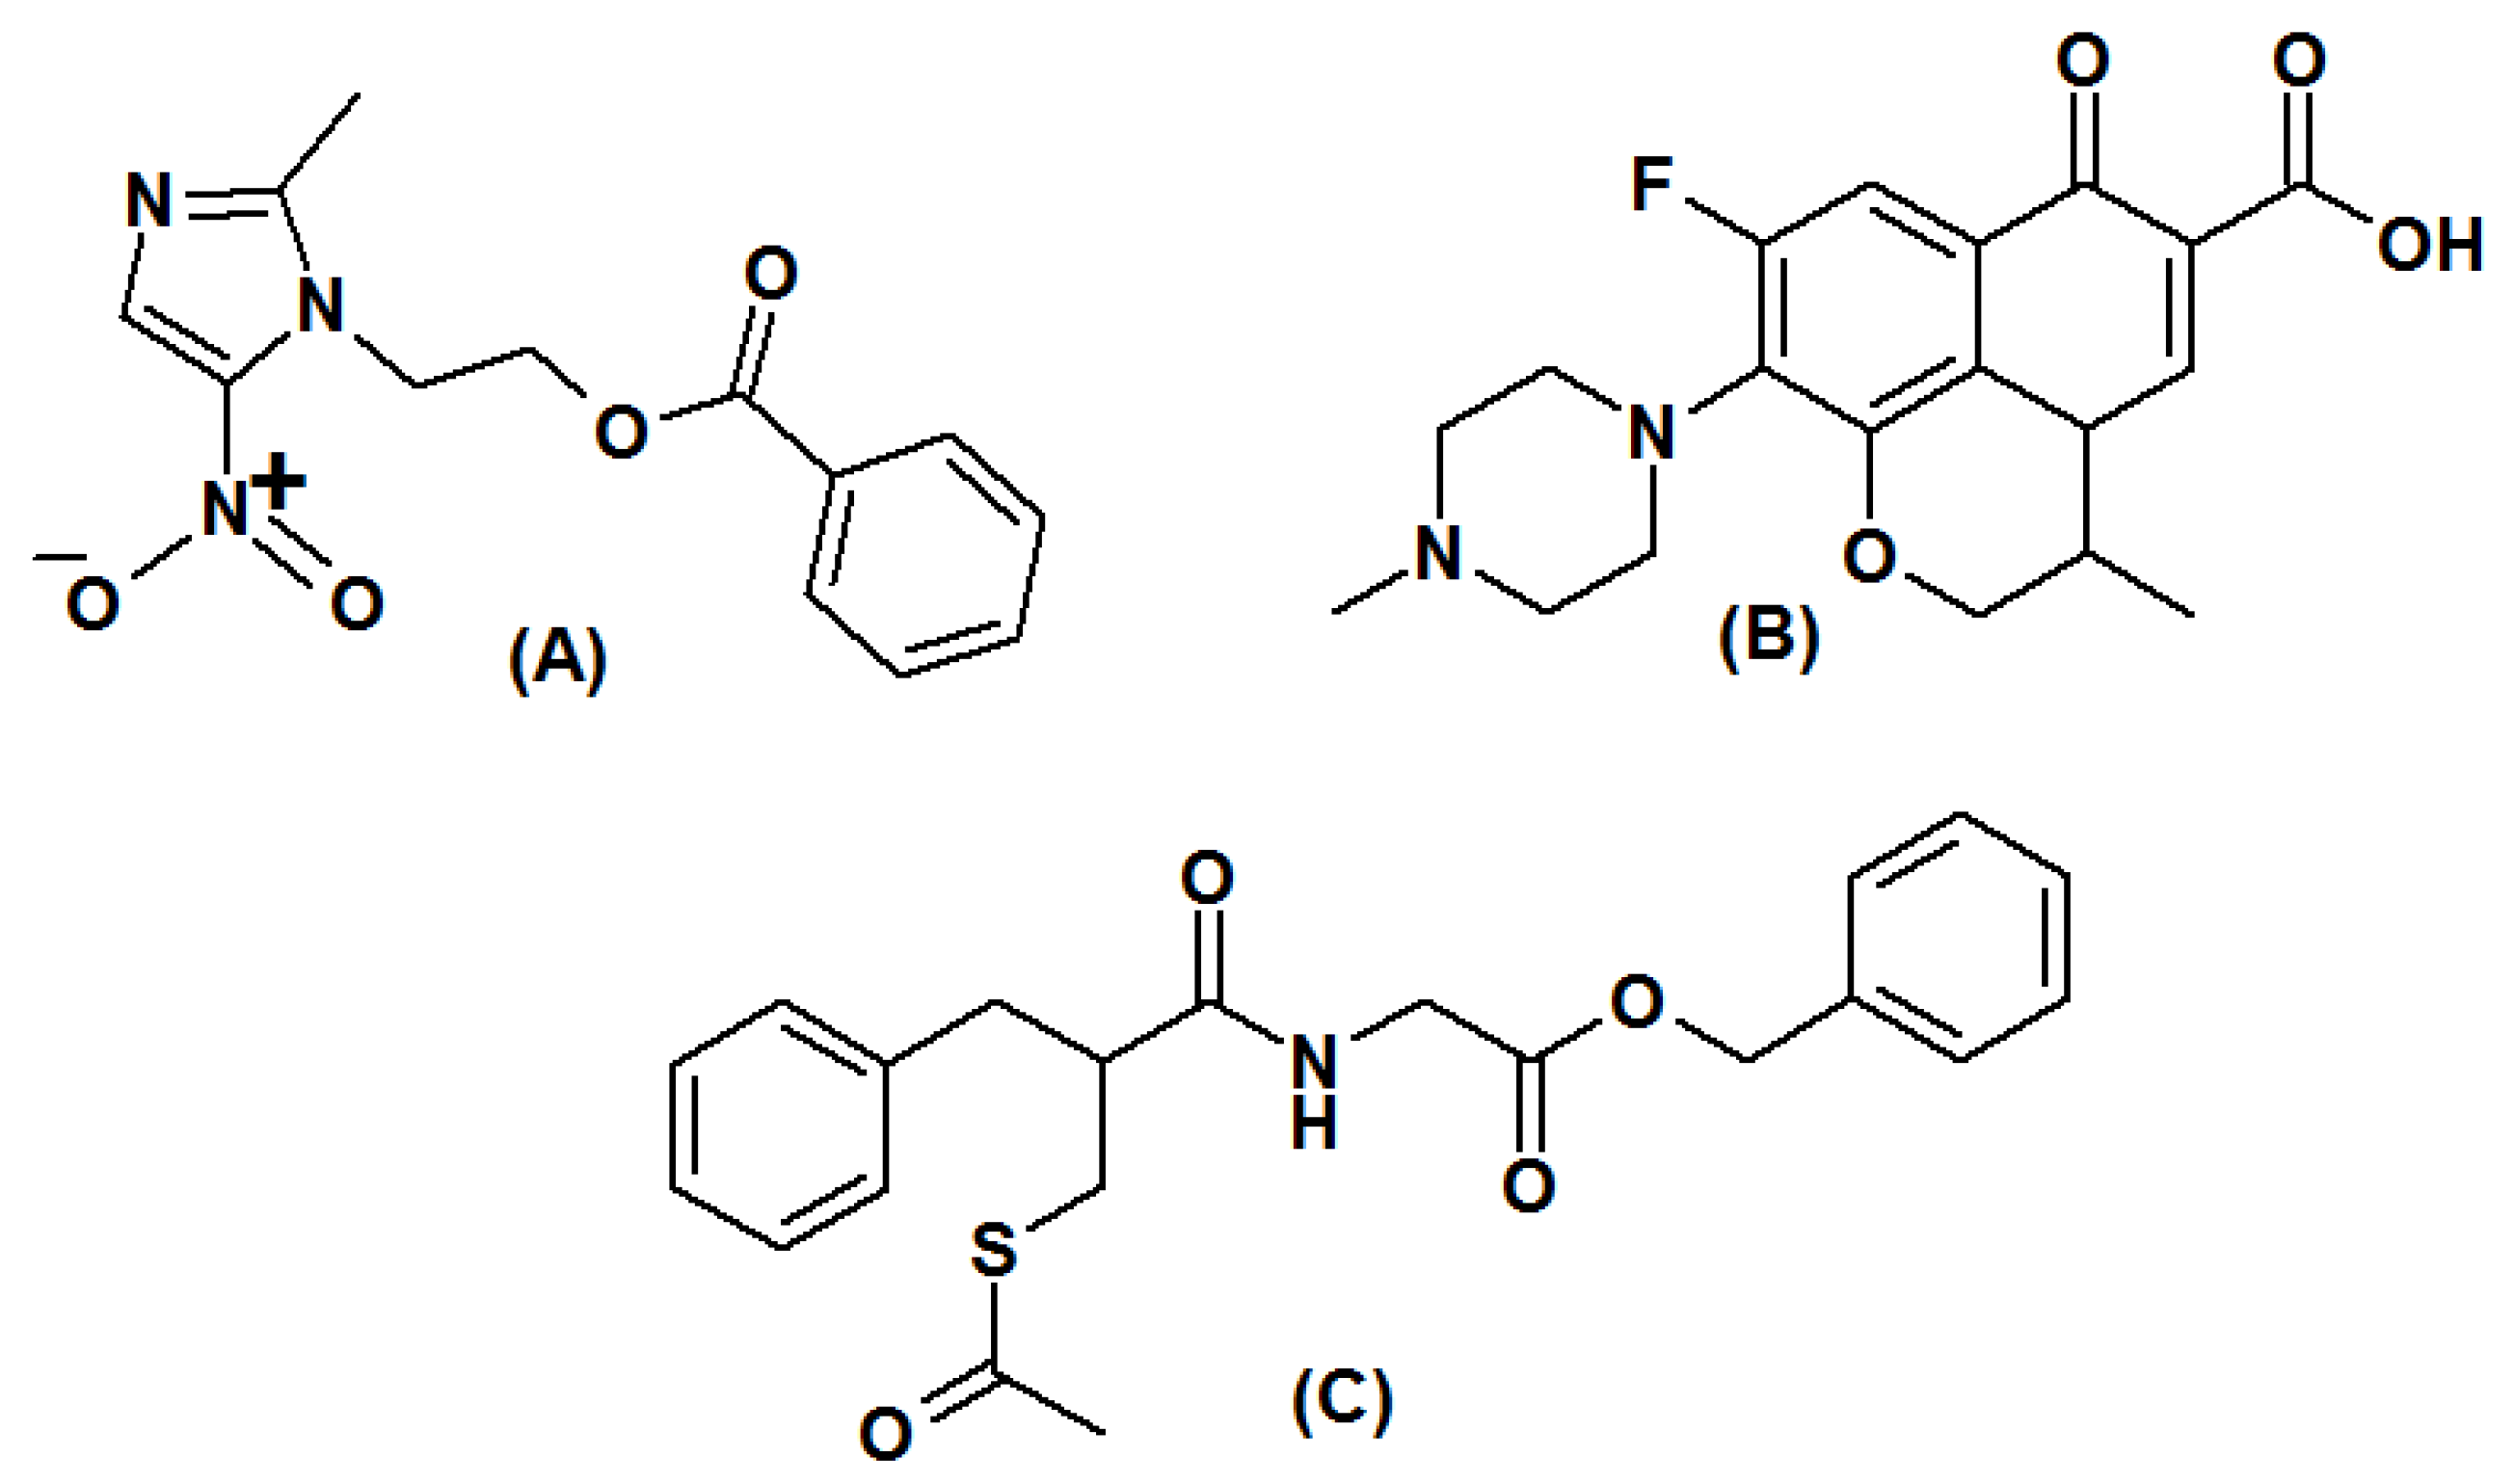
Figure 1. Chemical structure of (A) metronidazole benzoate, (B) ofloxacin, and (C) racecadotril.
Separations 09 00103 g001
Figure 2. Perturbation plot for (a) metronidazole, (b) ofloxacin, and (c) racecadotril. Chromatographic parameters (A) pH (5.5, 6, and 6.5), (B) flow rate (1.0, 1.2, and 1.4 mL/min) and (C) concentration of acetonitrile (50, 55 and 60%).
Separations 09 00103 g002
Figure 3. Response surface graphs for (AC) metronidazole, (DF) ofloxacin, and (GI) racecadotril. Chromatographic parameters pH (5.5, 6, and 6.5), flow rate (1.0, 1.2, and 1.4 mL/min) and concentration of acetonitrile (50, 55, and 60%).
Separations 09 00103 g003
Figure 4. Chromatogram of (A) standard solution and (B) sample solution. Chromatogram with red color is recorded with 295 nm for MET (1.0 min) and OFL (1.5 min) and blue color is with 231 nm for RAC (3.0 min).
Separations 09 00103 g004
Figure 5. Pareto chart for (a) metronidazole, (b) ofloxacin, and (c) racecadotril. Chromatography parameters (A) pH (5.8, 6, and 6.2), (B) flow rate (1.3, 1.4, and 1.5 mL/min), (C) concentration of acetonitrile (53, 55 and 57%) and (D) wavelength (293, 295, and 297 nm for MET and OFL; 229, 231, and 233 nm for RAC). FR: Flow Rate, ACN: Acetonitrile.
Separations 09 00103 g005
Table 1. System suitability and regression analysis results.
ParametersMETOFLRAC
System suitability results
Retention time ± SD1.05 ± 0.0111.51 ± 0.0133.05 ± 0.035
Peak area ± SD1365.4 ± 9.64 a4117.8 ± 21.56 b178.37 ± 2.18 c
Resolution ± SD--2.12± 0.05 d5.33 ± 0.08 e
Tailing factor ± SD1.08 ± 0.0120.96 ± 0.0161.04 ± 0.011
Theoretical plate ± SD2714.41 ± 12.452532.77 ± 10.7811,995.42 ± 124.38
Linearity
Linearity range (µg/mL)20–25010–1505–80
Slope12.11172.2728.991
Intercept15.442454.4942.691
Regression coefficient (r2)0.99910.99970.9995
Sensitivity
LOD (µg/mL)3.062.881.25
LOQ (µg/mL)10.219.634.18
SD: standard deviation, a 100 µg/mL, b 50 µg/mL, c 20 µg/mL, d resolution between MET and OFL, e resolution between OFL and RAC.
Table 2. Precision and accuracy results from the developed HPLC method.
DrugWithin-DayBetween-Day
Amount [µg/mL]Amount Found Mean [n = 3] ± SD% RSD% Recovery% REAmount Found Mean [n = 9] ± SD% RSD% Recovery% RE
MET2019.69 ± 0.201.0298.45−1.5520.02 ± 0.311.55100.100.10
10098.96 ± 1.131.1498.961.0499.47 ± 1.451.4699.47−0.53
250247.38 ± 1.890.7698.951.05246.94 ± 2.030.8298.78−1.22
OFL1010.06 ± 0.161.59100.60−0.6010.03 ± 0.141.40100.300.30
7574.51 ± 1.461.9699.350.6574.38 ± 0.971.3099.17−0.83
150148.99 ± 0.830.5699.330.67148.83 ± 1.090.7399.22−0.78
RAC55.01 ± 0.081.60100.20−0.204.98 ± 0.061.2099.60−0.40
4039.72 ± 0.641.6199.300.7039.38 ± 0.230.5998.05−1.92
8079.08 ± 0.931.1898.851.1579.83 ± 0.961.2099.79−0.21
SD: standard deviation; % RSD: percent relative standard deviation; % RE: percent relative error.
Table 3. Analysis results of drugs from formulations by optimized HPLC method.
Amount of Sample Taken a [µg mL−1]% Found by Proposed Method% Found by Reference Method
METOFLRACMETOFLRACMET [24]OFL [25]RAC [25]
80401299.6499.4799.4699.4798.37100.33
1005015100.27100.9498.09101.6299.33101.67
160802499.37101.07100.7798.37100.4398.27
20010030100.4799.4899.5299.39100.7699.61
Across Mean99.93100.2499.4699.7199.7299.97
%RSD0.520.881.091.371.091.42
t (2.446) b0.3070.7370.569
F (9.276) c6.9631.5151.67
a amount taken after dilution of formulation with label claim, 100 mg of MET, 50 mg of OFL, and 15 mg of RAC per 5ml of suspension; b is a critical value of Student’s t-test (p > 0.05); c is a critical value of F test (p > 0.05).
Publisher’s Note: MDPI stays neutral with regard to jurisdictional claims in published maps and institutional affiliations.