Article

Optimization and Validation of a Method Based on QuEChERS Extraction and Gas Chromatographic-Mass Spectrometric Analysis for the Determination of Polycyclic Aromatic Hydrocarbons and Polychlorinated Biphenyls in Olive Fruits Irrigated with Treated Wastewaters

1
Department of Chemistry, University of Torino, Via Pietro Giuria 7, 10125 Torino, Italy
2
National Polytechnic School, University of Bouira-Algeria, Bouira 10000, Algeria
3
GIDA, S.p.A., Via di Baciacavallo 36, 59100 Prato, Italy
4
Department of Chemistry “Ugo Schiff”, University of Florence, Via della Lastruccia 3, 50019 Sesto Fiorentino, Italy
*
Authors to whom correspondence should be addressed.
Separations 2022, 9(3), 82; https://doi.org/10.3390/separations9030082
Submission received: 2 March 2022 / Revised: 15 March 2022 / Accepted: 18 March 2022 / Published: 21 March 2022

Abstract

:
The wastewater reuse is an important measure to face water shortage, thus improving the resilience of agricultural production chains. However, treated wastewater can contain residual organic micropollutants residues that may result in crop contamination. Among edible crops, olive is the most important agricultural product in the Mediterranean region. Methods to assess the contamination of organic micropollutants such as polycyclic aromatic hydrocarbons (PAHs) and polychlorinated biphenyls (PCBs) in olives are poorly investigated. Given the complexity of olives, this study focused on the development and validation of a method for the simultaneous extraction of PAHs and PCBs from olives, and subsequent analysis by gas chromatography coupled with mass spectrometry detection. Extraction was optimized through a QuEChERS protocol, studying the effect of the extraction solvent (CH2Cl2, cyclohexane, CH3CN) and of the dispersive-solid phase extraction (d-SPE) sorbent (octadecyl silica, Florisil, primary secondary amine, Z-Sep) on the recovery of micropollutants. The best recoveries (94–122%, relative standard deviations below 5%) were obtained using CH3CN/H2O and a double purification step with Z-Sep and Florisil. The method developed for PAHs and PCBs, which showed good intra-day (<2.7%) and inter-day (<2.9%) precision and low matrix effect (|ME| < 14%), was applied to the analysis of olives grown by irrigation with reclaimed wastewaters.

1. Introduction

In the Mediterranean basin, the variability of rainfall, the periods of drought, and the localized shortage of freshwater, conditions now exacerbated by the global climate change, bring difficulties in the management of water resources. In most regions of the world, over 70% of freshwater is used for agriculture. Reusing urban treated wastewater (TWW) for irrigation purposes could, therefore, be strategic in the possibility of reducing the water stress of these regions, limiting the pressures on water bodies, guaranteeing access to drinking water for a greater number of people and improving, at the same time, the resilience of agricultural production chains.
With the aim of establishing a regulatory instrument at European level and eliminating the difficulties that limit the widespread use of wastewater for irrigation purposes, the European Council issued the EU Regulation 2020/741, which will come into force from 2023. Annex I of the Regulation defines the wastewater quality classes based on E. coli, BOD5 (Biochemical Oxygen Demand), TSS (Total Suspended Solids), and turbidity; the maximum values of Legionella and intestinal nematodes are also indicated. In addition to the above-mentioned minimum requirements, according to the precautionary principle, Annex II introduces additional requirements, to be adopted after a risk assessment procedure, which must consider the environmental quality standards for priority substances already included in Directive 2008/105/EC, such as non-regulated organic micropollutants (i.e., other than pesticides). As a matter of fact, TWW reuse requires strict control, as there is a risk that the residual microbiological and chemical contaminants, not completely removed by the treatment processes in the wastewater treatment plants (WWTP), may transfer from the water to the soil and crops. This requirement is even more stringent for those countries where TWW reuse is a consolidated and unavoidable practice [1,2,3]. Consequently, the control of the quality of the crops grown up under TWW reuse practise is a necessary step [2,4,5]. The risk associated with the use of wastewater in agriculture is usually mainly assessed measuring the microbiological characteristics of waters used for irrigation and investigating the transfer of contamination to soil [6]. Among the contaminants monitored in wastewater used for irrigation and irrigated land are metals [7]. The possible transfer of non-regulated organic micropollutants from TWW to crops is poorly described in the literature, being mainly focusing on pharmaceutical compounds, perfluorinated compounds, phthalates, and organophosphorus flame retardants in few agricultural products (e.g., carrot, potato, lettuce, and rocket) [8]. In recent years, our research group deeply investigated the possible transfer of residual organic contamination of different polarity in strawberries grown under irrigation with urban wastewater, also evaluating the effect of micropollutants on the main plant characteristics (i.e., crown diameter, plants’ heights, and chlorophyll content) [1,2,4,5,9].
Among the crop species that can be investigated for their quality in response to irrigation with TWWs, olive is certainly a very attractive fruit, due to its historically importance as source of food and oil and due to its economic importance for the countries of the Mediterranean basin [10]. The determination of residual organic micropollutants such as polycyclic aromatic hydrocarbons (PAHs) and polychlorinated biphenyls (PCBs), which are considered indicators of diffuse contamination [1,9], is hampered by the intrinsic lipophilic nature of olives themselves.
To the best of our knowledge, current analytical methods are mainly dedicated to the determination of single [11] or multiple [12] class of micropollutants in olive oil. For olive fruit analysis, analytical protocols reported in the literature include time-consuming extraction and purification procedures [13], which are specific for a single-class of target compounds [12] and comprise solvent evaporation and solvent change steps, with possible loss of analytes.
On these assumptions, the aim of this work is to develop a unique rapid, sensitive, and green method for the simultaneous determination of thirty organic micropollutants (16 EPA PAHs and 14 PCBs, including dioxin-like congeners) in olive fruits using the QuEChERS extraction approach, followed by gas chromatography coupled to mass spectrometry (GC–MS). The QuEChERS methodology was preferred as it is known to be based on the main principles of the Green Chemistry [14]. The optimized method was applied to the evaluation of the presence of PAHs and PCBs in olive fruits (cultivar “Frantoio”) grown under irrigation with various TWWs.

2. Materials and Methods

2.1. Reagents

Acetone ≥ 99.8%, acetonitrile: ≥99.9%, sulfuric acid 96–97%, magnesium sulfate anhydrous ≥ 99.5% and NaCl ≥ 99.5% were from Honeywell Riedel-de-Haën, Fisher Scientific Italia, Rodano, MI (Italy). Cyclohexane 99.5% and dichloromethane were from VWR International (Radnor, PA, USA).
High-purity water (18.2 MΩ cm resistivity at 25 °C), produced by an Elix-Milli Q Academic system (Millipore-Billerica, MA, USA) was used.
The dispersive-solid phase (d-SPE) sorbents used were Supelclean LC-Florisil (magnesium silicate base material), Z-Sep Bulk Supel QuE (zirconia coated silica particles), both from Supelco, Merck (Darmstadt, Germany), C18 endcapped bulk sorbent and Primary Secondary Amine (PSA), both from Agilent Technologies (Santa Clara, CA, USA).
The 16 PAHs studied, i.e., naphthalene (Naph), acenaphthylene (AcPY), acenaphthene (AcPh), fluorene (Flu), phenanthrene (Phe), anthracene (Ant), fluoranthene (Flth), pyrene (Pyr), benzo[a]anthracene (BaA), chrysene (Chr), benzo[b]fluoranthene (BbFl), benzo[k]fluoranthene (BkFl), benzo[a]pyrene (BaP), indeno[1,2,3-cd]pyrene (Ind), dibenz[a,h]anthracene (DBA), and benzo[ghi]perylene (BP) were the compounds listed by the United States Environmental Protection Agency (US-EPA) and were purchased from Wellington Laboratories (Guelph, ON, Canada).
The 14 PCBs studied were purchased from Chemical Research 2000 (Rome, Italy). They were chosen according to the results of the main monitoring campaigns and included 3,3′-dichlorobiphenyl (PCB 11), 4,4′-dichlorobiphenyl (PCB 15), 2,4,4′-trichlorobiphenyl (PCB 28), 2,2′,5,5′-tetrachlorobiphenyl (PCB 52), 2,2′,4,5,5′-pentachlorobiphenyl (PCB 101), 2,2′,3,4,4′,5-hexachlorobiphenyl (PCB 138), 2,2′,4,4′,5,5′-hexachlorobiphenyl (PCB 153), and 2,2′,3,4,4′,5,5′-heptachlorobiphenyl (PCB 180). Furthermore, the following dioxin-like PCBs were included: 3,4,4′,5-tetrachlorobiphenyl (PCB 81), 2,3′,4,4′,5-pentachlorobiphenyl (PCB 118), 2′,3,4,4′,5-penta-chlorobiphenyl (PCB 123), and 2,3′,4,4′,5,5′-hexachlorobiphenyl (PCB 167), 3,3′,4,4′,5,5′-hexachlorobiphenyl (PCB 169), and 2,3,3′,4,4′,5,5′-heptachlorobiphenyl (PCB 189).
Isotope labelled compounds for PAHs (5 mg L−1) and for PCBs (2 mg L−1), both purchased from Wellington Laboratories, were used as internal standards and surrogates in order to obtain calibration curves and to calculate extraction recoveries. The deuterated PAH surrogate solution included the following compounds: benzo[a]anthracene-d12 (BaA-d12), chrisene-d12 (Chr-d12), benzo[b]fluoranthene-d12 (BbFl-d12), benzo[k]fluoranthene-d12 (BkFl-d12), benzo[a]pyrene-d12 (BaP-d12), indeno[1,2,3-cd]pyrene-d12 (Ind-d12), dibenz[a,h] anthracene-d14 (DBA-d14), and benzo[g,h,i]perylene-d12 (BP-d12). The 13C-PCB surrogate solutions included the following congeners: 13C12-PCB28, 13C12-PCB52, 13C12-PCB118, 13C12-PCB153, and 13C12-PCB180. Anthracene-d10 and 13C12-PCB70 were used as internal standards.

2.2. Olive Fruit Samples

The olive (cultivar “Frantoio”) fruit samples analyzed throughout this work were collected within an experimentation conducted under the FOSCERANET-SECUREFOOD2050 project aimed at testing the possible transfer of chemical contamination in fruits irrigated with different types of TWWs and freshwater (FW) as control. Physicochemical characteristics of TWWs and FW are collected in Table S1 of the Supplementary Materials. To elaborate, the effluents from the following four WWTPs located in the area of Prato (Italy), were used: (i) “Baciacavallo” activated sludge plant (TWW1); (ii) “Macrolotto 1”, a refining system of the Baciacavallo effluent (TWW2); (iii) “Macrolotto 2”, a refining system of the Baciacavallo effluent (TWW 3), and (iv) “Calice” activated sludge plant (TWW4). All the TWWs contained PAHs at concentrations ranging from a few to hundreds of ng/L and PCBs ranging from a few to tens of ng/L (data available in Table S2 of the Supplementary Materials). Full details of the treatment stages are described elsewhere [1,5]. Olive fruits, harvested in November 2021, were transported to the laboratory, immersed in liquid nitrogen, freeze-dried, and stored at −20 °C until they were analyzed. Before analysis, samples were defrosted, dried in an oven at 60 °C for 48 h, and homogenized in a mortar.

2.3. Chromatographic Analysis

PAHs and PCBs extracted from olive samples were analyzed by gas chromatography coupled with mass spectrometry (GC-MS) using an Agilent 6980 series gas chromatograph and an Agilent 5973 Network MS detector controlled by Agilent ChemStation software. The gas chromatograph was provided with an autosampler of the Agilent 7683 Series.
The GC column was a (5%-Phenyl)-methylpolysiloxane column (DB-5 ms, 30 m × 0.25 mm × 25 μm; Agilent). Helium was used as gas carrier (1 mL min−1). MS detection was performed in Single Ion Monitoring (SIM) mode at proper m/z ratio (m/z ratio available upon request). Injections (2 μL) were performed by the pulsed splitless mode (pressure at 40 psi for 2.5 min, injector temperature 280 °C). The oven ramp for CH3CN and CH2Cl2 was set as follows: starting temperature: 80 °C (40 °C for CH3CN), hold for 2 min; ramp to 176 °C, 12 °C min−1 rate; ramp to 196 °C, 5 °C min−1 rate, hold for 3 min; ramp to 224 °C, 12 °C min−1 rate; ramp to 244 °C, 12 °C min−1 rate, hold for 3 min; ramp to 270 °C, 7 °C min−1 rate, hold for 3 min; final ramp to 300 °C, 5 °C min−1, and hold for 10 min to completely clean and restore the GC column. The complete separation of the 16 PAHs and 14 PCBs was obtained within 49 min.

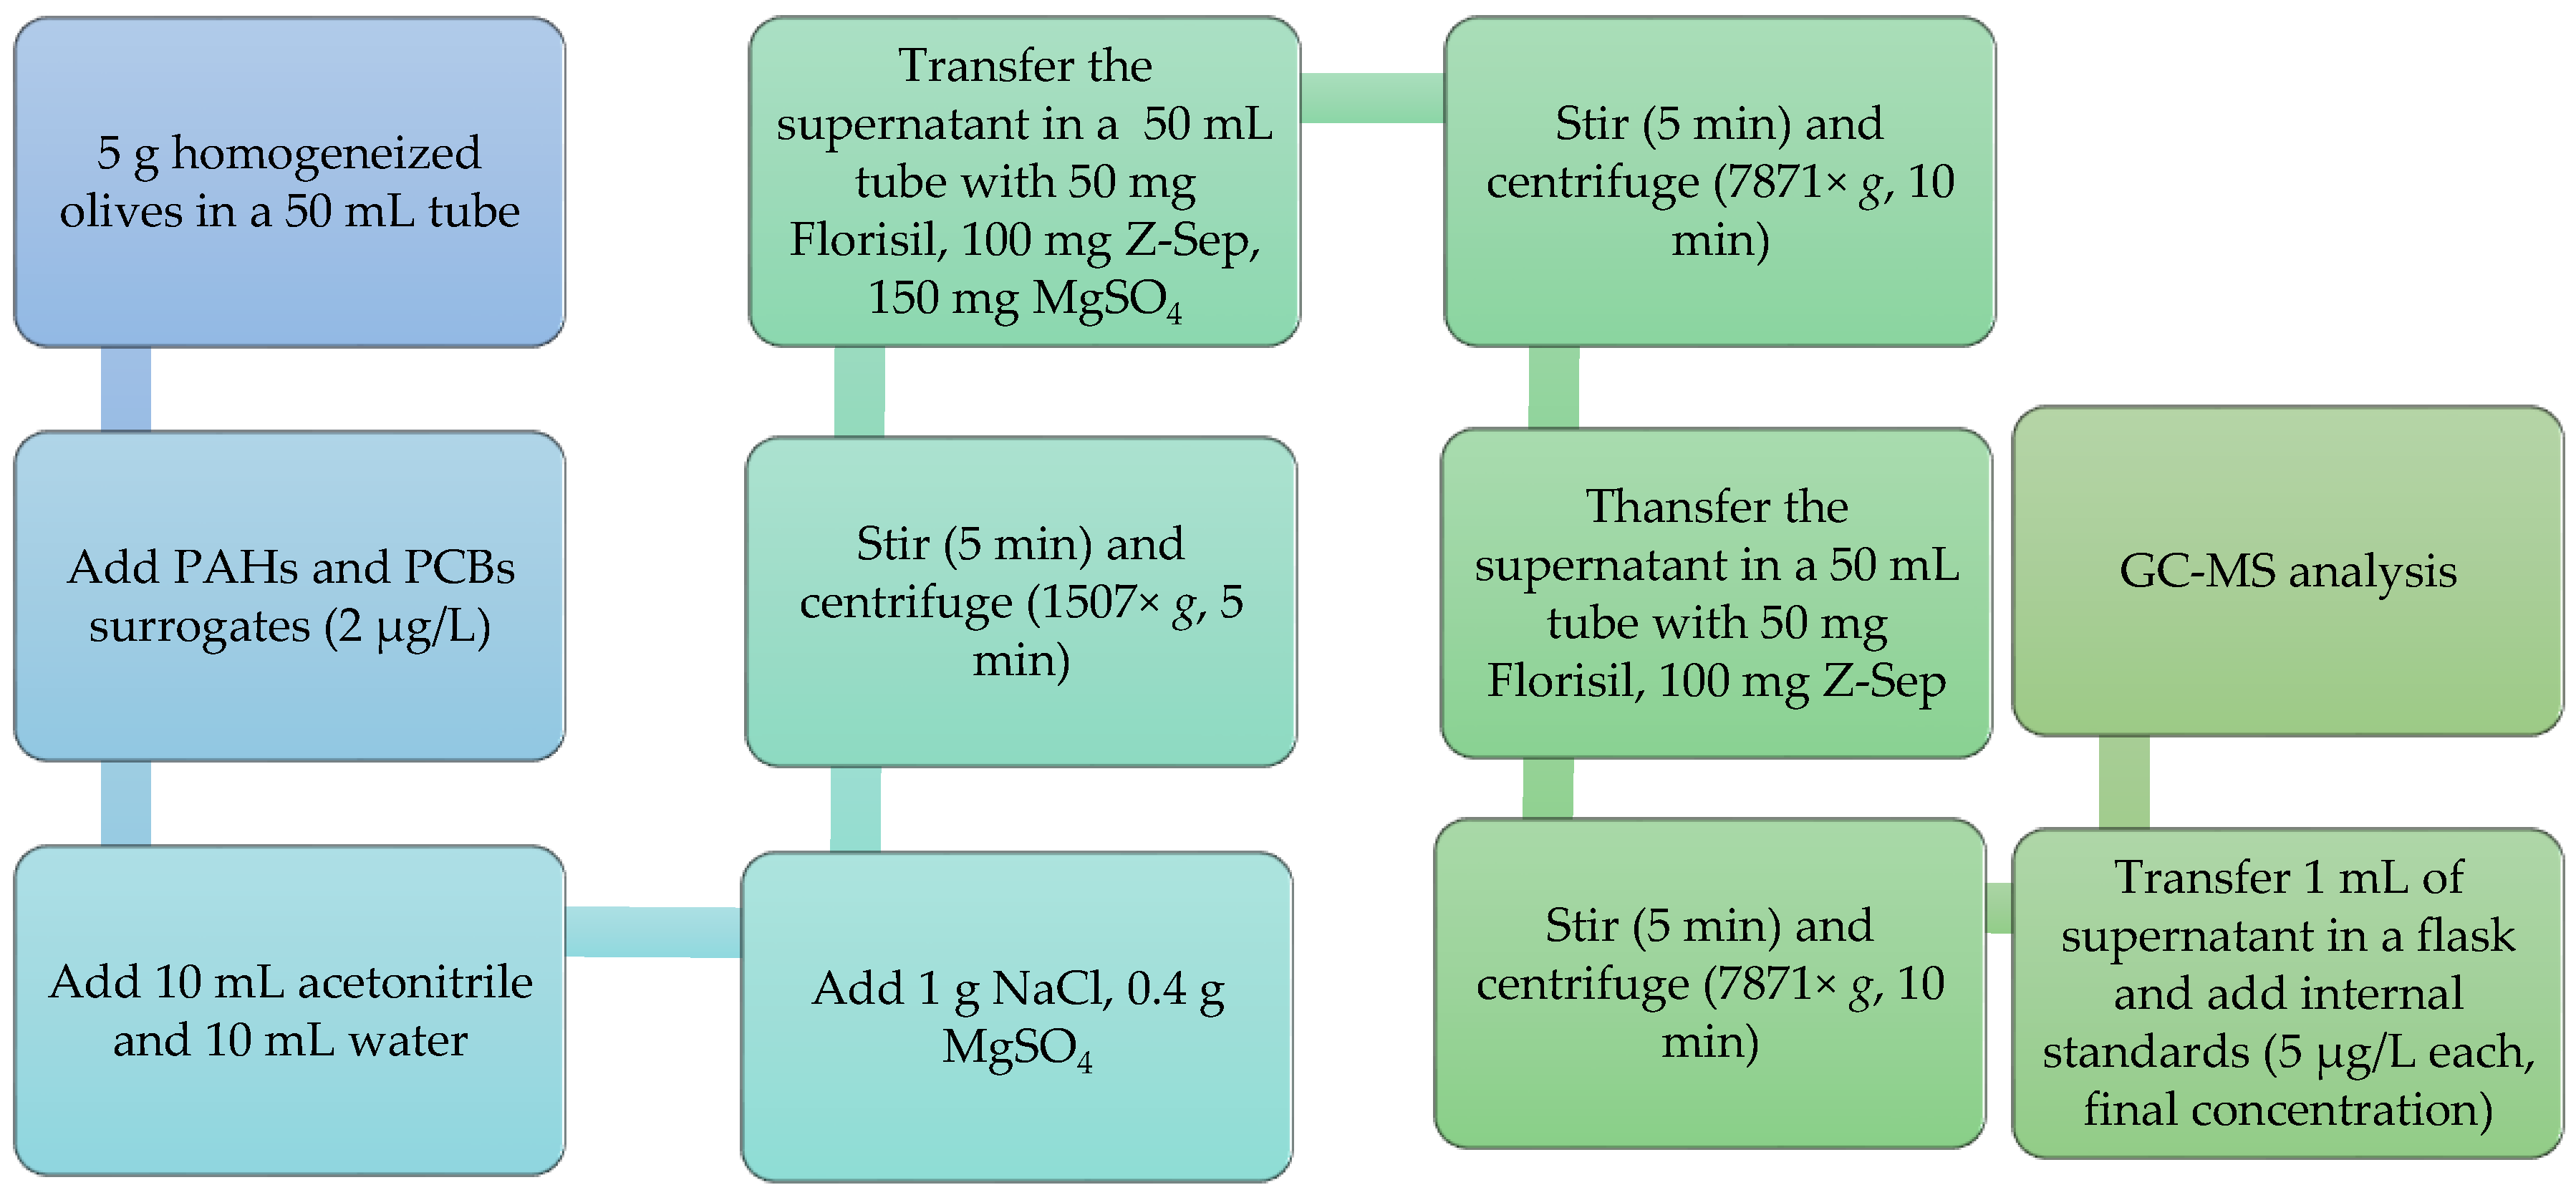
2.4. QuEChERS Extraction and Clean-Up Procedure

After optimization, the final procedure consisted of the extraction of 5 g of olive sample with water and acetonitrile (1:1) with the addition of 1 g NaCl and 0.4 g MgSO4 followed by a double d-SPE purification step. In more detail, the extraction mixture was shaken for 5 min and centrifuged for 5 min (1507× g). For the first d-SPE purification step, the supernatant was transferred in a 50 mL tube containing 50 mg of Florisil, 100 mg Z-Sep and 150 mg MgSO4. The mixture was again shaken for 5 min and centrifuged for 10 min (7871× g). For the second d-SPE purification step, the supernatant was again transferred in a 50 mL tube containing 50 mg of Florisil, 100 mg Z-Sep, shaken for 5 min, and centrifuged for 10 min (7871× g). A 1 mL aliquot of the supernatant was spiked with internal standards (5 µg/L each, final concentration) and injected for GC-MS analysis.

2.5. Method Validation

The performance of the method was assessed evaluating apparent recovery, matrix effect, the method detection, and quantitation limits, linearity and inter-day and intra-day precisions, as hereafter described.

2.6. Apparent Recovery

To evaluate the apparent extraction recoveries (AR%), as defined by IUPAC indications [15,16], before QuEChERS extraction, an homogeneous sample obtained by the mixing of the six olive crops grown under irrigation with TWW1, TWW2, TWW3, TWW4, TWW5, and TWW6 was spiked with surrogate solutions of PAHs and PCBs to achieve a final concentration of 2 μg L−1 (CS). After extraction, the concentrations were calculated by using an external standard calibration curve prepared on the corresponding extraction solvent (acetonitrile or dichloromethane).
The apparent extraction recovery values were calculated according to Equation (1).
AR% = (Ce)/(Cs) × 100
where Ce is the calculated concentration of the surrogate expressed as µg L−1 after extraction according to the calibration curve in solvent.

2.7. Matrix Effect

The matrix effect (ME) was evaluated on a homogeneous sample obtained by the mixing of the six olive crops grown under irrigation with TWW1, TWW2, TWW3, and TWW4. The peak areas corresponding to the surrogates spiked into the purified extract of olive fruits, A(s,olives), were compared with the peak areas corresponding to the surrogates spiked in the extraction solvent mixture A(s,solvent) and subjected to the same extraction and clean-up procedure. The spiked solution of surrogates was 0.6 µg/L.
ME   ( % ) = 100   · A ( s , olives ) A ( s , solvent )   A ( s , solvent )

2.8. Method Detection Limits (MDL) and Method Quantitation Limits (MQL)

The values of MDL and MQL for the thirty target compounds were calculated by means of the response error and the slope of the calibration curve, using the expression MDL = 3.3 Sy/m, and MQL = 10 Sy/m, where Sy = response error and m = slope of the calibration [17,18].

2.9. Linearity

The linearity was evaluated within the concentration range included between 0.50 µg/L and 14 µg/L (ten levels) for PAHs and between 0.40 µg/L and 6.75 µg/L (ten levels) for PCBs in acetonitrile.

2.10. Intra-Day and Inter-Day Precision

The intra-day precision was determined using replicate (n = 5) determinations for olive fruits (the homogeneous sample obtained by the mixing of the six olive crops grown under irrigation with TWW1, TWW2, TWW3, and TWW4) spiked with 2 µg L−1 (corresponding to 0.04 µg/g) surrogate standards, on a single day of analysis. Inter-day precision was calculated using replicate (n = 10) determinations of the same sample after four days.

3. Results and Discussion

The determination of PAHs and PCBs in olives is challenging due to the lipophilic nature of olives. In fact, the extraction of PAHs and PCBs lead to the co-extraction of matrix components, which can interfere with the analysis of the target micropollutants, through the decrease in the extraction recovery, the occurrence of significant matrix effects and/or complex gas chromatographic profiles with co-eluting peaks.
On these premises, an optimization of the extraction and clean-up procedures is necessary to achieve a reliable determination of PAHs and PCBs in olives. The extraction procedures here evaluated are based on the QuEChERS protocol which is by far the election methods for determining pollutant residuals in food [19].
The main parameters affecting the extraction recoveries of QuEChERS protocols are those related to extraction and clean-up steps.
Concerning the extraction step, the main parameter affecting the extraction recoveries is the type of the solvent extraction. Within this study, we investigated the effect of solvents, i.e., dichloromethane, cyclohexane, and acetonitrile, which are commonly employed in QuEChERS procedures [20,21,22]. Being characterized by different polarity (P′ = 3.1, 0.2, 5.8, for dichloromethane, cyclohexane, and acetonitrile, respectively [23]), these solvents can exhibit different extraction capabilities towards micropollutants of interest and interferents in complex matrices.
As regards the clean-up step, the main parameters affecting the extraction recoveries is the type of the d-SPE sorbent, which should be chosen according to the composition of the matrix. In this regard, olives contain up to 35% lipids and 3–6% sugars and other minor compounds, such as hydrocarbons, phenols, terpenes, sterols, alcohols, chlorophyll and carotenoid pigments, and volatile compounds [24]. Among these, chlorophyll and carotenoid pigments are the compounds mainly responsible for the color of green olives.
Within this work, we hence investigated the effects of different d-SPE adsorbents to maximize the removal of interferents, minimizing the adsorption of target PAHs and PCBs and the effect on analyte recovery. In more detail, PSA was chosen for its high affinity for sugars [25], fatty acids, and pigments including chlorophyll [26]; Z-Sep for its affinity to lipids [27]; C18 for its affinity for fats and waxes [26]; and Florisil for its polar characteristics and affinity with pigments such as carotenoids and xantophylls [28]. Furthermore, the effect of sulfuric acid was also tested to improve the removal of co-extracted organic compounds not efficiently removed by d-SPE phases.
The experimental details of the QuEChERS protocols tested are summarized in Table 1, and the extraction recoveries obtained are summarized in Table 2, Table 3 and Table 4. Trials were performed using a representative olive sample constituted by a mixture of olives grown under irrigation with TWW1, TWW2, TWW3, and TWW4. The extraction recovery results will be discussed only for PAHs surrogate compounds as their recovery was observed to be much lower than PCBs surrogate congeners in all the experimental tests.

3.1. Optimization of QuEChERS Extraction: Effects of the Main Parameters

3.1.1. Extractions in Dichloromethane

Table 2 reports the values of apparent extraction recoveries for PAHs obtained using dichloromethane as extraction solvent.
The extraction of micropollutants from olives by dichloromethane and the clean-up with 100 mg PSA (#1) resulted in the fouling of the GC liner, highlighting a background noise in the gas chromatogram (scan mode) and the presence of a certain number of peaks corresponding to co-extracted species, as shown by Figure S1a of the Supplementary Materials. These effects reflected directly on the poor apparent extraction recoveries, which range from 18% (BP-d12) to 55% (Chr-d12), and clearly show the loss of the higher molecular weight congeners (DBA-d14, BP-d12), the recovery of which was around 19%.
The increase in PSA up to 300 mg (#2) improves the apparent recoveries of all the surrogates, which are included within 21% (Ind-d12) and 101% (Chr-d12) but cannot avoid the fouling of the liner. In fact, even when satisfactory AR% are obtained, the instrumental analysis is affected by a progressive signal loss in the subsequent analysis, as well as a high data variability, as expressed by values of relative standard deviations (RSDs) as high as 59%.
Higher amounts of PSA, up to 1 g (data not shown), reduce the extraction recovery due to a possible retention of PAHs by the d-SPE phase, as evidenced elsewhere [25].
The adoption of a purification treatment with 96% H2SO4 after the clean-up with 300 mg PSA (#3) definitively avoids the fouling of the GC liner, providing reproducible results (RSD < 5%). Nevertheless, a co-elution of BaA-d12 and Chr-d12 is observed, together with a loss of signals for the compounds characterized by the lowest sensitivity [9,25] (i.e., the high molecular weight compounds BaP-d12, Ind-d12, and BP-d12).
The combination of the C18 (50 mg) phase with the 300 mg PSA (#4) dramatically reduces the recoveries of PAHs compared to the use of PSA only (#2), thus resulting in AR% included in between 16% (Ind-d12) and 48% (BP-d12), without a significant improvement of the scan mode profile of the gas chromatogram. The decrease in the recoveries is in agreement with the affinity of C18 phase with PAHs observed for some matrices [29].
The combination of the Florisil (50 mg) phase with the 100 mg PSA (#5) partially removes pigments from the extract, which visually appears with pale yellow color, when compared with trials using PSA alone (#1 and #2). Using these conditions, AR% values range between 13% (Ind-d12) and 67% (BaA-d12). Even though the AR% cannot be considered satisfactory, this result suggests the usefulness of the combination of Florisil (which appears selective for more polar compounds) with other well-performing d-SPE phases.
To sum up, despite dichloromethane has shown good extraction efficiency when applied to the extraction of organic micropollutants in some food samples [30], its use in the QuEChERS extraction of PAHs in olives is not recommended with the most common commercially available d-SPE phases designed for fat removal.

3.1.2. Extractions in Cyclohexane

Table 3 reports the values of AR% for PAHs, obtained using cyclohexane as extraction solvent.
The extraction with cyclohexane and the d-SPE step with PSA (#6) provides AR% values included between 24% (BP-d12) and 73% (BaA-d12), which are higher than those previously obtained using similar experimental conditions but with dichloromethane as extracting solvent (#1). The use of a less polar solvent as cyclohexane (P′ = 0.2) limits the extraction of more polar interfering compounds, in comparison with dichloromethane, a solvent of higher P′ value (P′ = 3.1), hence less selective, which exhibits affinity with molecules of different range of polarity. The use of cyclohexane also partially reduces the background noise in the scan mode gas chromatogram and the number and intensity of peaks corresponding to the co-extracted species, as shown in Figure S1b of the Supplementary Materials. This is reflected into slightly better but still unacceptable RSD%, which are included between 3% (BaA-d12) and 41% (BP-d12). As it is expected that cyclohexane extracts very apolar compounds (such as fats), the use of the Z-Sep phase, selective for fats, appears a reasonable choice. Data obtained (not shown) provided improved AR%. Nevertheless, a decrease in RSD% was not observed. As previously observed for extractions in dichloromethane, the use of a mixture of Florisil and Z-Sep (#7) further improved AR% values in comparison with tests with Z-Sep only, being included between 42% (Ind-d12) and 122% (BaP-d12). AR% values obtained under these conditions (Z-Sep + Florisil, #7) are improved in comparison to the extractions performed in dicholoromethane and PSA + Florisil as d-SPE (#5) but a frequent cleaning of the GC liner is still required to obtain reproducible chromatographic runs. Finally, the use of a purification treatment with 96% H2SO4 after the clean-up with 100 mg Z-Sep (#8) in place of Florisil is not recommended as, as previously observed with dichloromethane, the co-elution between BaA-d12 and Chr-d12 is still observed together with a loss of signals for the high molecular weight compounds BaP-d12, Ind-d12, and BP-d12.

3.1.3. Extractions in Acetonitrile

Among the three tested solvents, acetonitrile is the most polar (P′ = 5.8), thus ensuring the extraction of compounds of a wide range of polarity. The presence of salts, after mixing, promotes the extraction and separation of the two phases, i.e., water and acetonitrile. The phase separation, in turn, ensures that the most polar and medium polar compounds can be partitioned in water, obtaining an acetonitrile phase rich in non-polar compounds. The presence of non-polar compounds in acetonitrile is expected to be lower than in cyclohexane due to the difference in the polarity indexes. This assumption is confirmed by a reduced background noise observed in the scan mode gas chromatogram, and by the lower number and height of peaks relating to co-extracted species in respect to the same TIC trace obtained by cyclohexane (see Figure S1b vs. Figure S1c of the Supplementary Materials). In all the experimental conditions tested, the fouling of the liner was not observed, and reproducible analytical runs were obtained, as hereafter detailed.
Based on the best results achieved within this study and previously commented, PSA and Z-Sep were tested as d-SPE phases coupled with Florisil, which appeared selective for removing color from the extracts. Florisil was used in all the trials as, according to Cvetkovic et al. [31], it is expected to improve AR% values for PAHs in more polar extraction solvents.
Table 4 reports the AR% values for PAHs obtained using acetonitrile as extraction solvent.
Table 4. Apparent recoveries, AR% of the QuEChERS trials with acetonitrile listed in Table 1.
AnalytesAR (%) of the QuEChERS Trials
#9#10#11
BaA-d124399122
Chr-d12439194
BbFl-d1244100102
BkFl-d125399102
BaP-d12549698
Ind-d124398102
DBA-d14469897
BP-d123072101
The extraction with acetonitrile and the d-SPE step with PSA and Florisil (#9) provides AR% values included between 30% (BP-d12) and 54% (BaP-d12) with optimal RSD% (<3%) which are indicative of controlled extraction and instrumental conditions. The fair AR% values are ascribed to the residual background noise. A double purification step with PSA and Florisil (#10), as expected, improves the background noise (Figure S2 of the Supplementary Materials) and enhances AR% values which are included between 72% (BP-d12) and 100% (BbFl-d12) with RSD% < 6%. A drastic improvement of the scan mode gas chromatogram background noise and reduction in interfering peaks is achieved by substituting PSA with Z-Sep, in the presence of Florisil, adopting the same double extraction step (#11) as shown in Figure S3 of the Supplementary Materials. In these conditions, AR% values for surrogate PAHs are included within 94% (Chr-d12) and 122% (BaA-d12) with RSD% included within 0.3 and 5%. As regards PCBs, AR% values for surrogates are included within 83% (13C12-PCB180) and 100% (13C12-PCB52) with RSD% included within the range of 0.4–1.7%.
The experimental conditions #11 (extraction in acetonitrile: water 1:1, and double d-SPE purification with Z-Sep and Florisil) are considered optimal for the extraction of micropollutants.

3.2. Validation of the Optimized QuEChERS Procedure

The optimized procedure #11, schematized in Figure 1, is hereafter reported. An aliquot of 5 g olives is extracted with 10 mL water and 10 mL acetonitrile, in the presence of 1 g NaCl and 0.4 g MgSO4. The extraction mixture is shaken for 5 min and centrifuged for 5 min (1507× g). The double d-SPE purification step is performed as described here. The supernatant is transferred in a 50 mL tube containing 50 mg of Florisil, 100 mg Z-Sep, and 150 mg MgSO4. The mixture is again shaken for 5 min and centrifuged for 10 min (7871× g). The supernatant is again transferred in a 50 mL tube containing 50 mg of Florisil, 100 mg Z-Sep, shaken for 5 min, and centrifuged for 10 min (7871× g). A 1 mL aliquot of the supernatant is spiked with internal standards (5 µg/L each, final concentration) and injected for GC-MS analysis.
Validation of the developed method was performed evaluating linearity, intra-day inter-day repeatability, MDL, MQL, and matrix effect.

3.2.1. Linearity

The method denotes good linearity for both classes of compounds over wide concentration ranges: R2 < 0.999 in the range of 0.50 μg/L to 14 μg/L for PAHs, and from 0.40 μg/L to 6.75 μg/L for PCBs.

3.2.2. Method Detection Limits (MDL), Method Quantitation Limits (MQL), and Precision

The method detection and quantitation limits were obtained correcting detection and quantitation limits with the extraction recoveries of surrogates, and they are shown in Table 5.
Intra-day and inter-day precisions were below 2.7% and 2.9%, respectively, thus indicating the good method performance.
Provided that current EU legislation CE 2006/1881 [32] does not set threshold limits for micropollutant in olives, but in oil, the MDL developed by the QuEChERS method satisfy both the requirements set for BaP (2 µg/kg) and for the sum of BaP, BaA, Chr, and BbFl (<10 µg/kg), as well as the limit set for the sum of PCB 28, PCB 52, PCB 101, PCB 138, PCB 153, and PCB 180 (40 µg/kg).
It is also worth mentioning that, for PAHs, the MDLs of the QuEChERS method here developed, obtained without a preconcentration step and using an extremely lower quantity of solvent, are comparable [12] or even better [11] than those obtained by liquid chromatography, coupled with fluorescence detection, on oil after a preconcentration stage of 10- or 100-folds, respectively.

3.2.3. Matrix Effect

The presence of any matrix effect (ME) was evaluated in a representative olive sample constituted by a mixture of olives grown up after irrigation with TWW1, TWW2, TWW3, and TWW4. Results, depicted in Figure 2, indicate that for PAHs, |ME| spans within −20% (BP-d12) and 10% (BaA-d12) and that the method is not systematically influenced by either enhancement or suppression effects, as average ME is −0.2%. For PCBs, |ME| spans within −3 (PCB 118) and −14% (PCB 143). Even if the average ME is still low (−7%), a suppression effect is observed for all the surrogates.

3.3. Determination of PAHs and PCBs in Olive Crops Irrigated with Treated Wastewaters

The optimized validated method was used for the determination of PAHs and PCBs in the olive crops obtained with irrigation by treated waters and freshwater (FW). The results shown in Table 6 indicate that, among the tested PAHs, only Flu and Phe were detected in olives, as shown in Figure 3. It is also worth mentioning that, as Flu was also observed in olives grown up under irrigation with freshwater, atmospheric deposition is an additional contamination source, in agreement with that observed elsewhere [33]. As regards the investigated PCBs, they were not detected (below the method detection limit, see Table 5).
The concentrations of the PAH compounds detected are included in the contamination level of commercially available olive oils of different European countries origin [33] and about 50-fold lower than olive oil consumed by the Indian population [34].
The contamination level adheres to the maximum admitted levels reported by CE 1881/2006, as none of the compounds considered by the EU regulations, including benzo[a]pyrene, were detected.
For all the crops, the toxic equivalency (TEQ) value was evaluated according to (Equation (3)):
TEQ = Σ (TEFPAHi [PAHi])
where [PAHi] is the concentration of the i-th PAH congener and TEFPAHi is the toxicity equivalent factor of the i-PAH congener as reported by Jemenez et al. [35], i.e., Flu: 0.001, Phe: 0.001.
For each olive crop, TEQ values, which were precautionary calculated considering also the presence of Phe at concentrations equal to the MQL for FW, TWW2, TWW3, and TWW4, are 0.0050 (FW), 0.012 (TWW1), 0.0068 (TWW2), 0.0062 (TWW3), and 0.0042 (TWW4) μg/kg. These values reveal the rather similar toxicological impact of TWW2, TWW3, and TWW4 in respect to FW. It is worth mentioning that the highest TEQ value found for TWW2 is actually comparable with the TEQ value estimated for other types of food, such as uncooked fish [36].
Although the per capita daily olive consumption in Europe is different for countries that produce olives (i.e., 11 g/day Cyprus) in respect to countries that do not produce olives (i.e., 2.4 g/day Sweden) [37], as none of the PAH2 (BaP and Chr), PAH4 (the sum of BaP, Chr, BaA, and BbFl), PAH8 (BaP, Chr, BaA, BbFl, BkFl, BP, DBA, and Ind) compounds were found in olives, additional risk assessment was not performed.

4. Conclusions

A simple analytical procedure based on QuEChERS extraction and further analysis by gas chromatography coupled with mass spectrometric detection was here developed for the analysis of the 16 EPA PAHs and 14 PCBs, including six out of the twelve dioxin-like compounds in olive fruits. Through an in-depth investigation on the effects of the main parameters on the QuEChERS extraction (extraction solvent, d-SPE phase), it was possible to elucidate the capabilities of the three tested solvents (dichloromethane, cyclohexane, and acetonitrile) towards the co-extraction of matrix interfering compounds of a wide range of polarity such as the ones present in olives (lipid, sugars, hydrocarbons, phenols, terpenes, sterols, alcohols, chlorophyll, and carotenoid pigments). The Florisil d-SPE phase proved to be the most suitable phase in removing polar compounds in acetonitrile, the optimal extraction solvent. The simultaneous use of Florisil and Z-Sep ensures the removal of hydrophobic compounds such as fats.
To the best of our knowledge, the method optimized in this research represents the first validated analytical approach for this fruit matrix, as, in the literature, deep investigations are available only for edible oils. The QuEChERS method here developed for olive analysis represents a green alternative to traditional sample preparation steps.
The proposed method was applied to the monitoring of the chemical safety of olives grown up under irrigation with treated wastewaters effluents of four treatment water plants located in Italy.
The obtained results provide evidence that, with only one exception, the toxic equivalency of olives grown up with TWW is similar to that obtained for olives grown up with irrigation with freshwater (control), thus suggesting a low impact of the investigated TWWs in the transfer of PAHs and PCBs to olive fruits, thus supporting circular economy actions.

Supplementary Materials

The following supporting information can be downloaded at: https://www.mdpi.com/article/10.3390/separations9030082/s1, Figure S1: Effect of the extracting solvent on the GC background noise. Chromatogram tracks (scan mode) of not labelled olive samples extracted by (a) dichloromethane, (b) cyclohexane, and (c) acetonitrile are shown. Instrumental conditions are reported in the manuscript. Figure S2: Effect of single (purple line) and double (red line) purification with 100 mg PSA + 50 mg Florisil, after extraction with acetonitrile on the background noise. Chromatogram tracks (scan mode) are reported. Figure S3: Comparison of chromatogram tracks (scan mode) after extraction with acetonitrile and a double step of purification with 100 mg PSA + 50 mg Florisil (green line) and 100 mg Z-Sep + 50 mg Florisil (black line). Table S1—Mean values (n = 3) and standard deviations (in brackets) of physicochemical parameters of FW and TWWs in the period July-November 2021. Limits considered in the Italian regulations for wastewater reuse (D.M. 185/2003) are also shown. Table S2: Mean values and concentration ranges of PAHs in treated wastewaters waters (TWW) used for irrigation, sampled within July and November 2021. Table S3: Mean values and concentration ranges of PCBs in treated wastewaters waters (TWW) used for irrigation, sampled within July and November 2021.

Author Contributions

Conceptualization, M.C.B. and M.D.B.; methodology, L.R. and M.C.B.; validation, M.C., L.R. and M.C.B.; investigation, M.C. and E.C.; resources, D.F. and M.D.B.; data curation, L.R. and M.C.; writing—original draft preparation, M.C.B. and L.R.; review and editing, M.C. and M.D.B.; visualization, M.D.B., A.K. and D.F.; supervision, M.C.B.; project administration, M.C.B. and M.D.B.; funding acquisition, M.D.B. and M.C.B. All authors have read and agreed to the published version of the manuscript.

Funding

Part of this research was supported by the grant for SECUREFOOD2050 project, under the FOSCERANET 2019 joint call, which is gratefully acknowledged. Ministero dell’Istruzione, dell’Università e della Ricerca (MIUR) is also acknowledged.

Institutional Review Board Statement

Not applicable.

Informed Consent Statement

Not applicable.

Data Availability Statement

Not applicable.

Acknowledgments

The authors wish to thank Luigia Cristiana Salucci for the laboratory technical support.

Conflicts of Interest

The authors declare no conflict of interest.

References

  1. Rivoira, L.; Castiglioni, M.; Kettab, A.; Ouazzani, N.; Al-Karablieh, E.; Boujelben, N.; Fibbi, D.; Coppini, E.; Giordani, E.; Del Bubba, M. Impact of effluents from wastewater treatments reused for irrigation: Strawberry as case study. Environ. Eng. Manag. J. (EEMJ) 2019, 18, 2133–2143. [Google Scholar]
  2. Renai, L.; Tozzi, F.; Scordo, C.V.; Giordani, E.; Bruzzoniti, M.C.; Fibbi, D.; Mandi, L.; Ouazzani, N.; Del Bubba, M. Productivity and nutritional and nutraceutical value of strawberry fruits (Fragaria × ananassa Duch.) cultivated under irrigation with treated wastewaters. J. Sci. Food Agric. 2021, 101, 1239–1246. [Google Scholar] [CrossRef]
  3. Mcheik, M.; Toufaily, J.; Haj Hassan, B.; Hamieh, T.; Abi Saab, M.T.; Rouphael, Y.; Ferracin, E.; da Shio, B.; Bashabshah, I.; Al Hadidi, L. Reuse of treated municipal wastewater in irrigation: A case study from Lebanon and Jordan. Water Environ. J. 2017, 31, 552–558. [Google Scholar] [CrossRef]
  4. Djillali, Y.; Chabaca, M.N.; Benziada, S.; Bouanani, H.; Mandi, L.; Bruzzoniti, M.; Boujelben, N.; Kettab, A. Effect of treated wastewater on strawberry. Desalin. Water Treat. 2020, 181, 338–345. [Google Scholar] [CrossRef]
  5. Scordo, C.V.A.; Checchini, L.; Renai, L.; Orlandini, S.; Bruzzoniti, M.C.; Fibbi, D.; Mandi, L.; Ouazzani, N.; Del Bubba, M. Optimization and validation of a method based on QuEChERS extraction and liquid chromatographic-tandem mass spectrometric analysis for the determination of perfluoroalkyl acids in strawberry and olive fruits, as model crops with different matrix characteristics. J. Chromatogr. A 2020, 1621, 461038. [Google Scholar] [PubMed]
  6. Jaramillo, M.F.; Restrepo, I. Wastewater Reuse in Agriculture: A Review about Its Limitations and Benefits. Sustainability 2017, 9, 1734. [Google Scholar] [CrossRef] [Green Version]
  7. Khalid, S.; Shahid, M.; Natasha; Bibi, I.; Sarwar, T.; Shah, A.H.; Niazi, N.K. A Review of Environmental Contamination and Health Risk Assessment of Wastewater Use for Crop Irrigation with a Focus on Low and High-Income Countries. Int. J. Environ. Res. Public Health 2018, 15, 895. [Google Scholar] [CrossRef] [Green Version]
  8. Renai, L.; Tozzi, F.; Checchini, L.; Del Bubba, M. Impact of the use of treated wastewater for agricultural need: Behavior of organic micropollutants in soil, transfer to crops, and related risks. Adv. Chem. Pollut. Environ. Manag. Prot. 2020, 6, 103–135. [Google Scholar] [CrossRef]
  9. Bruzzoniti, M.C.; Rivoira, L.; Castiglioni, M.; El Ghadraoui, A.; Ahmali, A.; El Mansour, T.E.H.; Mandi, L.; Ouazzani, N.; Del Bubba, M. Extraction of polycyclic aromatic hydrocarbons and polychlorinated biphenyls from urban and olive mill wastewaters intended for reuse in agricultural irrigation. J. AOAC Int. 2020, 103, 382–391. [Google Scholar] [CrossRef] [PubMed]
  10. Diez, C.M.; Trujillo, I.; Martinez-Urdiroz, N.; Barranco, D.; Rallo, L.; Marfil, P.; Gaut, B.S. Olive domestication and diversification in the Mediterranean Basin. New Phytol. 2015, 206, 436–447. [Google Scholar] [CrossRef]
  11. Gharbi, I.; Moret, S.; Chaari, O.; Issaoui, M.; Conte, L.S.; Lucci, P.; Hammami, M. Evaluation of hydrocarbon contaminants in olives and virgin olive oils from Tunisia. Food Control 2017, 75, 160–166. [Google Scholar] [CrossRef]
  12. Costopoulou, D.; Vassiliadou, I.; Chrysafidis, D.; Bergele, K.; Tzavara, E.; Tzamtzis, V.; Leondiadis, L. Determination of PCDD/F, dioxin-like PCB and PAH levels in olive and olive oil samples from areas affected by the fires in summer 2007 in Greece. Chemosphere 2010, 79, 285–291. [Google Scholar] [CrossRef] [PubMed]
  13. Altunoğlu, Y.; Yemişçioğlu, F. Determination of polycyclic aromatic hydrocarbons in olives exposed to three different industrial sources and in their respective oils. Food Addit. Contam. Part A 2021, 38, 439–451. [Google Scholar] [CrossRef]
  14. Santana-Mayor, Á.; Socas-Rodríguez, B.; Herrera-Herrera, A.V.; Rodríguez-Delgado, M.Á. Current trends in QuEChERS method. A versatile procedure for food, environmental and biological analysis. TrAC Trends Anal. Chem. 2019, 116, 214–235. [Google Scholar] [CrossRef]
  15. Burns, D.T.; Danzer, K.; Townshend, A. Use of the term” recovery” and” apparent recovery” in analytical procedures (IUPAC Recommendations 2002). Pure Appl. Chem. 2002, 74, 2201–2205. [Google Scholar] [CrossRef]
  16. Thompson, M.; Ellison, S.L.; Fajgelj, A.; Willetts, P.; Wood, R. Harmonized guidelines for the use of recovery information in analytical measurement. Pure Appl. Chem. 1999, 71, 337–348. [Google Scholar] [CrossRef]
  17. Shrivastava, A.; Gupta, V. Methods for the determination of limit of detection and limit of quantitation of the analytical methods. Young Sci. 2011, 2, 21–25. [Google Scholar] [CrossRef]
  18. Guidance, A.D.L. Laboratory Guide for Determining Method Detection Limits; Laboratory Certification Program April; Wisconsin Department of Natural Resources: Madison, WI, USA, 1996.
  19. Anastassiades, M.; Scherbaum, E.; Tasdelen, B.; Stajnbaher, D. Recent developments in QuEChERS methodology for pesticide multiresidue analysis. In Pesticide Chemistry: Crop Protection, Public Health, Environmental Safety; Wiley: Hoboken, NJ, USA, 2007; Volume 46, pp. 439–458. [Google Scholar]
  20. Rouvière, F.; Buleté, A.; Cren-Olivé, C.; Arnaudguilhem, C. Multiresidue analysis of aromatic organochlorines in soil by gas chromatography-mass spectrometry and QuEChERS extraction based on water/dichloromethane partitioning. Comparison with accelerated solvent extraction. Talanta 2012, 93, 336–344. [Google Scholar] [CrossRef] [PubMed]
  21. Zhang, W.; Xu, J.; Dong, F.; Liu, X.; Zhang, Y.; Tao, Y.; Wu, X.; Zheng, Y. Simultaneous determination of three strobilurin fungicide residues in fruits, vegetables and soil by a modified quick, easy, cheap, effective, rugged (QuEChERS) method coupled with gas chromatography-tandem mass spectrometry. Anal. Methods 2013, 5, 7102–7109. [Google Scholar] [CrossRef]
  22. Bruzzoniti, M.C.; Checchini, L.; De Carlo, R.M.; Orlandini, S.; Rivoira, L.; Del Bubba, M. QuEChERS sample preparation for the determination of pesticides and other organic residues in environmental matrices: A critical review. Anal. Bioanal. Chem. 2014, 406, 4089–4116. [Google Scholar] [CrossRef]
  23. Snyder, L.R.; Kirkland, J.J.; Glajch, J.L. Practical HPLC Method Development; John Wiley & Sons: Hoboken, NJ, USA, 2012. [Google Scholar]
  24. Gandul-Rojas, B.; Roca, M.; Gallardo-Guerrero, L. Chlorophylls and carotenoids in food products from olive tree. In Products from Olive Tree; IntechOpen: London, UK, 2016; pp. 67–98. [Google Scholar]
  25. Castiglioni, M.; Onida, B.; Rivoira, L.; Del Bubba, M.; Ronchetti, S.; Bruzzoniti, M.C. Amino groups modified SBA-15 for dispersive-solid phase extraction in the analysis of micropollutants by QuEchERS approach. J. Chromatogr. A 2021, 1645, 462107. [Google Scholar] [CrossRef] [PubMed]
  26. Rejczak, T.; Tuzimski, T. A review of recent developments and trends in the QuEChERS sample preparation approach. Open Chem. 2015, 13, 980–1010. [Google Scholar] [CrossRef]
  27. Rajski, Ł.; Lozano, A.; Uclés, A.; Ferrer, C.; Fernández-Alba, A.R. Determination of pesticide residues in high oil vegetal commodities by using various multi-residue methods and clean-ups followed by liquid chromatography tandem mass spectrometry. J. Chromatogr. A 2013, 1304, 109–120. [Google Scholar] [CrossRef] [PubMed]
  28. Ahmad, A.; Chan, C.; Abd Shukor, S.; Mashitah, M. Adsorption kinetics and thermodynamics of β-carotene on silica-based adsorbent. Chem. Eng. J. 2009, 148, 378–384. [Google Scholar] [CrossRef]
  29. Lucas, D.; Zhao, L. PAH analysis in salmon with enhanced matrix removal. In Agilent Technologies Application Note; Agilent Technologies: Palo Alto, CA, USA, 2015. [Google Scholar]
  30. Sun, H.; Ge, X.; Lv, Y.; Wang, A. Application of accelerated solvent extraction in the analysis of organic contaminants, bioactive and nutritional compounds in food and feed. J. Chromatogr. A 2012, 1237, 1–23. [Google Scholar] [CrossRef] [PubMed]
  31. Cvetkovic, J.S.; Mitic, V.D.; Jovanovic, V.P.S.; Dimitrijevic, M.V.; Petrovic, G.M.; Nikolic-Mandic, S.D.; Stojanovic, G.S. Optimization of the QuEChERS extraction procedure for the determination of polycyclic aromatic hydrocarbons in soil by gas chromatography-mass spectrometry. Anal. Methods 2016, 8, 1711–1720. [Google Scholar] [CrossRef]
  32. European Commission. Commission Regulation (EC) No 1881/2006 of 19 December 2006 setting maximum levels for certain contaminants in foodstuffs. Off. J. Eur. Union 2006, 364, 5–24. [Google Scholar]
  33. Ekner, H.; Dreij, K.; Sadiktsis, I. Determination of polycyclic aromatic hydrocarbons in commercial olive oils by HPLC/GC/MS–Occurrence, composition and sources. Food Control 2022, 132, 108528. [Google Scholar] [CrossRef]
  34. Pandey, M.K.; Mishra, K.K.; Khanna, S.K.; Das, M. Detection of polycyclic aromatic hydrocarbons in commonly consumed edible oils and their likely intake in the Indian population. J. Am. Oil Chem. Soc. 2004, 81, 1131–1136. [Google Scholar] [CrossRef]
  35. Jimenez, A.; Adisa, A.; Woodham, C.; Saleh, M. Determination of polycyclic aromatic hydrocarbons in roasted coffee. J. Environ. Sci. Health Part B 2014, 49, 828–835. [Google Scholar] [CrossRef] [Green Version]
  36. Masuda, M.; Wang, Q.; Tokumura, M.; Miyake, Y.; Amagai, T. Simultaneous determination of polycyclic aromatic hydrocarbons and their chlorinated derivatives in grilled foods. Ecotoxicol. Environ. Saf. 2019, 178, 188–194. [Google Scholar] [CrossRef] [PubMed]
  37. Centre for the Promotion of Imports from Developing Countries (CBI). The European Market Potential for Table Olives. 2022. Available online: https://www.cbi.eu/market-information/processed-fruit-vegetables-edible-nuts/table-olives/market-potential (accessed on 13 March 2022).
Figure 1. Schematic representation of the optimized QuEChERS method for the analysis of PAHs and PCBs in olive crops.
Separations 09 00082 g001
Figure 2. Matrix effect of the developed QuEChERS method for PAHs and PCBs. The sample is a mixture of olive crops grown up with irrigation with TWW1, TWW2, TWW3, and TWW4.
Separations 09 00082 g002
Figure 3. Gas-chromatogram of QuEChERS extracts of olives grown up with irrigation with TWW1. Mixed SIM extracted signal for Flu (m/z 166) and Phe (m/z 178). Chromatographic conditions detailed in the Materials and Methods section.
Separations 09 00082 g003
Table 1. Details of the QuEChERS procedures tested for the extraction of PAHs and PCBs from olive fruits.
QuEChERS TrialConditions
ExtractionClean Up
#110 mL dichloromethane:water a100 mg PSA b
#2300 mg PSA b
#3300 mg PSA b, 2 mL 96% H2SO4 c
#4300 mg PSA, 50 mg C18 b
#5100 mg PSA, 50 mg Florisil b
#610 mL cyclohexane:water a100 mg PSA b
#7100 mg Z-Sep, 50 mg Florisil b
#8100 mg Z-Sep b, 2 mL 96%H2SO4 c
#910 mL acetonitrile:water a100 mg PSA, 50 mg Florisil b
#10100 mg PSA, 50 mg Florisil b, 100 mg PSA, 50 mg Florisil d
#11100 mg Z-Sep, 50 mg Florisil b, 100 mg Z-Sep, 50 mg Florisil d
a In the presence of 1 g NaCl and 0.4 g MgSO4 shaken for 5 min and centrifuged for 5 min (1507× g). b In 7 mL of supernatant in the presence of 0.15 g MgSO4 shaken for 5 min and centrifuged for 10 min (7871× g). c In 5 mL of supernatant and 2 mL 96% H2SO4 (30 min), stirred for 5 min and centrifuged for 10 min (1968× g). d In 5 mL of supernatant shaken for 5 min and centrifuged for 10 min (7871× g).
Table 2. Apparent recoveries, AR% of the QuEChERS trials with dichloromethane listed in Table 1.
AnalytesAR (%) of the QuEChERS Trials
#1#2#3#4#5
BaA-d124995*3267
Chr-d1255101*2465
BbFl-d122477922752
BkFl-d123094742446
BaP-d122564**3038
Ind-d122721**1613
DBA-d141931222820
BP-d121841**4825
* Co-eluted analytes; ** Undetected analytes.
Table 3. Apparent recoveries, AR% of the QuEChERS trials with cyclohexane listed in Table 1.
AnalytesAR (%) of the QuEChERS Trials
#6#7#8
BaA-d127387*
Chr-d127194*
BbFl-d12405361
BkFl-d12525134
BaP-d1232122**
Ind-d123642**
DBA-d143391105
BP-d122432**
* Co-eluted analytes; ** Undetected analytes.
Table 5. Method detection (MDL) a quantitation (MQL) limits for the target PAHs and PCBs. Concentrations are expressed in µg/kg.
CompoundMDLMQLCompoundMDLMQL
Naph0.732.2PCB 110.601.8
AcPY0.431.3PCB 150.170.52
AcPh0.170.52PCB 280.200.60
Flu0.431.3PCB 520.180.54
Phe0.972.9* PCB 810.371.1
Ant0.972.9PCB 1010.140.42
Flth0.571.7* PCB 1180.300.91
Pyr0.531.6* PCB 1230.310.93
BaA0.832.5PCB 1380.301.2
Chr1.03.1PCB 1530.120.36
BbFl0.872.6* PCB 1670.371.1
BkFl0.832.5* PCB 1690.802.4
BaP0.601.8PCB 1800.180.54
Ind0.772.3* PCB 1890.431.3
DBA1.13.3
BP0.702.1
*: dioxin-like congeners.
Table 6. Analysis of PAHs and PCBs in olives grown up after irrigation with treated wastewaters.
CompoundConcentration (µg/kg) (a)
FWTWW1TWW2TWW3TWW4
Flu2.0 ± 0.15.5 ± 0.7 3.9 ± 0.13.3 ± 0.11.3 ± 0.1
Phe<MQL6.4 ± 1<MQL<MQL<MQL
(a): PCBs not detected, below the MDL.
Publisher’s Note: MDPI stays neutral with regard to jurisdictional claims in published maps and institutional affiliations.

