Article

Comparative Evaluation of Membrane Filtration on the Tertiary Treatment of Synthetic Secondary Effluent

1
Civil Engineering, College of Engineering, American University of Sharjah, Sharjah P.O. Box 26666, United Arab Emirates
2
Jacobs, Madinat Zayed Office Tower, Muror Rd, Abu Dhabi P.O. Box 57788, United Arab Emirates
*
Author to whom correspondence should be addressed.
Separations 2022, 9(3), 63; https://doi.org/10.3390/separations9030063
Submission received: 5 February 2022 / Revised: 22 February 2022 / Accepted: 25 February 2022 / Published: 28 February 2022

Abstract

:
Wastewater reuse is essential for sustainable water management. However, it requires tertiary treatment within the plant to ensure suitable water quality. This project aims to investigate the comparative performance of conventional tertiary treatment (sand filtration) against membrane filtration technology to demonstrate the viability of membrane treatment for wastewater reuse. Sand filtration along with two membrane filtrations, Nano Filtration (NF) and Reverse Osmosis (RO), were tested for their efficiency in removing the target pollutants: chromium, phosphate, and UV-254 from secondary effluent. Standard medium-sized laboratory setups were used. Synthetic secondary effluent was used for comparison among the different treatment processes. The synthetic effluent was compared to the real wastewater to demonstrate the reliability of using synthetic effluent. Evaluation of the role of time and pressure on the treatment efficiency was also examined. Based on the experimental results, RO had the highest removal efficiency for all pollutants with more than 90% removal. The experimental results also showed that synthetic wastewater was reliable in representing the treatability of real wastewater. Time did not seem to have an impact on the quality of filtration. Moreover, as pressure increased there was a slight increase in the efficiency. This trend was observed in all pollutants except UV-254. ANOVA showed different results of the effect of pressure on the removal efficiency in both RO and NF as well as time in NF.

1. Introduction

Water availability and security are major concerns for many countries around the world. Both developed and developing countries are experiencing water shortages due to rapid urbanization. The increase in population and economic development in developed nations have increased water demand, while its quality supply remains under threat due to pollution and global warming [1]. However, due to the continuous advancement in water treatment technologies, opportunities for the use of different source waters increased to meet the rising water demand. Alternative water sources such as treated wastewater, desalinated seawater, and imported water are being used to supplement the existing water supply [2]. Wastewater reuse can eliminate the necessity of safe wastewater disposal and can be considered essential for sustainable water resource management.
The biggest challenge for sustainable wastewater reuse is the general perception of toxic exposure to human health and the ecosystem. For this reason, water quality assessments are critical in the evaluation of reusability [3]. Water-borne diseases can be kept at bay if efficient water treatment methods are carried out before reuse [4]. Unfortunately, emerging pollutants are being discovered in water sources due to pollution. Thus, efficient water treatment has become a challenge since pollution presents numerous obstacles to obtaining high water quality for reuse. Additionally, there is not a universally adopted water treatment method for water reuse, even though sand filtration is common for tertiary treatment of wastewater [5]. It all depends on the particular source of water, its characteristics, and the water quality standard of that particular area [6]. Moreover, the scarcity of water will be a major threat in the future, and this will necessitate increased water reuse. For this reason, tertiary treatment will be essential and sand-filtration-based tertiary treatment may not ensure the necessary quality. In the Middle East, there is a heavy reliance on groundwater, particularly for agricultural use [7]. However, due to over-extraction and lack of natural and/or artificial recharge, groundwater sources are becoming unsustainable. In the UAE, specifically, it is predicted that in 55 years all groundwater will run out [8]. On the contrary, water consumption per capita in UAE is among the highest in the world, even though available good quality water sources are running out. The culture of this region is such that people do not readily accept the reuse of treated wastewater. However, countries like Singapore have implemented the ‘toilet to tap’ concept since their reliable water sources ran out [9]. High water consumption and scarcity are making it essential to find an alternative and sustainable source of water. The culture in this region needs to adapt to the reuse of wastewater for purposes like irrigation and toilet flushing by addressing the challenge of quality [10].
As more wastewater is being disposed of from households and industries, the research communities are working hard to find new ways of treating wastewater to limit the environmental and health aspects and increase the potential for reuse [11]. The continuous addition of different pollutants exists in wastewater and limits the reusability. Firstly, heavy metals like mercury, copper, and chromium can be found in wastewater, but they are not easy to remove [12]. These metals are vital for living beings; however, high concentrations can be dangerous to the environment and humans. For example, chromium, which is widely used in various industries like ceramics, textiles, and alloying, is carcinogenic and can cause serious diseases [13,14]. Secondly, domestic wastewater can contain an excessive amount of nutrients like phosphorus [15]. These nutrients cause eutrophication and algal bloom, which can reduce the dissolved oxygen levels in the water. Thirdly, organic materials can pose threats to human life, aquatic life, wildlife, etc. [16]. These pollutants must be targeted to increase the reusability of the wastewater.
Typical advanced wastewater treatment plants use sand filtration as a tertiary process option. In recent times, membrane technologies have drawn a lot of interest for the treatment of wastewater [17]. Membrane technology can be defined as a process that removes contaminants of varied sizes from gas and liquid mixtures based on their pore size and permeability. The water that passes through the membrane is called permeate whereas the water that stays behind with all the pollutants in it is called the concentrate [18]. With membrane technology, the removal of various pollutants without the use of chemicals can be achieved [19]. For this reason, they are often preferred to chemical processes. The two most efficient membrane technologies in terms of pollutants removal are Nano-filtration (NF) and Reverse Osmosis (RO) [20]. The specifications of each membrane enable them to remove a wide range of pollutants. Both membranes are efficient in the removal of phosphorus and nitrogen contaminants [21]. However, they are not very common for wastewater treatment due to high energy consumption and maintenance requirements. Other advanced membrane filtration methods include microfiltration and ultrafiltration. These methods are known to be effective in treating both greywater and wastewater [22]. However, they are not as efficient for reuse as RO and NF. Even though RO and NF are not as common in wastewater as they are for drinking water, the added value of reuse can make the use of these membranes cost-effective. For this reason, the effectiveness of RO and NF against traditional sand filtration needs investigation.
Membrane technologies have some constraints of their own. It is recommended to pretreat the water to a level where the membrane is prevented from addressing problems like fouling. The clean feed would ensure that fouling and blocking of filters only occur after a long span of usage and not early on. Backwashes can be planned by constantly monitoring the water quality parameters. As soon as the parameters do not meet the standard qualities, backwash and cleanup of filters should be completed. In addition, the high energy consumption required for membrane technologies such as RO is one of its constraints. However, research is ongoing on using renewable or hybrid energy sources such as solar energy [23].
Designing wastewater treatment plants should be executed in a way that satisfies a standard water quality level. Cost and efficiency are very intricate parameters when it comes to a water treatment plant design [24]. Therefore, numerous studies have been conducted on these membrane technologies that investigate their efficiency of pollutants removal. Tertiary treatment of secondary effluent (from biological treatment) has the potential to ensure high quality of treated water reuse. It can justify the additional cost of replacing the existing sand filtration units with the membrane filtration units. Among the different technologies investigated for reuse, there are coagulation [25], anaerobic baffled reactor [26], chitosan modified membrane [27], adsorption [28,29,30,31,32], and activated sludge [33]. Other than treatment technologies, the integration of energy and water systems are also explored for suitable reuse options [34]. However, application of membrane technology is becoming popular as it does not generate as much waste residual as other chemical processes.
It is important to compare and understand the removal efficiencies of pollutants from synthetic wastewater using different technologies. This is because sometimes it is difficult and not practical to obtain a large amount of real wastewater to collect, preserve, and test, and synthetic wastewater can have less inherent variability in characteristics than real wastewater, which can make experiments on a specific pollutant more complicated. Moreover, there are already studies about using RO, NF, and sand filtration to treat wastewater individually, but no studies are comparing all different filtration technologies at the same time to demonstrate the effective treatability of the membrane technologies.
The objectives of this paper were to compare the treatability of secondary synthetic effluent using RO, NF, and conventional sand filtration. The study also explored comparative treatability between synthetic and real wastewater using RO to ensure the reliability of the experiments conducted using synthetic wastewater. The study also explored the role of pressure and time on the treatability of synthetic wastewater by NF and RO. Finally, ANOVA analysis was conducted on the role of pressure and time. Pilot experimental setups were used to achieve the objectives. The study is novel as it examined improvement in water quality using membrane technologies against sand filtration under controlled experimental condition. The study is also novel with examination of water quality parameters essential for wastewater reuse by replacing sand filtration with membrane technologies during tertiary treatment of secondary effluent.

2. Materials and Methods

2.1. Preparation of Secondary Wastewater

To prepare synthetic wastewater, 389.4 mg of meat extract, 66 mg of chromium oxide and 1452 mg of potassium hydrogen phosphate were mixed with 66 L of water. The mixture was then diluted 10 times to represent a secondary effluent (treated water from biological process). All added compounds and concentrations needed are based on previous studies [7,8,34]. Real secondary effluents were collected from Sharjah Treatment Plant. The concentrations of each pollutant are also shown below in Table 1.

2.2. Experimental Setup

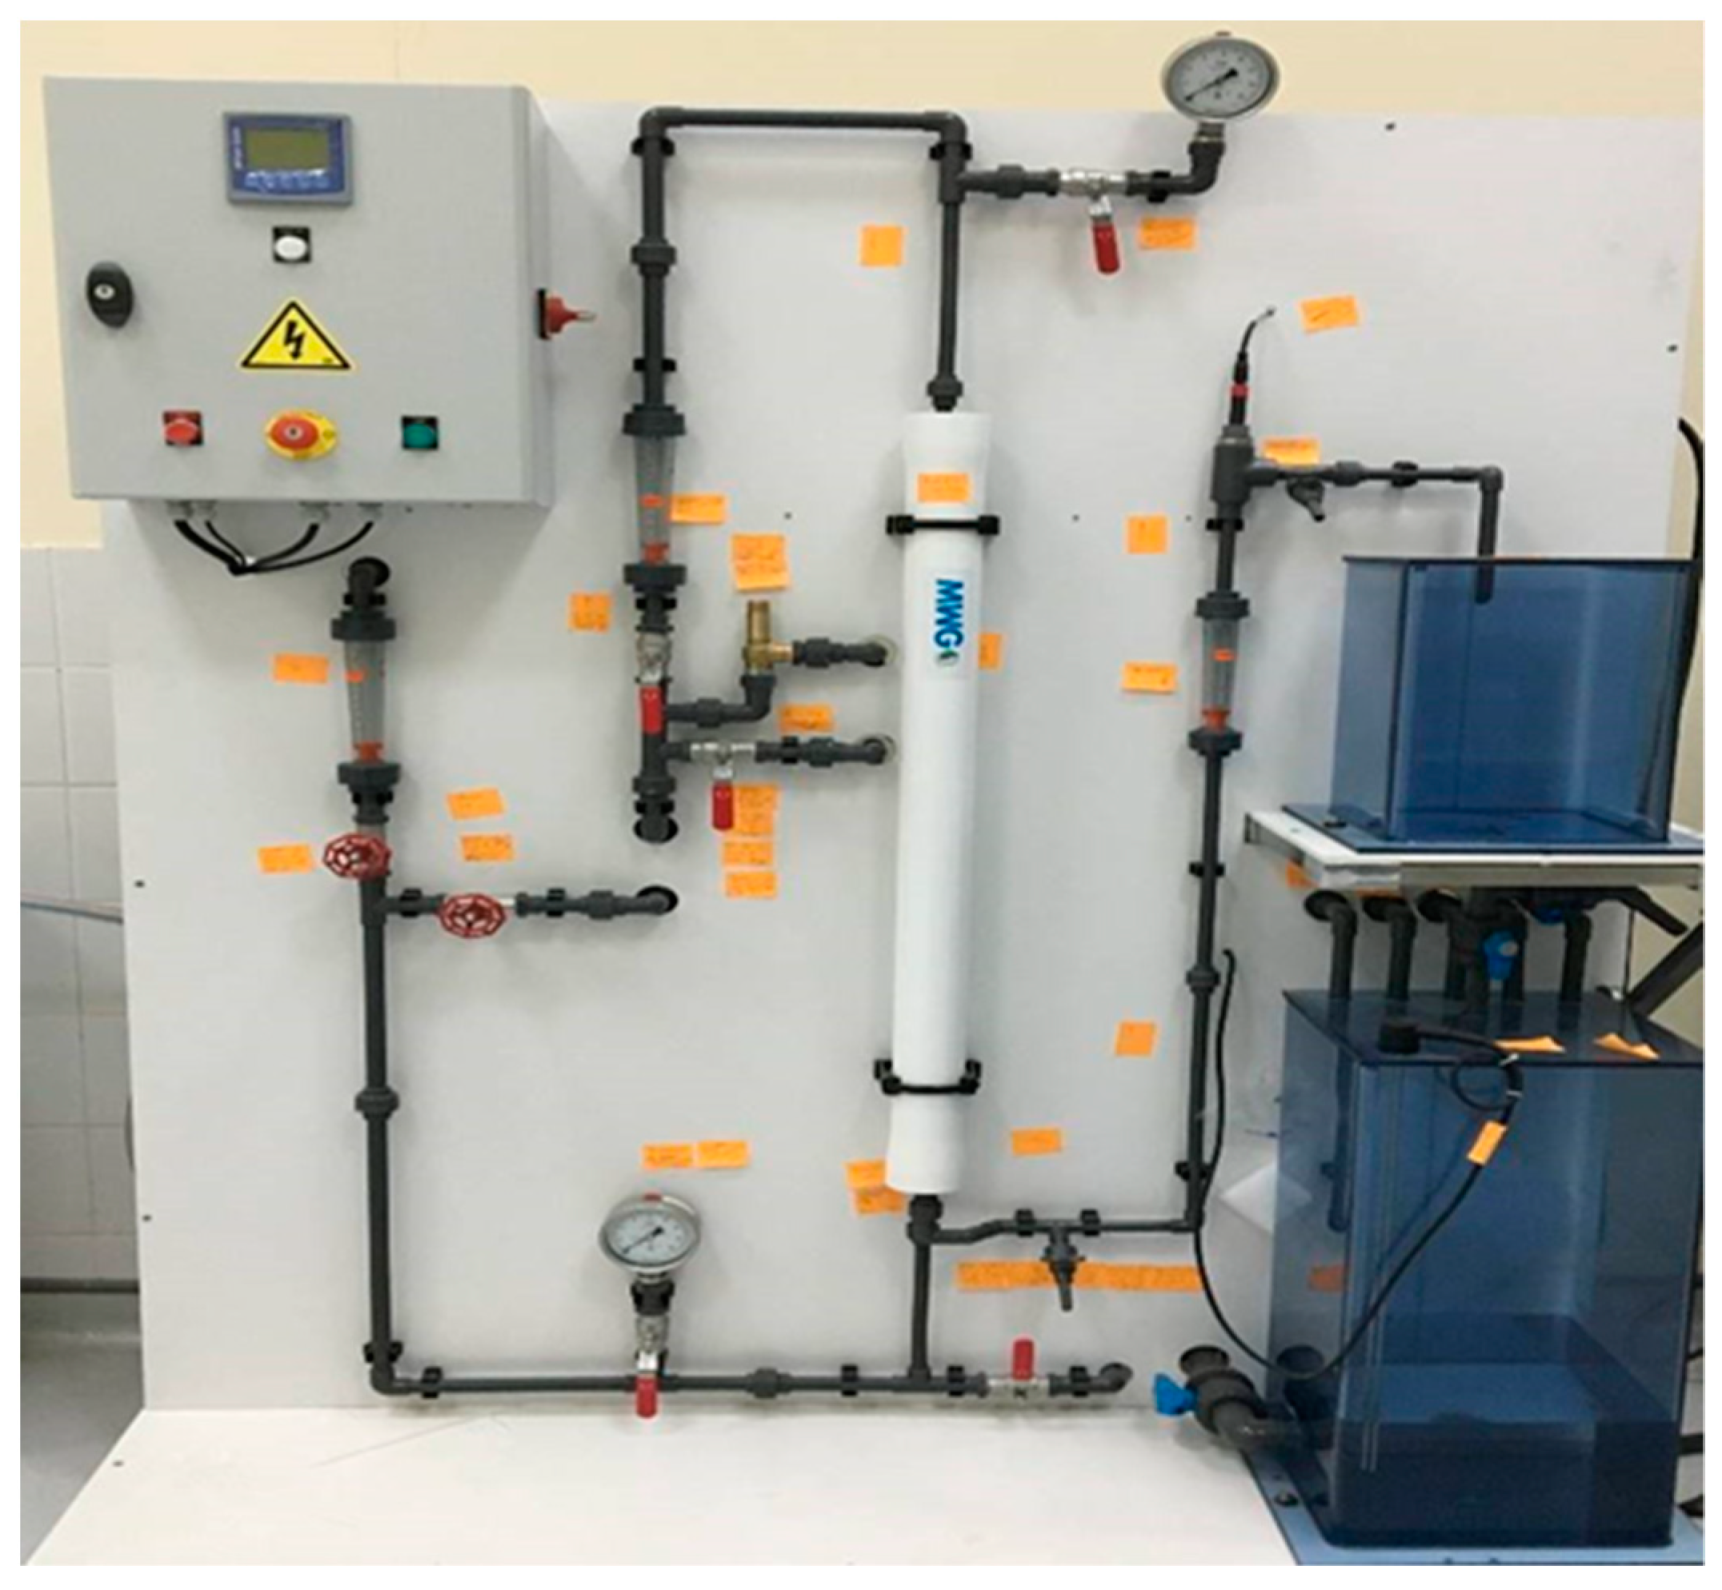
The main equipment used in this experiment were RO, NF, and sand filtration units. As shown in Figure 1, there was a pump next to the inlet tank, where 20 L of water was pumped from the inlet tank to the filtration membrane. The water was then filtered, resulting in the effluent being released into the outlet tank. The same setup was used with changing filters between RO and NF. A similar setup for sand filtration is shown in Figure 2 without any pressure control. Since it did not have an outlet tank, a beaker near the outlet pipe was held to collect the water. Finally, the treated water was analyzed for water quality parameters. Table 2 shows the manufacturer for all filtration techniques, the model, and the active area for RO and NF.

2.3. Experimental Plan

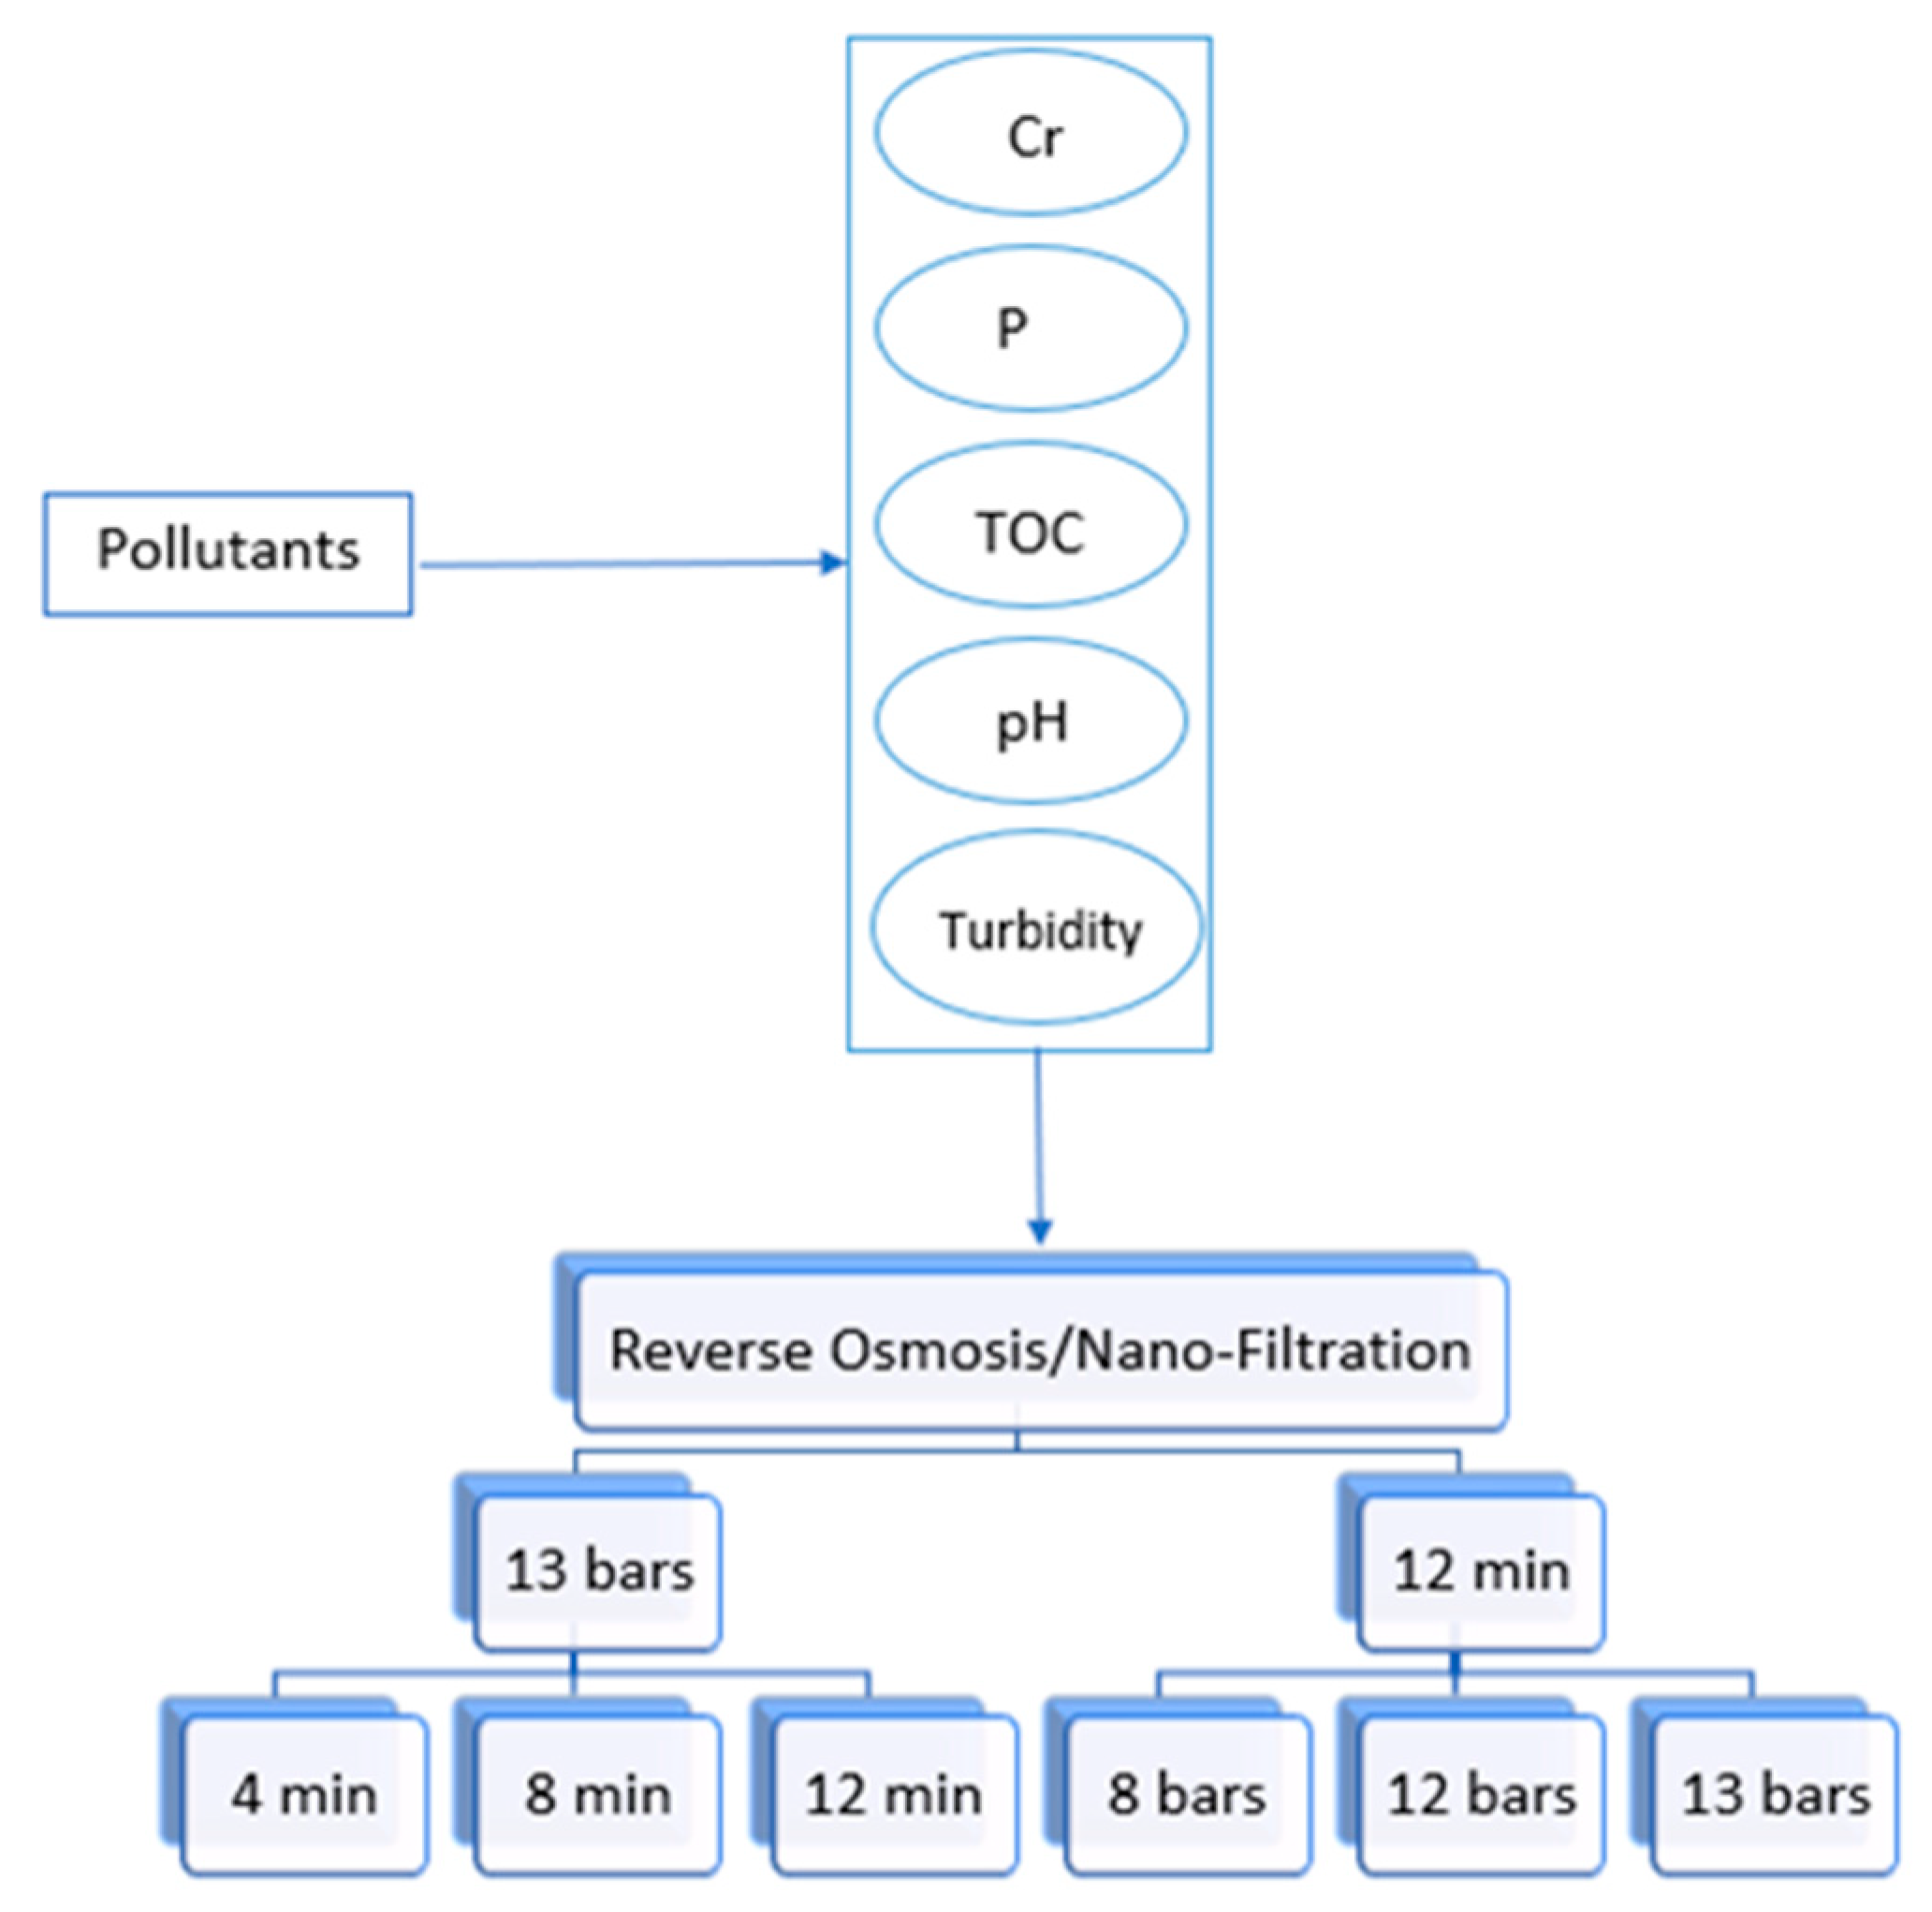
The experimental plan for membrane filtration is simplified in Figure 3. Three pressure levels (8, 12, and 13 bars) were experimented with at 12 min using RO and NF to check the effect of pressure on the removal efficiency. The highest pressure chosen was 13 bar, due to the limitation of the pressure gauge device. The flow rate at 4 bar was too low for the RO unit, even though it was acceptable for the NF unit. For this reason, it was not possible to work on low pressure levels with the experimental setup. Therefore, the pressures level of 8 and 12 bars were selected as a balance between minimum and maximum pressure ratings of NF and RO system operating to produce the required sample output. A study conducted on RO and NF using 12, 16, and 20 pressure bars showed that as the pressure increased, accumulation of foulant materials increased on the surface of the membrane [35]. Thus, even if the pressure gauge device had higher pressure options, more than 13 bars would not be chosen. Furthermore, the setup reached a steady-state flow within 12 min and samples of filtered water were collected at that time. Accordingly, other timings (4 and 8 min) were chosen to check if there were any variations in the removal efficiency during unsteady flow behavior. As sand filtration did not have pressure control, it was decided to run it for the same time intervals for ease of comparison. The experimental plan for sand filtration is simplified in Figure 4. There are no specific number of runs carried out at each set of conditions as the experiments were randomly repeated for a particular condition to show reproducibility.
Conducting large number of tests on real wastewater is complicated due to the requirements of sampling, preservation, and quality control. For this reason, synthetic wastewater was used in this study. However, to demonstrate the quality of data using synthetic wastewater, a comparison between real and synthetic wastewater was completed at the same three-time intervals (4, 8, and 12 min) for RO at 13 bars. Overall, 15 experiments were conducted.

2.4. Analytical Methods

Water quality analysis was based on standard methods [36]. All reagents and test kits were manufactured by the Hach Company (Loveland, CO, USA). The three pollutants targeted in this experiment were phosphorous, UV-254, and chromium because of the reasons mentioned in the introduction. The DR 5000 Spectrophotometer, which was manufactured by the Hach Company (Loveland, CO, USA), was used to test these pollutants.
The method used for chromium was Method 8023, known as the 1, 5-Diphenylcarbohydrazide Method. A dry powder formulation known as ChromaVer 3 Chromium Reagent reacted to give a purple color if chromium was present [37].
The method used for phosphorus was Method 8048, also known as the PhosVer 3 Method. In an acidic medium, orthophosphate reacted with molybdate, which produced a phosphate/molybdate complex. Ascorbic acid then reduced this complex, which gave off a blue color [37].
The method used for UV-254 was Method 10054, also known as the Direct Reading Method. The filtered sample was measured against organic-free water to indicate the organic constituents in the sample. The results were then used to calculate the Specific Ultraviolet Absorbance (SUVA) [37].

2.5. Statistical Analysis

A one-way Analysis of Variance (ANOVA) was used to assess the effect of the independent variables of pressure and time on the dependent variable of pollutant removal efficiency. This was effected by determining if the difference between the removal efficiency means of the pollutants for the three pressure levels/time intervals was statistically significant in both RO and NF. This analysis was completed using Microsoft Excel. Two hypotheses were used in the analysis. The first hypothesis was the null hypothesis (H0), which says that there is no significant difference between the means. The second hypothesis was the alternative hypothesis (H1), which says that there is a significant difference between the means. One of the outputs in Excel was the p-value, which can be compared to the significance level. If the p-value is less than the significance level, the null hypothesis is rejected. In this analysis, the significance level was 0.05.

3. Results and Discussion

3.1. Comparison among RO, NF, and Conventional Filtration

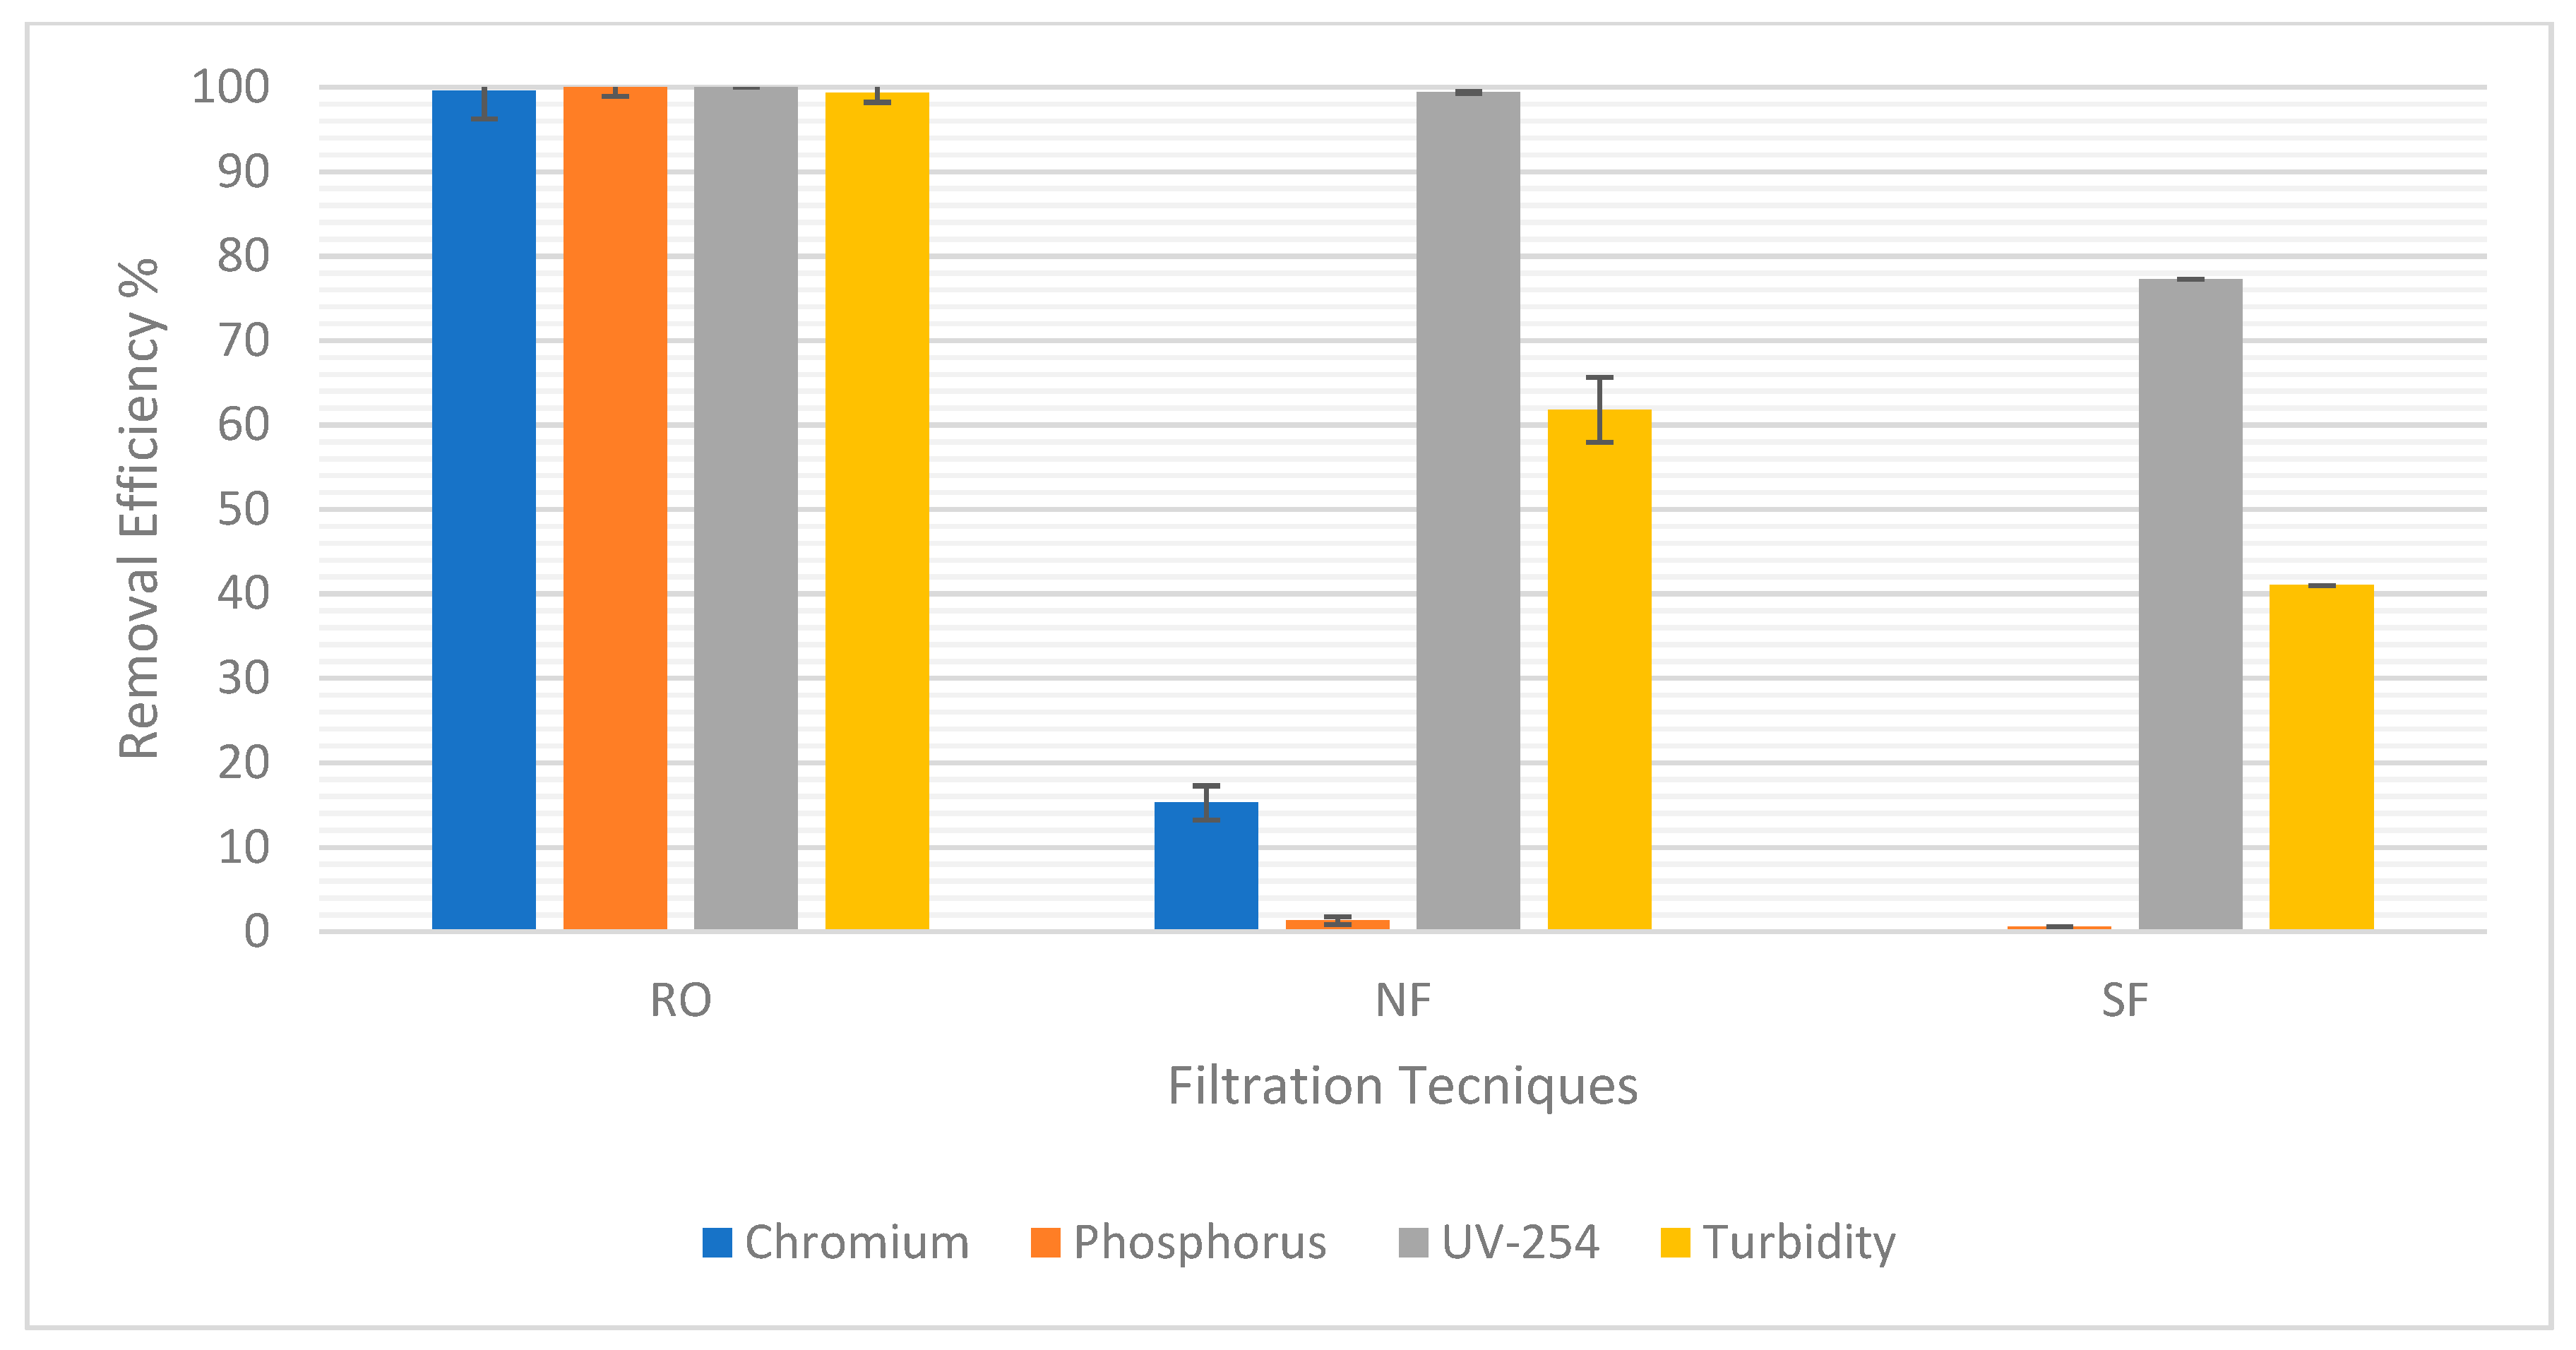
Figure 5 shows the percentage removal of each of the targeted pollutants chromium, phosphorus, UV-254, and turbidity. RO was the best compared to NF and sand filtration, as it was the most efficient with about 100% removal efficiency of all pollutants. This is because it had the smallest pore sizes among all options, leading to the best removal of pollutants. NF removed very small amounts of chromium and phosphorus with a removal efficiency of 15.24% and 1.35%, respectively; therefore, it was not efficient in removing these pollutants. Moreover, sand filtration did not remove any chromium or phosphorus at all. It could largely be due to the chromium and phosphorus being attached to small, suspended particles as opposed to the large particles removed by sand filtration or NF. Both NF and sand filtration removed fair amounts of UV-254 and turbidity. UV-254 removal efficiency was 99.4% in NF and 77.27% in sand filtration, while turbidity removal efficiency was 61.81% in NF and 41% in sand filtration. This indicates that RO will be effective in ensuring the quality of treated water necessary for reuse. Furthermore, Table 3 and Table 4 show the treated water pH for each test. For the treated water to not be too acidic nor alkaline, pH is always supposed to be in the range of 6–9. So, in this case, it was acceptable.

3.2. Comparison of Wastewater Treatability with Synthetic against Real Wastewater

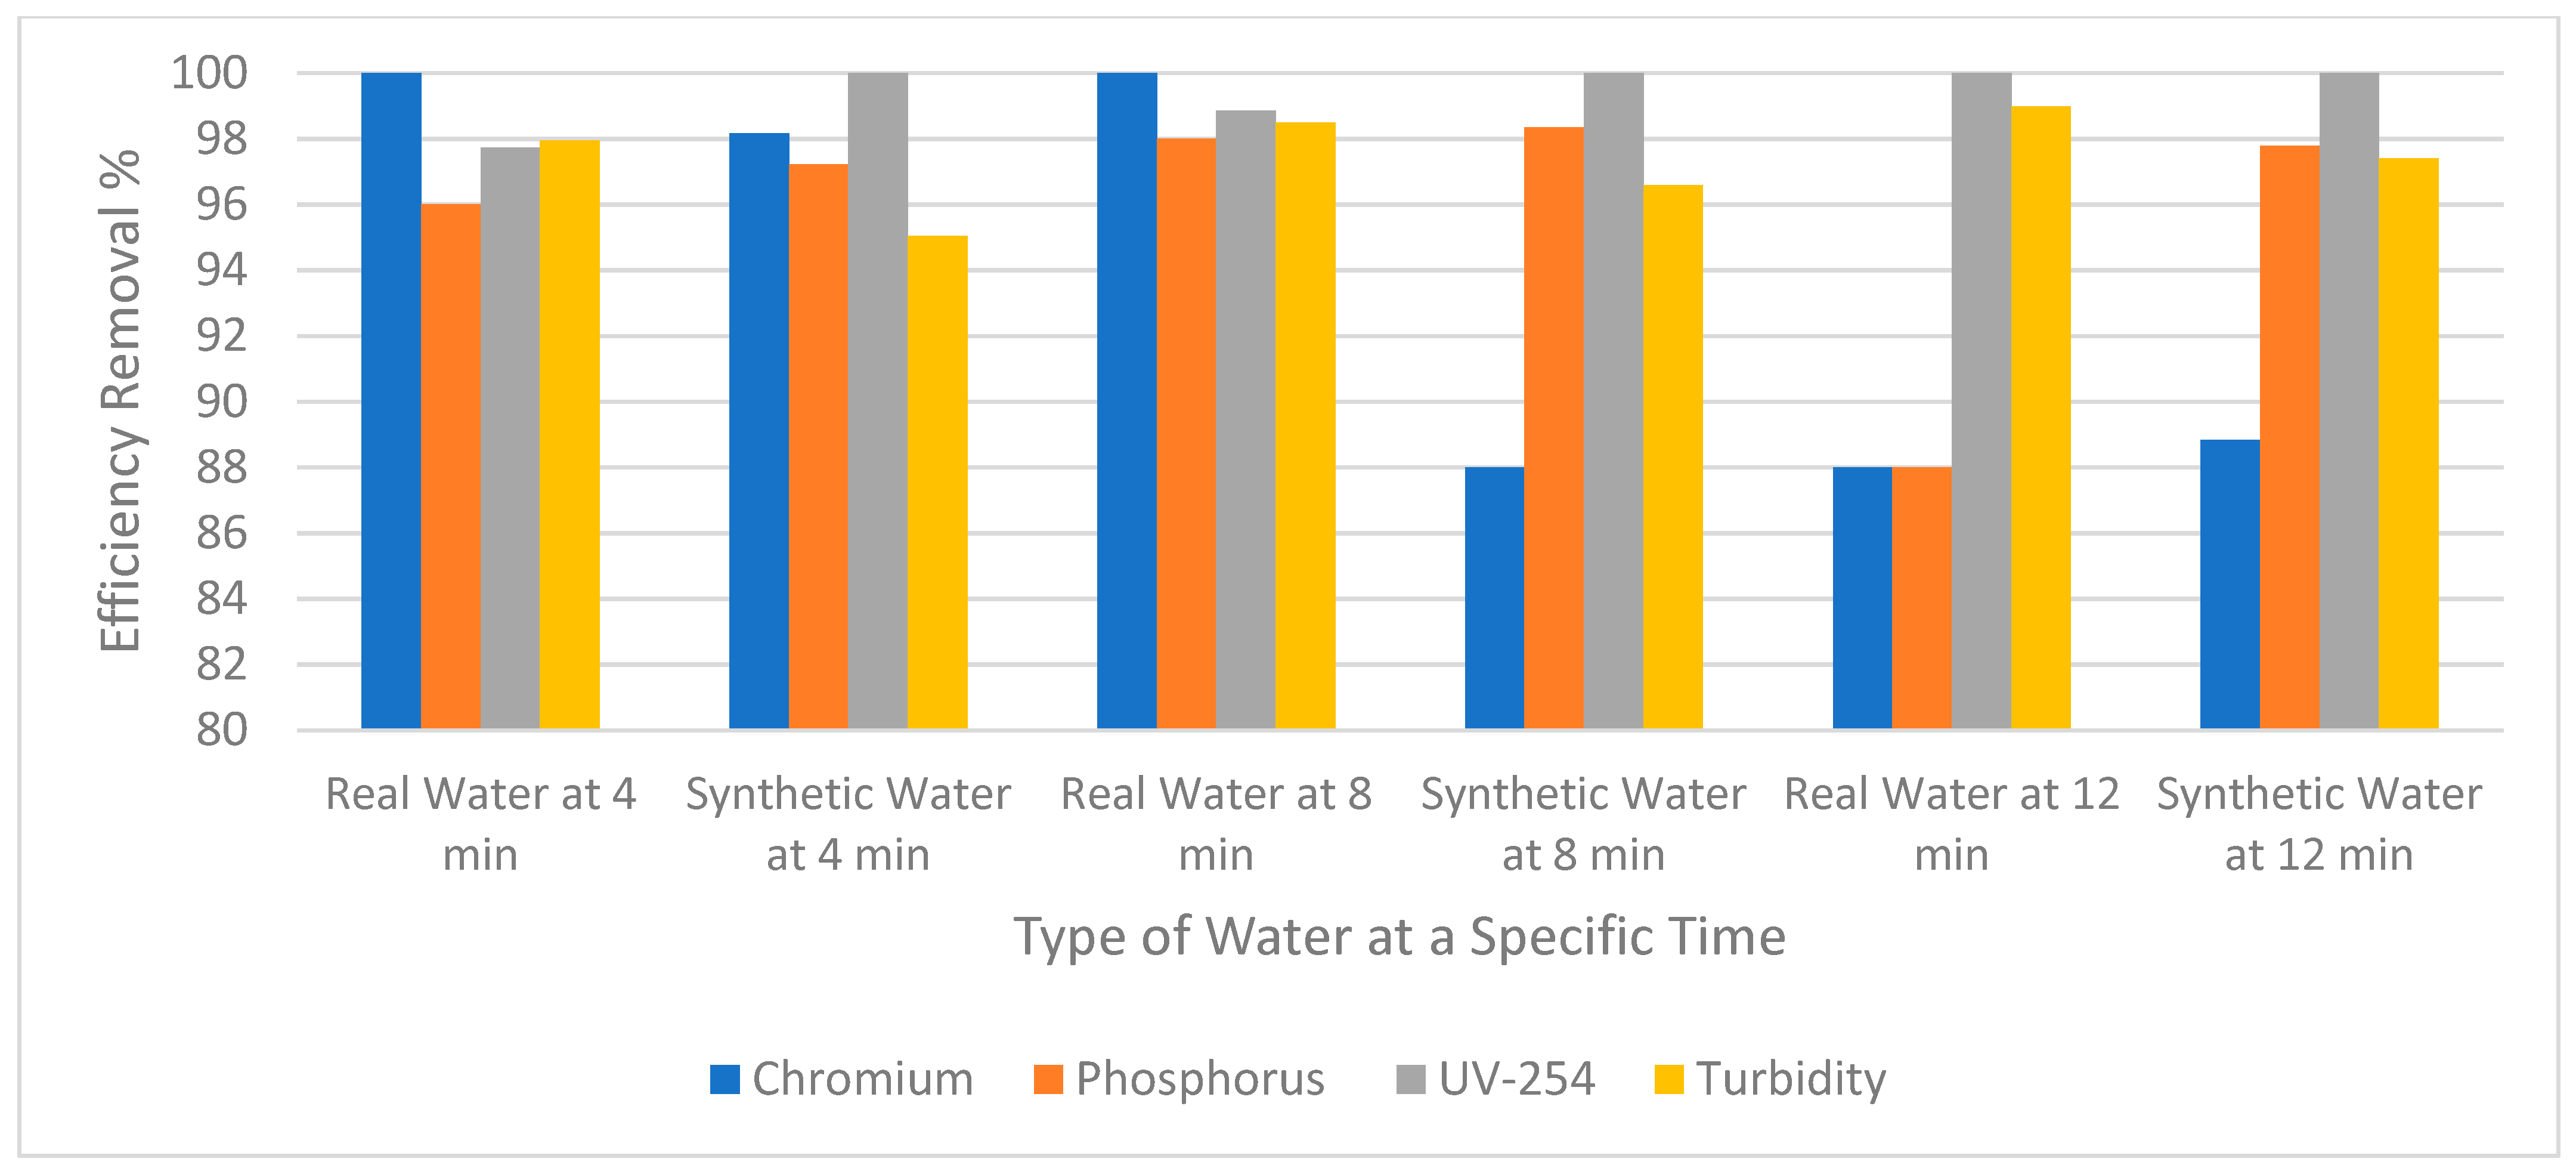
Figure 6 compares the removal efficiency of chromium, phosphorus, UV-254, and turbidity between synthetic and real wastewater using RO. Regarding real wastewater, the chromium was completely removed when the experiment was run for 4 and 8 min. However, when the experiment was run for 12 min the removal efficiency was reduced to 88%. As for phosphorus, 96% and 98% were removed when the experiment continued for 4 and 8 min, respectively. On the other hand, when the experiment was run for 12 min the removal efficiency was again reduced to 88%. Therefore, it can be assumed that for both chromium and phosphorus removal, efficiency was reduced when the experiment ran for 12 min. The reason why removal efficiency decreased could be because the amount of the accumulated foulants increased on the surface of the membrane. However, UV-254 and turbidity were more efficiently removed at 12 min. Synthetic wastewater showed similar behavior to real wastewater with regards to the removal efficiency of the pollutants at different times. However, there are a few differences; for example, at 12 min the removal of phosphorus was greater in synthetic water than real water as shown in Figure 6. This might be because of inconsistency between the two types of wastewaters (Table 1). Real wastewater contains high phosphorus levels and removing it as time passes would be a lower percentage compared to synthetic wastewater.

3.3. Effect of Pressure and Time on the RO and NF Performance

3.3.1. Effect of Pressure

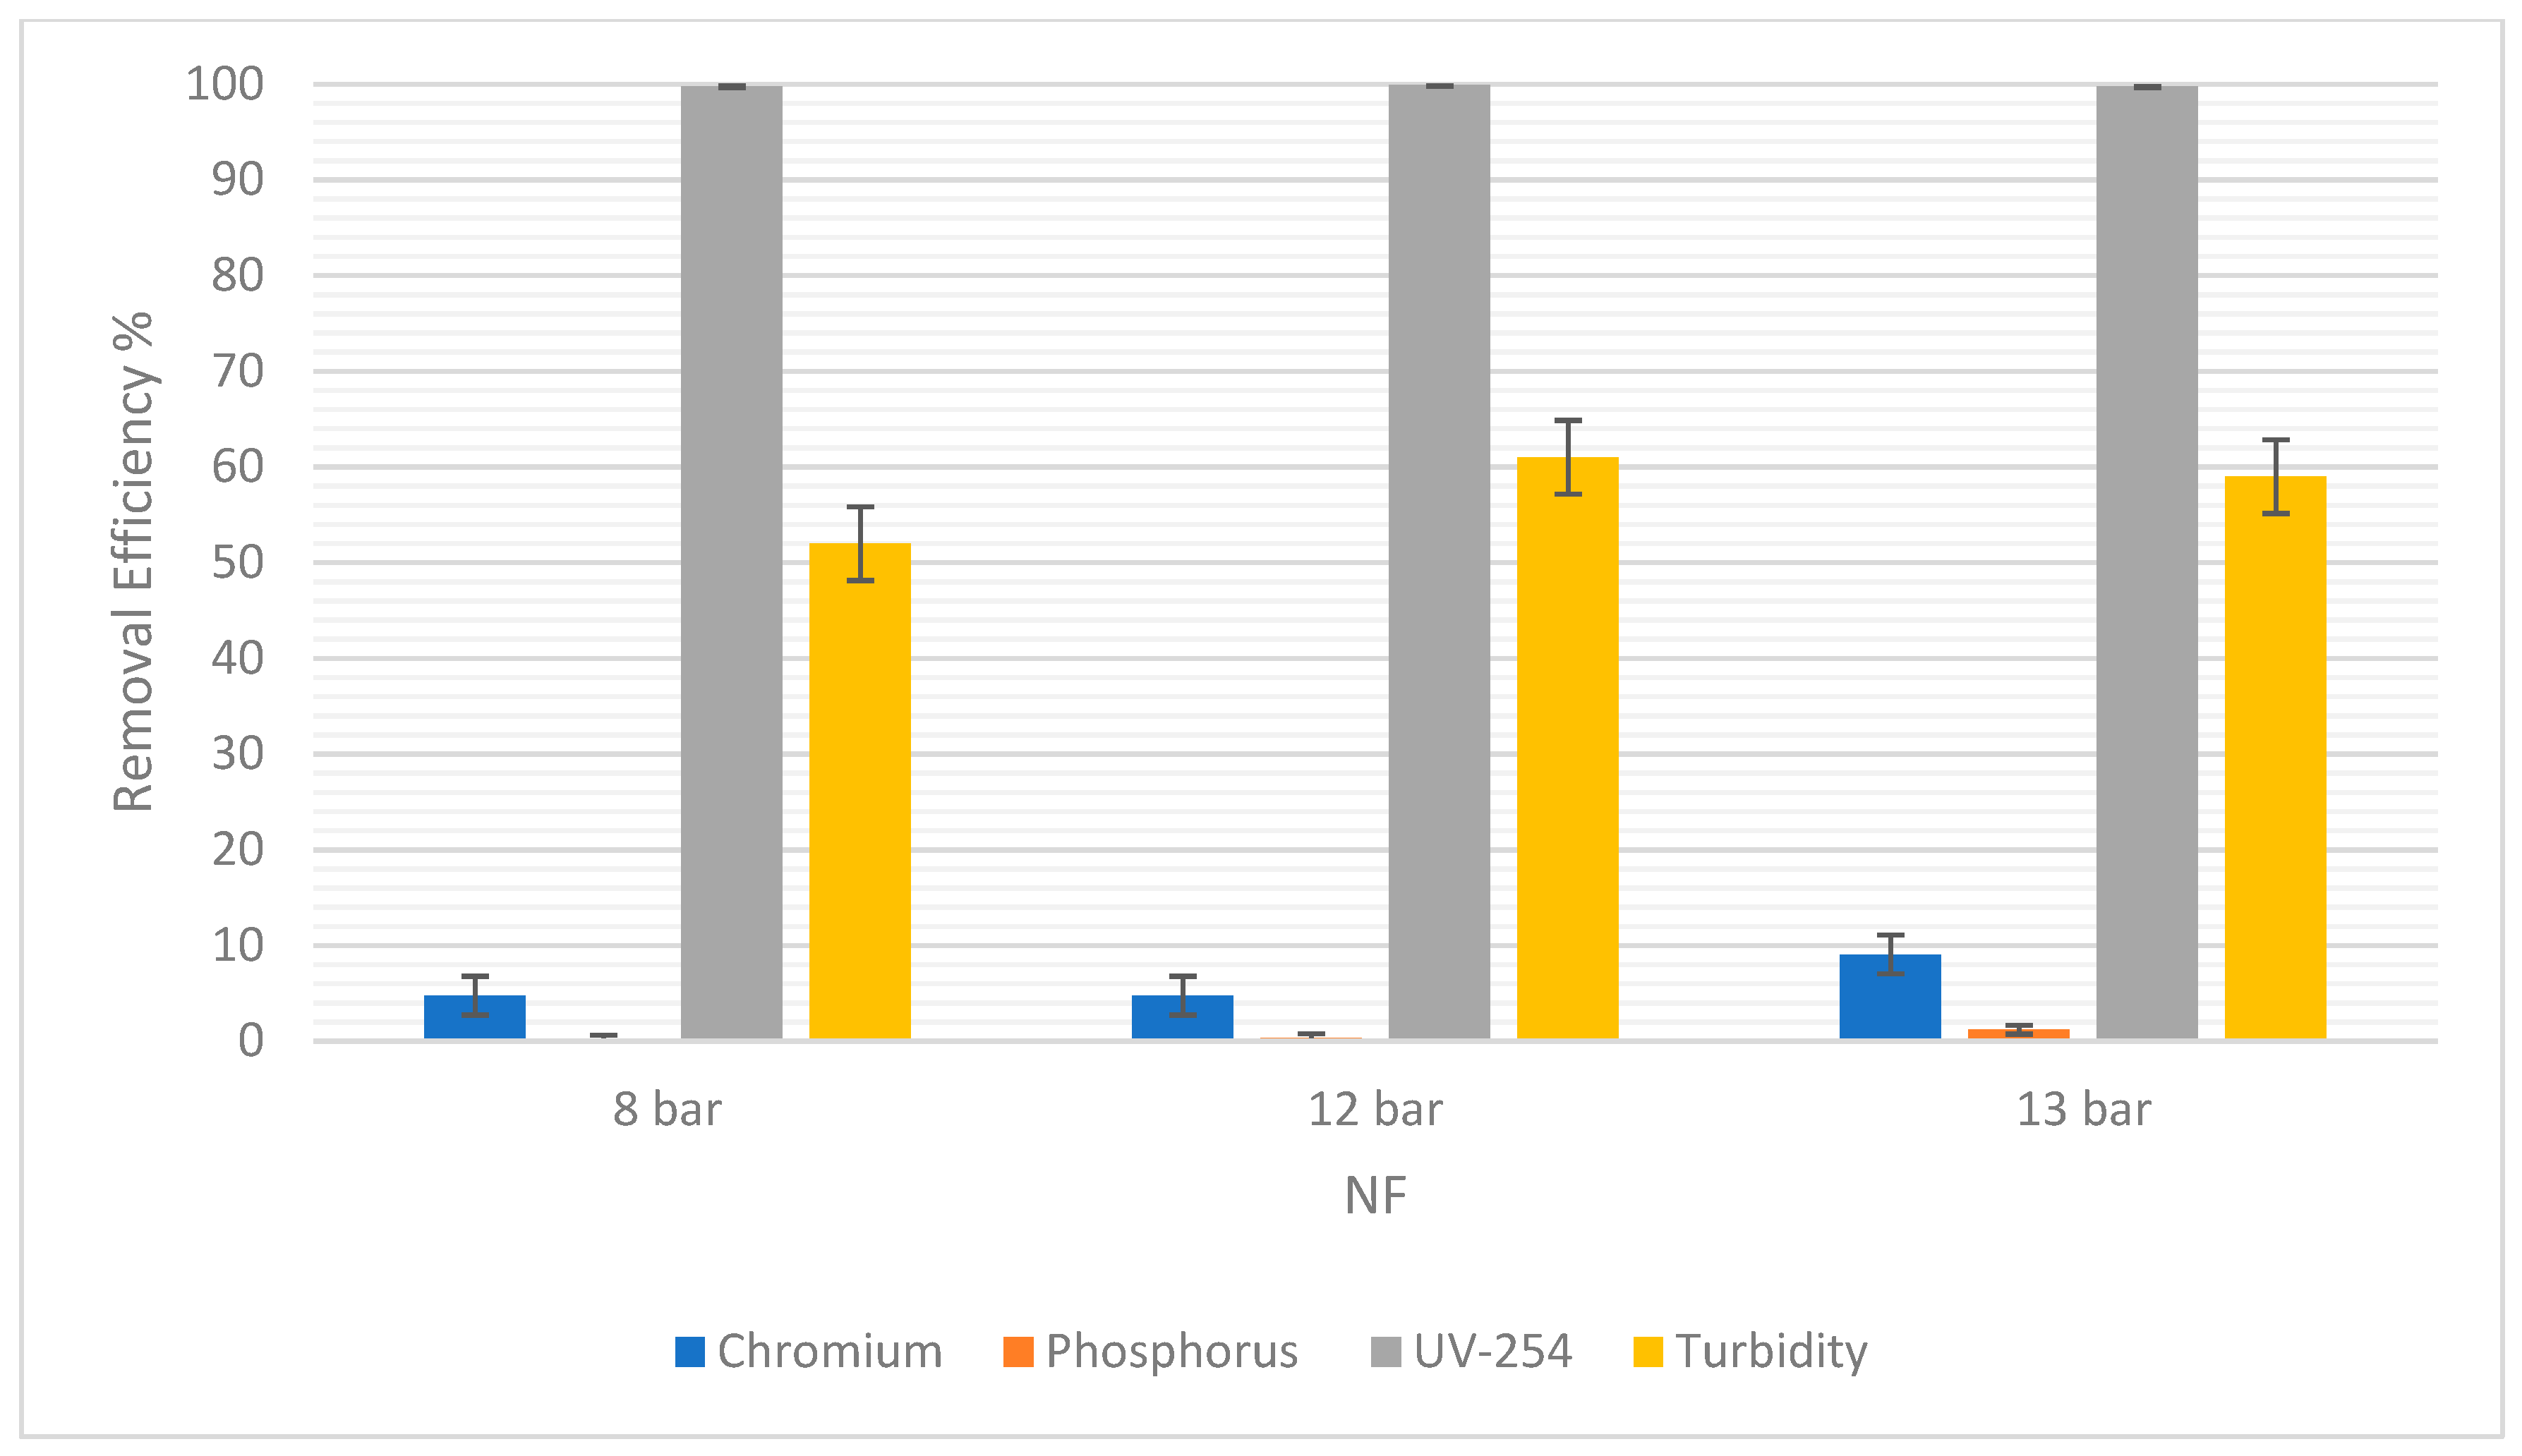
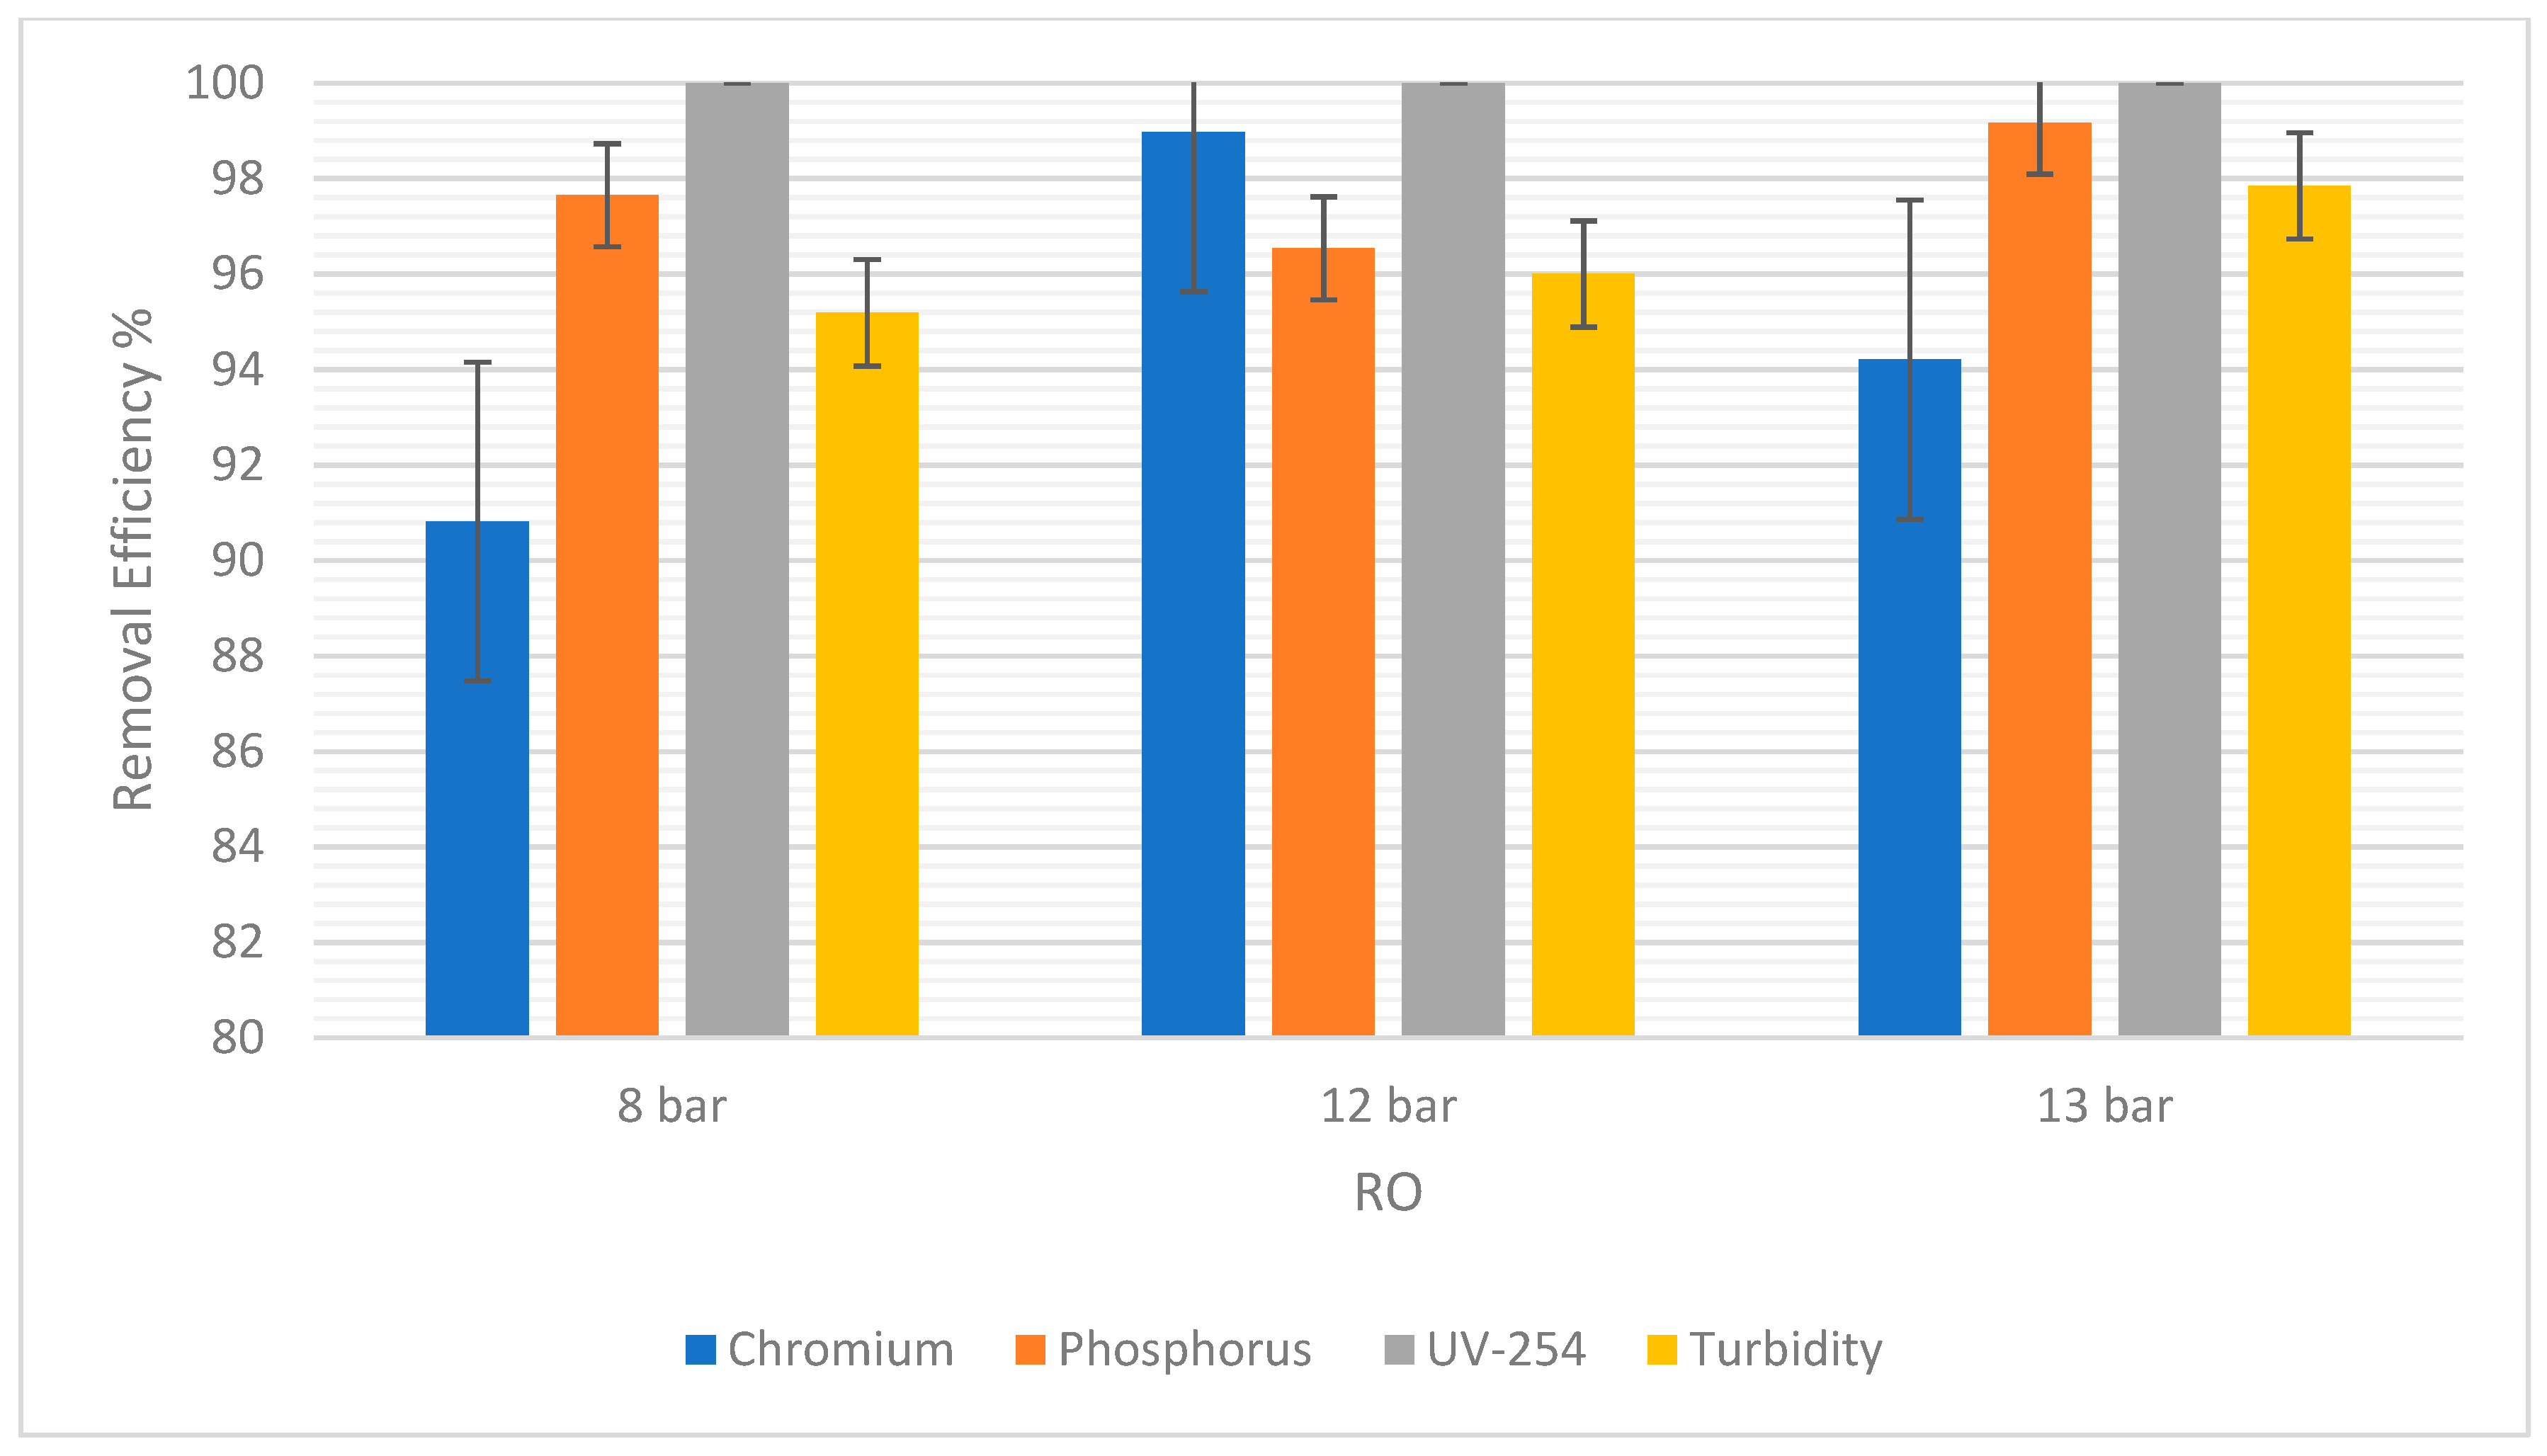
Figure 7 showed that there was no difference in the chromium removal efficiency at 8 bars and 12 bars for NF. However, at 13 bars the removal efficiency increased to 9.05%. A difference of 4.29% was observed. For RO, chromium removal was 90.28% at 8 bars, but 89.97% at 12 bars, as shown in Figure 8. The highest percentage removal in RO was 94.21% and was observed at the highest pressure (13 bars). This correlates to the principle that an increase in pressure in RO and NF improves their overall performance.
Moreover, it was observed that there was a consistent rise in the phosphorus removal efficiency with the pressure rises in NF. At 8 bars it was 0.15% and the highest was 1.20% at 13 bars. In RO, the trend was similar, but the slight drop in RO at 12 bars could be due to statistical variability. For this experiment, the difference is only 1.11% between 8 bars and 12 bars. So, the removal efficiency in RO and NF increased as the pressure increased.
For UV-254, the removal efficiency in RO was 100% regardless of the pressure. As for NF, there was a very slight increase in the removal efficiency from 8 to 12 bars, and then a slight decrease from 12 to 13 bars. However, these changes in pressure were not significant enough to show any correlations between the pressure and the efficiency of removal.
Turbidity removal efficiency in NF was 52% at 8 bars and 59% at 13 bars. In RO, it was observed that 95% of suspended solids were removed at 8 bars and 97.85% were removed at 13 bars. Therefore, as pressure increased, the removal efficiency increased. The overall removal efficiency of RO is higher than NF, consistent with other pollutants.
Additionally, the values of these errors are reported in terms of average ± Standard Deviation (SD) in Table 5. The SD of each pollutant in both NF and RO is low, indicating reliable experimental results.

3.3.2. Effect of Time

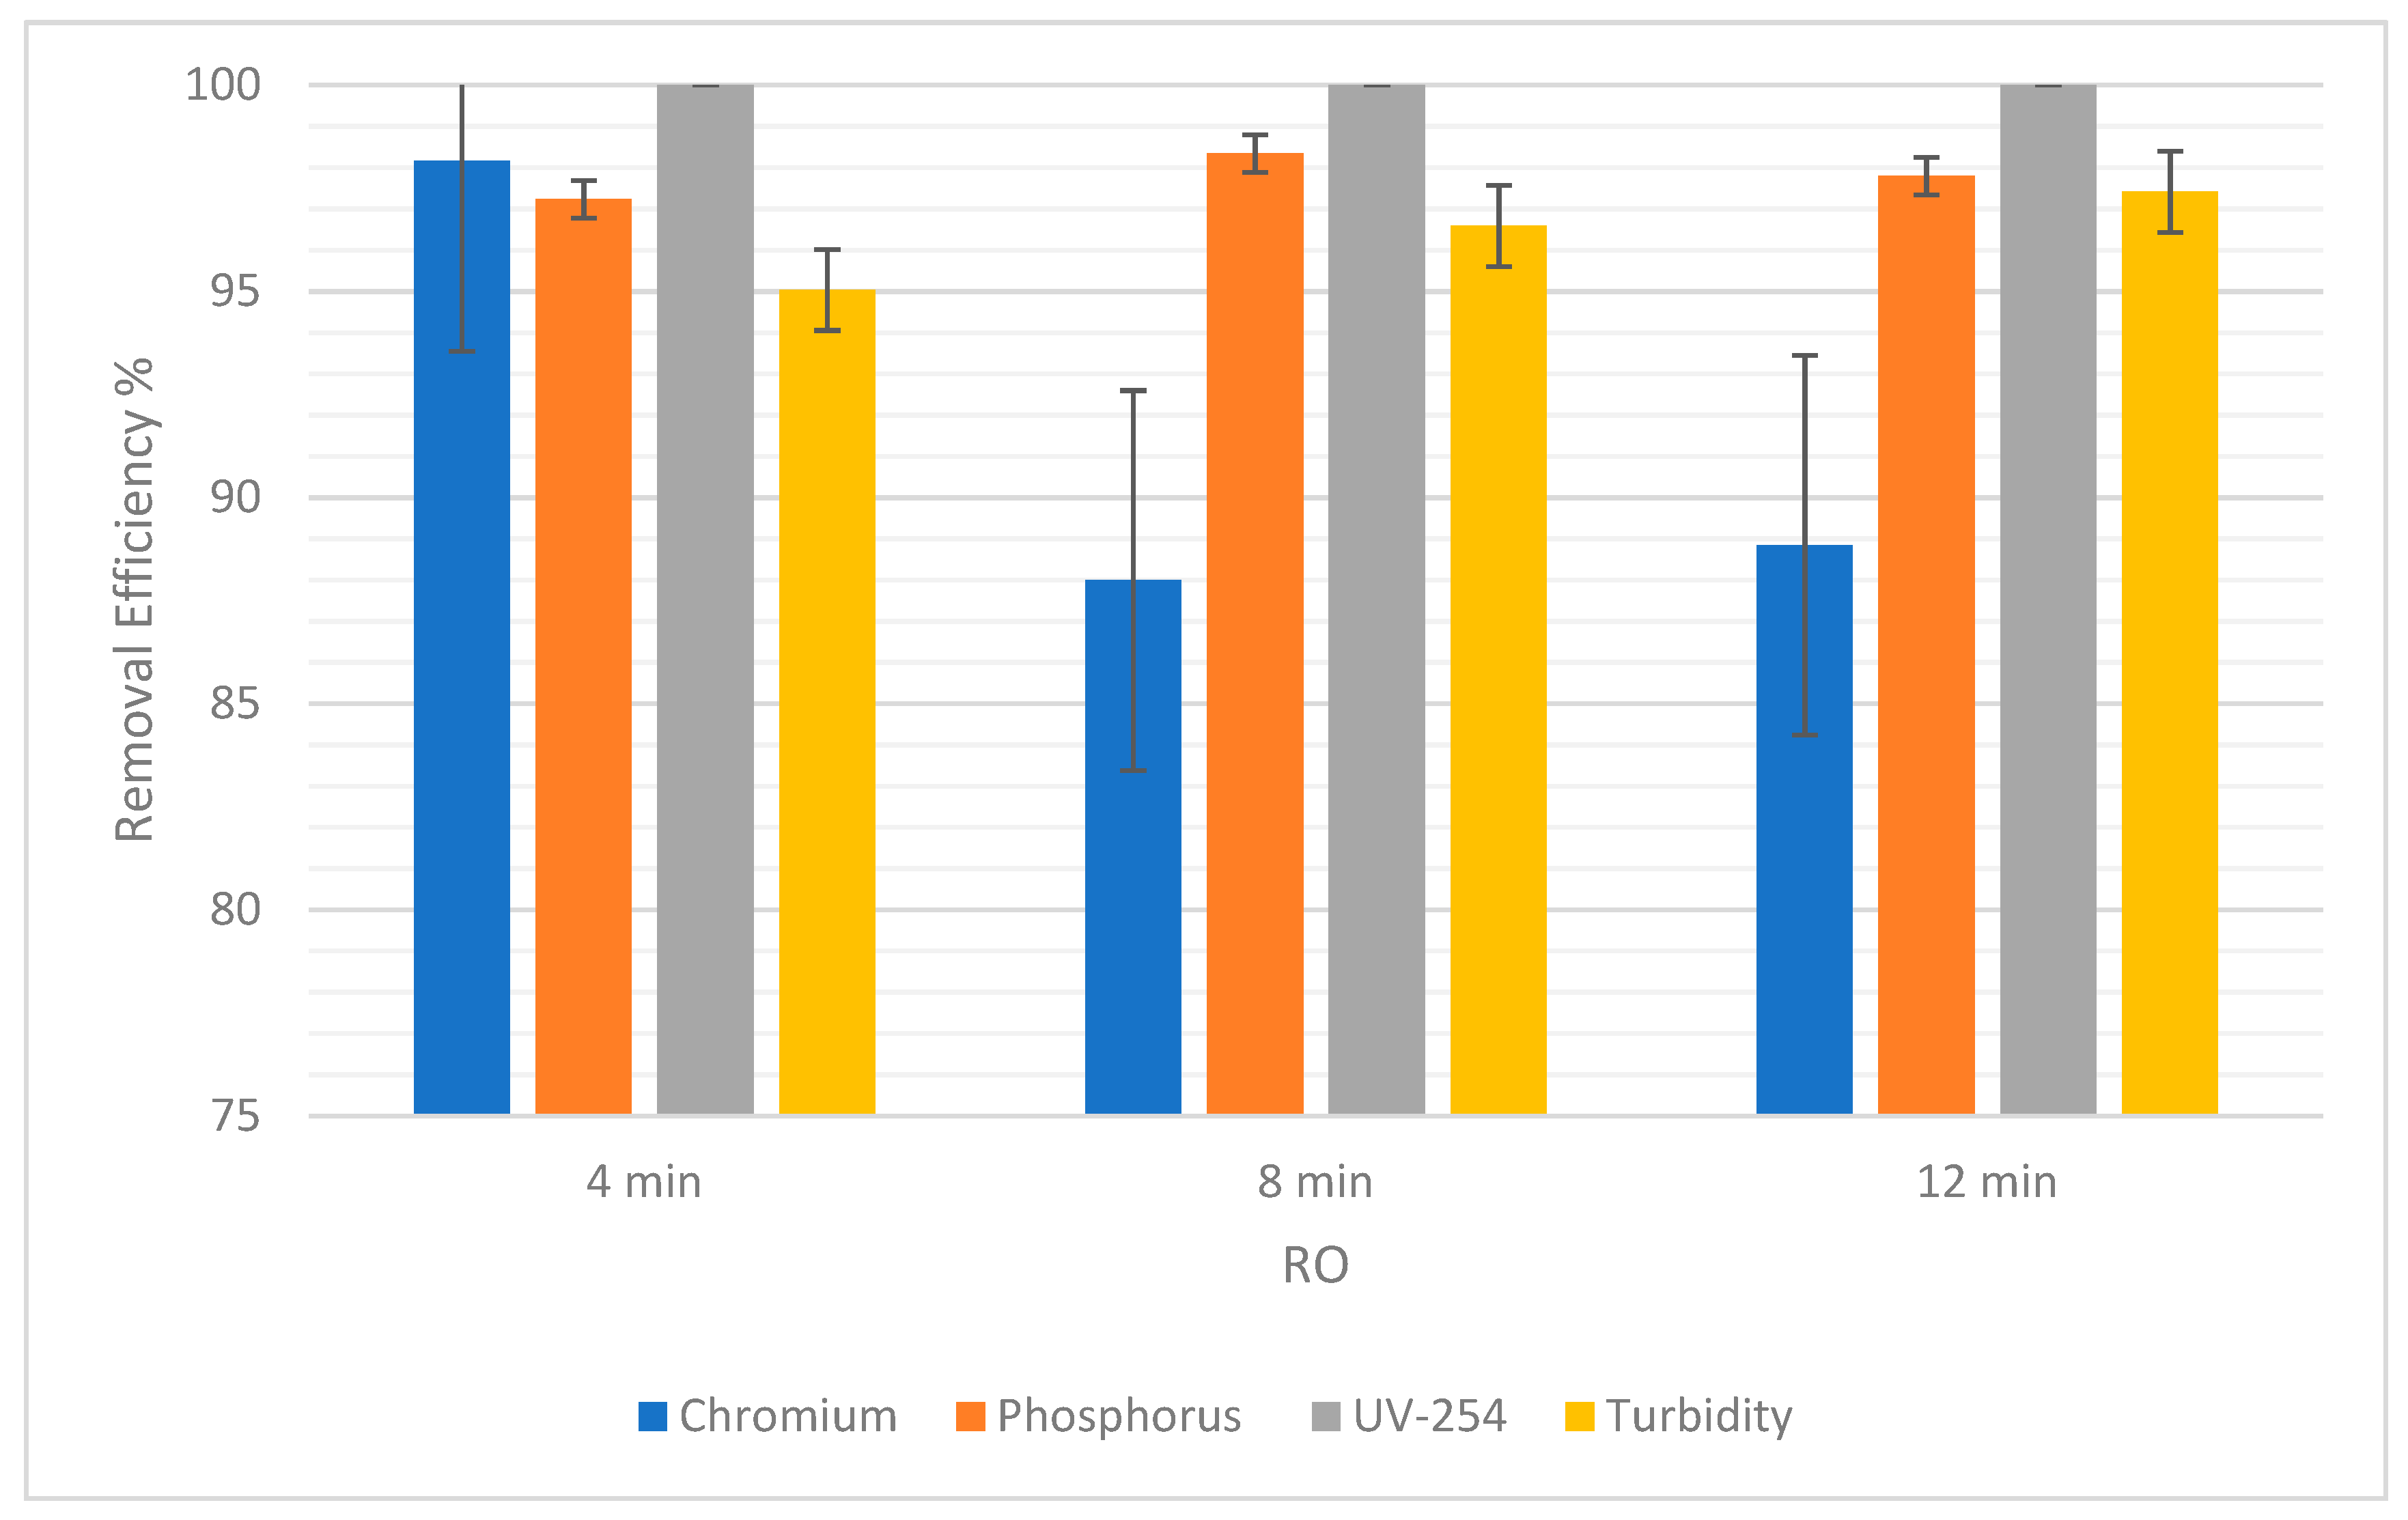
For RO, the percentage of chromium removal was 98.16% after 4 min and then decreased to 87.99% before increasing again by a short margin to 88.84% (Figure 9). On the other hand, Figure 10 shows a gradual decrease in the percentage removal from 7.14% to 5.08% using NF, which could be due to statistical variability. Therefore, the gradual effect of time for the removal of chromium cannot clearly be seen because, as the time was increased, the removal efficiency gave fluctuating results.
Figure 9 below shows that the removal efficiency using RO increased from 97.23% at 4 min to 98.34% at 8 min, and then a slight difference was observed as it came down to 97.79% at 12 min. This shows that there is no significant difference in the removal efficiency of phosphorus as time passes. Moreover, for NF there was an increase from 0.3% at 4 min to 0.75% at 8 min (Figure 10). However, the percentage dropped to 0.6% at 12 min. So, the impact of time is not conclusive.
As for the removal of UV-254, the removal efficiency for RO was always 100%. As for NF, there was a slight increase in removal efficiency from 99.62% to 99.83%, when the time changed from 4 min to 8 min. Then, when the time increased from 8 min to 12 min, there was an increase in removal efficiency from 99.83% to 99.87%. This shows a correlation between an increase in time and an increase in the removal efficiency of NF for UV-254.
In Table 6, the SD of each pollutant in both NF and RO is low, which means that the removal efficiencies are clustered around the mean, verifying that they are reliable. There was almost 90% to 99% removal in RO. Pollutants such as chromium and phosphorus were not filtered out in NF as expected. Theoretically, NF was supposed to yield good results in terms of removal efficiency for all the pollutants [38]. UV-254 and turbidity still yielded acceptable values in NF, but chromium and phosphorus were barely treated. In NF, the most crucial factor to consider is the pre-purification of the feeding water which in turn affects the efficiency of the filter while the installation takes place. This helps the system to prevent scaling and precipitation, or residues left on the membrane [39].
The source water may contain large amount of particulate form of chromium and phosphorus. This could be the reason behind elements like chromium and phosphorus not giving a good amount of percentage removal.

3.4. ANOVA Analysis

3.4.1. Effect of Pressure

Table 7 shows the results of ANOVA analysis on the levels of pressure and the removal efficiency using RO. The p-value is 0.664186, which is greater than the significance level of 0.05. Thus, the null hypothesis cannot be rejected, and there is no difference between the removal efficiency means of the pollutants for the three pressure levels. In other words, there is no significant variation between removal efficiency using different pressure levels. This is the opposite of what had been concluded above about the principle that an increase in pressure in RO improves the removal efficiency for chromium, phosphorus, and turbidity. Nevertheless, it was found that pressure did not play a factor in the removal of UV-254, and there was a slight drop from 8 bars to 12 bars in the removal of phosphorus.
Table 8 shows the results of ANOVA analysis on the levels of pressure and the removal efficiency using NF. The p-value is 0.99965, which is greater than the significance level of 0.05. Thus, the null hypothesis cannot be rejected, and there is no difference between the removal efficiency means of the pollutants for the three pressure levels. This does not correlate to what was found above, that there is enough evidence to show that pressure affects the removal efficiency in NF. As seen in RO, increased pressure affected most of the removal efficiency of most pollutants. However, it did not play a factor in the removal of UV-254, and there was a slight drop from 8 bars to 12 bars in the removal of chromium. These different results might be the reason why the mean differences are not statistically significant.

3.4.2. Effect of Time

Table 9 shows the results of ANOVA analysis on time intervals and the removal efficiency using RO. The p-value is 0.809724836, which is greater than the significance level of 0.05. Thus, the null hypothesis cannot be rejected, and there is no difference between the removal efficiency means of the pollutants for the three-time intervals. This correlates to what was found above that there is not enough evidence to show that time affects the removal efficiency in RO.
Table 10 shows the results of ANOVA analysis on time intervals and the removal efficiency using NF. The p-value is 0.99965, which is greater than the significance level of 0.05. Thus, the null hypothesis cannot be rejected, and there is no difference between the removal efficiency means of the pollutants for the three time intervals. This is the opposite of what had been concluded above that an increase in time in NF improves the removal efficiency for UV-254. Nevertheless, it was found that time did not play a factor in the removal of chromium and phosphorous. These different results might be the reason why the mean differences are not statistically significant.

4. Conclusions and Recommendations

After comparing all three filtrations, RO was the best at removing pollutants as it had the highest percent removal for all pollutants with more than 90% removal. The removal efficiency of pollutants from synthetic water was compared to real water using RO. Synthetic wastewater showed similar behavior to real wastewater with regards to the removal efficiency of the pollutants for different experimental timings. Thus, further controlled analysis on the role of time and pressure on synthetic water treatment was undertaken.
The different timings ensured the reliability of the project, but time did not seem to have an impact on the quality of filtration. However, as pressure increased there was a slight increase in the efficiency. This trend was observed in most of the pollutants. On the other hand, the pressure did not affect UV-254. Some fluctuations in pressure and time results could be attributed to instrumental error, the limited number of tests carried out, and scaling. These fluctuations might have impacted ANOVA analysis. Hence, ANOVA showed different results of the effect of pressure on the removal efficiency in both RO and NF and time in NF. The pH was always monitored to keep in check the alkalinity/acidity of the treated samples.
Choosing the right filter is important to consume the best water quality. As technology is thriving, membrane filtrations have overcome conventional filtrations, as they were more efficient in treating water. The plant management benefits from the data of such experiments because choosing the optimum pressure level results in a reduction in energy consumption eventually and saves a lot of money. This in turn ensures that the quality of treated water can be good for reuse purposes. There is substantial rationale behind replacing existing sand filtration unit with RO units for wastewater reuse purposes.
Author Contributions

Conceptualization, M.M.M.; methodology, M.M.M. and B.T.; writing—original draft preparation, M.A.; writing—review and editing, M.M.M. and B.T.; supervision, M.M.M. All authors have read and agreed to the published version of the manuscript.

Funding

This work in this paper was supported by the open access program (OAPCEN-1410-E00053) and professional development grant from the American University of Sharjah. However, this paper represents the opinions of the authors and does not mean to represent the position or opinions of the American University of Sharjah.

Institutional Review Board Statement

Not applicable.

Informed Consent Statement

Not applicable.

Data Availability Statement

The data presented in this study are available on request from the corresponding author.

Acknowledgments

The authors acknowledge the help of some students (Mehak Ayaz, Sharjeel Shahab, Rasha Abdul Khalique and Anwar Almansour) during the experimentation.

Conflicts of Interest

The authors declare no conflict of interest.

References

  1. Memon, F. Alternative Water Supply Systems; IWA Publishing: London, UK, 2015. [Google Scholar]
  2. Xiong, W.; Li, Y.; Zhang, W.; Ye, Q.; Zhang, S.; Hou, X. Integrated multi-objective optimization framework for urban water supply systems under alternative climates and future policy. J. Clean. Prod. 2018, 195, 640–650. [Google Scholar] [CrossRef]
  3. Chapman, D. Water Quality Assessments; Chapman & Hall: London, UK, 1992. [Google Scholar]
  4. Patterson, C.; Anderson, A.; Sinha, R.; Muhammad, N.; Pearson, D. Nanofiltration membranes for removal of color and pathogens in small public drinking water sources. J. Environ. Eng. 2012, 138, 48–57. [Google Scholar] [CrossRef]
  5. Kneese, A.V. Water Pollution: Economic Aspects and Research Needs; Taylor and Francis: London, UK, 2015. [Google Scholar] [CrossRef]
  6. Wu, B.; Wang, R.; Fane, A.G. The roles of bacteriophages in membrane-based water and wastewater treatment processes: A review. Water Res. 2017, 110, 120–132. [Google Scholar] [CrossRef]
  7. Barbera, M.; Gurnari, G. Wastewater Treatment and Reuse in the Food Industry; Springer: Cham, Switzerland, 2018. [Google Scholar] [CrossRef]
  8. The National. Ground Water ‘May Run Out in 55 Years’. 2017. Available online: https://www.thenational.ae/uae/ground-water-may-run-out-in-55-years-1.437584 (accessed on 4 December 2017).
  9. DW. Singapore’s ‘Toilet to Tap’ Concept Global Ideas DW. DW.COM. Available online: http://www.dw.com/en/singapores-toilet-to-tap-concept/a-1690 (accessed on 25 June 2013).
  10. Seguela, G.; Littlewood, J.; Karani, G.A. study to assess alternative water sources for reducing energy consumption in a medical facility case study, Abu Dhabi. Energy Procedia 2017, 134, 797–806. [Google Scholar] [CrossRef]
  11. Garcia, S.N.; Clubbs, R.L.; Stanley, J.K.; Scheffe, B.; Yelderman, J.C., Jr.; Brooks, B.W. Comparative analysis of effluent water quality from a municipal treatment plant and two on-site wastewater treatment systems. Chemosphere 2013, 92, 38–44. [Google Scholar] [CrossRef] [PubMed]
  12. Bui, X.-T.; Chiemchaisri, C.; Fujioka, T.; Varjani, S. Water and Wastewater Treatment Technologies; Springer: Singapore, 2019. [Google Scholar]
  13. Bhalerao, S.A.; Sharma, A.S. Chromium: As an environmental pollutant. Int. J. Curr. Microbiol. App. Sci 2015, 4, 732–746. [Google Scholar]
  14. Sun, H.; Brocato, J.; Costa, M. Oral chromium exposure and toxicity. Curr. Environ. Health Rep. 2015, 2, 295–303. [Google Scholar] [CrossRef] [Green Version]
  15. Mekonnen, M.M.; Hoekstra, A.Y. Global Anthropogenic Phosphorus Loads to Freshwater and Associated Grey Water Footprints and Water Pollution Levels: A High-Resolution Global Study. Water Resour. Res. 2018, 54, 345–358. [Google Scholar] [CrossRef] [Green Version]
  16. Wei, X.; Li, B.; Zhao, S.; Wang, L.; Zhang, H.; Li, C.; Wang, S. Mixed pharmaceutical wastewater treatment by integrated membrane-aerated biofilm reactor (MABR) system—A pilot-scale study. Bioresour. Technol. 2012, 122, 189–195. [Google Scholar] [CrossRef]
  17. Zhang, Y.; Wei, S.; Hu, Y.; Sun, S. Membrane technology in wastewater treatment enhanced by functional nanomaterials. J. Clean. Prod. 2018, 197, 339–348. [Google Scholar] [CrossRef]
  18. Davis, M.L.; Cornwell, D.A. Introduction to Environmental Engineering, 5th ed.; McGraw-Hill International: New York, NY, USA, 2013. [Google Scholar]
  19. Pan, Z.; Song, C.; Li, L.; Wang, H.; Pan, Y.; Wang, C.; Li, J.; Wang, T.; Feng, X. Membrane technology coupled with electrochemical advanced oxidation processes for organic wastewater treatment: Recent advances and future prospects. Chem. Eng. J. 2019, 376, 120909. [Google Scholar] [CrossRef]
  20. Yang, Z.; Zhou, Y.; Feng, Z.; Rui, X.; Zhang, T.; Zhang, Z. A Review on Reverse Osmosis and Nanofiltration Membranes for Water Purification. Polymers 2019, 11, 1252. [Google Scholar] [CrossRef] [PubMed] [Green Version]
  21. Lan, L.; Kong, X.; Sun, H.; Li, C.; Liu, D. High removal efficiency of antibiotic resistance genes in swine wastewater via nanofiltration and reverse osmosis processes. J. Environ. Manag. 2019, 231, 439–445. [Google Scholar] [CrossRef] [PubMed]
  22. Nesaratnam, S. Water Pollution Control; Wiley: Chichester, UK, 2014. [Google Scholar]
  23. Okampo, E.J.; Nwulu, N. Optimisation of renewable energy powered reverse osmosis desalination systems: A state-of-the-art review. Renew. Sustain. Energy Rev. 2021, 140, 110712. [Google Scholar] [CrossRef]
  24. Nafiseh, A. Reverse osmosis design with IMS design software to produce drinking water in Bandar Abbas, Iran. J. Appl. Res. Water Wastewater 2017, 4, 314–318. [Google Scholar]
  25. Mortula, M.; Shabani, S.; Al Rumaithin, K.; Nawaz, W.; Kashwani, G. Removal of Phosphorus and BOD from Secondary Effluent using Coagulation. In Proceedings of the 1st International Conference on Energy Water and Environment, Sharjah, United Arab Emirates, 14–17 November 2011. [Google Scholar]
  26. Saif, Y.; Ali, M.; Jones, I.M.; Ahmed, S. Performance Evaluation of a Field-Scale Anaerobic Baffled Reactor as an Economic and Sustainable Solution for Domestic Wastewater Treatment. Sustainability 2021, 13, 10461. [Google Scholar] [CrossRef]
  27. Zakmout, A.; Said, F.; Velizarov, S.; Crespo, J.G.; Portugal, C.A.M. Recovery of Cr(III) from Tannery Effluents by Diafiltration Using Chitosan Modified Membranes. Water 2021, 13, 2598. [Google Scholar] [CrossRef]
  28. Hamd, A.; Dryaz, A.R.; Shaban, M.; AlMohamadi, H.; Al-Ola, K.A.A.; Soliman, N.K.; Ahmed, S.A. Fabrication and Application of Zeolite/Acanthophora Spicifera Nanoporous Composite for Adsorption of Congo Red Dye from Wastewater. Nanomaterials 2021, 11, 2441. [Google Scholar] [CrossRef]
  29. Iqbal, F.; Fattah, K.P.; Mortula, M. Comparative Evaluation of Granulated Blast Furnace Slag and Activated Carbon for Treatment of Organic Matter and Solids from Residential Greywater; International Association of Chemical, Biological and Medical Sciences Researchers: Hamburg, Germany, 2020. [Google Scholar]
  30. Mortula, M.; Ali, T.; Elaksher, A. Municipal Wastewater Treatment using Different Coagulants. Desalination Water Treat. 2020, 179, 8–18. [Google Scholar] [CrossRef]
  31. Mortula, M.; Gagnon, G. Phosphorus treatment of secondary municipal effluent using oven-dried alum residual. J. Environ. Sci. Health Part A Toxic/Hazard. Subst. Environ. Eng. 2007, 42, 1685–1691. [Google Scholar] [CrossRef]
  32. Mortula, M.M.; Abdalla, J.; Ghadban, A.A. Comparison of advection-diffusion models and neural networks for prediction of advanced water treatment effluent. Environ. Eng. Sci. 2012, 29, 660–668. [Google Scholar] [CrossRef] [PubMed] [Green Version]
  33. Pasmionka, I.B.; Bulski, K.; Herbut, P.; Boliglowa, E.; Vieira, F.M.C.; Bonassa, G.; De Pra, M.C.; Bortoli, M. Evaluation of the Effectiveness of the Activated Sludge Process in the Elimination Both ATB-Resistant and ATB-Susceptible E. coli Strains. Energies 2021, 14, 5868. [Google Scholar] [CrossRef]
  34. Joshi, G.; Mohagheghi, S. Optimal Operation of Combined Energy and Water Systems for Community Resilience against Natural Disasters. Energies 2021, 14, 6132. [Google Scholar] [CrossRef]
  35. Hafiz, M.; Hawari, A.H.; Alfahel, R.; Hassan, M.K.; Altaee, A. Comparison of Nanofiltration with Reverse Osmosis in Reclaiming Tertiary Treated Municipal Wastewater for Irrigation Purposes. Membranes 2021, 11, 32. [Google Scholar] [CrossRef] [PubMed]
  36. Giannakis, S.; Darakas, E.; Escalas-Canellas, A.; Pulgarin, C. The antagonistic and synergistic effects of temperature during solar disinfection of synthetic secondary effluent. J. Photochem. Photobiol. A Chem. 2014, 280, 14–26. [Google Scholar] [CrossRef] [Green Version]
  37. American Public Health Association; Eaton, A.D.; American Water Works Association; Water Environment Federation. Standard Methods for the Examination of Water and Wastewater; American Public Health Association (APHA): Washington, DC, USA, 2005.
  38. Giagnorio, M.; Steffenino, S.; Meucci, L.; Zanetti, M.C.; Tiraferri, A. Design and performance of a nanofiltration plant for the removal of chromium aimed at the production of safe potable water. J. Environ. Chem. Eng. 2018, 6, 4467–4475. [Google Scholar] [CrossRef]
  39. DR5000 Spectrophotometer, 2nd ed.; Hach Company: Düsseldorf, Germany, 2008; pp. 203–207. Available online: https://ca.hach.com/asset-get.download.jsa?id=7639982268 (accessed on 2 February 2022).
Figure 1. Simplified membrane experimental setup.
Separations 09 00063 g001
Figure 2. Sand filtration experimental setup.
Separations 09 00063 g002
Figure 3. RO and NF experimental plan.
Separations 09 00063 g003
Figure 4. Sand filtration experimental plan.
Separations 09 00063 g004
Figure 5. Efficiency Removal of Pollutants for each filtration technique.
Separations 09 00063 g005
Figure 6. The removal efficiency of pollutants for real wastewater vs synthetic water.
Separations 09 00063 g006
Figure 7. The removal efficiency of pollutants for NF at 8, 12, and 13 bars.
Separations 09 00063 g007
Figure 8. The removal efficiency of pollutants for RO at 8, 12, and 13 bars.
Separations 09 00063 g008
Figure 9. The efficiency of removal of pollutants for RO at 4, 8, and 12 min with error bars.
Separations 09 00063 g009
Figure 10. The removal efficiency of pollutants for NF at 4, 8, and 12 min.
Separations 09 00063 g010
Table 1. Synthetic and Real Wastewater Concentrations.
CompoundReal Wastewater [mg/L]Synthetic Wastewater [mg/L]
Chromium0.0161.00
Phosphorus4.922.15
TOC8.235.90
Table 2. Information about Filtration Techniques.
ItemRONFSF
ManufacturerToray Advanced Materials Korea Inc.FilmTec CorporationPilotes Systems
ModelRE2540-BLNNF270-2540-
Active Area2.5 m22.6 m2-
Table 3. pH Values.
Table 3. pH Values.
Reverse OsmosisNano-FiltrationSand Filtration
13 bars13 bars
4 min7.474 min7.54 min7.66
8 min7.488 min7.498 min7.72
12 min7.4512 min7.7512 min7.8
Table 4. pH Values for 12 min.
Reverse OsmosisNano-Filtration
12 min12 min
8 bars7.498 bars7.67
12 bars7.3112 bars7.81
13 bars7.4513 bars7.75
Table 5. Average ± SD at different pressures.
TypeChromiumPhosphorus UV-254Turbidity
NF Average ± SD6.19% ± 2.02%0.55% ± 0.46%99.77% ± 0.08%57.33% ± 3.86%
RO Average ± SD94.67% ± 3.34%97.79% ± 1.08%100.00% ± 0.00%96.35% ± 1.11%
Table 6. Average ± SD at different timings.
TypeChromiumPhosphorus UV-254Turbidity
RO Average ± SD91.66% ± 4.61%97.79% ± 0.45%100.00% ± 0.00%96.35% ± 0.98%
NF Average ± SD6.19% ± 0.85%0.55% ± 0.19%99.77% ± 0.11%57.21% ± 2.06%
Table 7. ANOVA: Pressure Single Factor (RO).
Source of VariationSSDFMSF-Valuep-ValueF Critical
Between Groups0.00112220.0005610.4283740.6641864.256494729
Within Groups0.01178990.001310
Total0.01291111
SS = Sum of squares, DF = Degree of freedom, MS = Mean squares.
Table 8. ANOVA: Pressure Single Factor (NF).
Source of VariationSSDFMSF-Valuep-ValueF Critical
Between Groups0.00015320.00007640.000350.999654.256495
Within Groups1.96546290.2183850
Total1.96561511
SS = Sum of squares, DF = Degree of freedom, MS = Mean squares.
Table 9. ANOVA: Time Single Factor (RO).
Source of VariationSSDFMSF-Valuep-ValueF Critical
Between Groups0.00082120.0004100.2160890.8097248364.256495
Within Groups0.01709190.001899
Total0.01791211
SS = Sum of squares, DF = Degree of freedom, MS = Mean squares.
Table 10. ANOVA: Time Single Factor (NF).
Source of VariationSSDFMSF-Valuep-ValueF Critical
Between Groups0.00015320.00007640.000350.999654.256495
Within Groups1.96546290.2183850
Total1.96561511
SS = Sum of squares, DF = Degree of freedom, MS = Mean squares.
Publisher’s Note: MDPI stays neutral with regard to jurisdictional claims in published maps and institutional affiliations.