Article

High-Throughput Optimal Design of Spacers Using Triply Periodic Minimal Surfaces in BWRO

1
School of Chemical Engineering and Technology, Sun Yat-sen University, Zhuhai 519000, China
2
School of Computer Science and Engineering, Sun Yat-sen University, Guangzhou 510006, China
3
Guangdong Province Key Laboratory of Computational Science, Guangzhou 510006, China
4
National Supercomputing Center in Guangzhou (NSCC-GZ), Guangzhou 510006, China
*
Author to whom correspondence should be addressed.
Separations 2022, 9(3), 62; https://doi.org/10.3390/separations9030062
Submission received: 7 January 2022 / Revised: 30 January 2022 / Accepted: 23 February 2022 / Published: 27 February 2022
(This article belongs to the Special Issue Modeling, Simulation, and Optimization of Membrane Processes)

Abstract

:
The development of advanced feed spacers under different working conditions can enhance the performance of the reverse osmosis (RO) desalination process. The 3D-printed experimental results on triply periodic minimal surfaces (TPMS)-based spacers in previous literature indicate that the spacers have higher permeation flux of water compared to those of the common commercial spacers. In this paper, a hybrid modeling approach is developed and applied to predict and evaluate the performance of TPMS-based spacers. The effect of feed channels’ height and porosity on the performance of spacers in brackish water RO (BWRO) process is studied by using a high-throughput approach. The predicted pressure drop by new simulations using the TPMS-based spacers (≈0.09–0.27 bar) from inlet to outlet in a typical two-stage BWRO system is reduced by more than 89% than that of using the commercial spacer (≈2.57 bar). Using the designed advanced spacers, the average permeation flux of water increases more than 8.6% compared to that of the commercial one. With the increase in feed channel height and porosity, the performance of spacers is gradually improved. TPMS-based spacers have significant industrial application prospects.

1. Introduction

About 97% of the earth’s water is brine, and the rest is fresh water, of which, less than 1% is available [1,2]. With the increase in the world’s population, the shortage of freshwater resources has become a common problem all over the world [3,4]. The current technical methods for obtaining fresh water resources include reverse osmosis (RO), electrodialysis, membrane distillation, nanofiltration (NF), etc., among which, RO has become the most widely used technology in the field of desalination due to its low energy consumption and convenient operation [5,6].
Spiral wound membrane (SWM) modules are the most commonly used membrane modules in membrane processes (e.g., RO and NF). For module design, it is critical to balance flow resistance and concentration polarization. In recent years, most studies are focused on the optimal design of feed spacers as an important component of SWM modules, such as RO/NF membrane-based processes. In the RO process, feed spacers support the membrane sheets to form a flow channel. Spacers promotes turbulence in the channel and enhance mass transfer on membrane surfaces while also resulting in an increase in flow resistance. A high-performance spacer can achieve a good balance between concentration polarization and flow resistance. Therefore, it is very important to understand the flow and mass transfer characteristics in spacers-filled channels. The maturity of three-dimensional (3D) printing technology makes it possible to manufacture spacers with complex geometries [7,8,9]; therefore, various novel spacers were proposed. Lin et al. [10] compared the hydraulic and antifouling properties of four feed spacers with non-uniform filament characteristics, and the results show that the number of filament layers (single layer or double layer), the nonuniformity of filament diameter and the width of the thinning zone have a significant influence on the hydraulic performance. Park et al. [11] proposed a new type of honeycomb spacer, which has an advantage over commercial spacers on reducing concentration polarization. Koutsou et al. [12] designed a novel retentate-spacer which includes the symmetrical connection of spherical nodes and cylindrical filaments to form a net-type structure with parallelogram units. The simulated results show that the flow field and local shear stress and mass-transfer-coefficient distributions on membranes, and shear stress distributions on spacer filaments are rather uniform. In addition, some researchers suggest that applying some characteristics (such as slip velocity) on the membrane surface can also effectively reduce concentration polarization and enhance mass transfer [13,14,15].
TPMS has a large surface–volume ratio; the average curvature of all points on the surface is zero, and it has a smooth transition and good flow characteristics [16]. TPMS-based structures were studied in the fields of aerospace thermal protection structure [17], bone tissue engineering [18], and biological separation [19]. In recent years, it has also begun to appear in the experimental research on the process of membrane separation [20]. To the best of our knowledge, in the field of RO desalination, there is rare report on systematic design of TPMS-based spacers using advanced computational technologies.
In this paper, the multi-scale hybrid model is adopted, which can quickly evaluate the RO system performance of spacers. Feed spacers based on TPMS, e.g., Schwarz crossed layers of parallel, Schoen IWP, Schwarz Diamond, Lidinoid, and IW, are studied and developed by using the hybrid model. Through the hybrid model, the pressure drop and water permeation flux of TPMS-based spacers and commercial spacer at system level are evaluated and compared, and the fluid and mass transfer characteristics of TPMS-based spacers are analyzed and compared with that of the commercial spacer. Furthermore, the effects of various feed channels’ porosities and heights on the performance of spacers are also studied by using a high-throughput approach.

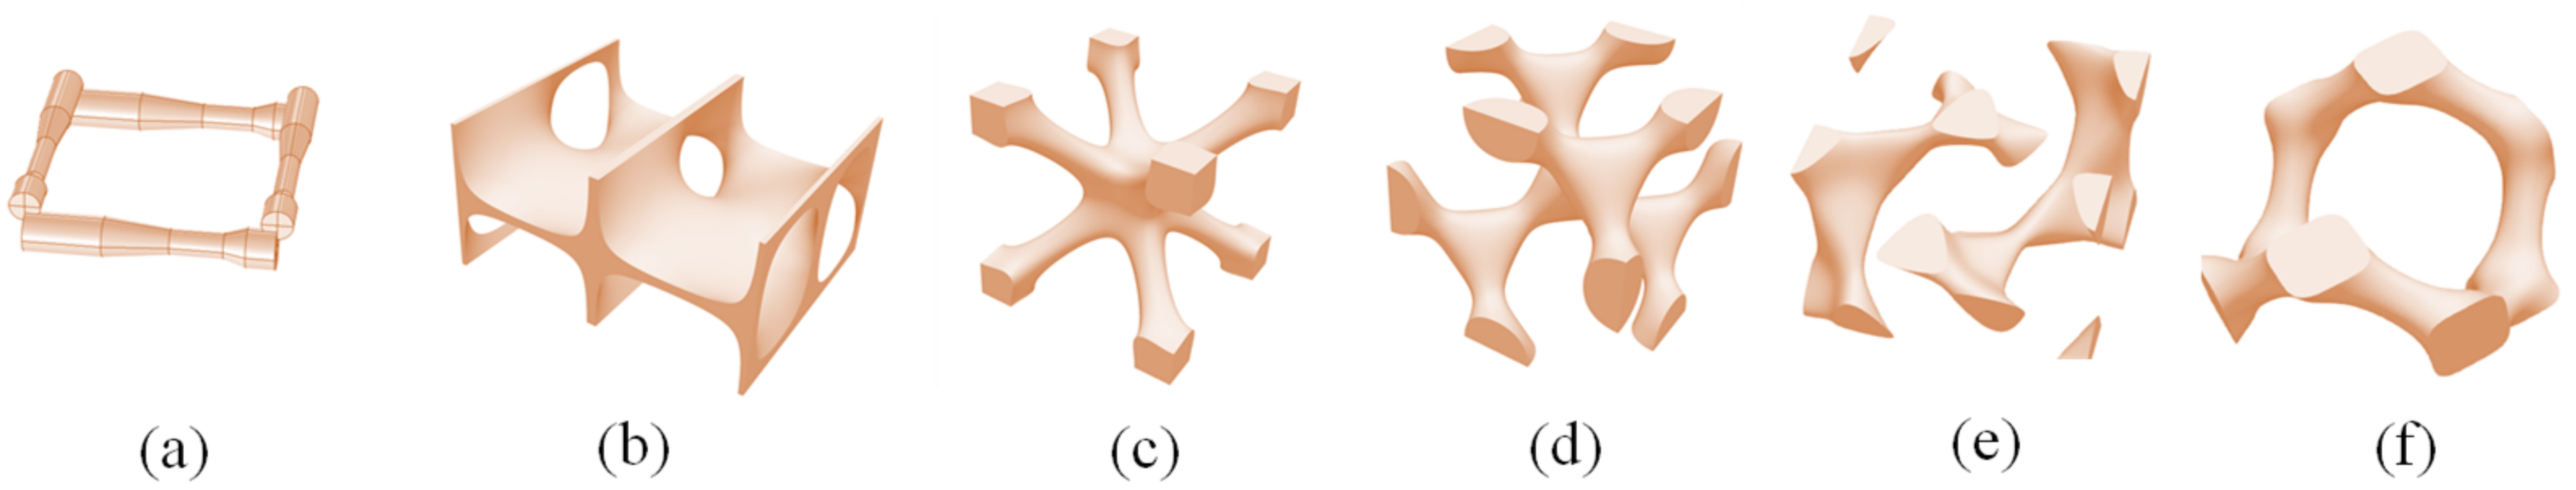
2. Design of TPMS Spacers

In this paper, five typical TPMS-based spacers, namely, Schwarz crossed layers of parallel (CLP), Schoen IWP (IWP), Schwarz Diamond (D), Lidinoid (L), and IW, are studied. The level set approximation equations of TPMS are shown in Equations (1)–(5), respectively [20,21,22,23,24]. The commercial spacer (thickness: 28 mil, 1 mil = 0.0254 mm) used in engineering is compared to TPMS-based spacers. The detailed geometry parameters values of the commercial spacer can be found in the literature [25].
s i n ( z ) s i n ( y ) 0.4 s i n ( 1.2 x ) c o s ( z ) c o s ( y ) = C  
2 ( c o s x c o s y + c o s y c o s z + c o s z c o s x ) ( c o s ( 2 x ) + c o s ( 2 y ) + c o s ( 2 z ) = C  
s i n x s i n y s i n z + s i n x c o s y c o s z + c o s x s i n y c o s z + c o s x c o s y s i n z = C
1 / 2 s i n 2 x c o s y s i n z + s i n 2 y c o s z s i n x + s i n 2 z c o s x s i n y 1 / 2 c o s 2 x c o s 2 y + c o s 2 y c o s 2 z + c o s 2 z c o s 2 x + 0.15 = C
10 ( s i n ( x π / 4 ) s i n ( y π / 4 ) s i n ( z π / 4 ) + s i n ( x π / 4 ) c o s ( y π / 4 ) c o s ( z π / 4 ) + c o s ( x π / 4 ) s i n ( y π / 4 ) c o s ( z π / 4 ) + c o s ( x π / 4 ) c o s ( y π / 4 ) s i n ( z π / 4 ) ) 0.7 c o s 4 x + c o s 4 y + c o s 4 z = C
where x , y , and z are the Cartesian coordinate system, and C is the constant that controls the porosity of the spacers.
As shown in Equation (1), using the level set equation [21], two different strategies are used to perform topological analysis on the TPMS to create the unit structures [26]. In order to minimize the contact area between the spacers and the membranes and reduce the risk of biological contamination on the contact area between the membranes and the spacers [27], the spacers based on CLP and IWP are formed by the first strategy, in which solid structures are created by thickening TPMS, and the spacers based on D, L, and IW are formed by the second strategy, in which the solid structures are created by solidifying the volume separated by TPMS. The periodic unit structure of the commercial spacer and TPMS-based spacers is shown in Figure 1. All geometric structures of the TPMS-based spacers in this paper are constructed by the free software MS Lattice [28]. In previous experimental studies [20], TPMS-based spacers were fabricated by 3D printing technology, and the material used was PA 2202 (black) thermoplastic material, which is also used by default in the TPMS-based spacers considered in this work.

Porosity and Hydraulic Diameter

The porosity ( ε ) of the spacer-filled channel is defined by the following equation [29].
ε = V tot V sp V tot  
where V tot (m3) and V sp (m3) are the total volume of the channel and the volume of the spacer, respectively.
Hydraulic diameter ( D H ) is defined by the following equation [30]:
D H = 4 ε 2 / h sp + ( 1 ε ) S sp / V sp
where S sp (m2) is the surface area of the spacer, and h sp (m) is the height of the spacer. Porosity and hydraulic diameter of the computational domains formed by all the spacers studied are shown in Table 1.

3. Numerical Method

The multi-scale hybrid model developed in previous work [31] is applied in this paper. Firstly, the 3D flow and the concentration fields in the spacer-filled channel are directly calculated. Then, the power–law relationships between the pressure drop per unit length and the average mass transfer coefficient on membrane surfaces, with respect to flow rate, are fitted and obtained, and further applied to establish the meter-scale system RO model with the consideration of concentration polarization.

3.1. Modeling and Numerical Simulations of Spacer-Filled Channels in Millimeter Scale

The commercial finite element CFD software COMSOL Multiphysics 5.3a is used to numerically solve the Navier–Stokes equations and the mass transfer equation. The spacer is composed of a repeated periodic unit structure; hydrodynamics and transfer characteristics of salt in the feed channel can be obtained through the high-fidelity multphysics coupling modeling and numerical simulation of the computational domain containing a few spacer units in the feed direction.

3.1.1. Governing Equations

The physical phenomena involved in the RO process include fluid flow (Navier–Stokes equations) and the mass transfer of salt (Diffusion-convection equation). The Navier–Stokes equations under laminar flow conditions can be described mathematically as
ρ ( u ) u = [ - P I + μ ( u + ( u ) T ) ]
( ρ u ) = 0
where ( / x , / y , / z ) T and u ( u , v , w ) T denote the nabla operator and the velocity vector along the x , y , and z coordinates respectively.
The mass transfer control equation of salt is as follows:
( D c ) = u c
where D (m2/s) and c (mol/m3) are the diffusivity and molar concentration of salt in the feed water, respectively.

3.1.2. Boundary Conditions

In the 3D CFD model, periodic boundary conditions are imposed on both sides of the spacer-filled channel along the feed direction and the membrane surfaces are considered as the permeable walls. The permeation flux of fresh water J w (m3/(m2∙h)) is expressed as
J w = L p ( P P p f os c )
where L p (lmh/bar) is the hydraulic permeability, P (bar) is the hydraulic pressure on the membrane surface, P p (bar) is the hydraulic pressure on the permeate side, and f os (bar/(mol/m3)) is van’t Hoff factor to convert concentration to osmotic pressure. The boundary condition (Equation (12)) that the flux of salt is zero is applied to the membrane surfaces, that is, the intercept rate of salt is assumed to be 100%.
( D c + c u ) n = 0
where n is the unit normal vector of the membrane surfaces.
The adopted 3D CFD model is a fully coupled model that couples fluid and mass transfer. By applying the above boundary conditions, the Navier–Stokes equations and mass transfer equation are solved to obtain the hydrodynamics and the transfer characteristics of salt component in the feed channel. The value of related parameters used in the simulations can be found in the literature [31].

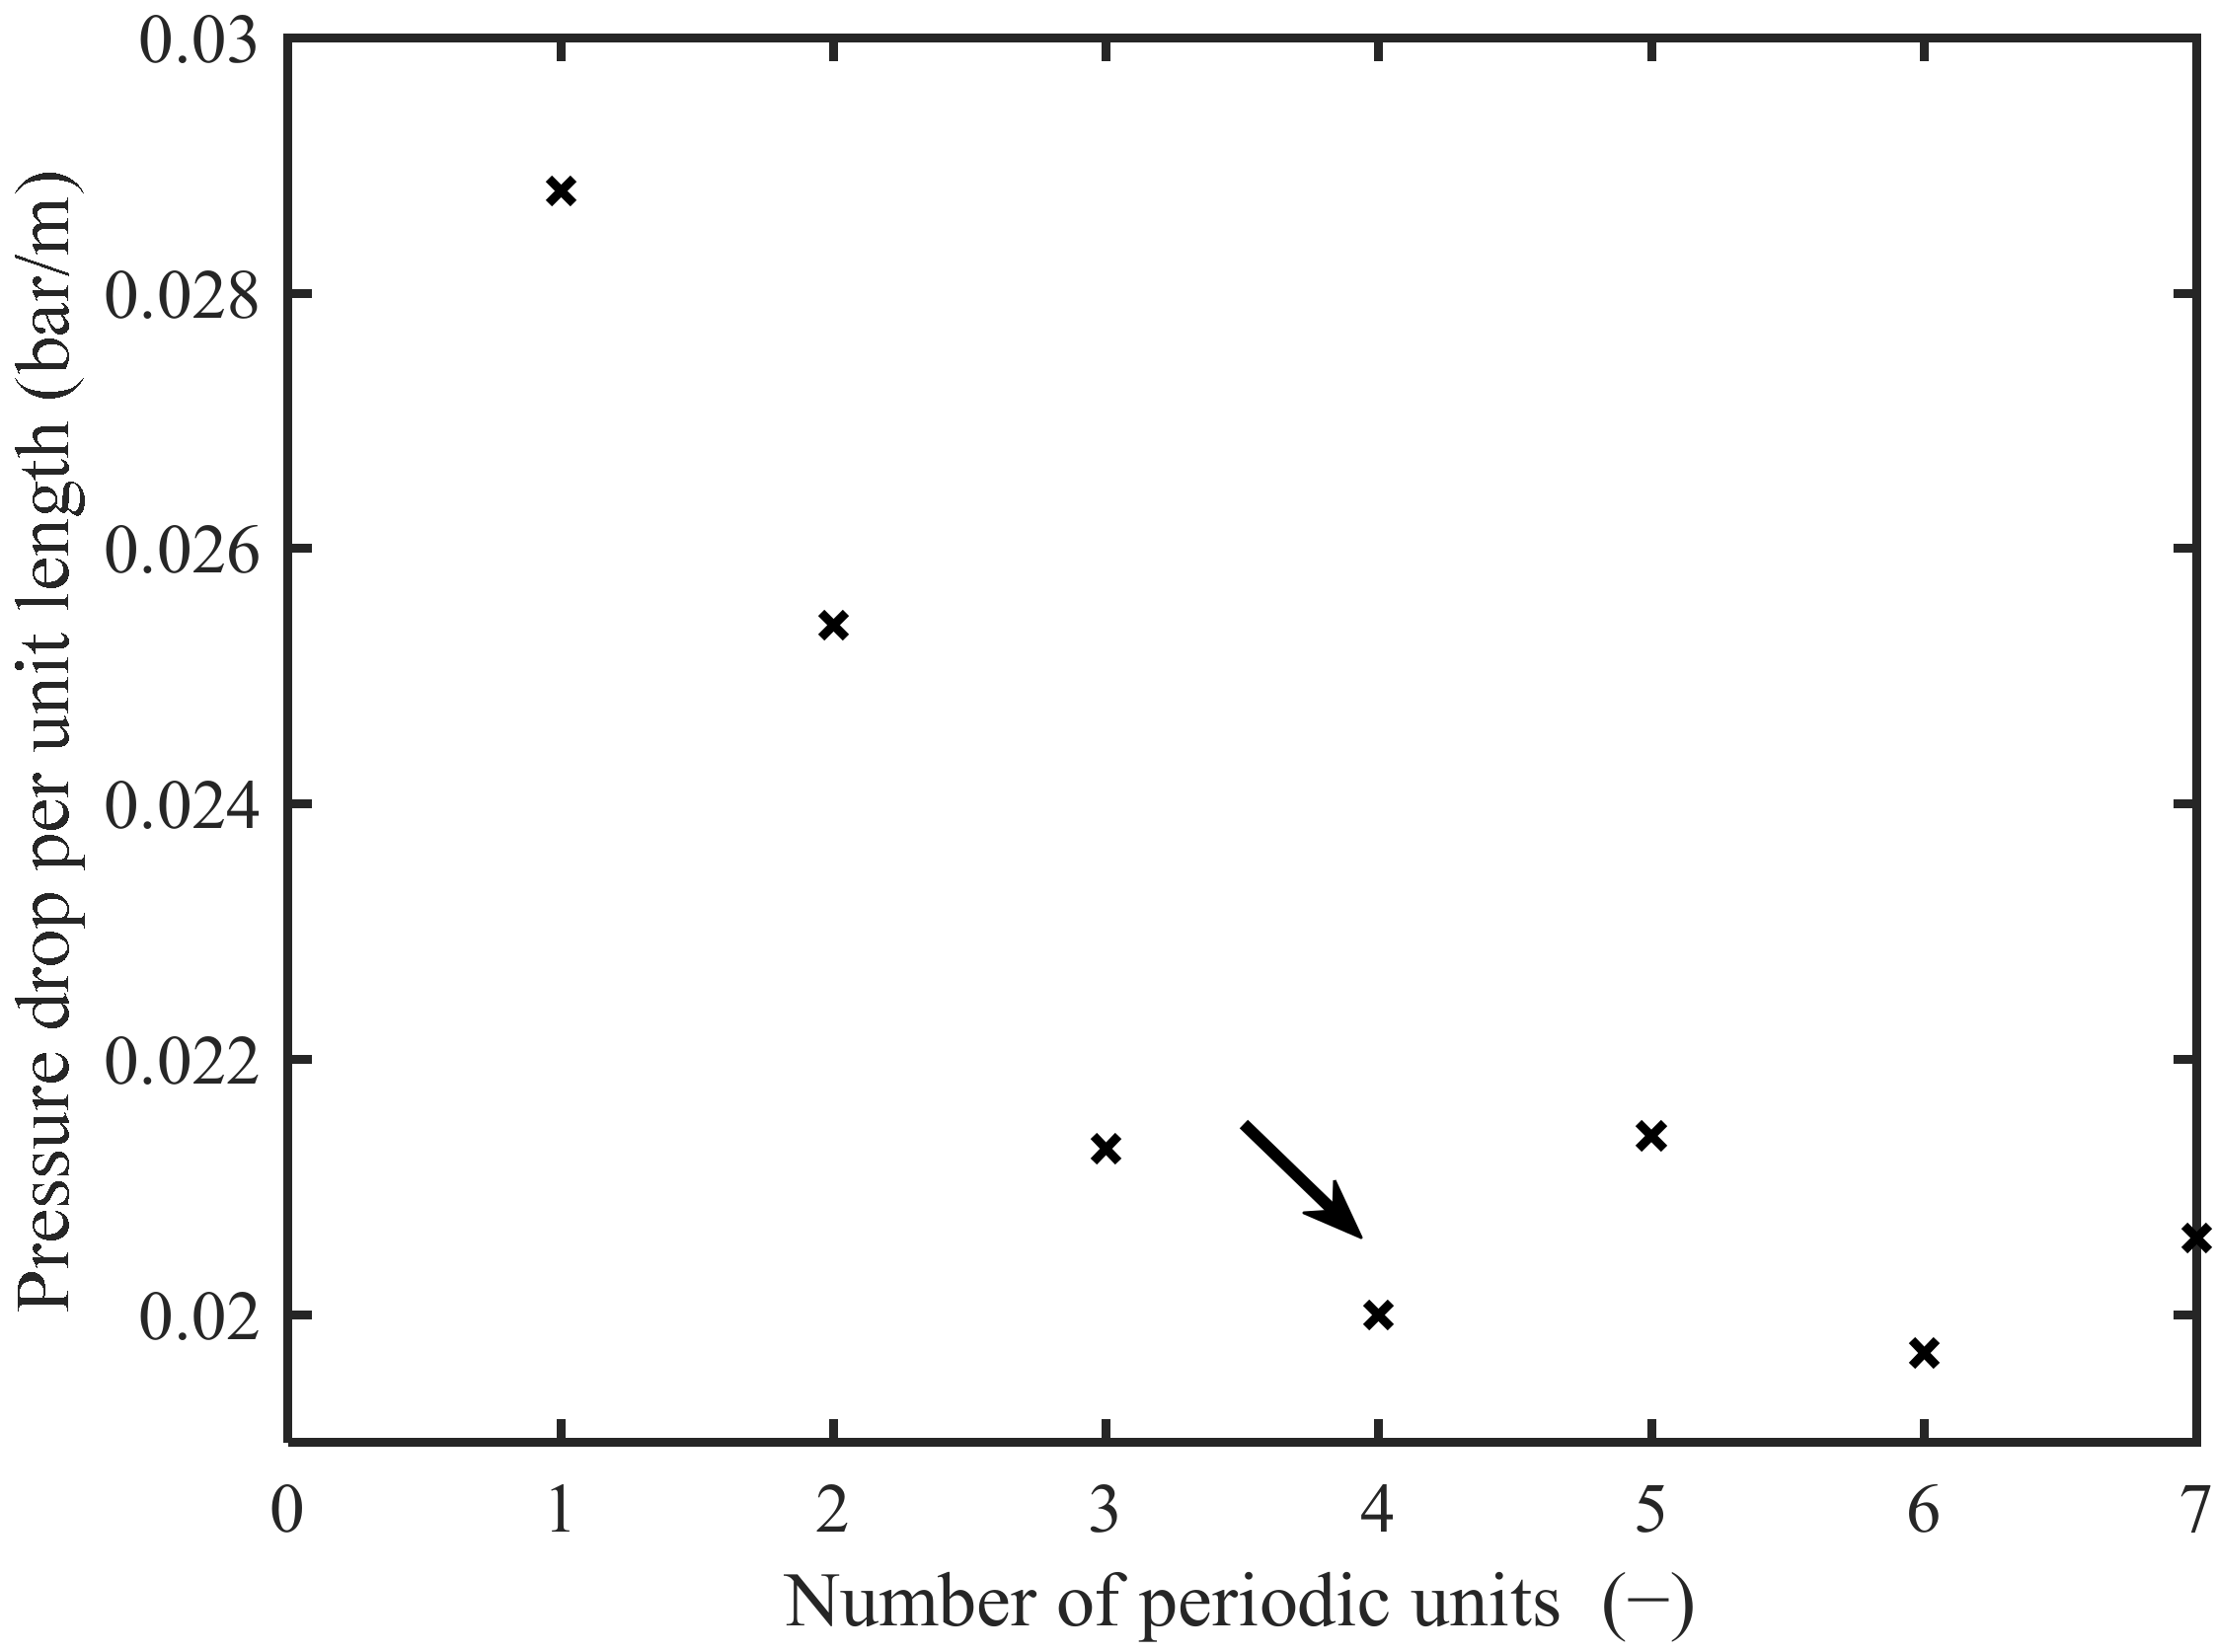
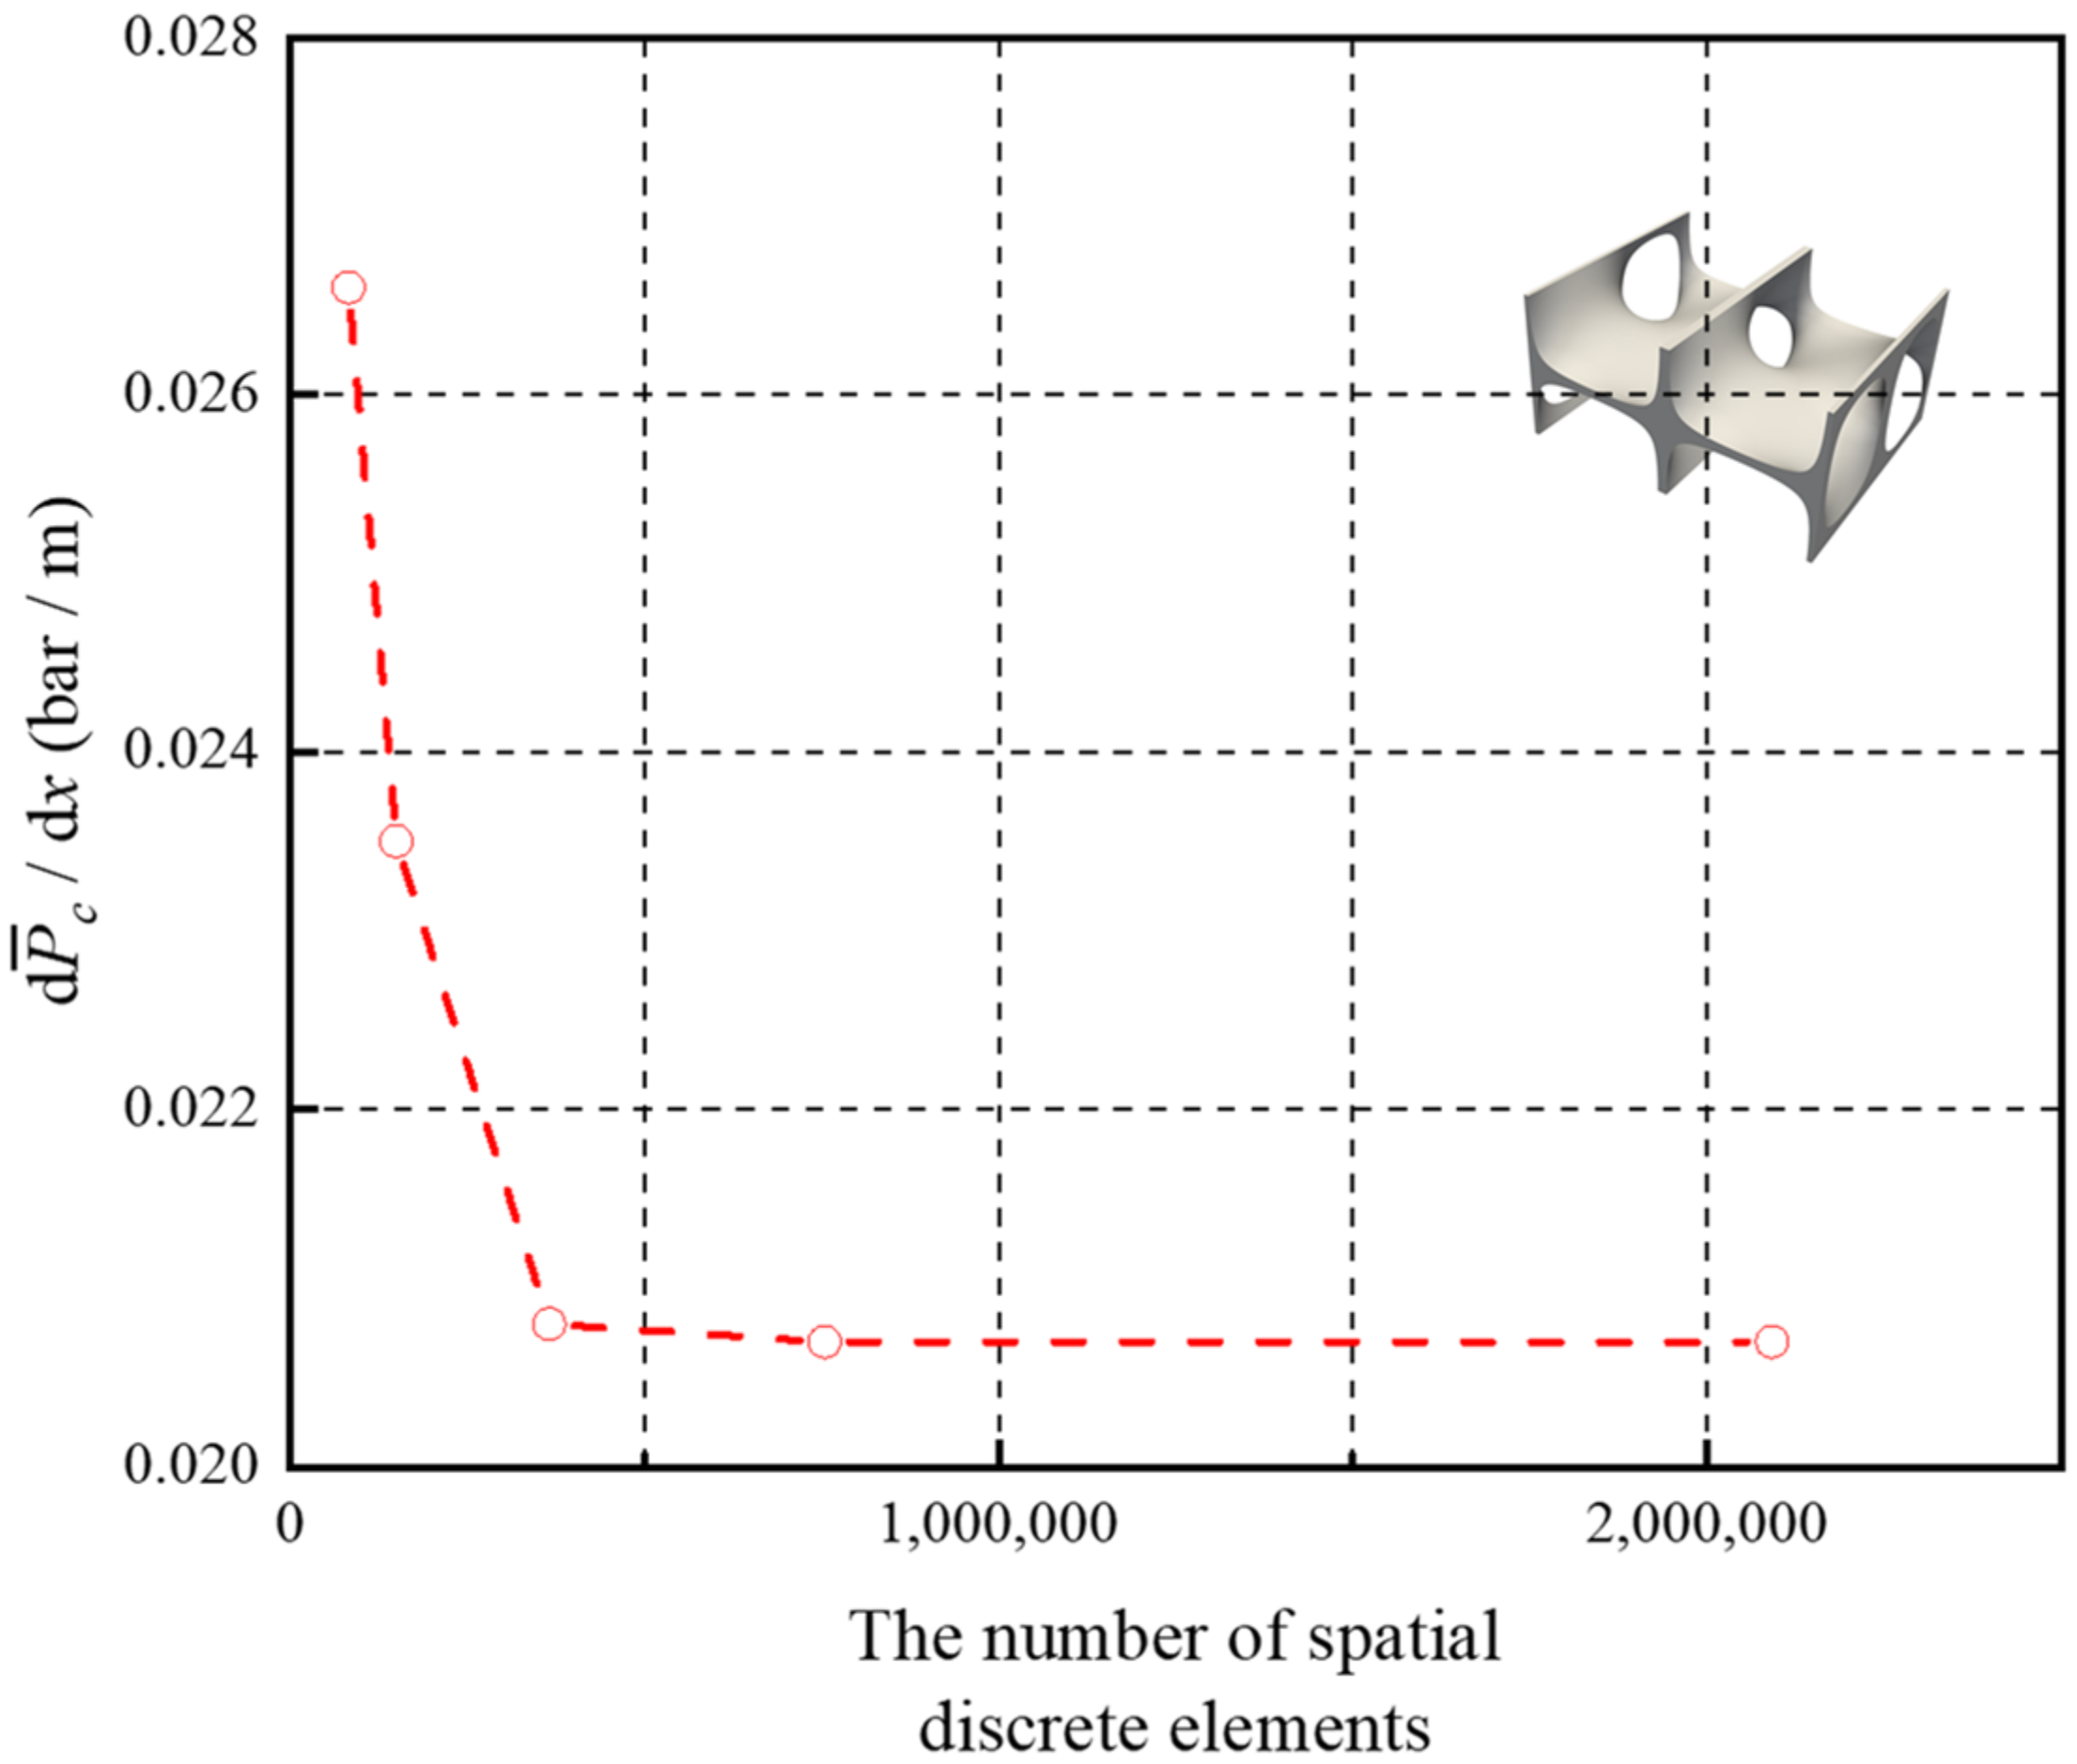
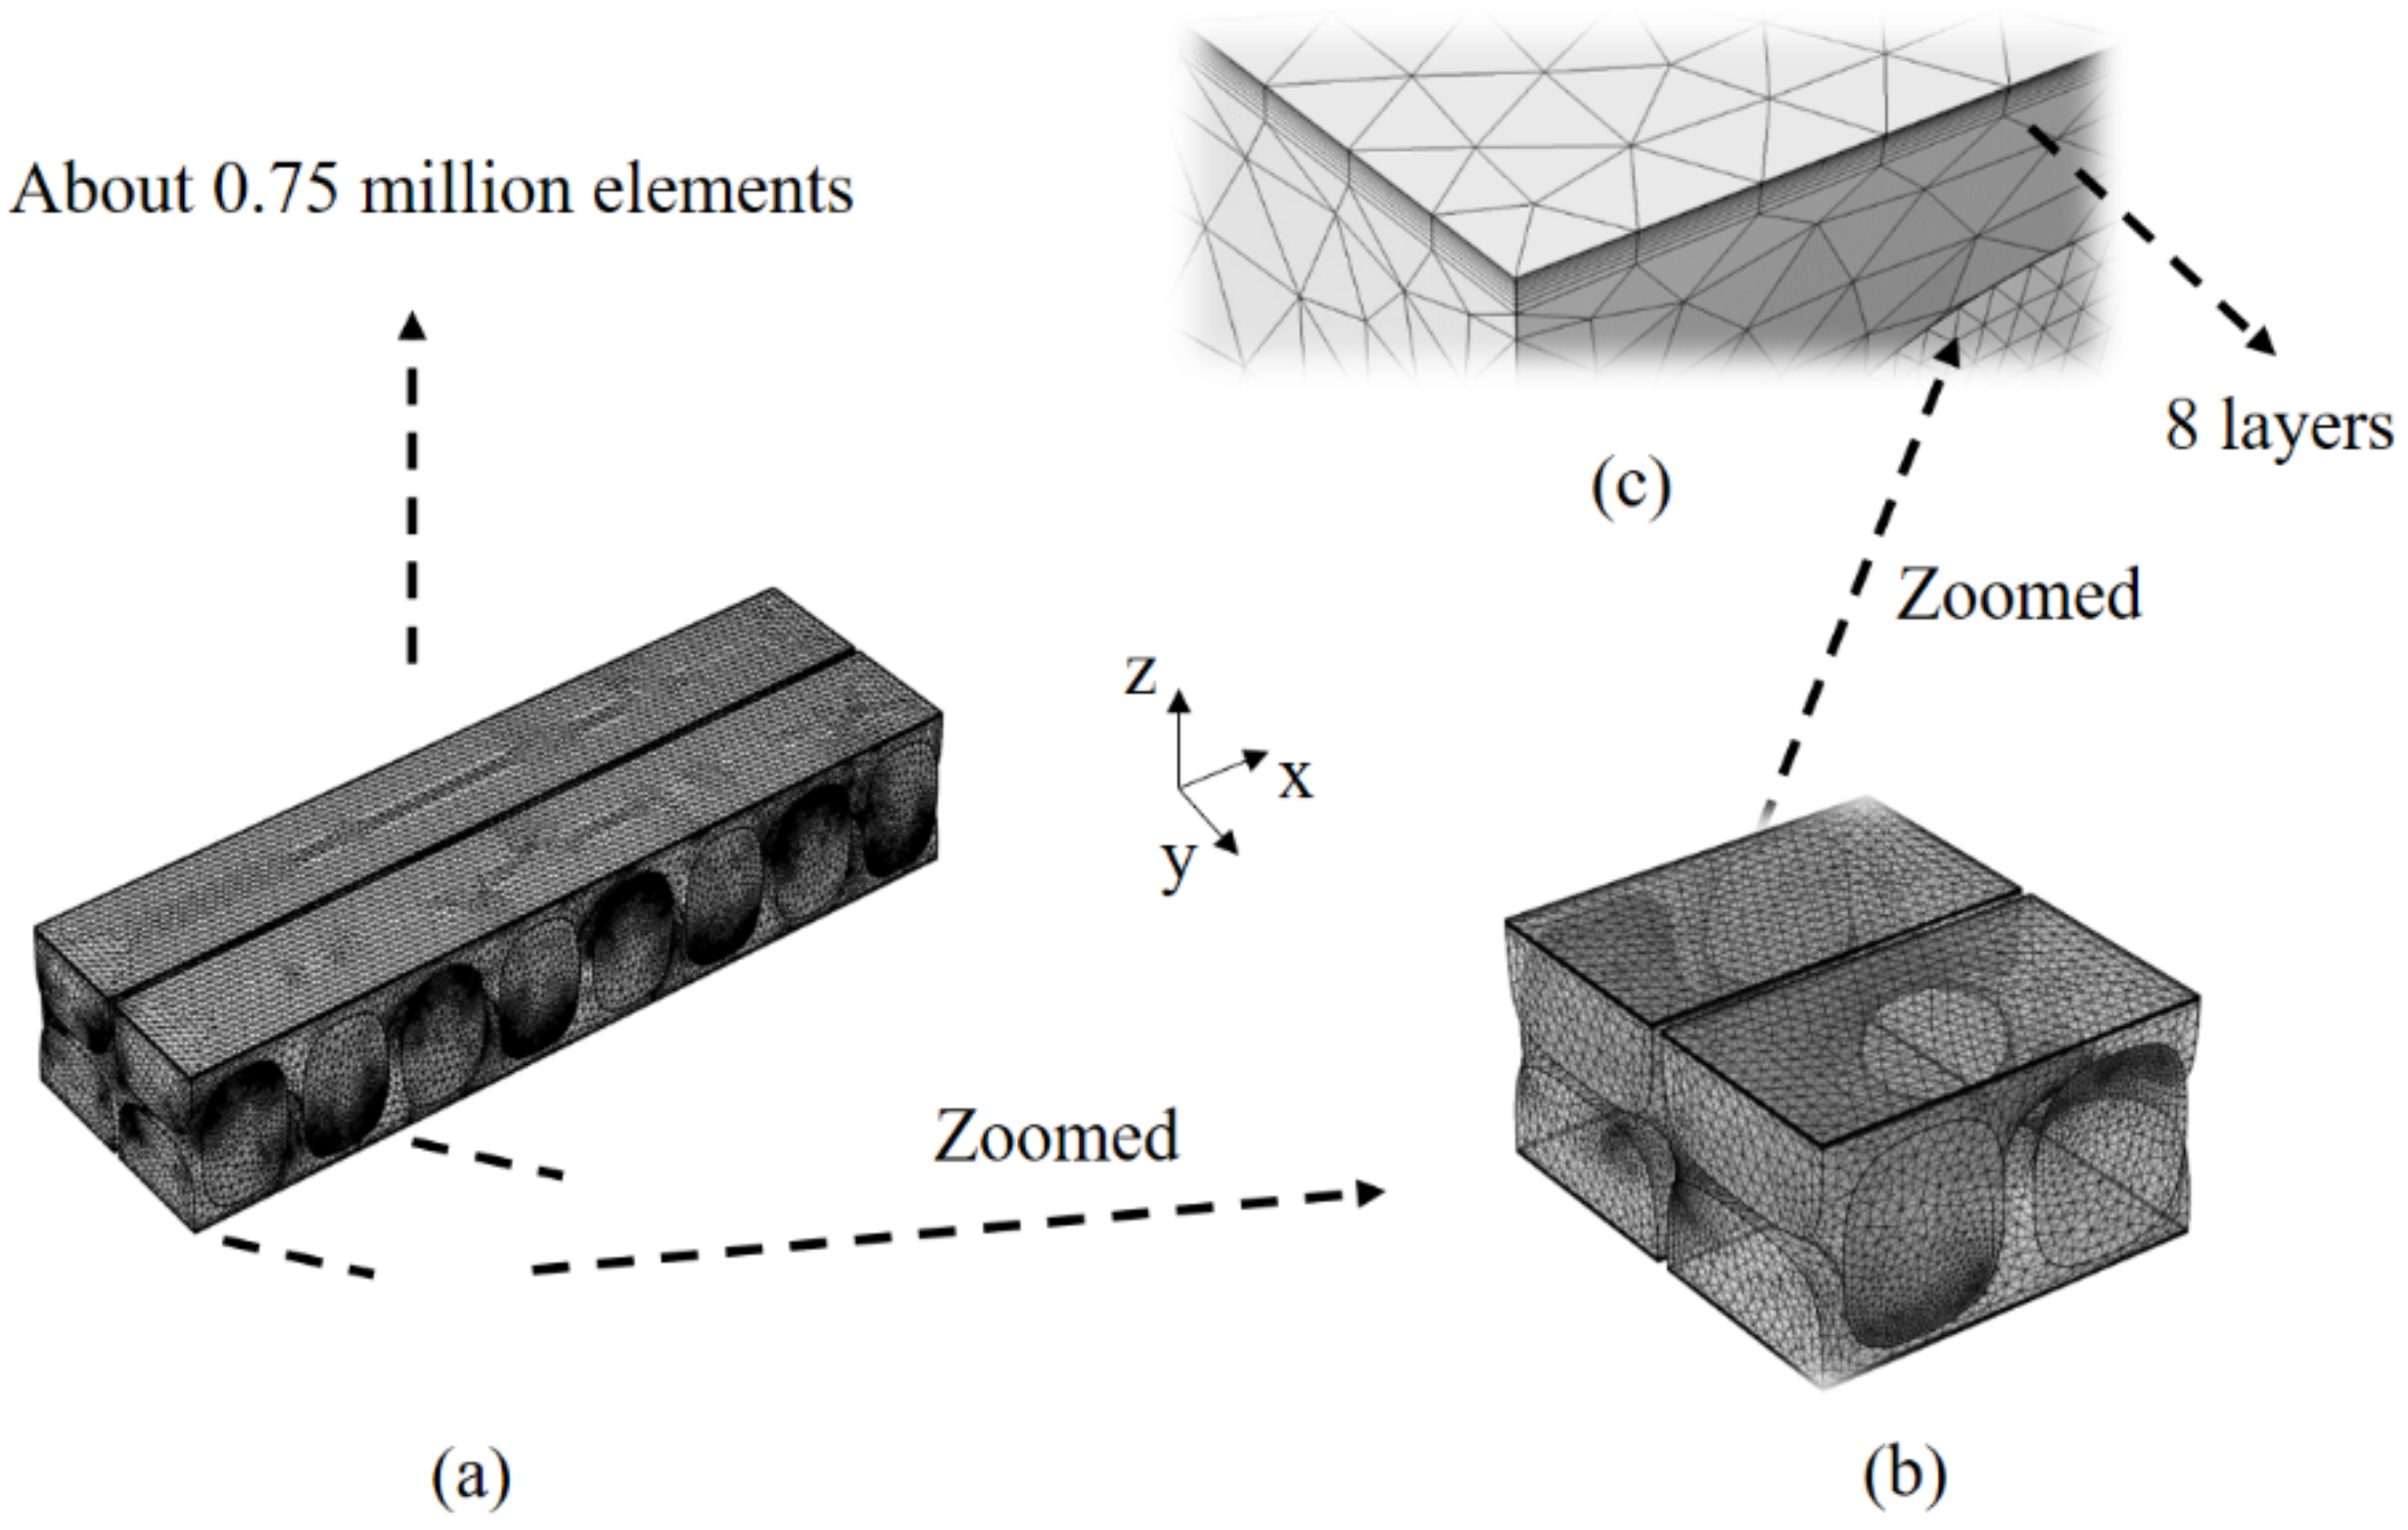
3.1.3. Selection of Computational Domain and Mesh Independence Test

The pressure drop per unit length varies little with the increasing of periodic units when the computational domain is formed by more than four TPMS-based spacers units, as is shown in Figure 2. The size of the computational domain is shown in Table 2 with respect to commercial 28 mil spacer and the five TPMS-based spacers.
Mesh independence analysis is performed using tetrahedral discrete elements. The estimated first order derivative of average pressure ( d P ¯ c / d x , bar/m) with respect to the number of spatial finite elements for models is shown in Figure 3, which indicates that the computational results are already basically unchanged by using more than 0.75 million meshes. Mesh independence analysis by other spacers is consistent with that of the CLP spacer. When the spatial finite elements of the spacer-filled computational domains are more than 1.34 [32], 0.75, 1.47, 0.61, 1.26, and 0.95 million, respectively, the computational results are already basically unchanged. Discretization model of the computational domain formed by CLP spacer is shown in Figure 4. Eight layers of boundary layer mesh are applied to the top and bottom membrane walls to capture the drastically changing velocity and concentration fields near the membrane walls.

3.2. Establishment and Solution of Meter-Scale RO System Model

The power–law relationships between the pressure drop per unit length and the average mass transfer coefficient on membrane surfaces with respect to flow rate can be obtained from the millimeter-level high-fidelity CFD model. The above relationships are further substituted into the established system-level RO model (meter level) [31], which is shown in Equation (13), to evaluate the performance of spacers in this paper. The RO system in this work refers to an entire two-stage BWRO system [31].
d Q d X = J w A X = 0 , Q = Q 0 , d ( Δ P ) d X = k 2 Q t 2 X = 0 , Δ P = Δ P 0 , J w = L p [ Δ P Δ π exp ( J w / k ¯ m ) Δ π = Q 0 Δ π 0 / Q k ¯ m = k 3 Q t 3
where dimensionless length X = x n meb l x , X 0 , 1 indicates first stage RO, X 1 , 2 indicates the second stage RO. x (m) is the length from the inlet to the RO system along the flow ( x direction) direction, and l x (m) is the length of spacer parallel to flow ( x direction) per membrane element. n meb is the number of membrane elements per vessel, Q (m3/h) is the total flow rate in feed channel, and Δ P (bar) is the transmembrane pressure difference. Q 0 (m3/h) and Δ P 0 (bar) are the inlet flow rate and the inlet transmembrane pressure difference, respectively, and k ¯ m (m/s) is the average mass transfer coefficient on membrane surface. k 2 and k 3 are the front factors, and t 2 and t 3 are exponential coefficients. The definitions of k ¯ m (m/s) is given in Equation (14). Q (m3/h) can be calculated by Equation (15).
k ¯ m = 0 L d x 0 W ( D c r c w c z z = H 2 ) d y 0 L d x 0 W d y
where c r (mol/m3) and c w (mol/m3) represent the concentration of the brine in the feed channel and the concentration on membrane walls respectively.
Q = n sp N pv H l y ε u ¯
where n sp and N pv correspond to the number of spacers of each membrane element and the number of first or second stage pressure vessels respectively. l y (m) is each membrane element perpendicular to the length of the spacer in the flow ( y direction), and u ¯ (m/s) is the average inlet velocity. The relevant parameters of RO system can be found in previous work [31,32].

4. Results and Discussion

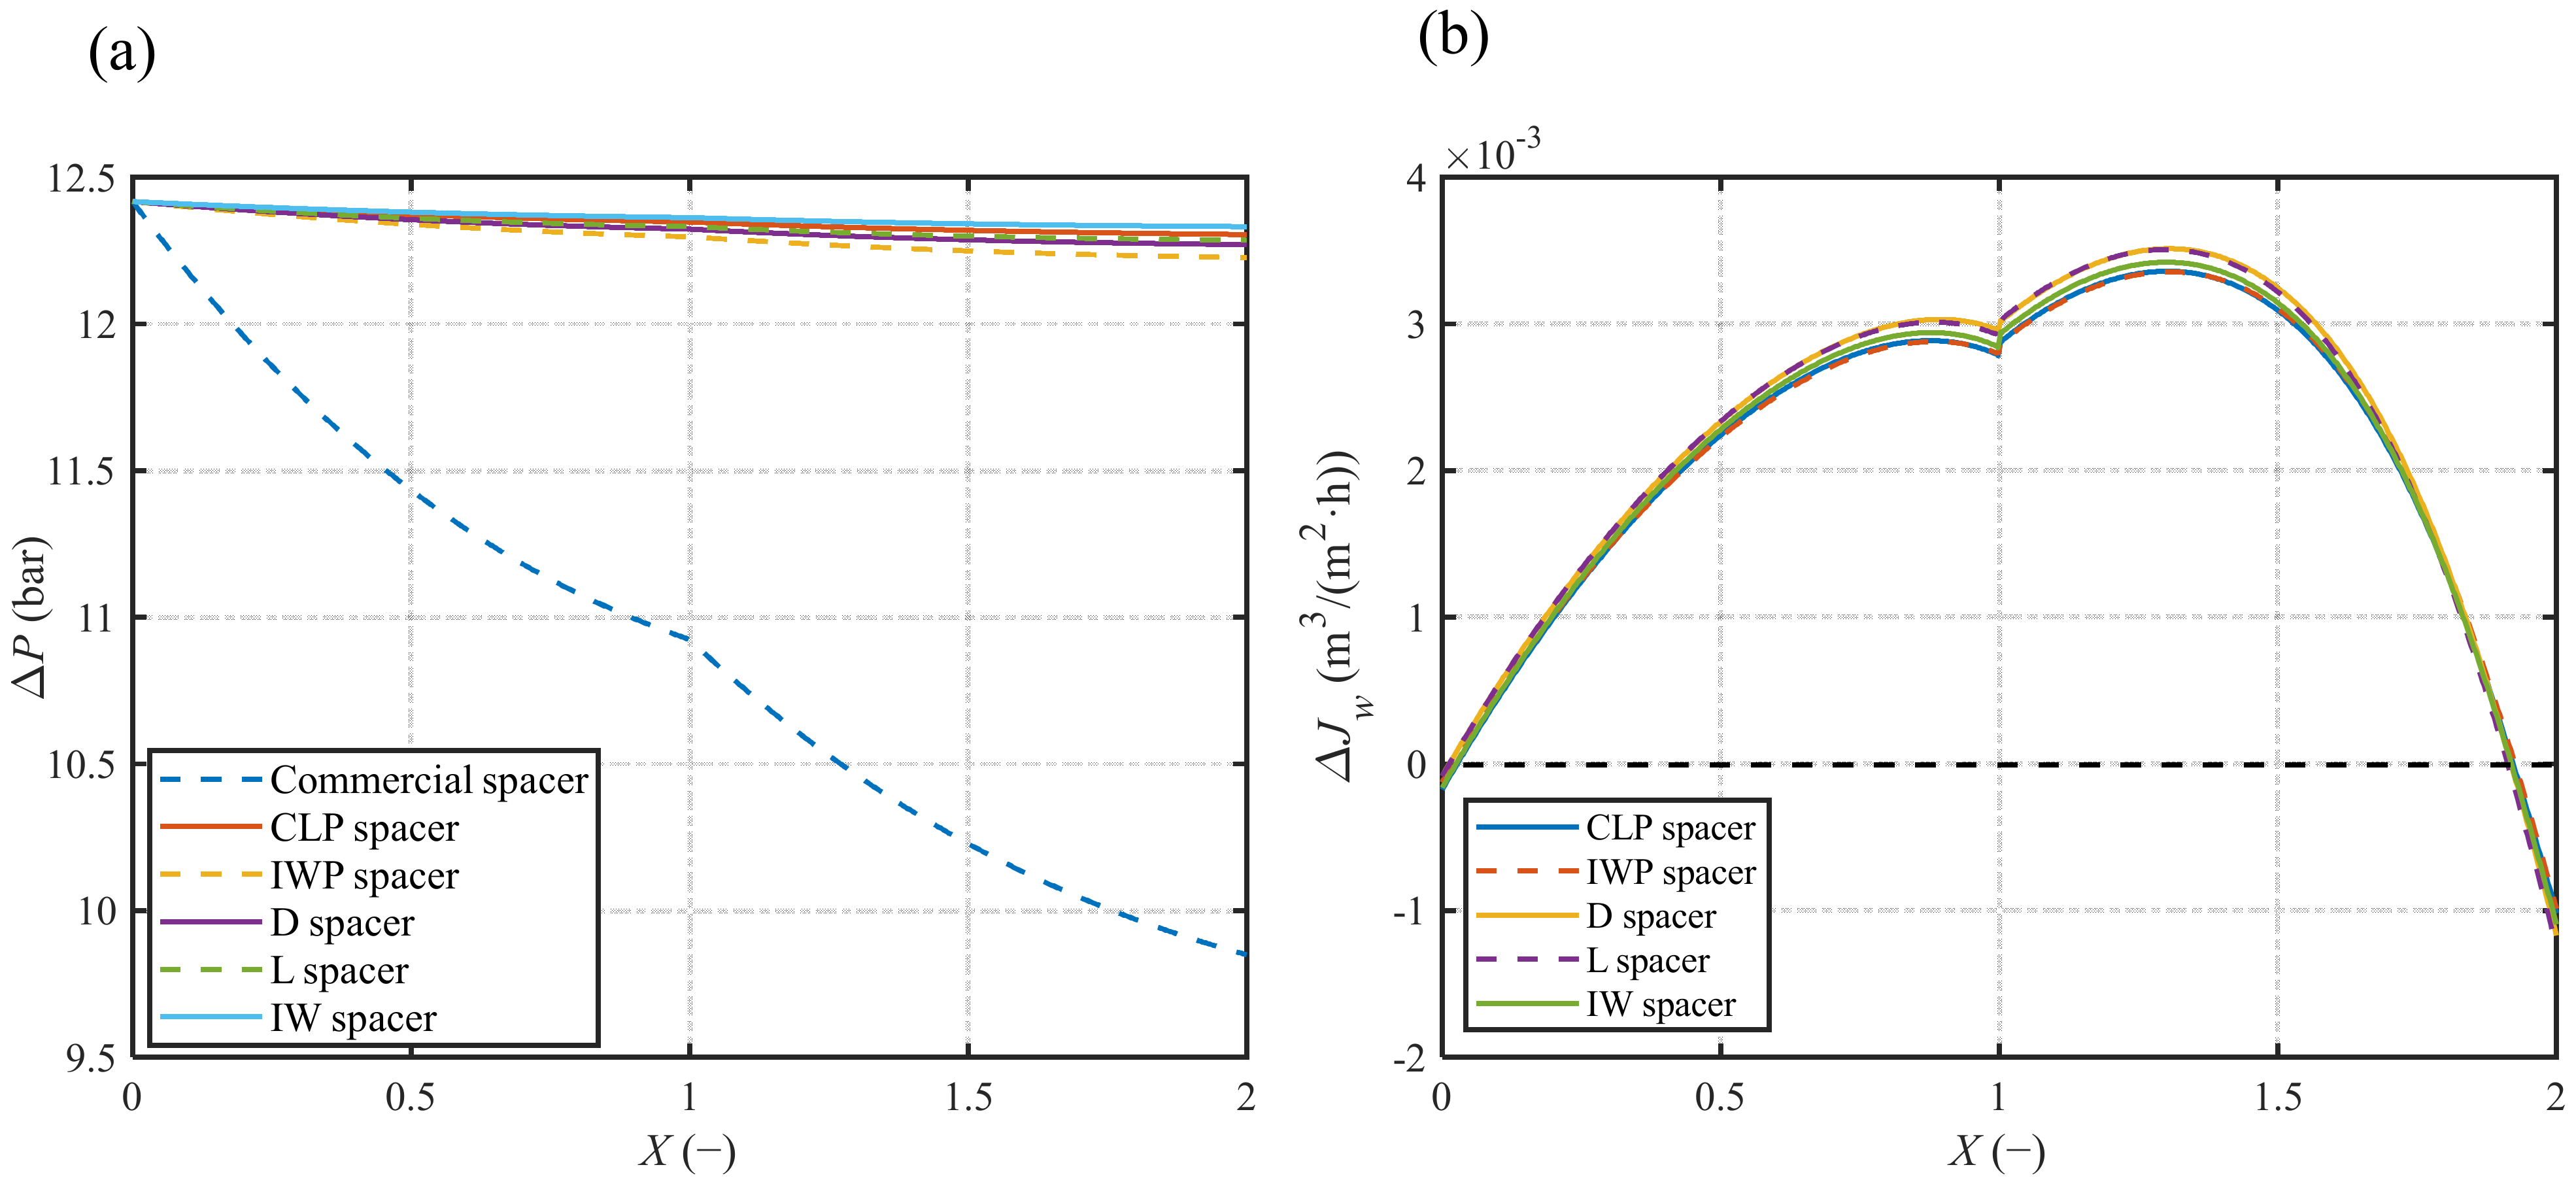
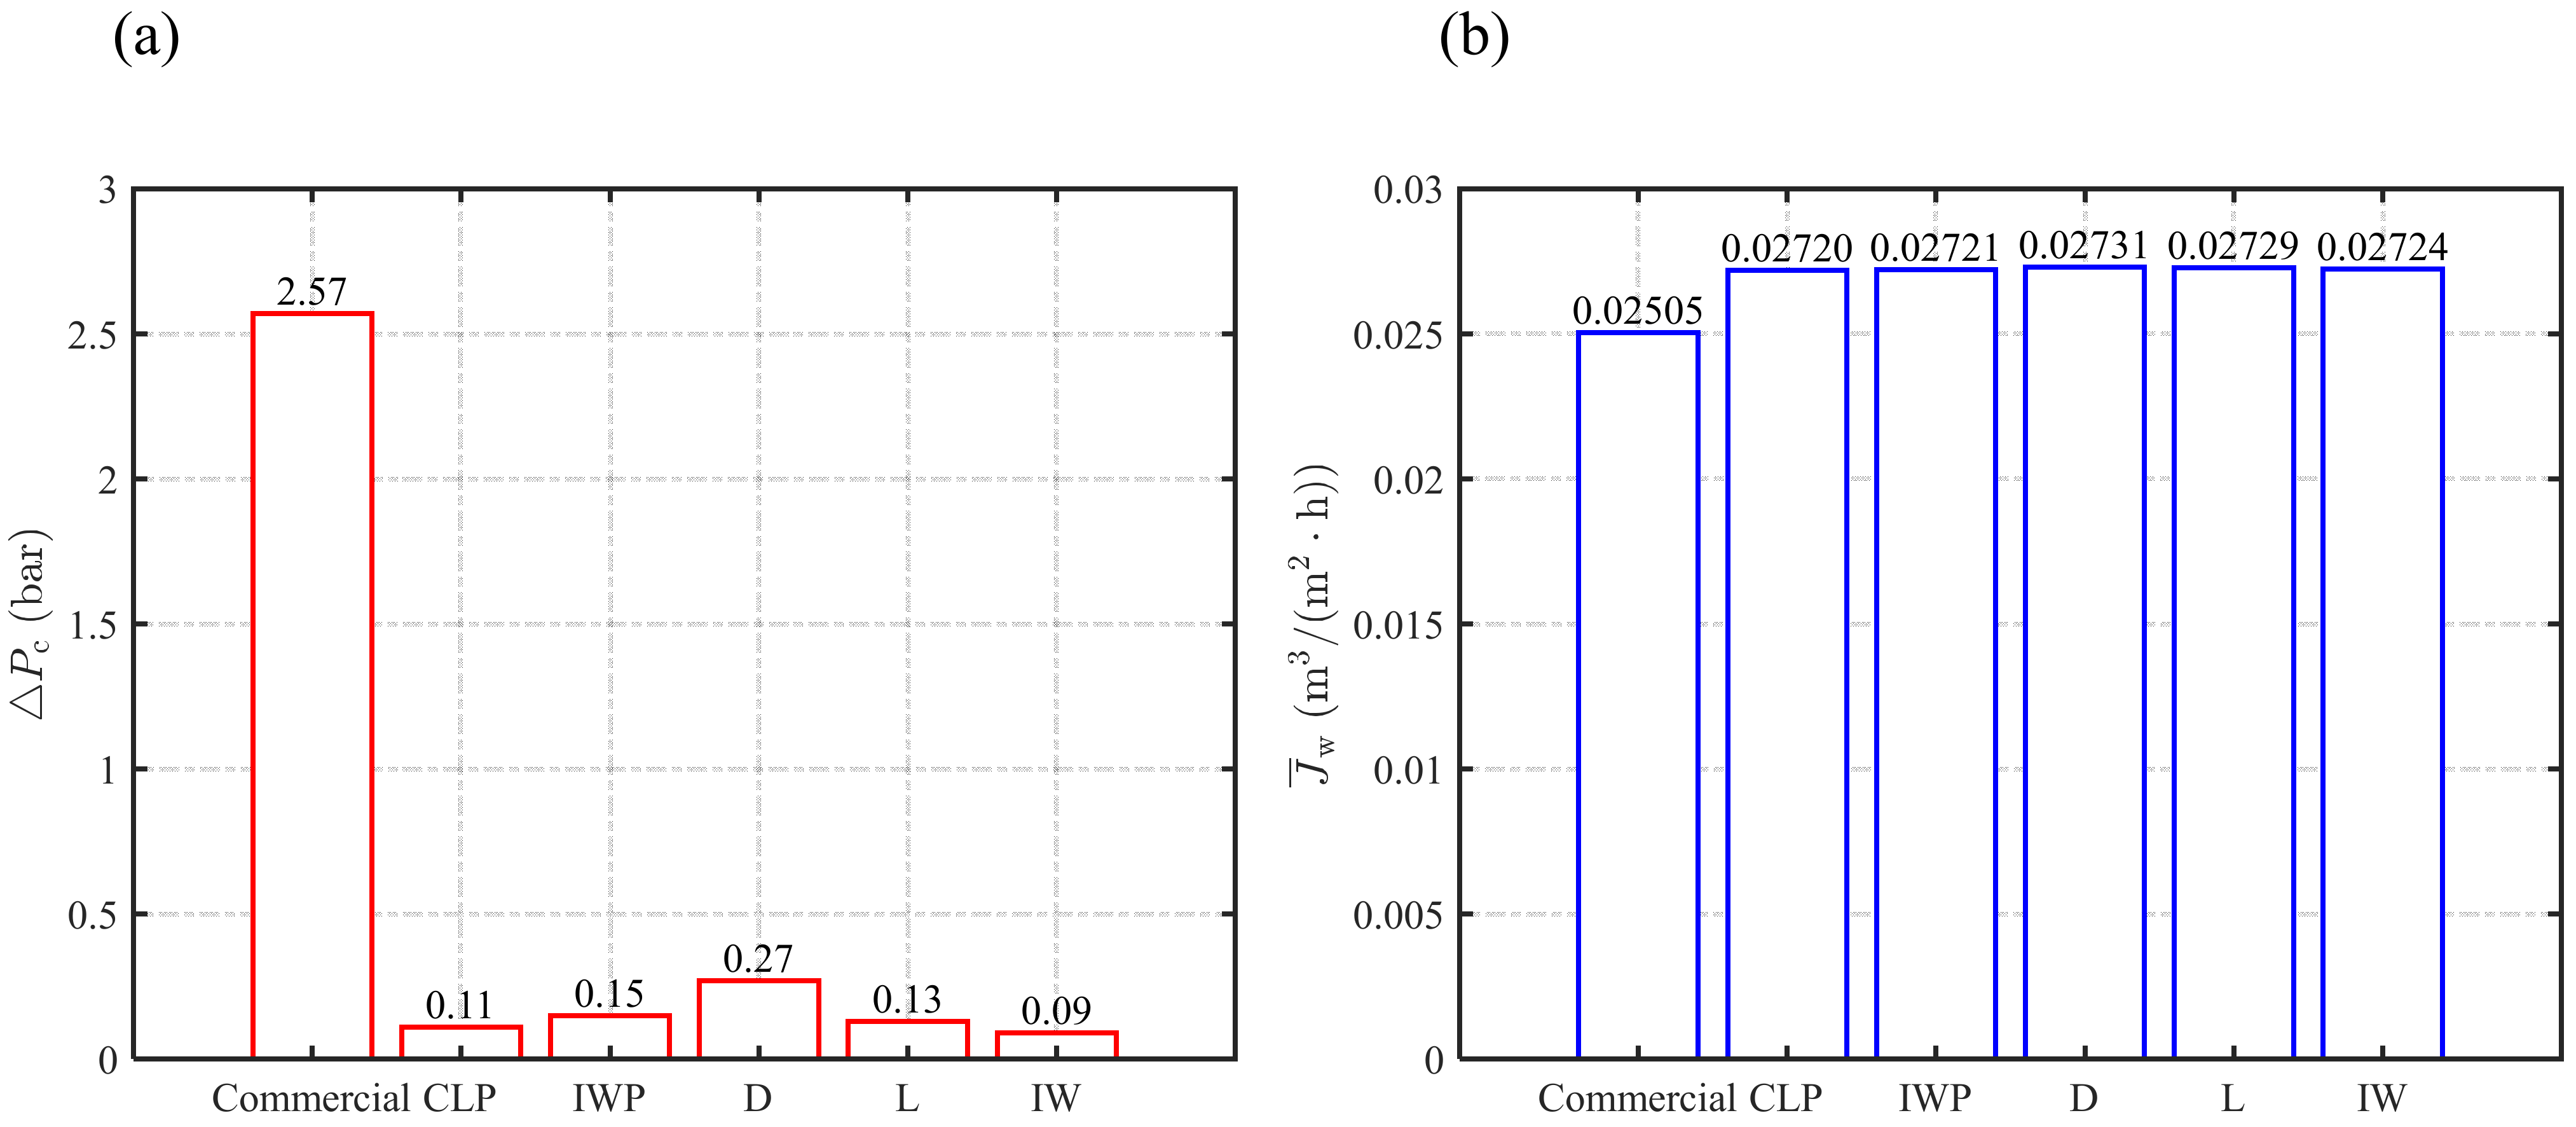
4.1. RO System-Level Performance

The comparison of simulated results (commercial spacer) using the hybrid model with plant data is shown in recent literature [31,32], and the hybrid model can predict well the performance of the spacer at the RO system level. In the RO industrial process, the inlet flow rate is generally used, and we use the same inlet flow rate (346 m3/h) for the established BWRO systems with respect to various feed spacers, referred to the measurement of a typical BWRO plant [31]. The inlet flow rate is converted to the corresponding inlet flow velocity. In order to obtain the local hydrodynamics and transport characteristic at various locations along feed direction of RO system, we calculate CFD models under different average inlet velocity conditions with respect to TPMS-based spacers (0.005–0.10 m/s) and commercial 28 mil spacer (0.05–0.25 m/s). The power–law relationships between the pressure drop per unit length and the average mass transfer coefficient, with respect to flow rate, is established.
The transmembrane pressure, Δ P (bar), and difference value of water permeation flux between TPMS-based spacers and commercial spacer, Δ J w (m3/(m2∙h)), for the whole membrane systems are presented in Figure 5a,b respectively. The total pressure drop, Δ P c (bar), and average permeation flux of water, J ¯ w (m3/(m2∙h)), for the whole RO systems are shown in Figure 6a,b respectively.
Compared with the commercial spacer, TPMS-based spacers have obvious advantages in pressure drop and water flux. The total pressure drop is about 2.57 bar for the commercial spacer. As a comparison, the transmembrane pressure in TPMS-based spacers is almost flat along the feed direction. Among these TPMS-based spacers, the IW structure performs best in terms of pressure drop, with a total pressure drop of 0.09 bar. Compared with that of the 28 mil commercial spacer, average permeation flux of water for CLP, IWP, D, L, and IW spacers increased by 8.6%, 8.6%, 9.0%, 8.9%, and 8.7%, respectively. Among them, the D and L spacers are slightly better than other TPMS-based spacers in average permeation flux of water. Therefore, TPMS-based spacers perform well at the RO system level and have significant industrial application prospects in the brackish water RO desalination process. Furthermore, the local flow and mass transfer characteristics of TPMS-based spacer-filled channels are analyzed and discussed in the next section.

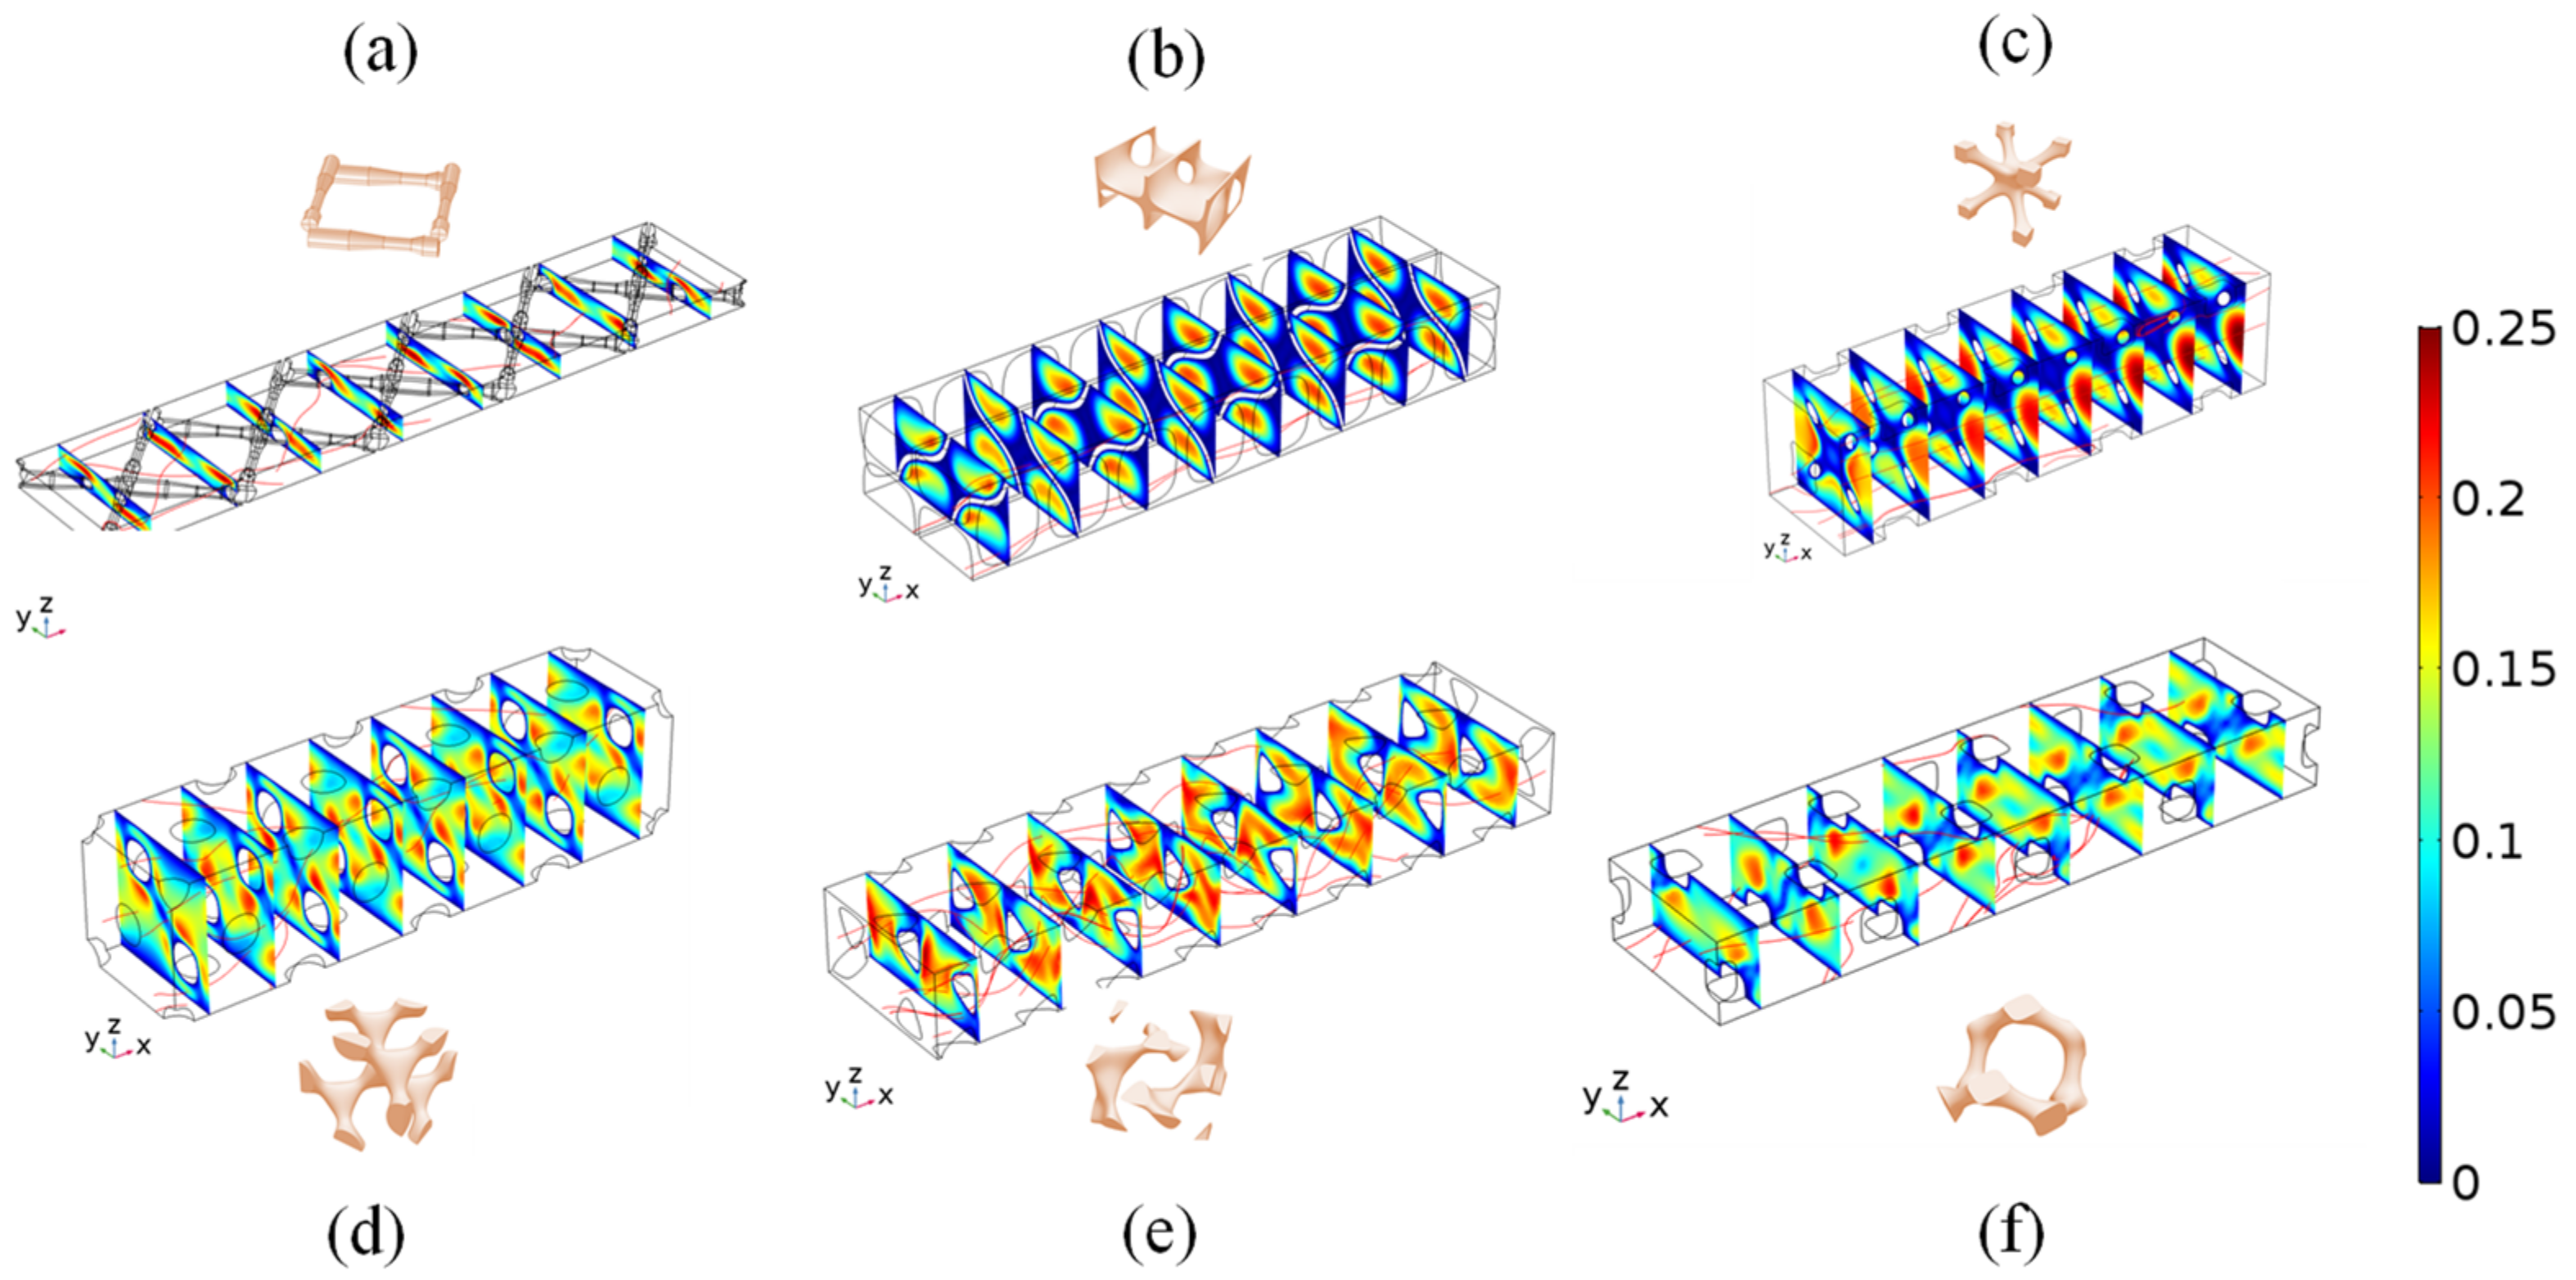
4.2. Local Flow and Mass-Transfer Characteristics

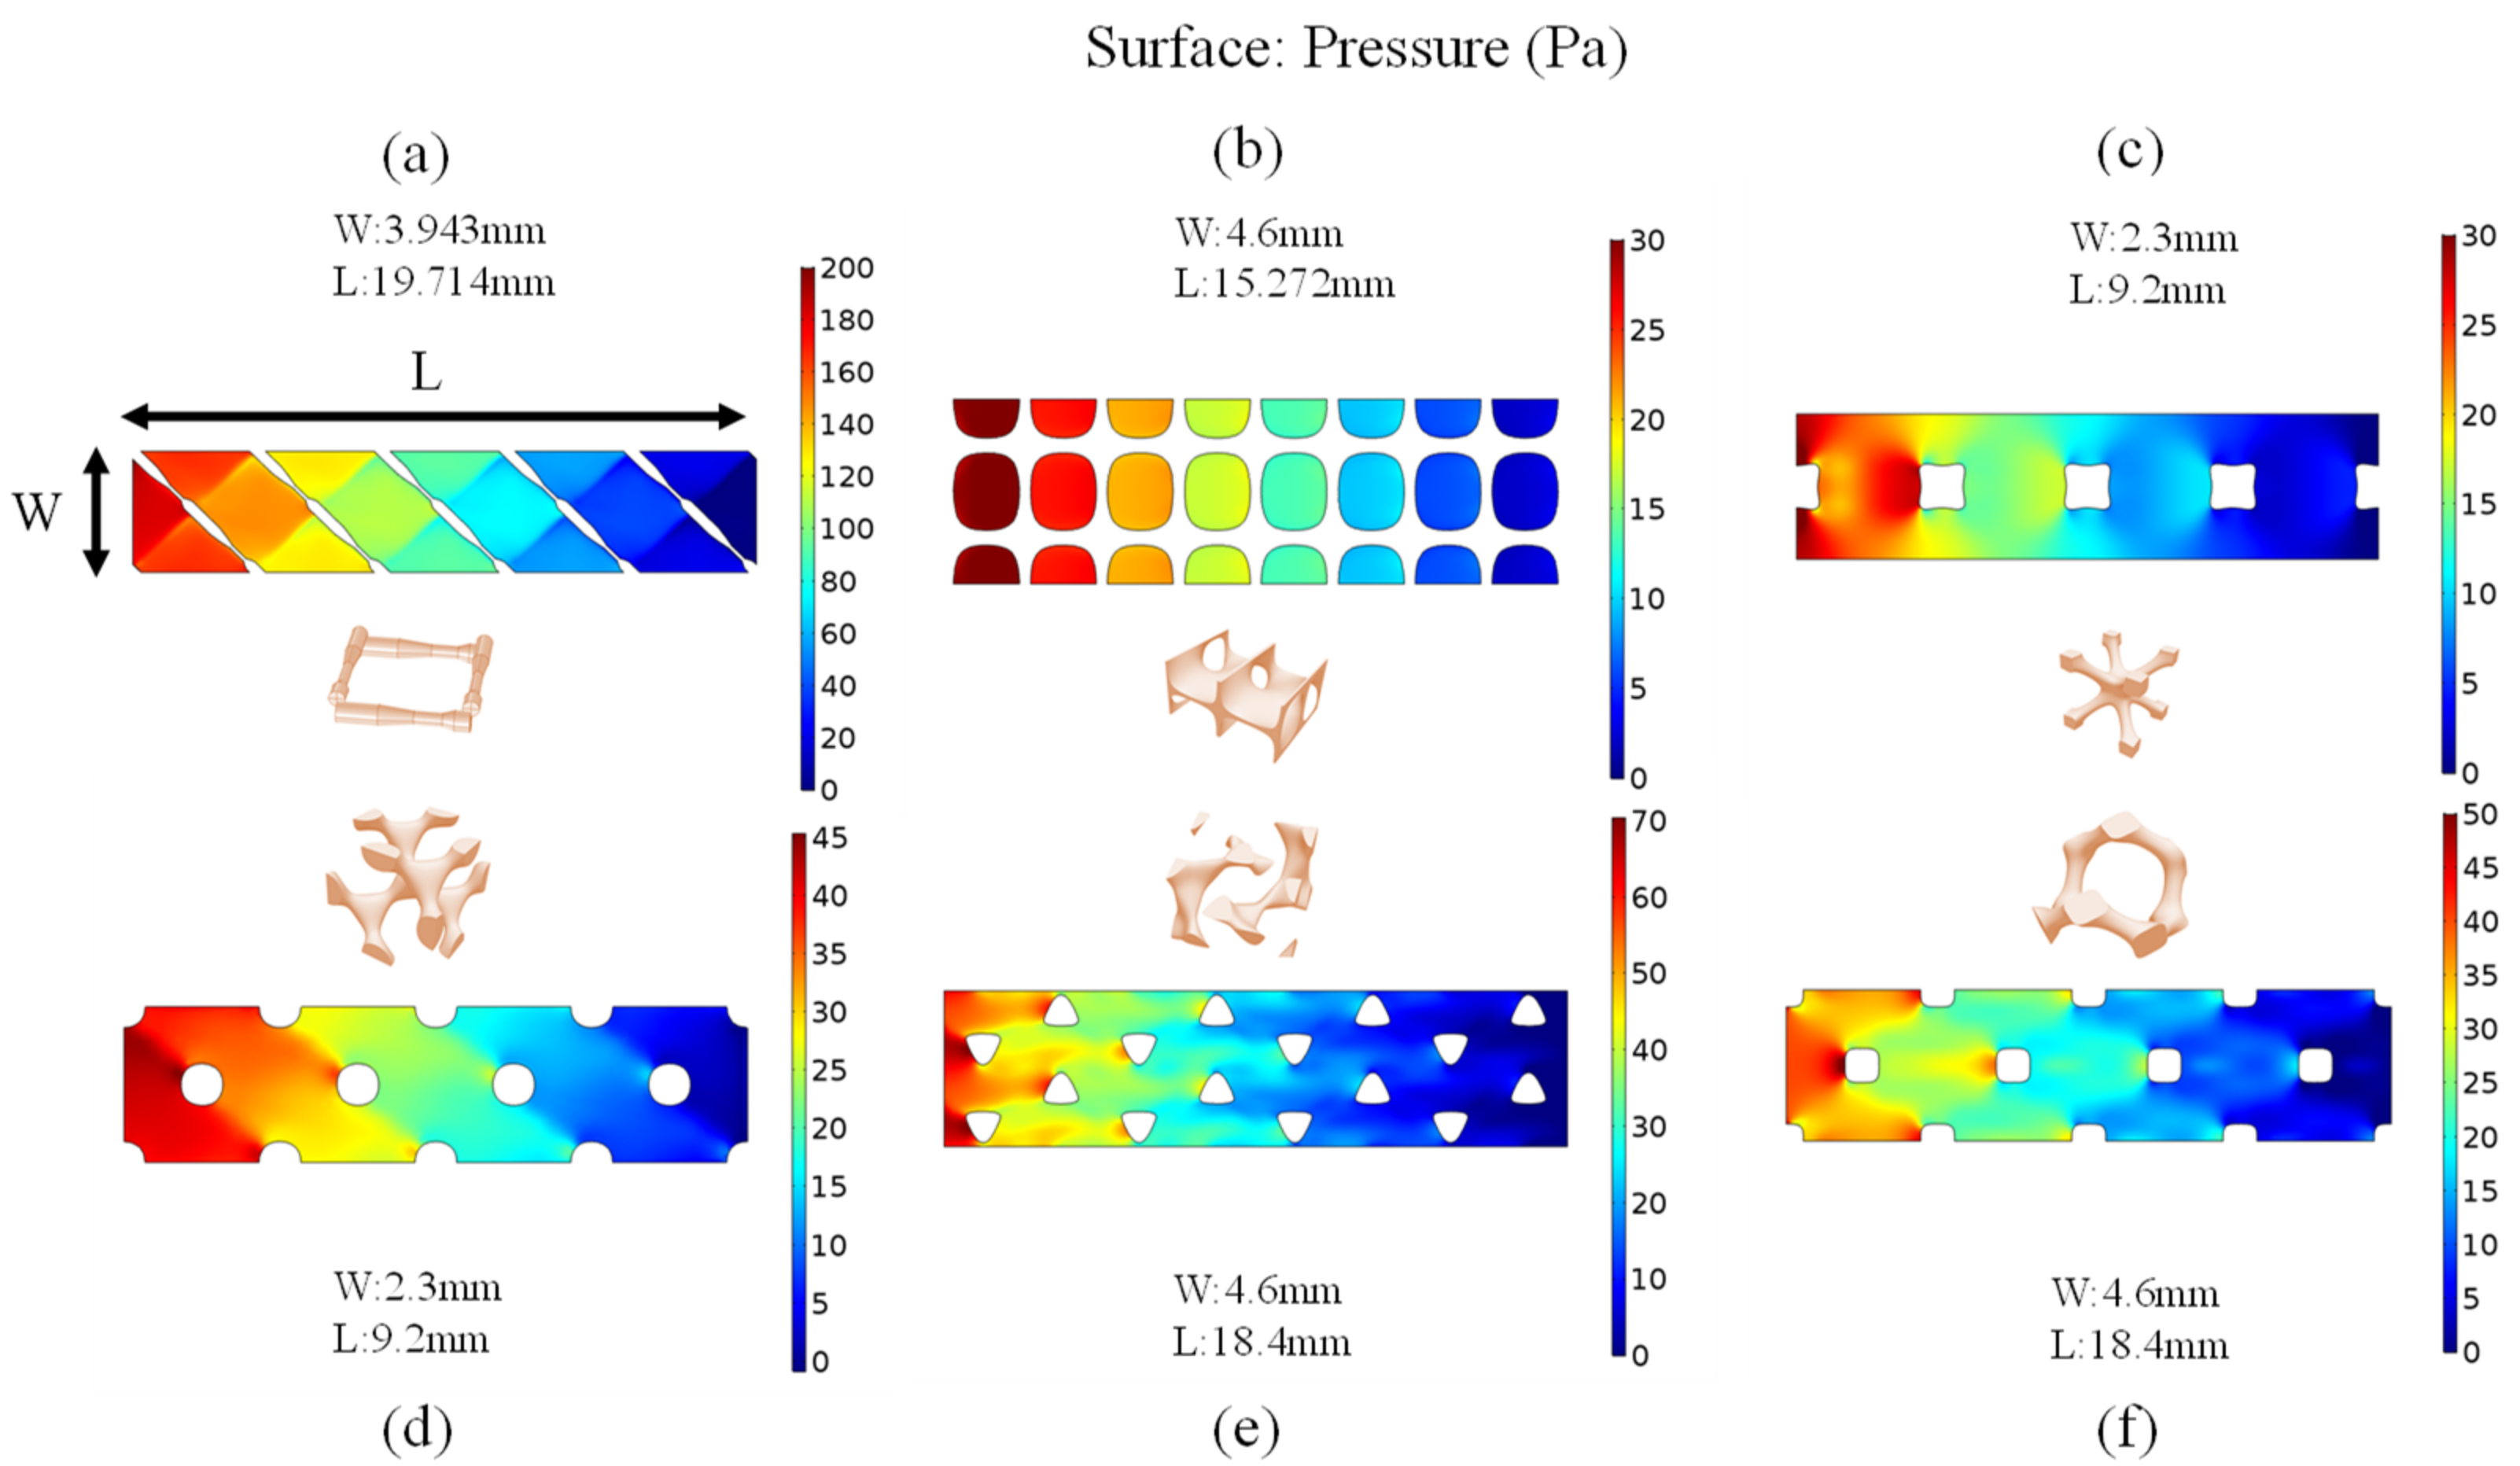
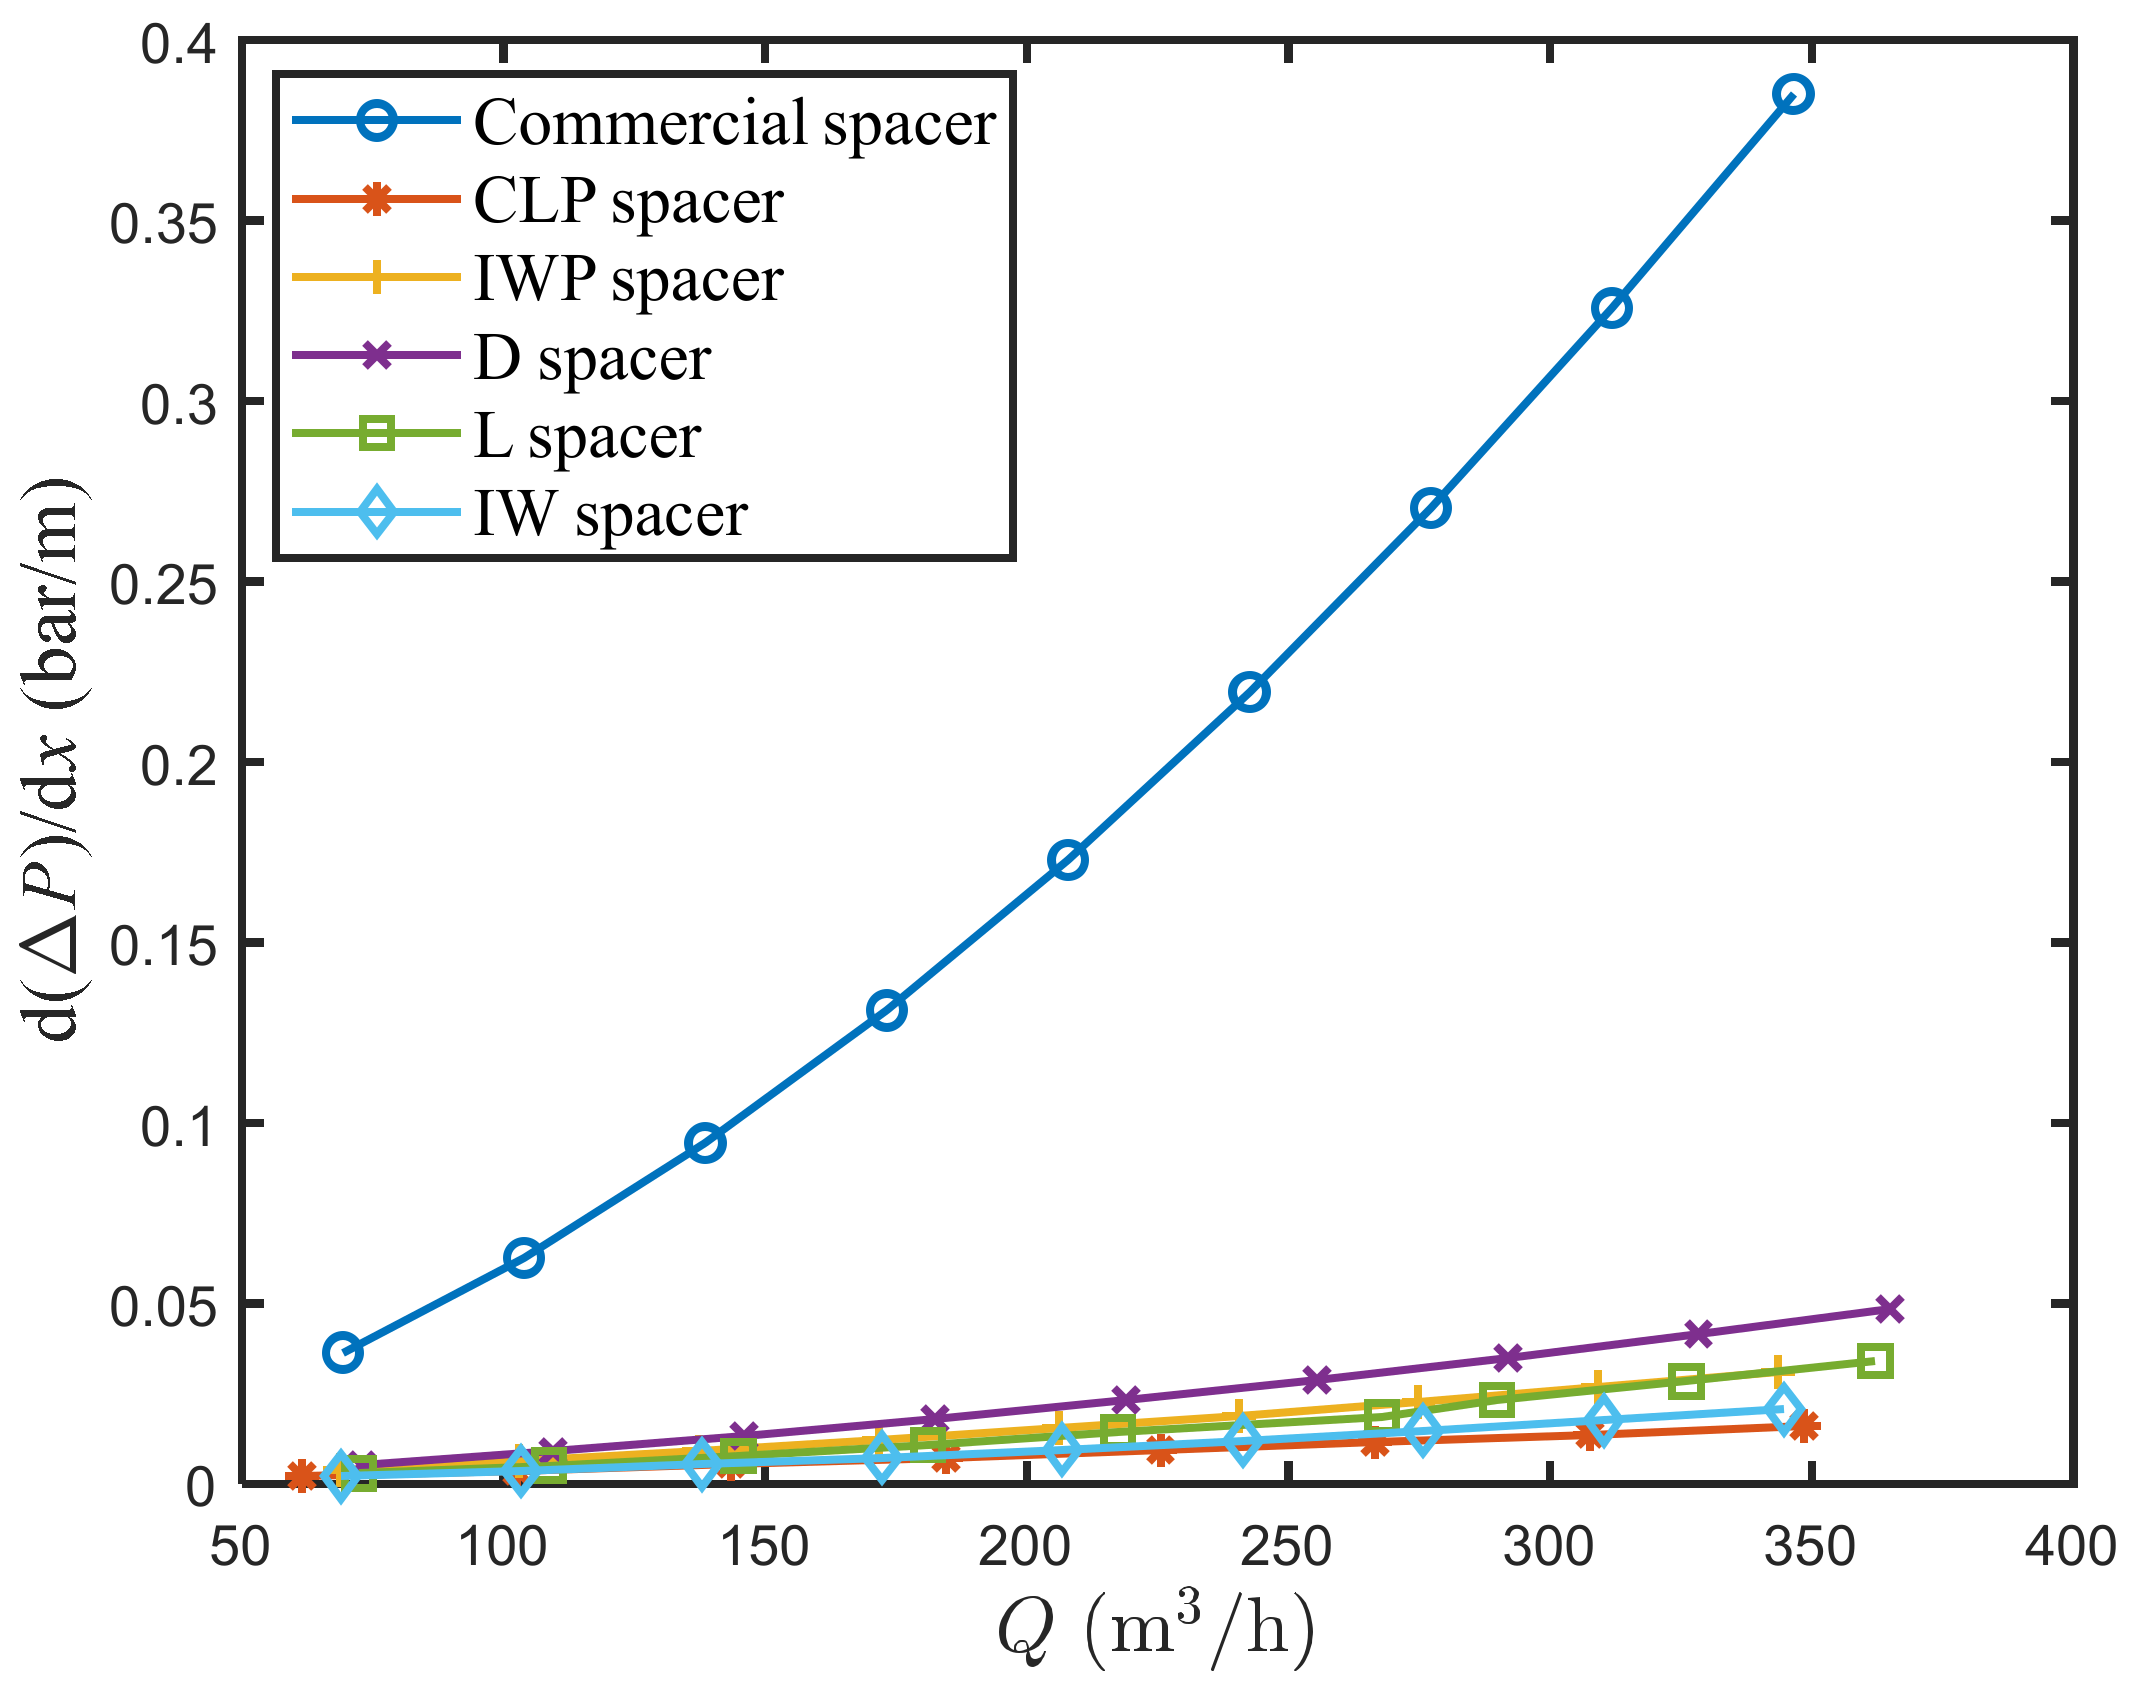
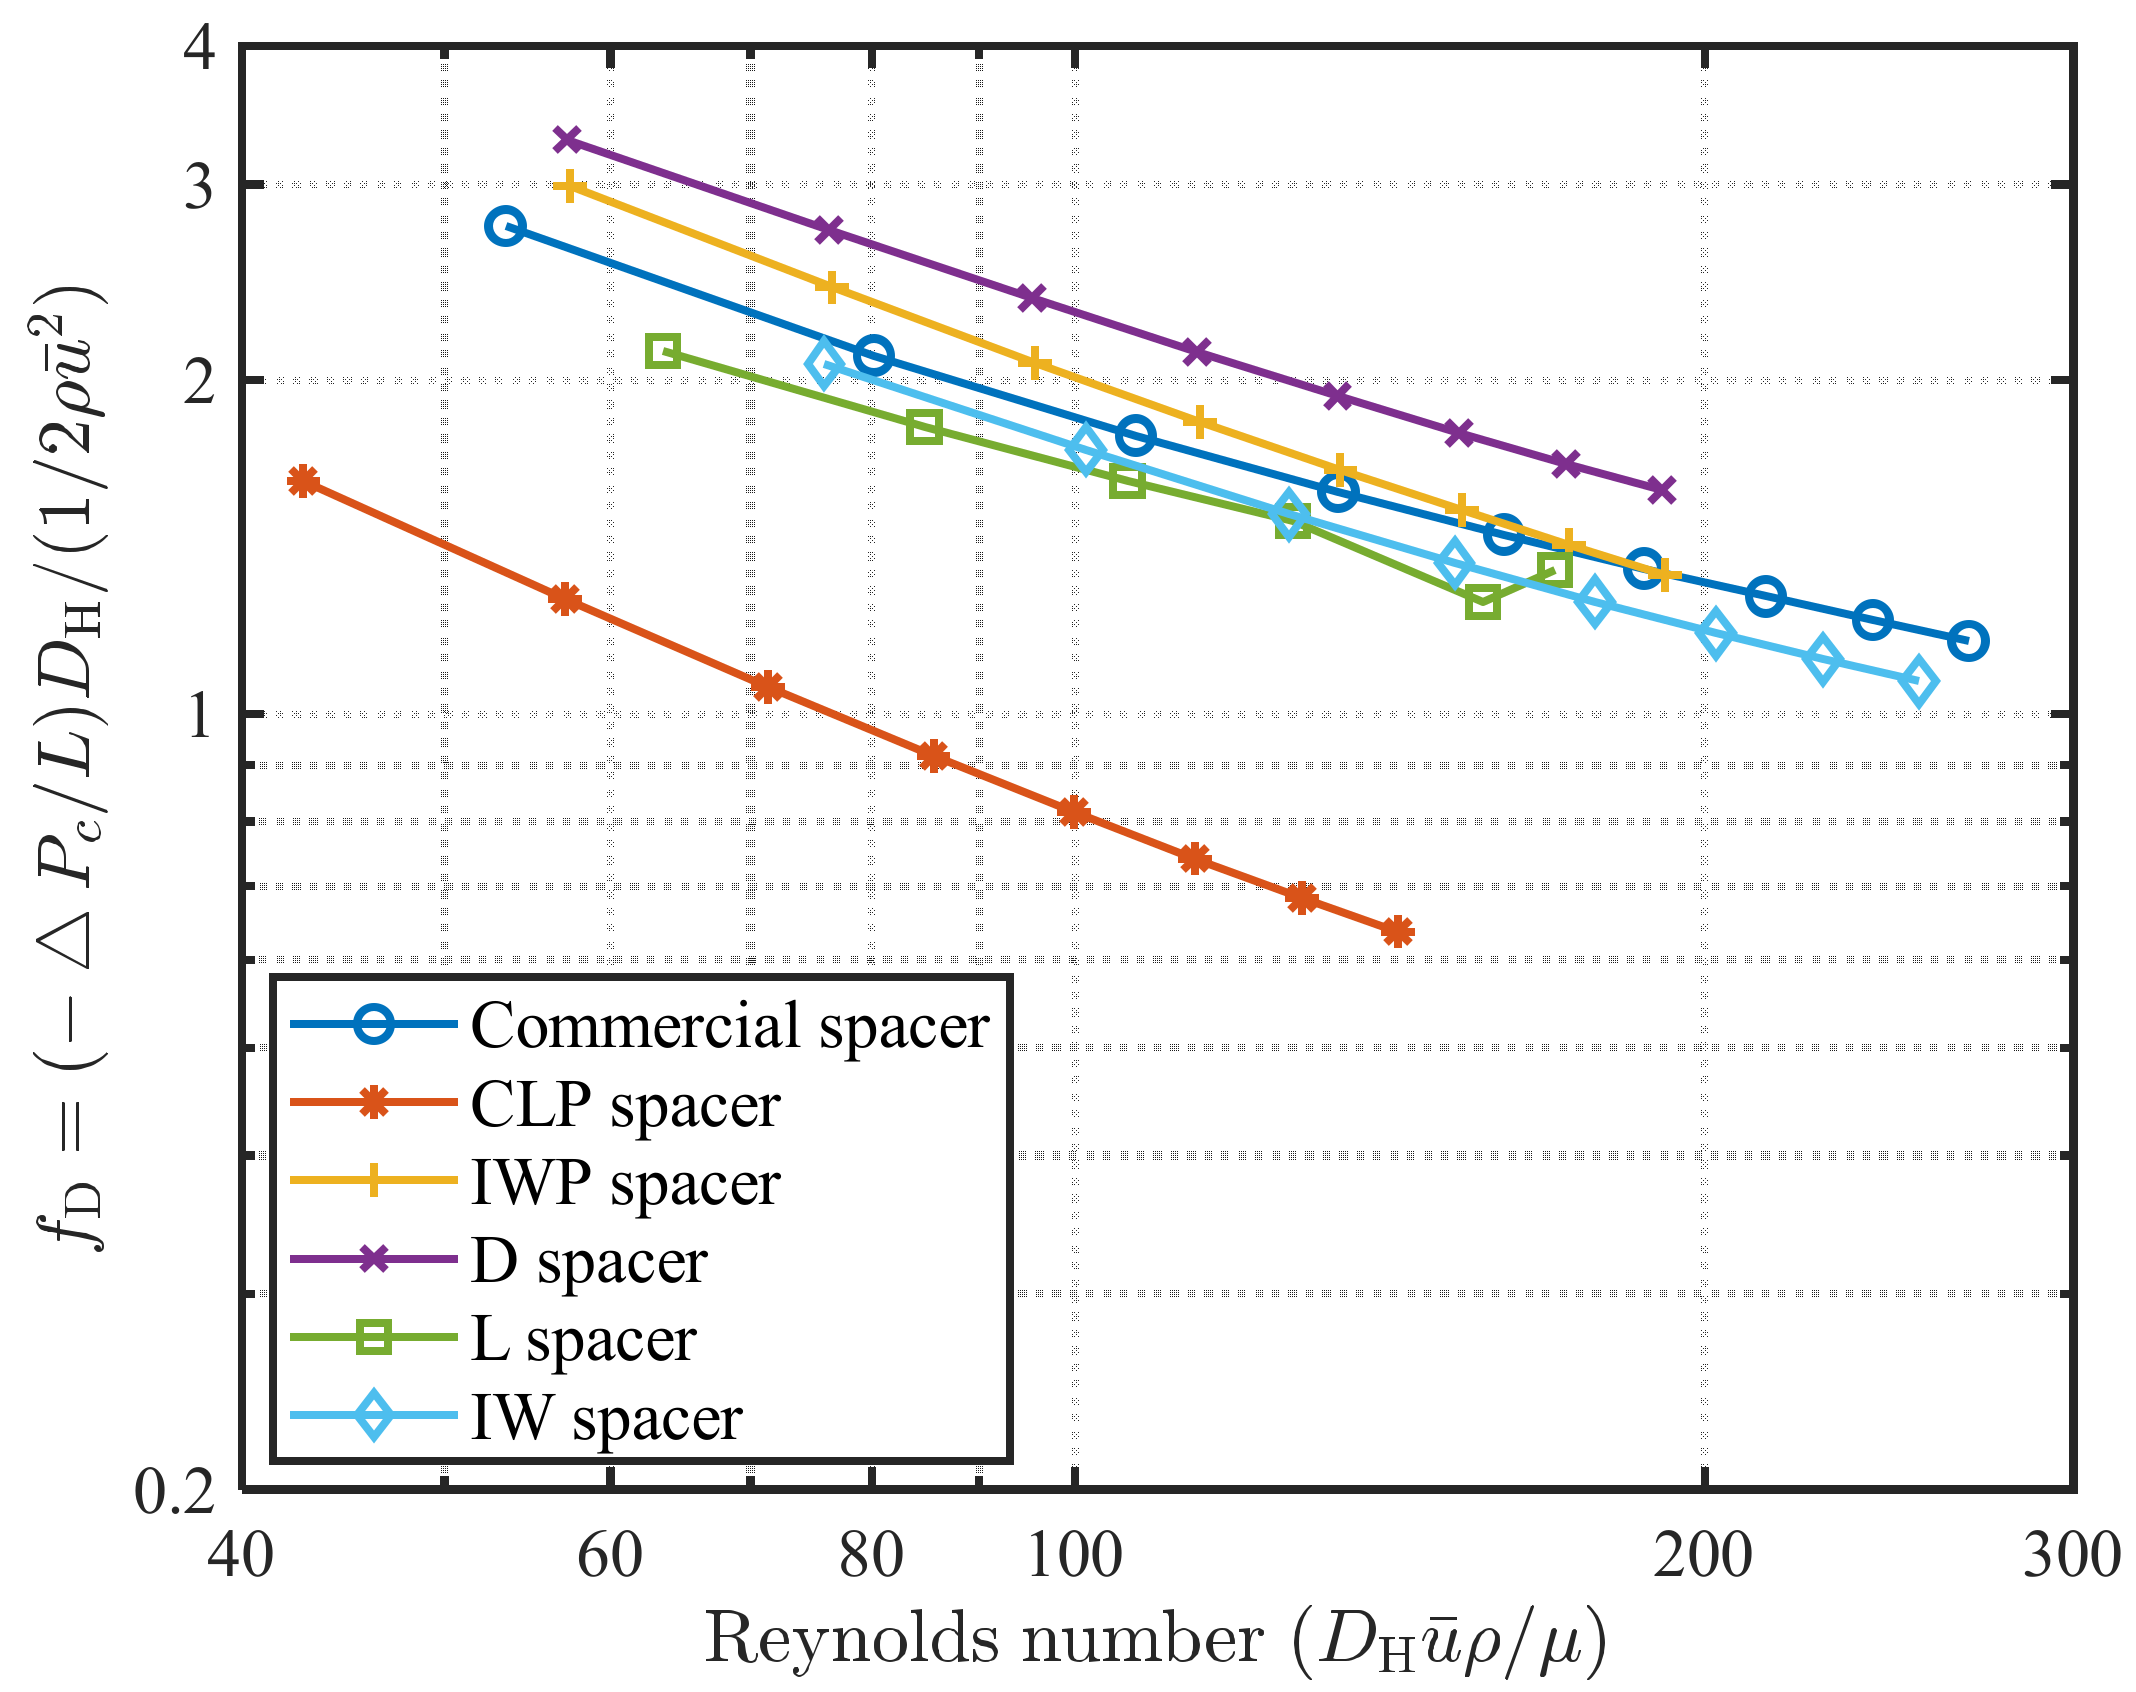
4.2.1. Hydrodynamics and Pressure Drop

The contours of velocity magnitude on various yz-slices and streamlines for the spacer-filled (commercial, CLP, IWP, D, L, and IW) channels are shown in Figure 7a–f. Due to the existence of the spacer, the fluid is forced to move forward, and the streamlines take the form of waves. Compared with the commercial spacer-filled channel, the streamlines in the TPMS spacer-filled channels are smoother due to the special structure. CLP, IWP, L, IW, and commercial spacer-filled channels generally have two different high-speed zones (see Figure 7). The fluid flows through the spacer in IWP spacer-filled channels; there will be a significantly large flow stagnation zone in the middle on the yz-slices of channels, where the risk of fouling increases.
The contours of pressure differential (with respect to the one at the outlet of the computational domain) in the spacer-filled channels (commercial spacer and TPMS-based spacers) are shown in Figure 8. The pressure in these spacer-filled channels seems to show the same trend, and the pressure change occurs mainly at the position of the spacers. In the CLP spacer-filled channels, the pressure drop appears to be more continuous.
The trend relationship between flow rate Q and the pressure drop per unit length Δ P c L is shown in Figure 9. The pressure drop per unit length increases with the increase in flow rate. At the same flow rate, the pressure drop per unit length of TPMS-based spacers is much smaller than that of the commercial spacer, indicating that TPMS-based spacers have a great advantage in flow resistance.
The Darcy friction coefficients ( f D = Δ P c L D H / 1 2 ρ u ¯ 2 ) based on DH for channels (commercial and TPMS-based) are shown in Figure 10. In the open channel, the 3D numerical simulation matches closely with f D = 96 / R e D H [31]. In IW and L spacer-filled channels, f D is very similar in the commercial spacer-filled channels correlation, about two times larger than CLP spacer-filled channels. Compared to other TPMS-based spacer-filled channels, the reason why the CLP spacer-filled channel has a lower f value is that it not only has a lower pressure drop per unit length, but also has a smaller hydraulic diameter value.
The power–law correlation between fD and Re in all spacer-filled channels is shown in Table 3. The exponent of the Reynolds number in CLP spacer-filled channel (−0.86) is closer to that in a flat channel (−1), which is related to the fact that the fluid encounters fewer obstacles in the direction of flow in CLP spacer-filled channel.

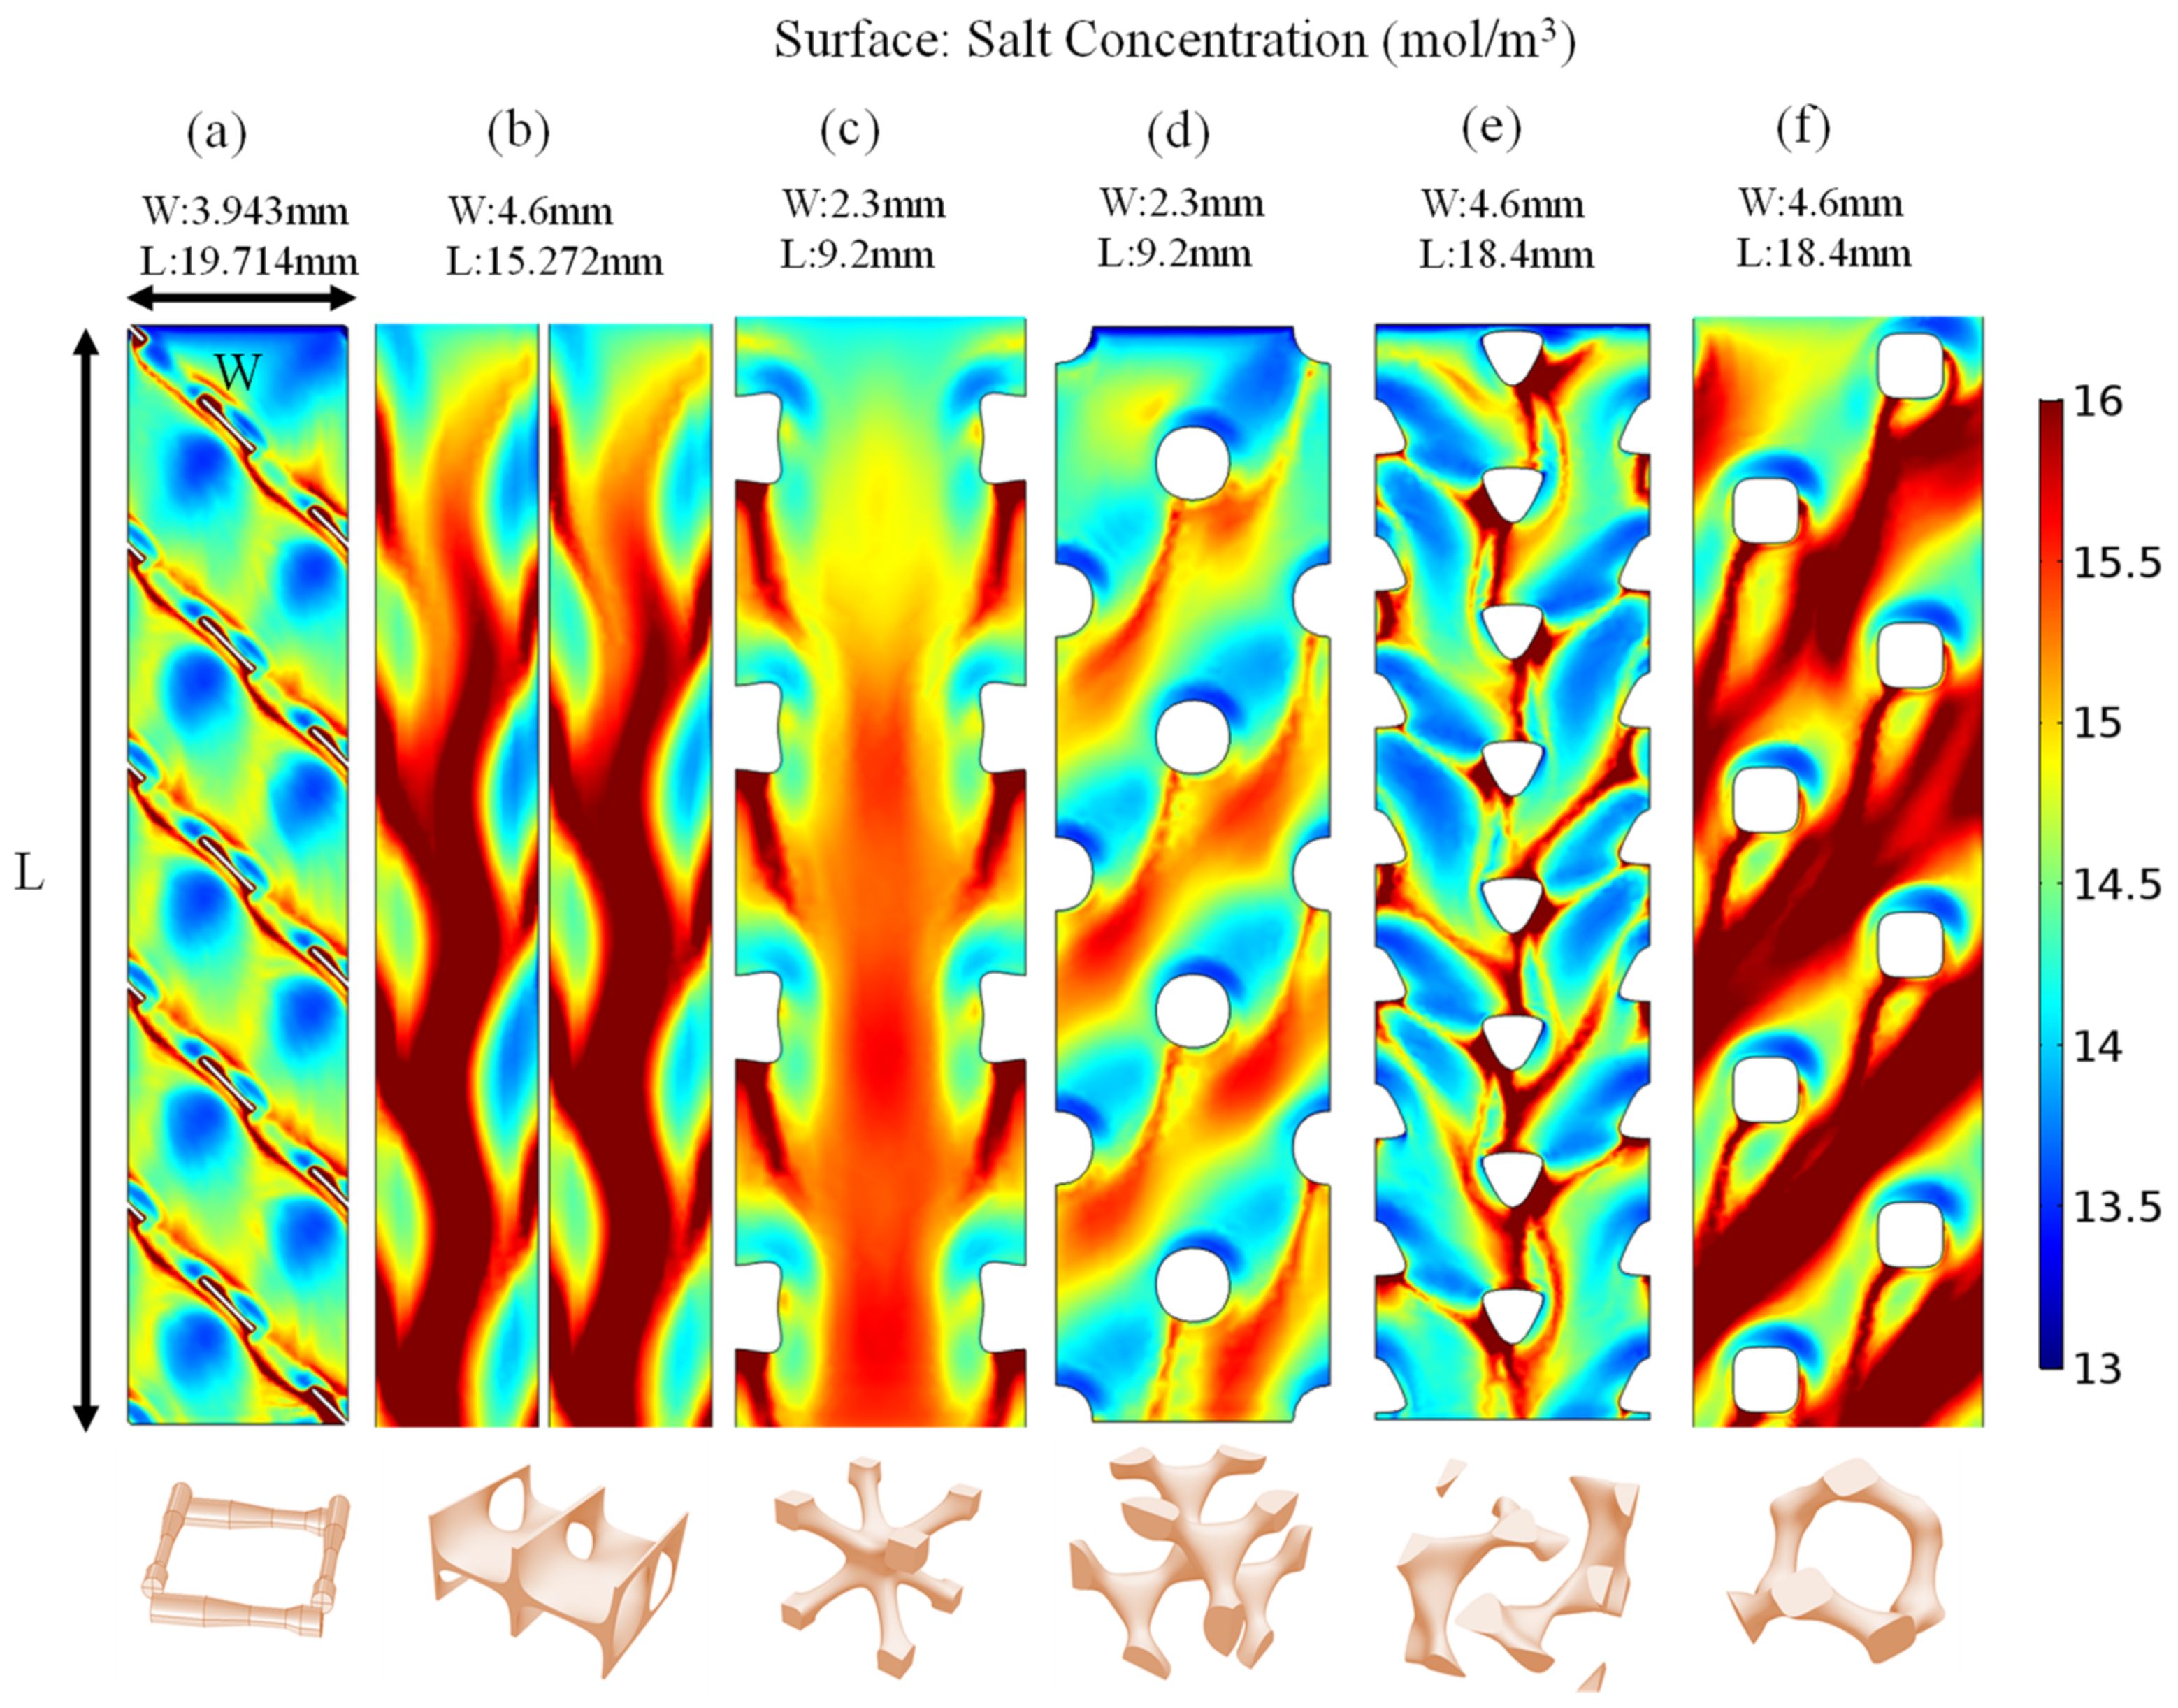
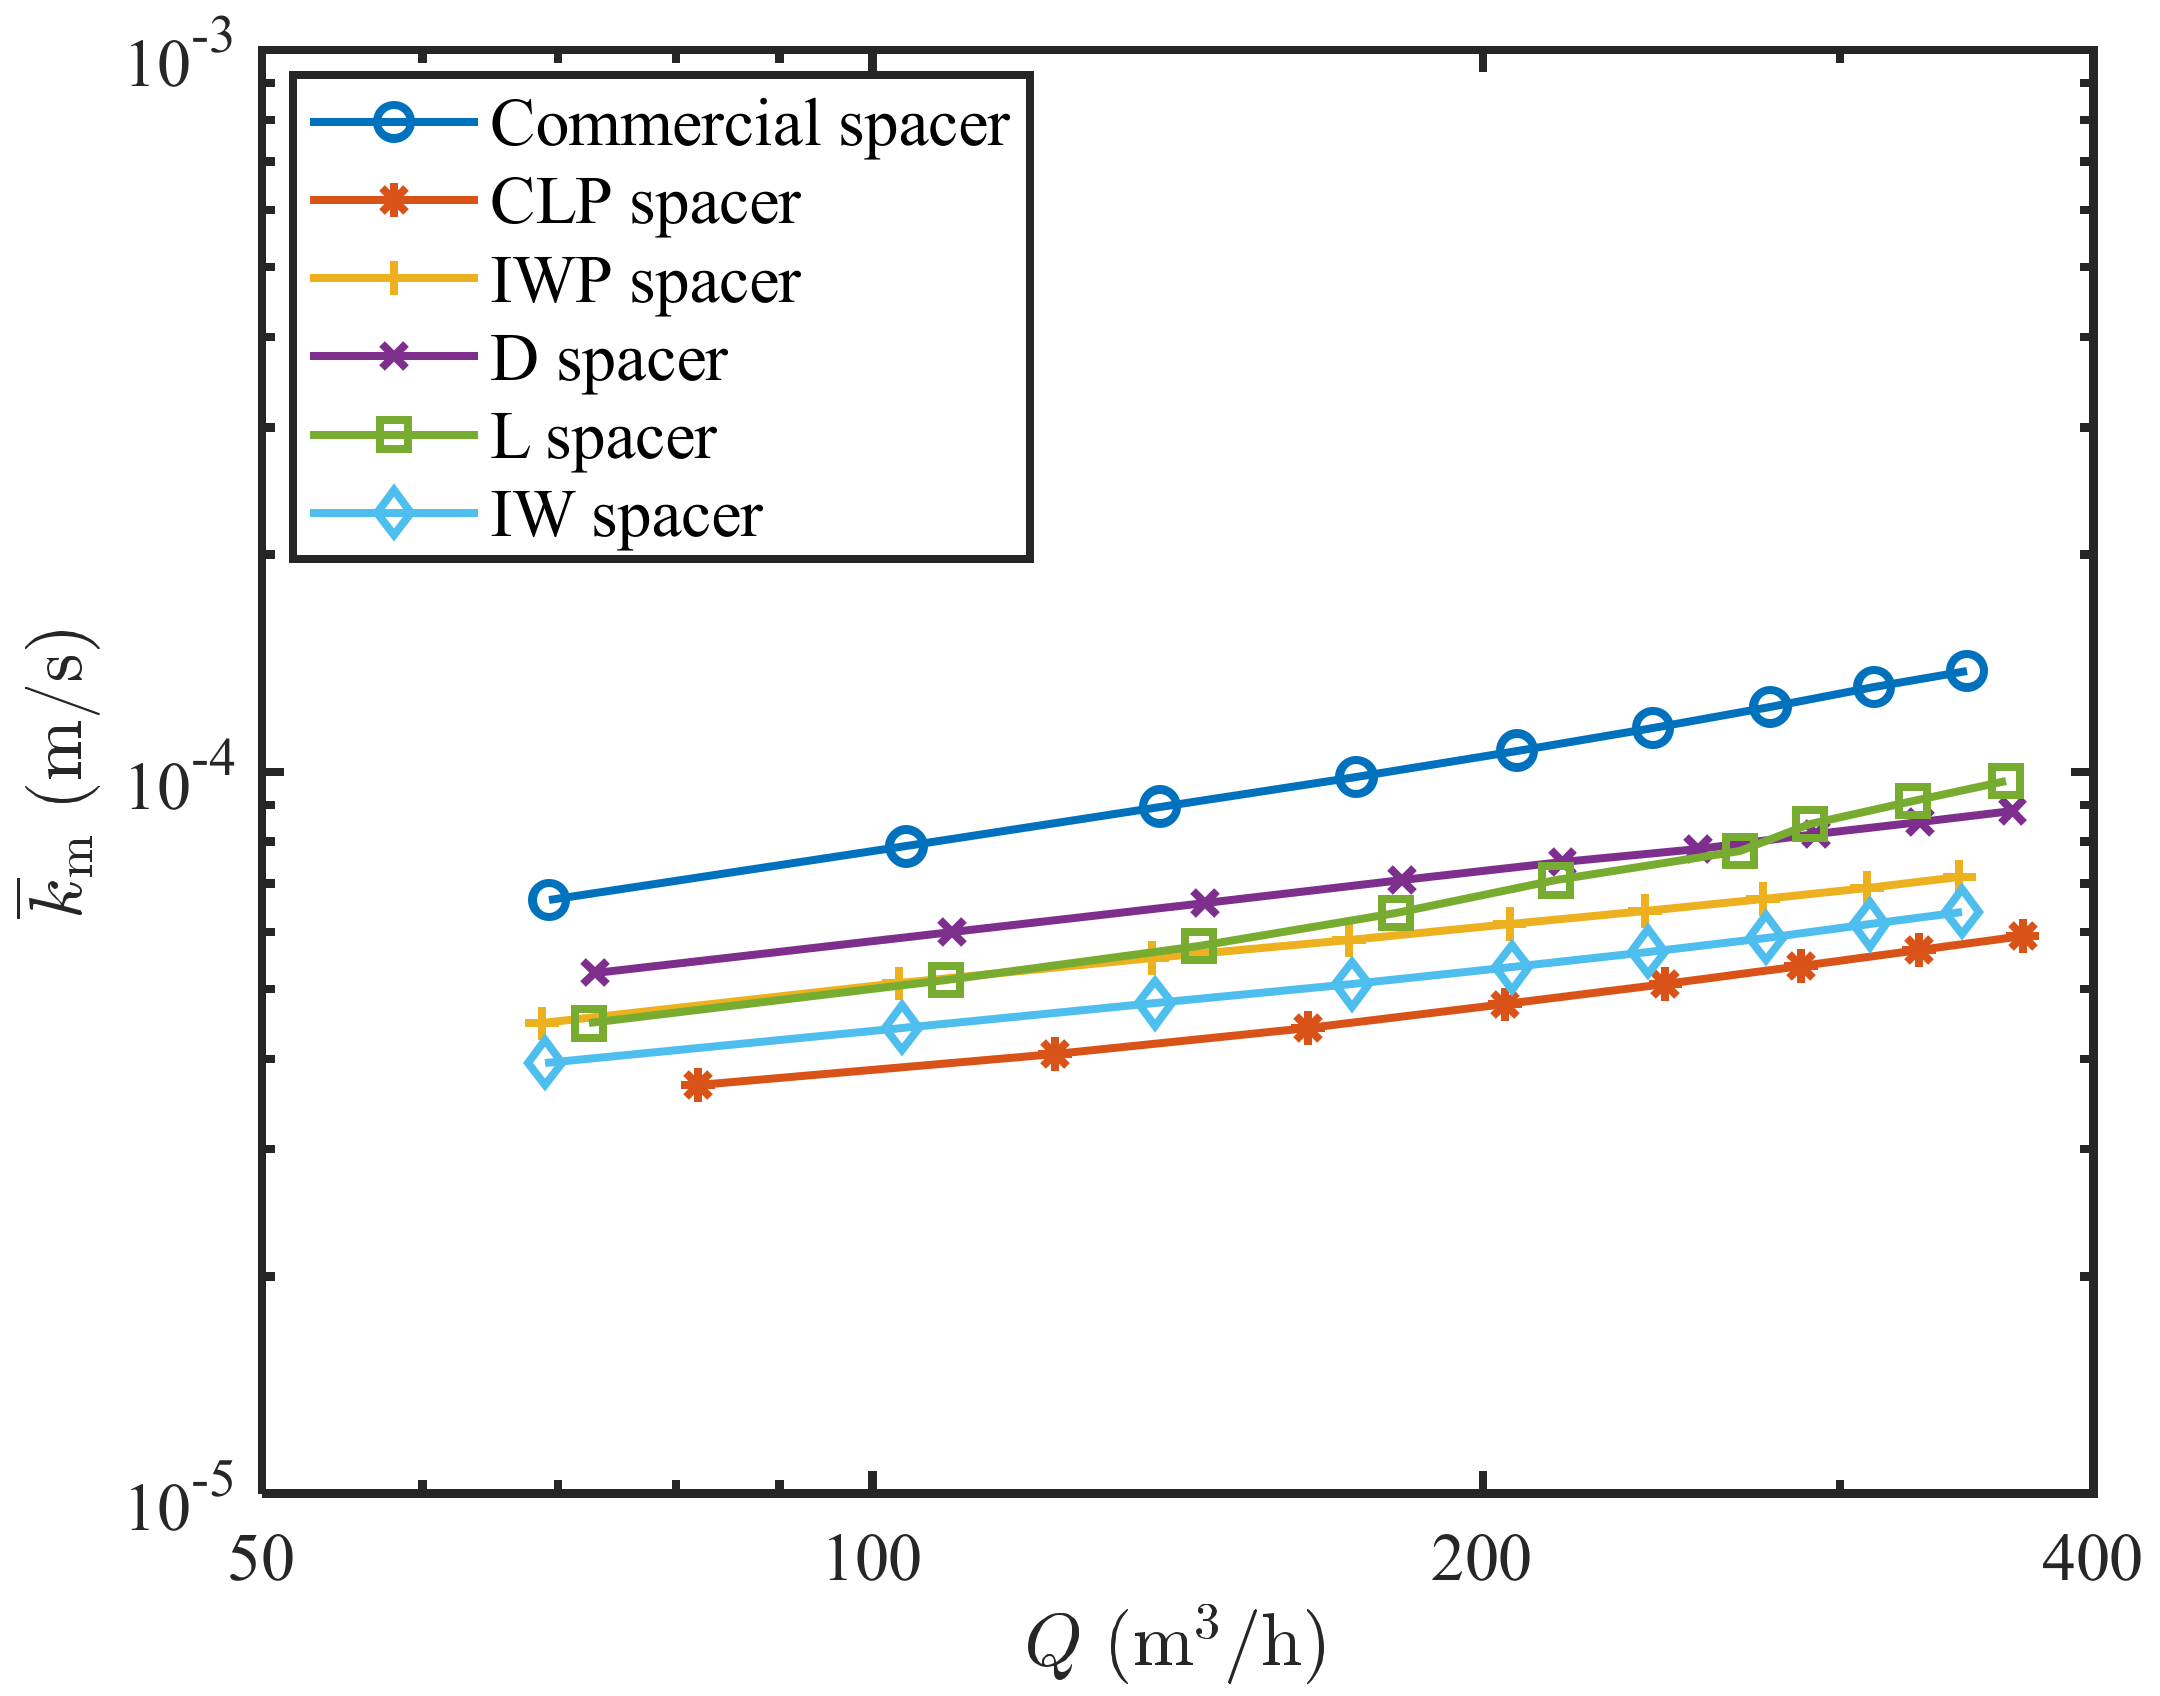
4.2.2. Mass Transfer and Concentration Polarization

By comparing the concentration distribution on the surface of each channel top membrane, compared with the commercial spacer-filled channel, the CLP, IWP, and IW spacers have a higher concentration distribution on the surfaces of the channel membrane as a whole (see Figure 11). Among the TPMS-based spacers, the concentration polarization of the L and D spacers is relatively small. Compared with other TPMS-based spacers, it may be related to the more internal flow channels formed by the two kinds of spacers.
Furthermore, according to the location of the high-speed areas in spacer-filled channels in Figure 7, the two high-speed areas of the CLP and IWP spacer-filled channels are relatively concentrated, and the flow stagnation areas are relatively concentrated and larger, which is not conducive to fluid mixing in the channel. The D spacer-filled channel has multiple smaller high-speed zones. The high-speed area of L spacer-filled channel is larger and the fluid retention area is smaller. Compared with the CLP and IWP spacer-filled channels, the mixing situation in the D and L spacer-filled channel is more uniform, which is beneficial to enhance the mass transfer.
The mass transfer coefficient km is related to salt concentration gradient at membrane wall by the following equation [31]:
k m ( c r c w ) = D c z z = H / 2
The k ¯ m over the length of five-unit cells in commercial spacer-filled channels and four cells in TPMS spacer-filled channels is calculated and is plotted as a function of flow rate Q on a loglog scale, as shown in Figure 12. In the range of flow rate studied, the average mass transfer coefficient TPMS-based spacer-filled channels is lower than that of commercial spacer-filled channel and the average mass transfer coefficient in D and L spacer-filled channels is larger than that of other TPMS-based spacer-filled channels. The power–law relationship between k ¯ m and Q in all spacer-filled channels is shown in Table 4. Among the TPMS-based spacer-filled channels, the fitting function of only L spacer-filled channel has a larger slope close to that of the commercial spacer-filled channel.
From Figure 12 and Table 4, combined with the analysis of the membrane surface concentration in Figure 10, it can be found that the enhanced mass transfer ability of CLP, IWP and IW spacers is significantly weaker than that of the commercial spacer. In the reverse osmosis process, the water production capacity is affected by the flow resistance and concentration polarization. Under the brackish water conditions in this work, the feed of salt concentration is very low. Compared with concentration polarization, the flow resistance has a greater impact on the water production capacity in BWRO, which has been proven in previous studies [31,32].
In the section of hydrodynamics and pressure drop, we analyzed that the TPMS-based spacers have a significant advantage in flow resistance; therefore, SWM modules based on CLP, IWP, and IW spacers have better performance than that of the commercial 28 mil spacer for brackish water RO desalination processes considered in this work. It is consistent with the results obtained by system-level model above. The total pressure drop of the RO system based on TPMS spacers is much lower than that of commercial spacer and the water production capacity of the RO system has been greatly improved. Compared with other TPMS-based spacers, the RO system total pressure drops of the L spacer and D spacer are not much different, but the mass transfer capacity is stronger, and the water production capacity of the RO system is slightly improved. When dealing with seawater desalination (high salt concentration), the influence of concentration polarization is significant. In this case, enhancement of mass transfer is also crucial in module design. Therefore, it can be predicted that under seawater conditions, the performance of the L and D spacers may be significantly better than other TPMS-based spacers.

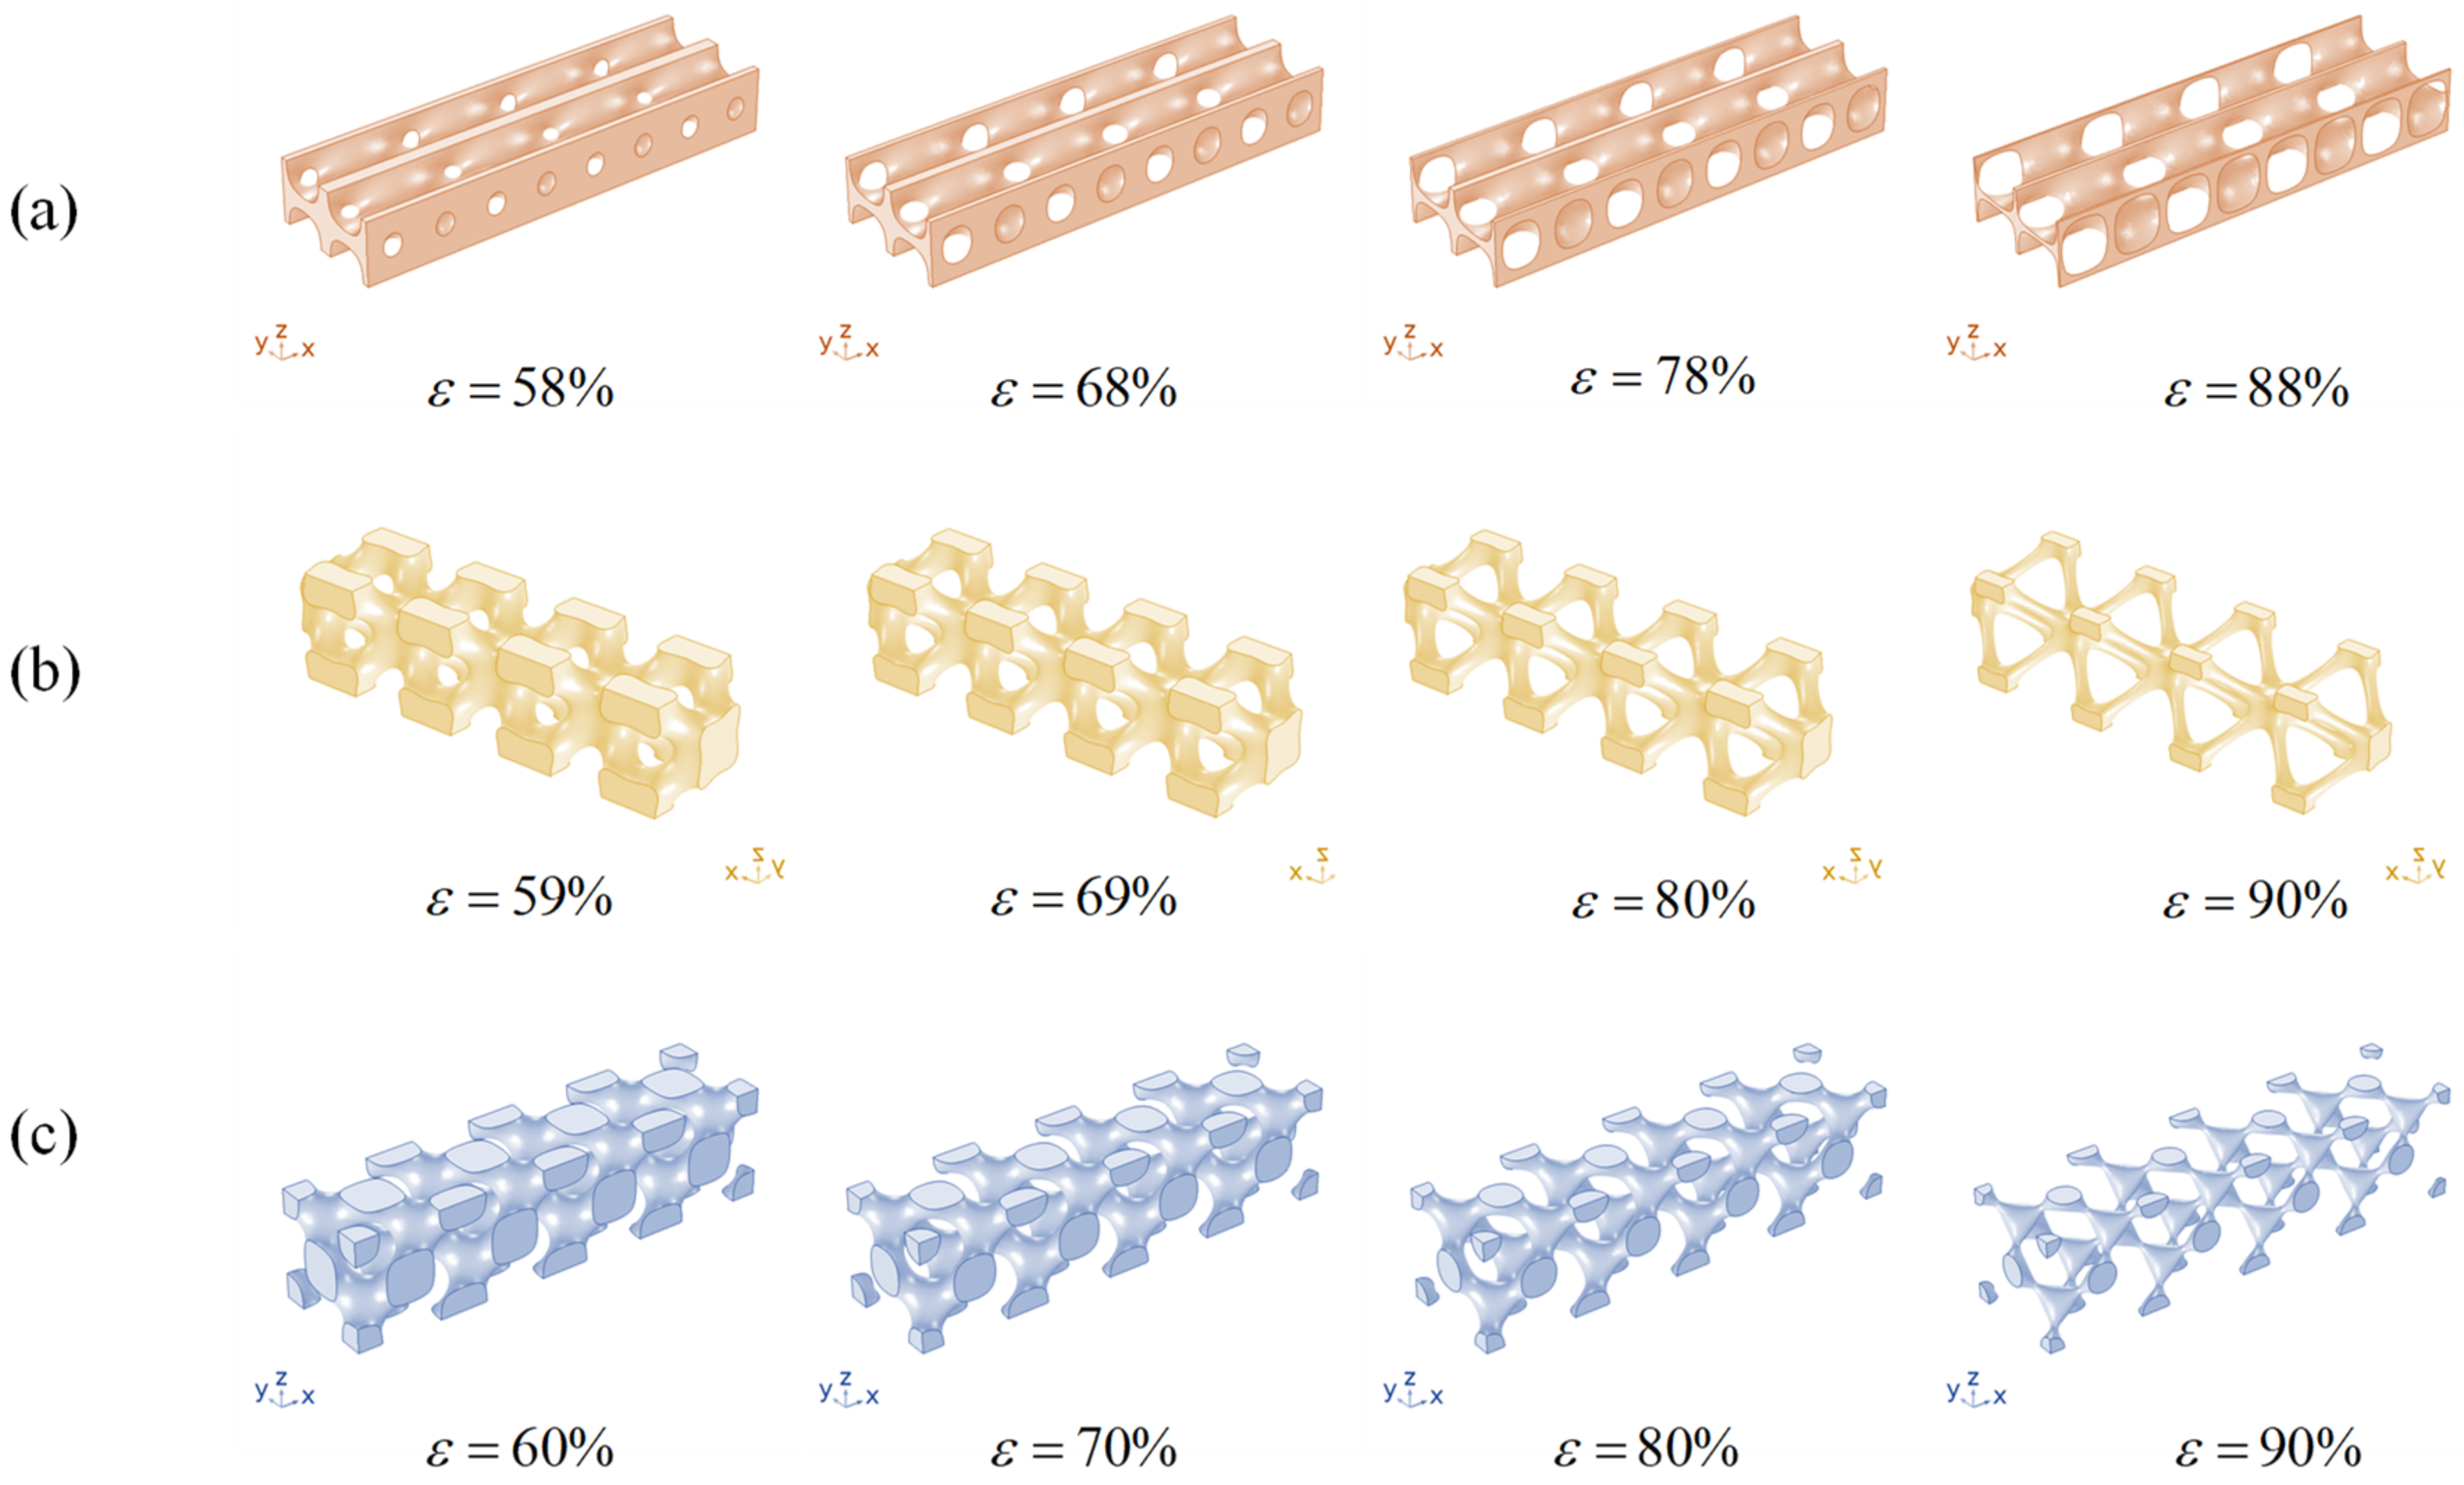
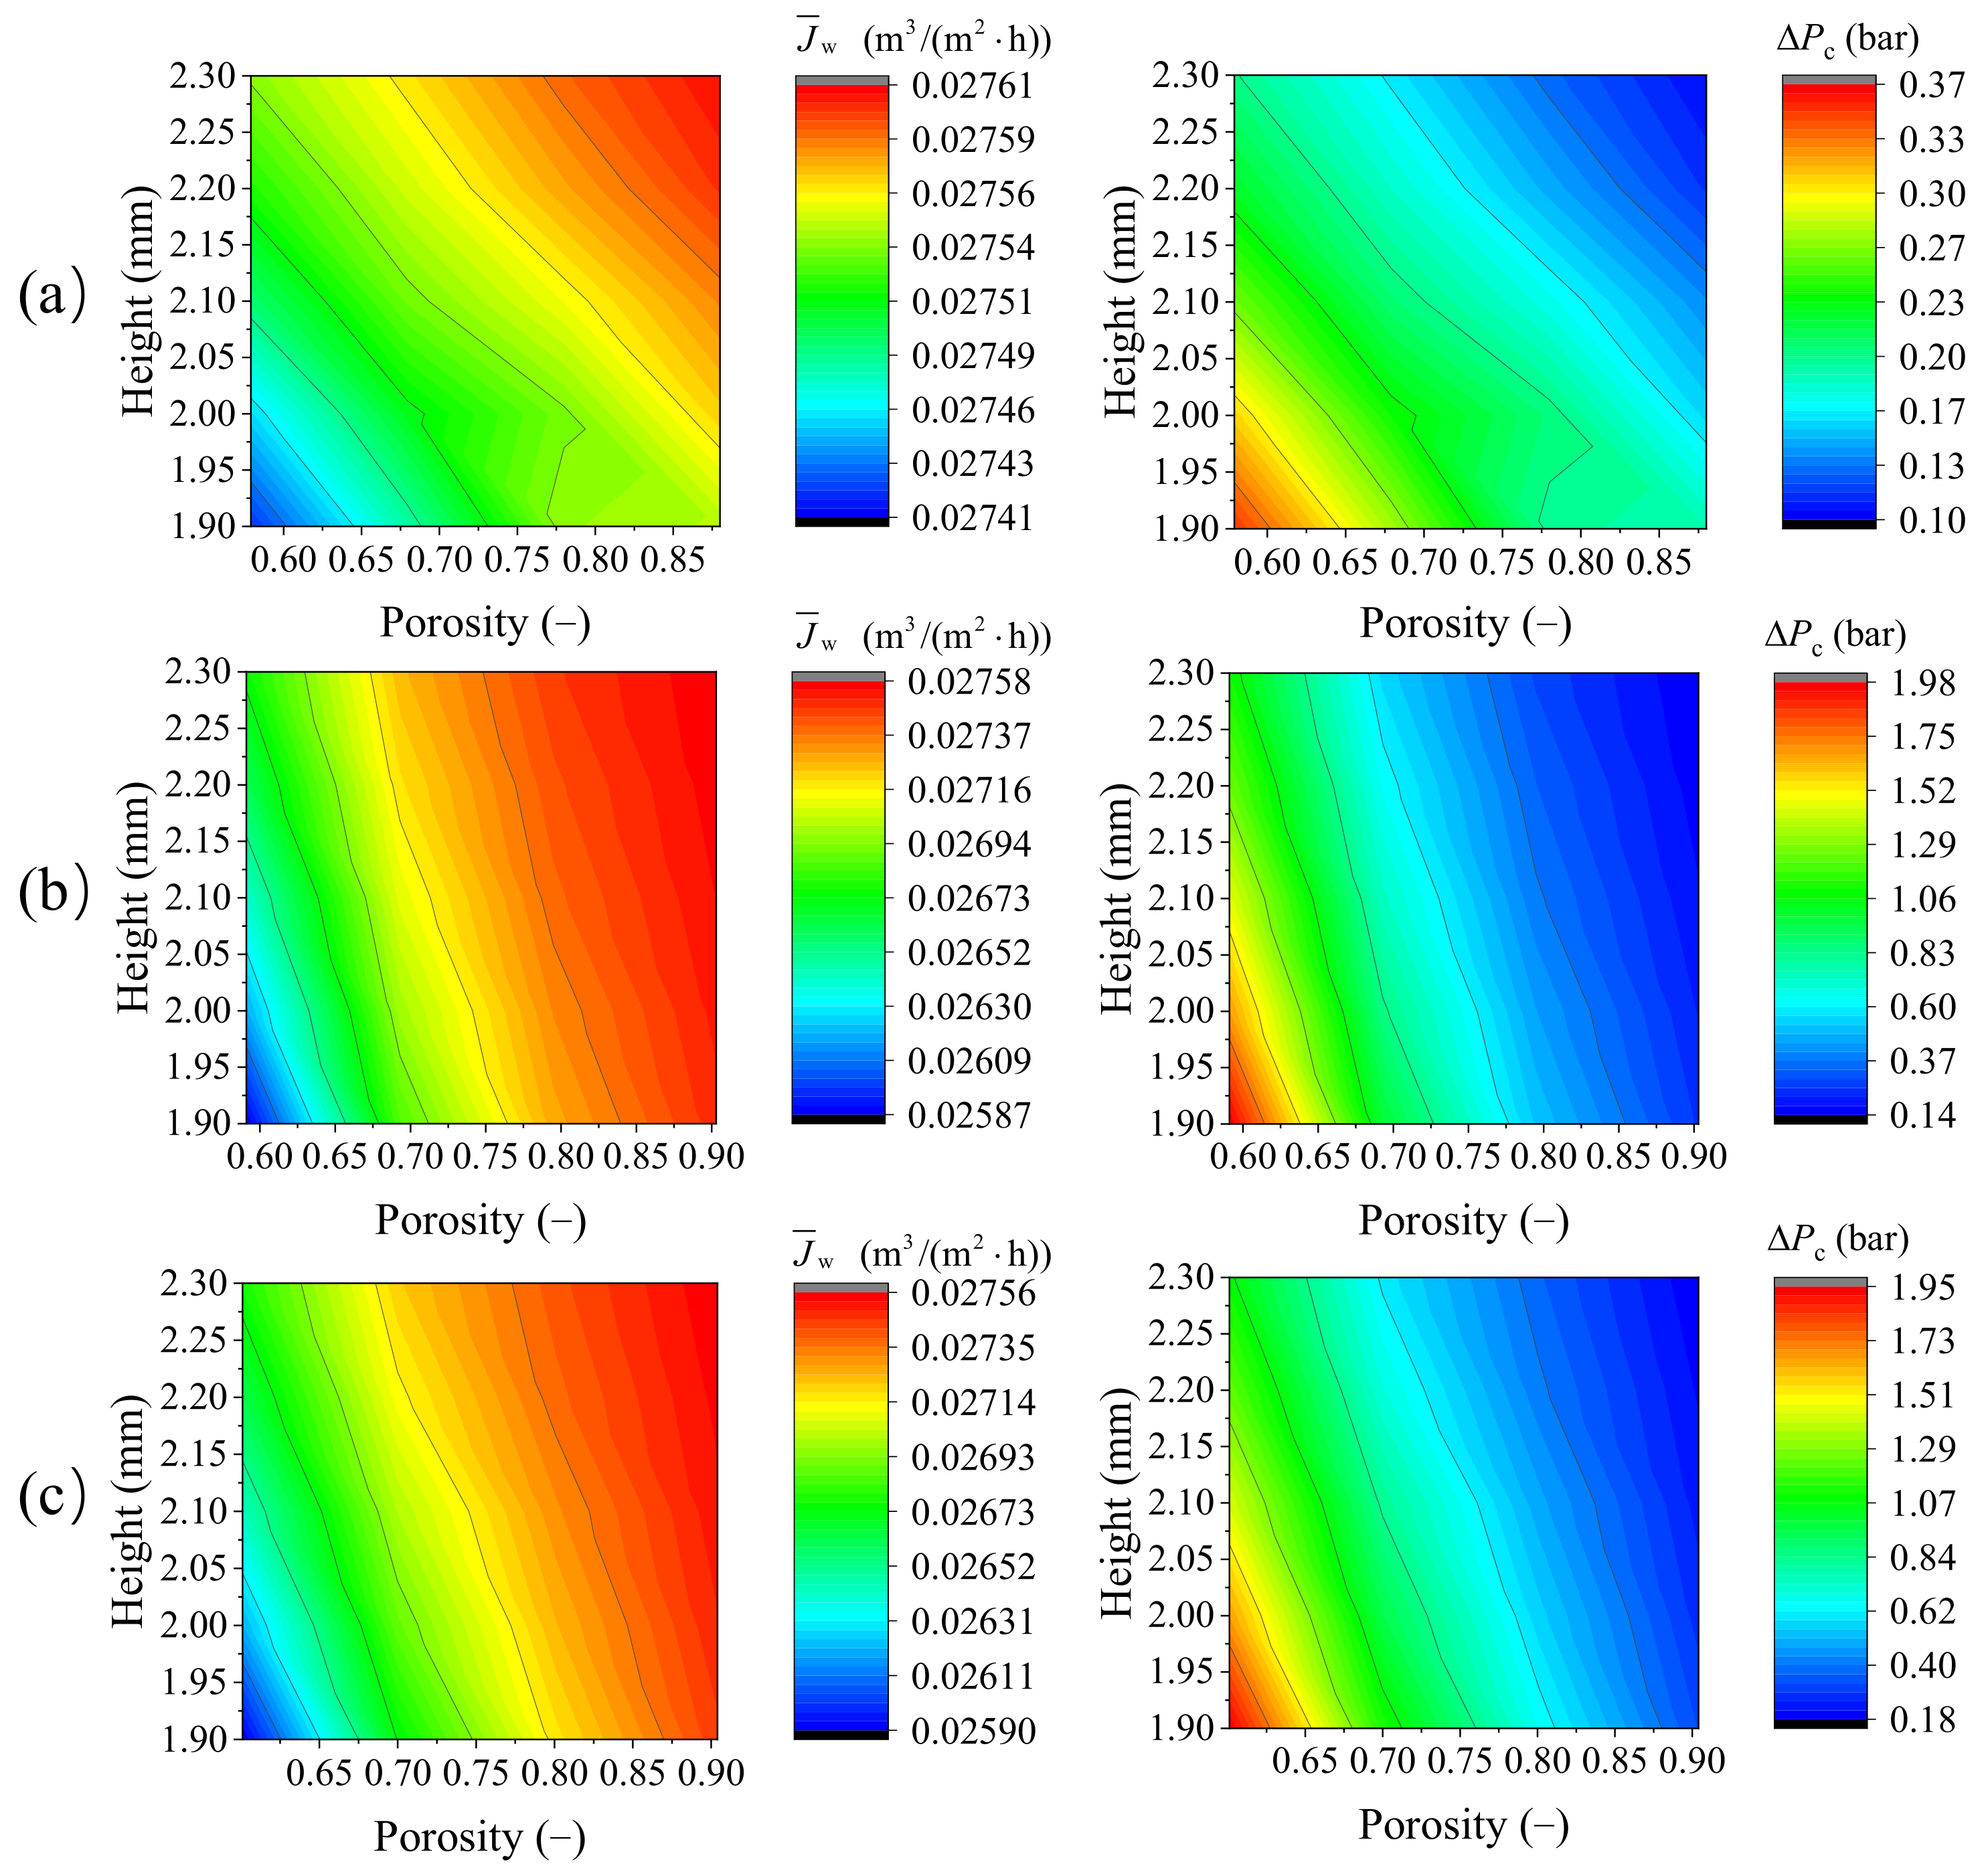
4.3. Structural Parameters Analysis with a High-throughput Approach

In this section, the effects of the height and porosity of feed channels (Different heights and porosity of feed channels based-on TPMS are shown in Table 5.) on the performance of spacers are studied by using a high-throughput approach. Sixty different geometries are investigated. The results obtained by the hybrid model without considering concentration polarization (hydrodynamic-only 3D CFD model and system-level model that neglects the effect of concentration polarization) and considering concentration polarization are compared in BWRO in our previous work [32] and there was sufficiently small difference. The system-level model that neglects the effect of concentration polarization is shown in Equation (17). The hybrid model not considering concentration polarization is adopted in this section to improve computational efficiency.
d Q d X = J w A X = 0 , Q = Q 0 , d ( Δ P ) d X = k 2 Q t 2 X = 0 , Δ P = Δ P 0 , J w = L p [ Δ P Δ π ] Δ π = Q 0 Δ π 0 / Q
All 3D CFD models are carried out in the TH-Starlight HPC system established by the national Super-computing in Guangzhou. In order to balance computational time and computational efficiency, 96 cores (4 nodes) are chosen for hydrodynamics-only CFD model in this work. The selection of nodes was discussed in our previous work [32].
Figure 13 shows TPMS-based spacers structure (a) CLP, (b) IWP, and (c) D with four types of porosity in each case. The average permeation flux of water and total pressure drop of RO system for feed channels with different height and porosity based on TPMS are shown in Figure 14. It can be observed that a consistent trend, lower pressure drop, and higher water flux are located in the upper right, with the height and porosity of feed channels increasing, the performance of spacers is gradually improved. Among the three kinds of TPMS-based spacers studied, the performance of the CLP spacer is little affected by the change of height and porosity of channels. As the porosity of the feed channels increases, the smaller the bending amplitude of the channel, and the smaller the pressure drop of the channel. As the height of the feed channels increases, the value of hydraulic diameter is increased to some extent, and the pressure drop of channel is reduced. In the RO process, there are many factors that affect the flux of water, such as flow resistance, concentration polarization, scaling, etc. From Equation (11), it can be seen from the permeation flux of water formula that the driving force is determined by the transmembrane pressure and the osmotic pressure. The pressure drop in the channel affects the transmembrane pressure at different positions along the feeding direction, which, in turn, affects the permeation flux of water, while the pressure drop is positively related to flow resistance. In the case of BWRO in this paper, the transmembrane pressure is much larger than the osmotic pressure. In our previous study [32], the relationship between the transmembrane pressure and osmotic pressure was quantified by calculating the flow resistance coefficient and concentration polarization (CP) coefficient in the channel and the former was found to be about nine times higher than the latter, indicating that the effect of flow resistance dominates in the BWRO process and neglecting CP does not lead to a significant error in predictions of flux. As the channel height and porosity increase, the pressure drop within the channel decreases and the driving force increases. Therefore, the permeation flux of water increases. In order to select the optimal spacer structure, both consumable material and strength of the spacer should be considered at the same time, which is beyond the scope of this work.

5. Conclusions

In this paper, a previously proposed hybrid model (millimeter-scale 3D CFD model and meter-scale RO system model) is used to study the performance of TPMS-based spacers. Compared with that of the commercial spacer, the water production efficiency using TPMS-based spacers has markedly improved. The performance in the L spacer and the D spacer is slightly better than other TPMS-based spacers. Then, the local flow and mass-transfer characteristics of TPMS-based spacers are analyzed and discussed. Finally, the effect of channels’ height and porosity on performance of TPMS-based spacers is studied by using a high-throughput approach. As the channel height and channel porosity increase, the performance of the TPMS-based spacers is gradually improving. The contact area of the membrane with the spacer is an important factor for maintaining the feed channel, although it was applied in the BWRO process in the previous experiments [20] (the operating pressure used was 8.16 bar), but in future work it would be interesting and valuable to carry out further experiments to investigate whether the spacer structure designed in this paper can be applied to the BWRO process under higher pressure.
The method proposed in this paper has the potential to be used to systematically evaluate the performance of the feed spacer and provide suggestions for the development of a suitable feed spacer at different conditions and further accelerate the production and commercialization of high-performance RO membranes.

Author Contributions

Conceptualization, Q.C., J.L. and Y.H.; methodology, Q.C., J.L. and Y.H.; software, Q.C. and J.L.; validation, Q.C. and J.L.; formal analysis, Q.C.; investigation, Q.C.; resources, Y.H.; data curation, Q.C., J.L. and Y.H.; writing—original draft preparation, Q.C.; writing—review and editing, J.L. and Y.H.; visualization, Q.C.; supervision, Y.H.; project administration, Y.H.; funding acquisition, Y.H. All authors have read and agreed to the published version of the manuscript.

Funding

This research was funded by Key-Area Research and Development Program of Guangdong Province (No.2021B0101190003) and Zhujiang Talent Program of Guangdong Province (No.2017GC010576).

Institutional Review Board Statement

Not applicable.

Informed Consent Statement

Not applicable.

Data Availability Statement

The data that support the findings of this study are available from the corresponding author, upon reasonable request.

Acknowledgments

We acknowledge the National Supercomputing Center in GuangZhou for providing computing resources and technical support.

Conflicts of Interest

The authors declare no conflict of interest.

References

  1. Cohen, Y.; Semiat, R.; Rahardianto, A. A perspective on reverse osmosis water desalination: Quest for sustainability. AIChE J. 2017, 63, 1771–1784. [Google Scholar] [CrossRef]
  2. Oki, T.; Kanae, S. Global Hydrological Cycles and World Water Resources. Science 2006, 313, 1068–1072. [Google Scholar] [CrossRef] [PubMed] [Green Version]
  3. Song, J.; Li, T.; Wright-Contreras, L.; Law, A.W.K. A review of the current status of small-scale seawater reverse osmosis desalination. Water Int. 2017, 42, 618–631. [Google Scholar] [CrossRef]
  4. Shenvi, S.S.; Isloor, A.M.; Ismail, A. A review on RO membrane technology: Developments and challenges. Desalination 2015, 368, 10–26. [Google Scholar] [CrossRef]
  5. Qasim, M.; Badrelzaman, M.; Darwish, N.N.; Darwish, N.A.; Hilal, N. Reverse osmosis desalination: A state-of-the-art review. Desalination 2019, 459, 59–104. [Google Scholar] [CrossRef] [Green Version]
  6. Uppu, A.; Chaudhuri, A.; Das, S.P. Numerical modeling of particulate fouling and cake-enhanced concentration polarization in roto-dynamic reverse osmosis filtration systems. Desalination 2019, 468, 114053. [Google Scholar] [CrossRef]
  7. Jasiuk, I.; Abueidda, D.W.; Kozuch, C.; Pang, S.; Su, F.Y.; McKittrick, J. An Overview on Additive Manufacturing of Polymers. JOM 2018, 70, 275–283. [Google Scholar] [CrossRef]
  8. Lee, J.-Y.; Tan, W.S.; An, Y.; Chua, C.K.; Tang, C.Y.; Fane, A.G.; Chong, T.H. The potential to enhance membrane module design with 3D printing technology. J. Membr. Sci. 2016, 499, 480–490. [Google Scholar] [CrossRef]
  9. Haidari, A.H.; Heijman, S.G.J.; van der Meer, W.G.J. Optimal design of spacers in reverse osmosis. Sep. Purif. Technol. 2018, 192, 441–456. [Google Scholar] [CrossRef]
  10. Lin, W.-C.; Shao, R.-P.; Wang, X.-M.; Huang, X. Impacts of non-uniform filament feed spacers characteristics on the hydraulic and anti-fouling performances in the spacer-filled membrane channels: Experiment and numerical simulation. Water Res. 2020, 185, 116251. [Google Scholar] [CrossRef]
  11. Park, S.; Dal Jeong, Y.; Lee, J.H.; Kim, J.; Jeong, K.; Cho, K.H. 3D printed honeycomb-shaped feed channel spacer for membrane fouling mitigation in nanofiltration. J. Membr. Sci. 2020, 620, 118665. [Google Scholar] [CrossRef]
  12. Koutsou, C.P.; Karabelas, A.J. A novel retentate spacer geometry for improved spiral wound membrane (SWM) module performance. J. Membr. Sci. 2015, 488, 129–142. [Google Scholar] [CrossRef]
  13. Su, X.; Li, W.; Palazzolo, A.; Ahmed, S. Concentration polarization and permeate flux variation in a vibration enhanced reverse osmosis membrane module. Desalination 2018, 433, 75–88. [Google Scholar] [CrossRef]
  14. Liang, Y.Y.; Weihs, G.A.F.; Wiley, D.E. Comparison of oscillating flow and slip velocity mass transfer enhancement in spacer-filled membrane channels: CFD analysis and validation. J. Membr. Sci. 2020, 593, 117433. [Google Scholar] [CrossRef]
  15. Taherinejad, M.; Afrouzan, A.; Derakhshan, S. CFD Investigation of Near-Membrane Slippery Condition Effects on Water/Salt Transport in a Reverse Osmosis Feed Channel. Arab. J. Sci. Eng. 2021, 46, 6673–6685. [Google Scholar] [CrossRef]
  16. Yoo, D.-J. Advanced porous scaffold design using multi-void triply periodic minimal surface models with high surface area to volume ratios. Int. J. Precis. Eng. Manuf. 2014, 15, 1657–1666. [Google Scholar] [CrossRef]
  17. Yinzheng, Z. Numerical Analysis On Fluid-solid Coupling Cooling Of Minimal Surface Lattice Structure. J. Phys. Conf. Ser. 2019, 1187, 032070. [Google Scholar] [CrossRef]
  18. Pires, T.; Santos, J.; Ruben, R.B.; Gouveia, B.P.; Castro, A.P.; Fernandes, P.R. Numerical-experimental analysis of the permeability-porosity relationship in triply periodic minimal surfaces scaffolds. J. Biomech. 2021, 117, 110263. [Google Scholar] [CrossRef]
  19. Coimbra, J.C.; Martins, M.A.; Oliveira, P.S.; Minim, L.A. The potential use of a gyroid structure to represent monolithic matrices for bioseparation purposes: Fluid dynamics and mass transfer analysis via CFD. Sep. Purif. Technol. 2010, 254, 117594. [Google Scholar] [CrossRef]
  20. Sreedhar, N.; Thomas, N.; Al-Ketan, O.; Rowshan, R.; Hernandez, H.; Abu Al-Rub, R.K.; Arafat, H. 3D printed feed spacers based on triply periodic minimal surfaces for flux enhancement and biofouling mitigation in RO and UF. Desalination 2018, 425, 12–21. [Google Scholar] [CrossRef]
  21. Michielsen, K.; Kole, J.S. Photonic band gaps in materials with triply periodic surfaces and related tubular structures. Phys. Rev. B 2003, 68, 115107. [Google Scholar] [CrossRef] [Green Version]
  22. Sreedhar, N.; Thomas, N.; Al-Ketan, O.; Rowshan, R.; Hernandez, H.H.; Al-Rub, R.K.A.; Arafat, H.A. Mass transfer analysis of ultrafiltration using spacers based on triply periodic minimal surfaces: Effects of spacer design, directionality and voidage. J. Membr. Sci. 2018, 561, 89–98. [Google Scholar] [CrossRef]
  23. Shi, X.; Liao, W.; Li, P.; Zhang, C.; Liu, T.; Wang, C.; Wu, J. Comparison of Compression Performance and Energy Absorption of Lattice Structures Fabricated by Selective Laser Melting. Adv. Eng. Mater. 2020, 22, 2000453. [Google Scholar] [CrossRef]
  24. Weyhaupt, A. Deformations of the gyroid and lidinoid minimal surfaces. Pac. J. Math. 2008, 235, 137–171. [Google Scholar] [CrossRef]
  25. Bucs, S.S.; Radu, A.I.; Lavric, V.; Vrouwenvelder, J.S.; Picioreanu, C. Effect of different commercial feed spacers on biofouling of reverse osmosis membrane systems: A numerical study. Desalination 2014, 343, 26–37. [Google Scholar] [CrossRef]
  26. Al-Ketan, O.; Abu Al-Rub, R.K.; Rowshan, R. Mechanical Properties of a New Type of Architected Interpenetrating Phase Composite Materials. Adv. Mater. Technol. 2017, 2, 1600235. [Google Scholar] [CrossRef]
  27. Suwarno, S.R.; Chen, X.; Chong, T.H.; Puspitasari, V.; McDougald, D.; Cohen, Y.; Rice, S.; Fane, A. The impact of flux and spacers on biofilm development on reverse osmosis membranes. J. Membr. Sci. 2012, 405–406, 219–232. [Google Scholar] [CrossRef]
  28. Al-Ketan, O.; Al-Rub, R.K. MSLattice: A free software for generating uniform and graded lattices based on triply periodic minimal surfaces. Mat. Des. Process Commun. 2020, 3, e205. [Google Scholar] [CrossRef]
  29. Schock, G.; Miquel, A. Mass transfer and pressure loss in spiral wound modules. Desalination 1987, 64, 339–352. [Google Scholar] [CrossRef]
  30. Da Costa, A.R.; Fane, A.G.; Wiley, D.E. Spacer characterization and pressure drop modelling in spacer-filled channels for ultrafiltration. J. Membr. Sci. 1994, 87, 79–98. [Google Scholar] [CrossRef]
  31. Li, M.; Bui, T.; Chao, S. Three-dimensional CFD analysis of hydrodynamics and concentration polarization in an industrial RO feed channel. Desalination 2016, 397, 194–204. [Google Scholar] [CrossRef]
  32. Luo, J.; Li, M.; Heng, Y. A hybrid modeling approach for optimal design of non-woven membrane channels in brackish water reverse osmosis process with high-throughput computation. Desalination 2020, 489, 114463. [Google Scholar] [CrossRef]
Figure 1. Diagram of the unit periodic structure of (a) commercial, (b) CLP, (c) IWP, (d) D, (e) L, and (f) IW spacers.
Separations 09 00062 g001
Figure 2. The relationship between the number of periodic units and pressure drop per unit length.
Separations 09 00062 g002
Figure 3. The mesh independence analysis of the computational domain composed of CLP spacer at u ¯ = 0.093 m/s.
Separations 09 00062 g003
Figure 4. (a) Discretization model (CLP) of the whole computational domain (≈0.75 million elements), (b) a spacer unit, and (c) zoomed spacer unit section.
Separations 09 00062 g004
Figure 5. (a) The transmembrane pressure, Δ P (bar), and (b) difference value of water permeation flux between TPMS-based spacers and commercial spacer, Δ J w (m3/(m2∙h)), for the whole membrane systems from inlet to outlet. Different colors represent commercial, CLP, IWP, D, L, and IW spacer-filled channels, respectively.
Separations 09 00062 g005
Figure 6. (a) The total pressure drop (difference value between the average pressure at the inlet and the average pressure at the outlet), Δ P c (bar), and (b) average permeation flux of water, J ¯ w (m3/(m2∙h)), for the whole RO system.
Separations 09 00062 g006
Figure 7. Contours of velocity magnitude (m/s) on eight yz-slices and streamlines at u ¯ = 0.1 m/s in (a) commercial spacer-filled channel, (b) CLP spacer-filled channel, (c) IWP spacer-filled channel, (d) D spacer-filled channel, (e) L spacer-filled channel, and (f) IW spacer-filled channel.
Separations 09 00062 g007
Figure 8. Contours of pressure differential on an xy-slice which is cut at z = 1/2 of height of the computational domain at u ¯ = 0.1 m/s in (a) commercial spacer-filled channel, (b) CLP spacer-filled channel, (c) IWP spacer-filled channel, (d) D spacer-filled channel, (e) L spacer-filled channel, and (f) IW spacer-filled channel.
Separations 09 00062 g008
Figure 9. Comparison of pressure drop for Commercial, CLP, IWP, D, L, and IW spacer-filled channels obtained from 3D simulations.
Separations 09 00062 g009
Figure 10. Comparison of Darcy friction coefficient vs. Reynolds number relationships for Commercial, CLP, IWP, D, L, and IW spacer-filled channels obtained using 3D simulations. Re is based on DH.
Separations 09 00062 g010
Figure 11. Contours of salt concentration (mol/m3) on top membrane surface at u ¯ = 0.1 m/s in (a) commercial spacer-filled channel, (b) CLP spacer-filled channel, (c) IWP spacer-filled channel, (d) D spacer-filled channel, (e) L spacer-filled channel, and (f) IW spacer-filled channel.
Separations 09 00062 g011
Figure 12. Cell-average mass transfer coefficient k ¯ m in a length of five-unit cells as a function of flow rate in commercial spacer-filled channel and a length of four-unit cells as a function of flow rate in TPMS-based spacer-filled channel.
Separations 09 00062 g012
Figure 13. TPMS-based spacers structure (a) CLP, (b) IWP, and (c) D with four types of porosity in each case. From left to right, the porosity of spacer-filled channels increases in turn.
Separations 09 00062 g013
Figure 14. The total pressure drop, Δ P c (bar), and average permeation flux of water, J ¯ w (m3/(m2∙h)), for feed channels with different height and porosity filled with (a) CLP, (b) IWP, and (c) D based on TPMS, respectively.
Separations 09 00062 g014
Table 1. Porosity and hydraulic diameter of the computational domains formed by CLP, IWP, D, L, and IW and commercial spacers.
The Type of Spacer Porosity   ( ε ) Hydraulic   Diameter   ( D H ,   m )   ×   10 3
CLP0.881.37
IWP0.901.79
D0.891.68
L0.871.88
IW0.902.36
Commercial
(thickness of 28 mil)
0.900.95
Table 2. The size of computational domain with respect to various spacers.
ParametersCommercialCLPIWPDLIW
Length, L (m) × 10319.71415.2729.29.218.418.4
Width, W (m) × 1033.9434.62.32.34.64.6
Height, H (m) × 1030.7012.32.32.32.32.3
Unit length, l (m) × 1033.9433.8182.32.34.64.6
Table 3. The power–law correlation between fD and Re in all spacer-filled channels.
The Type of SpacerfDR2
Commercial29.93 Re −0.530.998
CLP41.90 Re −0.860.998
IWP44.17 Re −0.670.999
D37.74 Re −0.610.999
L12.83 Re −0.4410.963
IW21.72 Re −0.550.997
R2 represents the correlation coefficients.
Table 4. The power–law correlation between k ¯ m and Q in all spacer-filled channels.
The Type of Spacer k ¯ m   R2
Commercial   Q 0.46 0.998
CLP   Q 0.28 0.986
IWP   Q 0.31 0.997
D   Q 0.33 0.997
L   Q 0.41 0.972
IW   Q 0.30 0.998
R2 represents the correlation coefficients.
Table 5. Different heights and porosity of feed channels based-on TPMS.
Height (m) × 103CLP1.9 2.0 2.1 2.2 2.3
IWP1.9 2.0 2.1 2.2 2.3
D1.9 2.0 2.1 2.2 2.3
Porosity (-)CLP0.58 0.68 0.78 0.88
IWP0.59 0.69 0.80 0.90
D0.60 0.70 0.80 0.90
Publisher’s Note: MDPI stays neutral with regard to jurisdictional claims in published maps and institutional affiliations.

