Abstract
Globally, there is an increased demand for plant- and animal-derived proteins. However, animal-derived proteins are still expensive and expected to negatively impact the environment. Sunflower seeds, an excellent source of proteins, are one of the most critical oilseeds produced in the world markets. This study used sunflower meal protein isolate (SMPI), wheat flour (WF), and their blends to make pasta with good sensory features and higher nutritional value. The chemical and amino acid compositions, rheological properties, color attributes, cooking quality, sensory properties, and texture analysis of pasta were evaluated. SMPI showed a high protein content (87.12%) compared to WF (10.90%). The pasta was made from WF with supplementing SMPI at three concentrations (3.0, 6.0, and 9.0% w/w) to improve the nutritional quality. Farinograph parameters showed that water absorption, arrival time, dough development time, mixing tolerance index, dough weakening, and dough stability increased as the percentage of SMPI in the blends increased. The results also showed that the color (L*, a*, and b*) of pasta samples was darker as the mixing level of SMPI increased. The obtained sensorial results confirmed this result. The cooking quality of pasta revealed that the weight, volume, and cooking loss of prepared pasta with SMPI (3.0–9.0%) increased compared to the control sample (pasta with 100% WF). Moreover, sensory evaluation of pasta revealed that all samples were acceptable. Nonetheless, mouth feel and overall acceptability of pasta reinforced with 3.0 and 6.0% SMPI did not notably impact the pasta compared to the control sample, while flavor did not significantly influence the pasta with 3.0% SMPI. These findings demonstrated that pasta supplemented with SMPI could benefit the pasta industry, which requires a suitable technological process to obtain novel products.
1. Introduction
The need for plant-derived proteins has grown considerably in the last few years because they are cheap and sufficient compared to animal sources [1]. Using agro-industrial byproducts to produce proteins is a sustainable approach that would provide commercial benefits to those byproducts [2,3,4].
Sunflower meal, a significant byproduct generated after oil extraction from sunflower seeds, is employed as a protein source in the animal feed industry [5]. It has a high protein content (30–50%) that could reach 66% depending on how well the defatting and seed dehulling operations work [6]. Sunflower meal protein isolate (SMPI) is a good source of food components because of its lower amounts of antinutritional and toxic chemicals [7]. Except for lysine, SMPI has a well-balanced amino acid composition [8]. Additionally, SMPI is abundant in sulfur-containing amino acids compared to other proteins of plant origin [9].
Pasta is a widespread food staple eaten regularly by people regardless of their socioeconomic levels on a global scale. The annual global pasta production is approximately 13.5 million tons [10]. It has favorable sensory qualities, is cheap, is easy to prepare, and has a long shelf life compared to other foods [11]. Moreover, pasta has a great nutritional profile, being a decent supply of complex carbohydrates and a modest source of vitamins and protein [12]. It is also deemed an acceptable means for food additives with minerals, proteins, and other beneficial healthful key ingredients [13]. Because of its popularity among consumers, pasta can potentially support the development of functional foods [14].
Indeed, various international health organizations view the enrichment of wheat flour as a crucial element in preventing disorders associated with inadequate nutrition [15]. Taking into account these factors and the goal to improve the nutritive value of pasta made from wheat flour, numerous investigations have examined the addition of components, such as moringa sprout powder, Spirulina, oregano and carrot leaf, among others [14,15,16]. Nevertheless, to the best of our knowledge, the addition of sunflower proteins to pasta products has not been reported. Therefore, this investigation aimed to fortify pasta with SMPI and evaluate its impact on some quality parameters, such as proximate composition, amino acids, and rheological attributes. Color, cooking quality, sensory attributes, and texture profile were also assessed and compared with pasta made with wheat flour.
2. Materials and Methods
2.1. Materials
Wheat flour (WF) was obtained from the North Cairo Flour Mills Company, Cairo, Egypt. Sunflower seeds were purchased from a local market in Cairo, Egypt. A mechanical press extracted the sunflower seed oil, and the sunflower meal was packed and stored at 4 °C for subsequent examination. All chemicals used in this work were of analytical grade.
2.2. Preparation of Sunflower Meal Protein Isolate (SMPI)
SMPI was processed by the alkaline extraction/isoelectric point precipitation approach, as described by Zaky et al. (2019) [17], with minor modifications. The sunflower meal was immersed in deionized water (1:10, w/v) and then stirred for 2 h after the pH of the suspension was adjusted to 9.0 by NaOH (1.0 N). After that, centrifugation of the mixture at 10,000× g for 15 min at 4 °C was employed. Subsequently, the pH of the supernatant was adjusted to 4.0 using HCl (1.0 M), and it was centrifuged once more under the same conditions. The precipitate was lyophilized at −53 °C for 36 h using a FreeZone 12-Plus freeze-drier (Labconco Corp., Kansas City, MO, USA) and kept at −20 °C for characterization.
2.3. Pasta Preparation
We performed some preliminary experiments to determine the typical concentrations of SMPI to be added to pasta. Some of them had a negative effect on some quality characteristics of the final product until we reached these concentrations: 3%, 6%, and 9%. We also considered the economic aspect of selecting these concentrations when applying the final product in the industry. Briefly, 200 g flour (wheat flour as a control or wheat flour substituted with SMPI powder; 3%, 6%, and 9%) was mixed with water (73, 75, 77, and 79 mL, respectively) in a mixer bowl for 1 min. Pasta samples were made using a lab pasta machine (Matic 1000 Simac Machine Corporation, Milano, Italy). The pasta was hydrated for 15 min in ambient air, dried for 10 h at 70 ± 1 °C, cooled at the surrounding temperature, placed in polyethylene bags, and stored at room temperature (25 ± 1 °C) for further investigation [18].
2.4. Amino Acid Profile
The amino acid composition of the WF and SMPI samples was hydrolyzed using 6 N HCl at 110 °C for 24 h, as stated by Zaky et al. [19]. The amino acids were measured by an amino acid analyzer (LA8080, Hitachi, Japan), and the contents were expressed as g/100 g protein.
2.5. Rheological Properties
The rheological characteristics of the dough were assessed using a Farinograph and rapid Visco analyzer (RVA-Ezi, Newport Scientific, Warriewood, NSW, Australia) following the AACC (2000).
2.6. Chemical Composition
According to the procedures outlined by AOAC (2016) [20], the moisture, protein, fat, ash, and fiber contents of WF, SMPI, and pasta samples were determined. The samples’ total carbohydrate content was estimated by difference.
2.7. Color Measurement
The color of raw and cooked pasta supplemented with SMPI at different concentration levels was estimated using a Hunter color meter (Hunter, Lab Scan XE, Reston, VA, USA). Color intensity was evaluated and presented based on the parameters of a* (redness), b* (yellowness), and L* (brightness).
2.8. Cooking Quality
The cooking features of pasta were accomplished by calculating the boost in weight, volume, and cooking loss after cooking as stated in official protocols 16–50 and 16–51 of the AACC (2000) [21].
2.9. Textural Profile Analysis (TPA)
The texture of cooked pasta was examined by a universal testing machine (Conetech, B type, Taiwan) equipped with software, as illustrated by Bourne [22]. A 25 mm diameter aluminum cylindrical probe was employed in a TPA double compression test to penetrate to 50% depth at a 1 mm/s speed test. The TPA graphic was used to quantify firmness (N), gumminess (N), chewiness (N), cohesiveness, and springiness.
2.10. Sensory Evaluation of Pasta
Pasta samples were prepared in boiling water to an ideal cooking time (9.5 min), drained, and held warm until serving. A total of 15 trained academic staff members were selected for the sensory test. The panelists were asked to assess the samples for color, flavor, mouthfeel, elasticity, and overall acceptability utilizing a 10-point hedonic scale (0 = dislike extremely; 5 = middle; 10 = like extremely) for each sensory attribute [15].
2.11. Statistical Analyses
The acquired data were analyzed using SAS Systems for Windows, version 6.12 TS020 (SAS, Statistical Analysis System, Institute Inc., Cary, NC, USA). To identify significant differences between the treatment means, we used analysis of variance (ANOVA) and the least significant difference (LSD) test (p < 0.05).
3. Results and Discussion
3.1. Amino Acid Content of WF and SMPI
The amino acid content of protein isolates indicates their nutritional quality. Table 1 displays the amino acid profiles of WF and SMPI. SMPI possessed the highest content of all essential amino acids, especially leucine (Leu), the most abundant essential amino acid in SMPI, followed by phenylalanine and threonine. These results are consistent with Ivanova et al. [8]. Additionally, WF contained moderate amounts of nonessential amino acids, particularly glutamic acid, compared to other nonessential amino acids; however, it was less than that of SMPI. The level of lysine in SMPI was limited to 2.43 g/100 g protein, whereas the quantity of this amino acid in the sunflower meal was found to be 3.55 g/100 g protein [23]. The reduction in the lysine concentration in the SMPI could be attributed to the interplay of the specific amino acid with other plant components throughout oil processing [24]. Adding SMPI to pasta could enhance the content of essential and nonessential amino acids. This may be due to the higher amino acid contents of SMPI than wheat flour, indicating that the substitution of WF with SMPI in pasta boosted the nutritional value.

Table 1.
Amino acid composition of wheat flour (WF) and SMPI.
3.2. Rheological Characteristics of Blends from Wheat Flour with SMPI
The data in Table 2 demonstrate the impact of adding SMPI at three levels (3.0, 6.0, and 9.0%) to WF on the rheological characteristics of dough as assessed by a farinograph. The incorporation of SMPI at various levels influenced the rheological characteristics of the pasta, where significant differences were noted (p < 0.05). Water absorption was 62.0% in WF, but it increased in a mixture of WF and SMPI as the replacement rate increased. SMPI contributed to the high water-absorbing capability, as it competed for water with other components. This might be attributed to the hydroxyl groups in the hydrocolloid structure of SMPI that permit additional water interactions via hydrogen bonding [25]. The arrival time and dough development time showed the same pattern. The chemical composition of SMPI revealed a high content of protein and fiber. Therefore, the long dough development time could result from the existence of large amounts of fiber and protein, which could impede the rapid formation of gluten and the hydration of the endosperm [26,27]. Compared to the control, the inclusion of SMPI also accelerated the dough’s development and arrival time, whereas the stability time decreased. The time required for the curve to remain at or above 500 BU is known as dough stability. Higher stability levels indicate strong flour, which in turn indicates stronger dough. The stability value of most commercial flour is up to 10 min [28,29]. Higher mixing tolerance index values correspond to stronger flour, with the mixing tolerance index parameter denoting the resistance of wheat flour to mixing. Because of the gluten protein dilution in WF caused by the greater fiber amount from SMPI, dough stability increased from 8.5 to 11.5 min as the SMPI level increased, whereas weakening boosted from 100 to 140 BU, and the mixing tolerance index jumped from 40 to 70 BU. This is mainly attributed to the interaction between fibrous substances and gluten, which influences the dough mixing characteristics [30,31].
Table 2.
Effect of mixing SMPI with wheat flour on farinograph parameters.
3.3. Pasting Profile (RVA)
The pasting properties (RVA) for mixtures of WF and WF fortified with SMPI at three levels (3.0, 6.0, and 9.0%) are presented in Table 3 and Figure 1. The incorporation of SMPI at various levels had an influence on the RVA parameters of pasta, where significant differences were noted (p < 0.05). The control sample (WF) had peak viscosity (3512 cP), trough (1477 cP), breakdown (1709 cP), final (3185 cP), and setback (330 cP) viscosities. Substitution of SMPI with WF (72% extraction) decreased the peak viscosity, trough, breakdown, final, and setback viscosities from 3462 to 3027 cP, 1157 to 840 cP, 1780 to 1742 cP, 3401 to 2582 cP, and 461 to 445 cP, respectively. At the same time, the peak time and pasting temperature values ranged between 12.1 to 10.7 min and 64.5 to 61.6 °C, respectively. When chickpea flour was substituted for wheat flour [32], the peak viscosity, breakdown, and setback were reduced because of the chickpea flour’s lower carbohydrate and different carbohydrate content and protein compositions, which would have an impact on the viscosity metrics. It has been suggested that the pasting temperature is associated with the water-binding ability [33]. The RVA properties of flour samples showed that flour blends had the lowest peak, trough, breakdown, final, and setback viscosities and pasting temperatures [34,35]. Differences between starches’ amylose/amylopectin ratios [36] and the lowering in gluten content were due to the replacement of gluten-free flour [37].
Table 3.
Effect of mixing SMPI with wheat flour on RVA parameters.
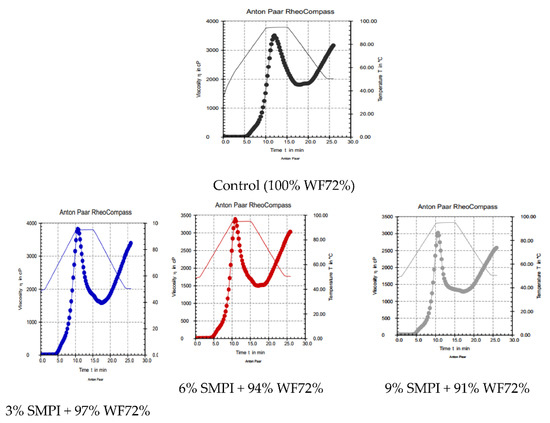
Figure 1.
Pasting profile (RVA) of dough WF (72%) supplemented with 3, 6, and 9% SMPI.
3.4. Proximate Composition of Raw Materials (WF, SMPI) and Pasta
The proximate compositions of WF, SMPI, pasta, and pasta fortified with different levels of SMPI (3.0, 6.0, and 9.0%) are presented in Table 4. The proximate chemical analysis results indicated that the SMPI sample had 3.47% moisture, 87.12% crude protein, 0.32% fat, 1.87% ash, 2.10% fiber, and 5.15% carbohydrates. The findings of the chemical composition of SMPI are in line with those acquired by Alexandrino et al. [38].
Table 4.
Chemical composition of WF, SMPI, and composite pasta (%).
Wheat flour (WF) was analyzed, and the following parameters were noted for moisture, protein, fat, ash, crude fiber, and carbohydrates: 11.65, 10.90, 1.22, 0.79, 0.81, and 74.63.40%, respectively. The results agree with literature values for various wheat flours [39,40]. Increasing the mixing level of SMPI (3.0 to 9.0%) with WF resulted in boosting the nutritional value of pasta, whereas protein, fat, ash, fiber, and carbohydrates varied by approximately 13.52–19.33%, 1.18–0.96%, 0.96–1.15%, 0.65–0.81% and 77.87–71.43%, respectively. The pasta mixed with the SMPI displayed similarities with those reported by others [15,16].
3.5. Color Parameters
Color is one of the crucial parameters used for the acceptability of food. Thus, it directly impacts consumers’ impressions because of its association with anticipations for product freshness and flavor [41]. Adding SMPI to pasta produced a pleasing white tone, per the panelists’ assessments and color examinations. Table 5 displays the color alterations of enriched pasta at various SMPI concentrations (3.0, 6.0, and 9.0%). As anticipated, a rise in darkness (L*) was noticed in the color of the enriched pasta products. Since SMPI contains a large amount of white pigment, the control group possessed the lowest b* value (17.19). After preparation, color losses were observed due to the pasta’s brighter and yellow colors. Table 5 shows that the pasta color significantly reduced when the SMPI mixing level was increased. This finding is supported by the preceding color parameters (L, a, and b), where the darkness increases as the SMPI replacement level increases. Nevertheless, a minor visible indication of the pigments’ diffusion into the cooking water existed. Similar outcomes were declared by Pasqualone et al. [10] and Özyurt et al. [14] for pasta incorporated with different natural food extracts.
Table 5.
Impact of mixing SMPI with wheat flour on the color parameter of pasta.
3.6. Cooking Quality of Pasta
The quality of the pasta might be determined by cooking characteristics, such as weight gain, cooking loss, and volume gain. The pasta’s weight and volume increased between 229 and 252% and 183 and 215%, respectively. According to the findings, the weight and volume increased compared to the control sample at various SMPI levels (Table 6). This might be due to an increase in the protein content of SMPI that caused the weight of the cooked pasta to rise. In addition, Özyurt et al. [14] reported that the pasta’s weight increased with the addition of Spirulina. Likewise, Fradique et al. [42] observed that adding microalgae biomass boosted the weight increase in the pasta. Cooking loss is one of the essential factors employed to judge the quality of the pasta’s cooking [43]. As the SMPI level rose, cooking losses increased. This outcome might result from a gluten- and SMPI-reinforced dough matrix that can trap starch in the resulting network. This value also represents the quantity of dry stuff lost in the cooking water [14]. According to Cacak-Pietrzak et al. [44], cooking losses of various semolina pasta types varied from 6 to 11%. Herein, the cooking losses of the control pasta and pasta with SMPI (3.0, 6.0, and 9.0%) were found to be 4.25, 4.85, and 5.10%, respectively. The pasta samples’ cooking loss was less than the 8% limit, which is considered acceptable technologically [45]. Since there were no significant variations in cooking loss between the groups (p < 0.05), it can be stated that the incorporation of SMPI at these levels (3.0, 6.0, and 9.0%) had no impact on cooking loss.
Table 6.
Impact of mixing SMPI with wheat flour on the cooking quality of pasta.
3.7. Texture Parameters of Pasta
Table 7 provides the texture parameters of pasta made from WF and WF enhanced with SMPI at various concentrations (3.0, 6.0, and 9.0%). The texture parameters of the pasta and pasta supplemented with SMPI were determined as the maximum force offered by the sample during shearing in a texture-testing machine (Instron). The findings showed that all samples of various pasta ranged in hardness (N) from 77.07 to 53.75 N. In contrast, low moisture and increased hardness in pasta without SMPI are linked to increased work and higher hardness. The hardness of pasta is perceptible to consumers and could be associated with the expansion and cell structure of the product, irrespective of moisture level. Consumers favor pasta that is firm, chewy, and not sticky in general. These results are consistent with Coello et al. [15] and Pasqualone et al. [10]. The results of the texture profile showed that mixing with SMPI at different levels (3.0, 6.0, and 9.0%) reduced the hardness (N), deformation at hardness (mm), deformation at hardness (%), hardness work (mJ), and fracturability of pasta with 1% load sensitivity (N). On the other hand, as the SMPI level in the pasta formulas increased, the hardness value decreased. Overall, the matrix structure network of starch, gluten, extra proteins, and other components has a major impact on the textural characteristics of pasta [46].
Table 7.
Impact of mixing SMPI with wheat flour on texture profile analysis of pasta.
3.8. Sensory Properties
In Table 8 and Figure 2, the organoleptic properties of pasta made from WF and WF enriched with SMPI at various concentrations (3.0, 6.0, and 9.0%) were evaluated for color, flavor, mouth feel, elasticity, and overall acceptability. As shown in Table 8, the pasta color dramatically decreased when the SMPI mixing level was increased. This finding is supported by the preceding color parameters (L, a, and b) (Table 5), where the darkness increases. However, the elasticity of the control pasta was not significantly impacted up to the 9.0% increase in SMPI replacement levels. One of the most crucial aspects of pasta quality is mouth feel. The acquired sensory results showed that, in contrast to the control sample, the mouth feel and overall acceptability of pasta reinforced with 3.0 and 6.0% SMPI and 3.0% SMPI, respectively, did not differ significantly. From the presented results in Table 8, the sensory attributes were diminished by raising the level inclusion of SMPI. Pasta can be reinforced with SMPI at concentrations of 3.0 or 6.0% without having a negative impact on the product’s sensory acceptance. It should be noted that younger generations, who are more likely to be open-minded and interested in trying new foods, may be more likely to accept greater SMPI ratios.
Table 8.
Impact of mixing SMPI with wheat flour on the sensory properties of pasta.
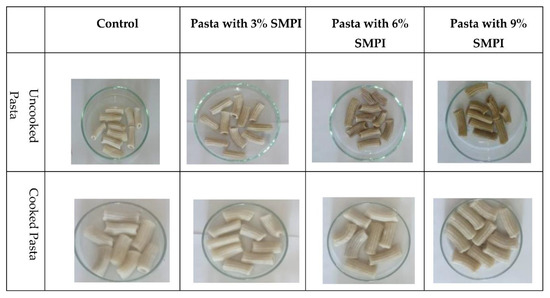
Figure 2.
Different pasta samples supplemented with 3, 6, and 9% SMPI.
4. Conclusions
This investigation offers beneficial information to support the use of SMPI (3%, 6%, and 9%) to obtain pasta with excellent nutritive, rheological, and sensory qualities. The impact of replacing wheat flour with 0%, 3%, 6%, and 9% SMPI on the color and textural profile of pasta was also investigated. The SMPI contained a good amount of essential amino acids (30.75 g/100 g) and nonessential amino acids (69.25 g/100 g). Including SMPI in pasta improved the nutritional value regarding protein content with only slightly reduced quality. The nutritional, rheological, color, and textural results of the present work show the potential of employing SMPI as a nourishing ingredient to make pasta of high quality. The overall acceptability score indicated that pasta enhanced with 3% and 6% SMPI were satisfactory to the judges, and there was no substantial difference in taste and texture compared with the control. These results are valuable because they demonstrate how adding inexpensive protein could raise the nutritional value of pasta and expand the potential uses for sunflower seed byproducts.
Author Contributions
Investigation, A.A.Z.; Methodology, A.A.Z., A.S.H. and S.M.; Resources, A.A.Z.; Formal analysis, A.A.Z., A.S.H. and S.M; Data curation, S.M.; writing—original draft preparation, A.A.Z. and A.S.H.; Writing—review and editing, A.A.Z. and A.M.A.E.-A.; Validation, A.A.Z., A.S.H. and A.M.A.E.-A.; Visualization, A.M.A.E.-A. All authors have read and agreed to the published version of the manuscript.
Funding
This research received no external funding.
Institutional Review Board Statement
Not applicable.
Informed Consent Statement
Not applicable.
Data Availability Statement
Not applicable.
Conflicts of Interest
The authors declare no conflict of interest.
References
- Zaky, A.A.; Chen, Z.; Qin, M.; Wang, M.; Jia, Y. Assessment of antioxidant activity, amino acids, phenolic acids and functional attributes in defatted rice bran and rice bran protein concentrate. Prog. Nutr. 2020, 22, e2020069. [Google Scholar]
- Helkar, P.B.; Sahoo, A. Review: Food Industry By-Products used as a Functional Food Ingredients. Int. J. Waste Resour. 2016, 6, 1000248. [Google Scholar]
- Zaky, A.A.; Simal-Gandara, J.; Eun, J.-B.; Shim, J.-H.; Abd El-Aty, A.M. Bioactivities, Applications, Safety, and Health Benefits of Bioactive Peptides from Food and By-Products: A Review. Front. Nutr. 2022, 8, 815640. [Google Scholar] [CrossRef]
- Zaky, A.A.; Liu, Y.; Han, P.; Chen, Z.; Jia, Y. Effect of pepsin–trypsin in vitro gastro-intestinal digestion on the antioxidant capacities of ultra-filtrated rice bran protein hydrolysates (molecular weight > 10 kDa; 3–10 kDa, and< 3 kDa). Int. J. Pept. Res. Ther. 2020, 26, 1661–1667. [Google Scholar]
- Sredanović, S.A.; Lević, J.D.; Jovanović, R.D.; Đuragić, O.M. The nutritive value of poultry diets containing sunflower meal supplemented by enzymes. Acta Period. Technol. 2012, 43, 79–91. [Google Scholar] [CrossRef]
- Dabbour, M.; He, R.; Ma, H.; Musa, A. Optimization of ultrasound assisted extraction of protein from sunflower meal and its physicochemical and functional properties. J. Food Process. Eng. 2018, 41, e12799. [Google Scholar] [CrossRef]
- Dabbour, M.; Jiang, H.; Mintah, B.K.; Wahia, H.; He, R. Ultrasonic-assisted protein extraction from sunflower meal: Kinetic modeling, functional, and structural traits. Innov. Food Sci. Emerg. Technol. 2021, 74, 102824. [Google Scholar] [CrossRef]
- Ivanova, P.; Chalova, V.; Koleva, L.; Pishtiyski, I. Amino acid composition and solubility of proteins isolated from sunflower meal produced in Bulgaria. Int. Food Res. J. 2013, 20, 2995. [Google Scholar]
- De Oliveira Filho, J.G.; Egea, M.B. Sunflower seed byproduct and its fractions for food application: An attempt to improve the sustainability of the oil process. J. Food Sci. 2021, 86, 1497–1510. [Google Scholar] [CrossRef]
- Pasqualone, A.; Punzi, R.; Trani, A.; Summo, C.; Paradiso, V.M.; Caponio, F.; Gambacorta, G. Enrichment of fresh pasta with antioxidant extracts obtained from artichoke canning by-products by ultrasound-assisted technology and quality characterisation of the end product. Int. J. Food Sci. Technol. 2017, 52, 2078–2087. [Google Scholar] [CrossRef]
- Kadam, S.; Prabhasankar, P. Marine foods as functional ingredients in bakery and pasta products. Food Res. Int. 2010, 43, 1975–1980. [Google Scholar] [CrossRef]
- Marchylo, B.A.; Dexter, J.E. Pasta production. In Cereals Processing Technology; Owens, G., Ed.; CRC Press: Boca Raton, FL, USA; Boston, MA, USA; New York, NY, USA; Washington, DC, USA, 2001; pp. 109–130. [Google Scholar]
- Borneo, R.; Aguirre, A. Chemical composition, cooking quality, and consumer acceptance of pasta made with dried amaranth leaves flour. LWT-Food Sci. Technol. 2008, 41, 1748–1751. [Google Scholar] [CrossRef]
- Özyurt, G.; Uslu, L.; Yuvka, I.; Gökdoğan, S.; Atci, G.; Ak, B.; Işik, O. Evaluation of the cooking quality characteristics of pasta enriched with Spirulina platensis. J. Food Qual. 2015, 38, 268–272. [Google Scholar] [CrossRef]
- Coello, K.E.; Peñas, E.; Martinez-Villaluenga, C.; Cartea, M.E.; Velasco, P.; Frias, J. Pasta products enriched with moringa sprout powder as nutritive dense foods with bioactive potential. Food Chem. 2021, 360, 130032. [Google Scholar] [CrossRef]
- Boroski, M.; de Aguiar, A.C.; Boeing, J.S.; Rotta, E.M.; Wibby, C.L.; Bonafé, E.G.; de Souza, N.E.; Visentainer, J.V. Enhancement of pasta antioxidant activity with oregano and carrot leaf. Food Chem. 2011, 125, 696–700. [Google Scholar] [CrossRef]
- Zaky, A.A.; Chen, Z.; Liu, Y.; Li, S.; Jia, Y. Preparation and assessment of bioactive extracts having antioxidant activity from rice bran protein hydrolysates. J. Food Meas. Charact. 2019, 13, 2542–2548. [Google Scholar] [CrossRef]
- Hussein, A.M.; Kamil, M.M.; Mohamed, G.F. Physicochemical and sensorial quality of semolina defatted guava seed flour composite pasta. J. Am. Sci. 2011, 7, 623–629. [Google Scholar]
- Zaky, A.A.; Liu, Y.; Han, P.; Ma, A.; Jia, Y. Effect of flavorzyme digestion on the antioxidant capacities of ultra-filtrated rice bran protein hydrolyzates. J. Food Process. Preserv. 2020, 44, e14551. [Google Scholar] [CrossRef]
- AOAC. Official Methods of Analysis, 20th ed.; AOAC Internationa: Gaithersburg, MA, USA, 2016. [Google Scholar]
- AACC. Official Methods of the American Association of Cereal Chemists. Methods 54-21, 16-50, and 16-51, 10th ed.; The Association: St. Paul, MN, USA, 2000. [Google Scholar]
- Bourne, M.C. Food Texture and Viscosity: Concept and Measurement; Elsevier Press: New York, USA; London, UK, 2003. [Google Scholar]
- Ivanova, P.; Chalova, V.; Koleva, L.; Pishtiyski, I.; Perifanova-Nemska, M. Optimization of protein extraction from sunflower meal produced in Bulgaria. Bulg. J. Agric. Sci. 2012, 18, 153–160. [Google Scholar]
- San Juan, L.D.; Villamide, M.J. Nutritional evaluation of sunflower products for poultry as affected by the oil extraction process. Poult. Sci. 2001, 80, 431–437. [Google Scholar] [CrossRef]
- Rodge, A.B.; Sonkamble, S.M.; Salve, R.V.; Hashmi, S.I. Effect of hydrocolloid (guar gum) incorporation on the quality characteristics of bread. J. Food Process. Technol. 2012, 3, 136. [Google Scholar] [CrossRef]
- Indrani, D.; Soumya, C.; Rajiv, J.; Venkateswara Rao, G. Multigrain bread—Its dough rheology, microstructure, quality and nutritional characteristics. J. Texture Stud. 2010, 41, 302–319. [Google Scholar] [CrossRef]
- Hefni, M.; Witthöft, C.M. Increasing the folate content in Egyptian baladi bread using germinated wheat flour. LWT-Food Sci. Technol. 2011, 44, 706–712. [Google Scholar] [CrossRef]
- Mohamed, A.A.; Rayas-Duarte, P.; Shogren, R.L.; Sessa, D.J. Low carbohydrates bread: Formulation, processing and sensory quality. Food Chem. 2006, 99, 686–692. [Google Scholar] [CrossRef]
- Hussein, A.S.; Fouad, M.; El-Shenawy, M. Production of functional Pan Bread from Mixture of Tiger Nut Flour, Milk Permeate and Hard Wheat Flour. Egypt. J. Chem. 2022, 65, 509–517. [Google Scholar]
- Peymanpour, G.; Rezaei, K.; Sorkhilalehloo, B.; Pirayeshfar, B.; Najafian, G. Changes in Rheology and Sensory Properties of Wheat Bread with the Addition of Oat Flour. J. Agr. Sci. Tech. 2012, 14, 339–348. [Google Scholar]
- Hussein, A.M.S.; Ali, H.S.; Al-Khalifa, A.R. Quality Assessment of Some Spring Bread Wheat Cultivars. Asian J. Crop Sci. 2018, 10, 10–21. [Google Scholar] [CrossRef][Green Version]
- Gómez, M.; Oliete, B.; Rosell, C.M.; Pando, V.; Fernández, E. Studies on cake quality made of wheat–chickpea flour blends. LWT-Food Sci. Technol 2008, 41, 1701–1709. [Google Scholar] [CrossRef]
- Adebowale, Y.A.; Adeyemi, I.A.; Oshodi, A.A. Functional and physicochemical properties of flours of six Mucuna species. Afr. J. Biotechnol. 2005, 41, 461–1468. [Google Scholar]
- Hallén, E.; İbanoğlu, Ş.; Ainsworth, P. Effect of fermented/germinated cowpea flour addition on the rheological and baking properties of wheat flour. J. Food Eng. 2004, 63, 177–184. [Google Scholar] [CrossRef]
- Muralikrishna, G.; Nirmala, M. Cereal α-amylases-an overview. Carbohydr. Polym. 2005, 60, 163–173. [Google Scholar] [CrossRef]
- Van Hung, P.; Maeda, T.; Morita, N. Dough and bread qualities of flours with whole waxy wheat flour substitution. Food Res. Int. 2007, 40, 273–279. [Google Scholar] [CrossRef]
- Renzetti, S.; Arendt, E.K. Effect of protease treatment on the baking quality of brown rice bread: From textural and rheological properties to biochemistry and microstructure. J. Cereal Sci. 2009, 50, 22–28. [Google Scholar] [CrossRef]
- Alexandrino, T.D.; Ferrari, R.A.; de Oliveira, L.M.; Rita de Cássia, S.C.; Pacheco, M.T.B. Fractioning of the sunflower flour components: Physical, chemical and nutritional evaluation of the fractions. LWT 2017, 84, 426–432. [Google Scholar] [CrossRef]
- Fouad, M.T.; Hussein, A.S.; El-Shenawy, M.A. Production of pasta using tiger nut and fermented permeate with some probiotic bacteria. Egypt. J. Chem. 2022, 65, 569–578. [Google Scholar]
- Hussein, A.S.; Saber, M.; Daoud, E.; Alshafei, M.; Ziada, Y.; Gamal, A.; Ezelarab, H.; Saber, L.; Naeem, M.A.; Kamal, E. Formulation and Evaluation of Biscuits from Functional Flour Mixture to enhance of antioxidants reflecting on nutrition in Patients. Egypt. J. Chem. 2022, 65, 455–466. [Google Scholar] [CrossRef]
- El-Faham, S.Y.; Mohsen, M.; Sharaf, A.; Zaky, A. Utilization of mango peels as a source of polyphenolic antioxidants. Curr. Sci. Int. 2016, 5, 529–542. [Google Scholar]
- Fradique, M.; Batista, A.P.; Nunes, M.C.; Gouveia, L.; Bandarra, N.M.; Raymundo, A. Incorporation of Chlorella vulgaris and Spirulina maxima biomass in pasta products. Part 1: Preparation and evaluation. J. Sci. Food Agric. 2010, 90, 1656–1664. [Google Scholar] [CrossRef]
- Sozer, N.; Dalgıç, A.C.; Kaya, A. Thermal, textural and cooking properties of spaghetti enriched with resistant starch. J. Food Eng. 2007, 81, 476–484. [Google Scholar] [CrossRef]
- Cacak-Pietrzak, G.; Haber, T.; Lewczuk, J.; Madrias, M. Quality evaluation of selected extra pasta on the Warsaw market. Przeg. Zboz-Mlyn 1997, 41, 26–29. [Google Scholar]
- Dick, J.W.; Youngs, V.L. Evaluation of durum wheat, semolina and pasta in the United States. In Durum Wheat Chemistry and Technology; Fabriani, G., Lintas, C., Eds.; American Association of Cereal Chemists Inc.: St. Paul, MN, USA, 1998; pp. 237–248. [Google Scholar]
- Chang, H.C.; Wu, L.C. Texture and quality properties of chinese fresh egg noodles formulated with green seaweed (Monostroma nitidum) powder. J. Food Sci. 2008, 79, S398–S404. [Google Scholar] [CrossRef] [PubMed]


Publisher’s Note: MDPI stays neutral with regard to jurisdictional claims in published maps and institutional affiliations. |
© 2022 by the authors. Licensee MDPI, Basel, Switzerland. This article is an open access article distributed under the terms and conditions of the Creative Commons Attribution (CC BY) license (https://creativecommons.org/licenses/by/4.0/).