Abstract
In shale vanadium ore, vanadium is mainly formed as a low-V(III) homogeneous phase to partially replace Si and exists in the lattice structure of aluminosilicate minerals such as biotite. During the acid leaching of shale vanadium ore, an activator is needed to effectively extract vanadium. Using biotite as a tetrahedral structure doped with Aluminum-Silicon tetrahedron structure, the interaction between leaching-agent ions (H+), activator ions (F−), and vanadium-containing biotite surface was discussed by DFT quantum chemical calculations. The dissolution behavior of activator fluoride ions on the surface of vanadium-bearing biotite during sulfuric acid leaching was revealed. According to the simulated leaching results, the oxygen on the biotite surface first absorbed hydrogen ions to undergo complete hydroxylation, and then combined with hydrogen ions to form water molecules. However, in the presence of activator (NaF), fluoride ions were adsorbed on the surface cations, which catalyzed the formation of water molecules and promoted the dissolution of surface cations. SEM–EDS analysis showed that the surface of vanadium-bearing minerals became very irregular, and the number of voids and cracks greatly increased. At the same time, XPS showed that the addition of activator fluoride ions destroyed the Al-O tetrahedron structure. Many Al and V atoms dissolved in the solution, which improved the leaching rate of vanadium.
1. Introduction
Vanadium is an important strategic metal with unique physical and chemical properties. Thus, it has been widely used in metallurgy, chemicals, new energy, medicine, and other industrial fields [1]. Moreover, due to the rapid development of modern industries, both the application of it and demand for vanadium will continue to expand. Nowadays, efficiently recovering and utilizing shale vanadium ore (an important vanadium resource) has received extensive attention. However, due to the complex properties of shale vanadium ore, it is difficult to effectively recover vanadium by ordinary mineral processing methods. Consequently, chemical extraction methods must be adopted.
Traditional chemical extraction mainly involves roasting and subsequent leaching. However, no matter what kind of roasting is adopted, there are inevitable shortcomings such as pollution and low recovery rates. Due to the shortcomings of traditional processes, researchers have proposed a process that uses direct acid leaching without roasting [2], that is, terminating the roasting process and directly using acid leaching to extract vanadium. The working environment is good. This process is simple, which has been one of the development directions of vanadium extraction. For the direct acid leaching of vanadium, the level of the vanadium leaching rate is the key. Strengthening the acid leaching process by adding an activator to obtain a higher leaching rate is important for improving the overall recovery rate of vanadium [3]. The most commonly used activators are fluorides such as NaF and CaF2, which are mainly used to destroy the lattice structure of vanadium-containing minerals by the reaction of fluorine and silicon, which releases vanadium [4]. Chen et al. found that the leaching rate of vanadium reached 92.93% when using 15% sulfuric acid, 3% calcium fluoride, and 30 min leaching time with calcium fluoride as the activator [5]. When using 5% activator calcium fluoride, 60% leaching-agent oxalic acid, and 4 h leaching time, Hu et al. conducted vanadium extraction on vanadium-bearing stone coal. The obtained vanadium leaching rate exceeded 70% [6]. When Zhang et al. added the activator calcium fluoride to the acid leaching of vanadium-containing stone coal, the final vanadium leaching rate was as high as 91.85% [7]. Yang et al. carried out the acid leaching of shale vanadium ore under the conditions of a sulfuric acid concentration of 20%, CaF2 dosage of 5%, and leaching temperature of 90 °C. The leaching rate of vanadium increased to 90% [8]. Wang et al. found that fluoride in the activator formed a complex with cations in the crystal lattice of vanadium-bearing minerals, thus promoting the leaching of vanadium from vanadium-bearing minerals [9]. When sodium fluoride was added to sulfuric acid to leach nickel oxide ore, the extraction rate of nickel in the solution increased by 14% [10]. Ma et al. found that adding sodium fluoride easily opened the mineral structure containing nickel and cobalt and improved the leaching rate under a reaction temperature of 400 °C, a reaction time of 60 min, a sulfuric acid dosage of 3%, and a sodium fluoride concentration of 3% [11]. By comparing the leaching experiments with/without calcium fluoride, Liu et al. found that calcium fluoride significantly improved the efficiency and the leaching rate of vanadium from stone coal [8]. Tripathy et al. studied the influence of adding sodium fluoride (NaF) on alumina leaching. With the addition of NaF to the acid leaching medium, the recovery of alumina was improved significantly [12]. In shale vanadium ore, vanadium is mainly formed as a low (V(III)) homogeneous phase to partially replace Si and exists in the lattice of aluminosilicate minerals, such as biotite. The essence of the acid leaching of vanadium is the release of vanadium atoms from the mineral lattice structure into the solution, i.e., the surface dissolution of vanadium-containing minerals. However, the surface dissolution behavior of vanadium-containing minerals by acid and activators containing fluorine is still rare, and is worth studying further.
The quantum chemical calculation is one way to characterize the leaching process [13]. At present, the ab initio method, semi-empirical method, and density functional theory (DFT) methods are the most popular methods. Through quantum chemical calculations, Tang et al. obtained key information about the electronic structure and geometry of transition states, which are difficult to measure experimentally. They revealed the release, migration, and transformation process of organic molecules in coal during the thermal chemical transformation at a microscopic level [14]. Zhu et al. studied the weak interaction at the clay interface by DFT calculation [15]. Lian et al. calculated the electrostatic potential and van der Waals forces of crown ether and Li ion by DFT calculation [16]. Zhang et al. studied the adsorption behavior of three rare earth ions, Y, La, and Eu, on a kaolinite surface by DFT calculations [17]. Nie et al. studied the leaching mechanism of a catalyst through DFT calculations and experiments [18]. Zhu et al. reported the adsorption and desorption of Pb(II) on L-lysine-modified montmorillonite (L-Mt) with molecular dynamics simulation. Therefore, DFT calculations can be used to effectively study interactions between activator ions and vanadium-containing mineral surfaces to further explain experimental results [19]. Therefore, DFT calculations can be used to effectively study interactions between activator ions and vanadium-containing mineral surfaces to further explain experimental results.
In view of this, direct acid leaching of vanadium was carried out on shale vanadium ore by using sodium fluoride as the activator. Using DFT calculations, the interactions between the leaching-agent (H+), activator (F−), and the surface of vanadium-containing biotite (the main vanadium-bearing mineral in shale vanadium ore) were studied from a quantum chemistry perspective. These were performed to reveal the dissolution behavior of the activator (F−) on the surface of vanadium-bearing biotite during sulfuric acid leaching. At the same time, the destruction mechanism of vanadium-containing biotite lattice by hydrogen ions in the acid leaching system was also elucidated.
2. Materials and Methods
It can be seen from Table 1 that the shale vanadium ore contained 1.15% vanadium, which has a high extraction value. The main component of the ore sample is SiO2, whose content reached as high as 81.53%, followed by Fe and Al. According to the basicity R = (CaO + MgO)/(SiO2 + Al2O3) = 0.11, shale vanadium ore is acidic, making it suitable for extracting vanadium by acid leaching.

Table 1.
Main chemical components of shale vanadium ore/%.
Shale vanadium ore was taken from Mayang area of Hunan Province, China and its chemical composition is shown in Table 1. EPMA and SEM–EDS were used to explore the surface morphology of coarse and fine particles. The surface elements were qualitatively analyzed by FTIR spectroscopy (The Thermo Fly IS50, Thermo Fisher Technology, Hefei, China). The surface elements were quantitatively analyzed by X-ray photoelectron spectroscopy (XPS) Multipak (Thermo Fisher Technology, Hefei, China).
3. Results
3.1. Experimental Results
To verify the reliability of the simulated leaching process, an actual leaching experiment was carried out. The shale vanadium ore sample was quantitatively weighed (100 g), and 5% NaF was used as the activator for sulfuric acid leaching.
When the amount of sulfuric acid is insufficient in the leaching process, vanadium cannot be released. Too much sulfuric acid will lead to waste. Under the conditions of temperature 80 °C, leaching time 5 h, liquid–solid ratio 3:1, and stirrer speed 300 r/min, the effect of sulfuric acid dosage on vanadium leaching rate was investigated.
Figure 1 Effect of sulfuric acid dosage on leaching. The effect of sulfuric acid on the leaching rate is significant, and the leaching rate increases significantly with an increase in sulfuric acid dosage. When the dosage reached about 25 mL/100 g, the leaching rate reached a peak of 85%.
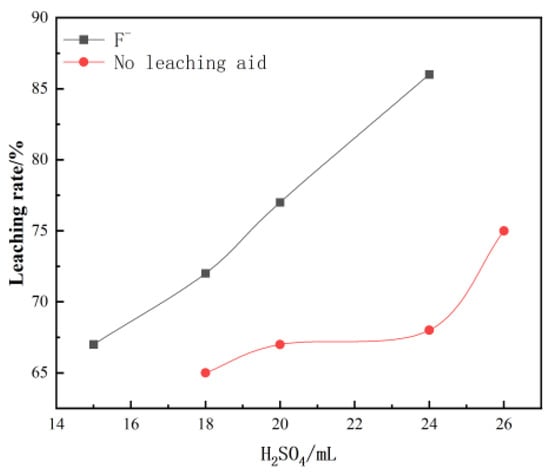
Figure 1.
Effect of sulfuric acid concentration on vanadium leaching rate.
Generally, the longer the leaching time, the higher the leaching rate; however, when it reaches a certain time, the leaching rate shows a slow increase trend, which will not achieve satisfactory results and reduce production efficiency.
It can be seen from Figure 2, the leaching time has a significant effect on the leaching rate. As the leaching temperature increases, the leaching rate of vanadium increases significantly. When it reaches about 6 h, the leaching rate reaches a peak of 85%.
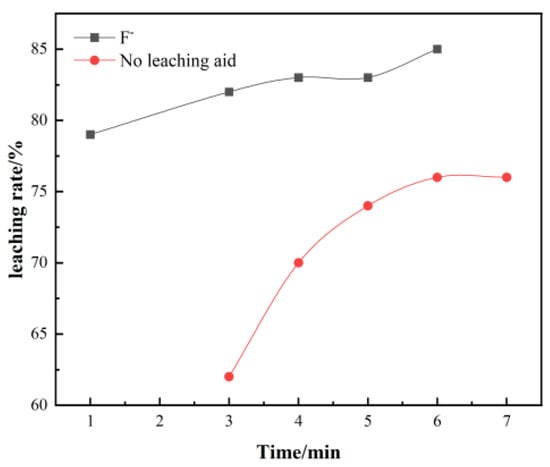
Figure 2.
Effect of time on vanadium leaching rate.
The effect of leaching temperature on leaching rate is obvious. Therefore, the effect of leaching temperature on vanadium leaching rate was investigated by keeping leaching time of 6 h, leaching sulfuric acid dosage 25 mL/100 g, leaching liquid–solid ratio: 3:1, and agitator speed 300 r/min.
The leaching temperature has a significant effect on the leaching rate. It can be seen from Figure 3, as the leaching temperature increases, the leaching rate of vanadium increases significantly. However, it is far less than the amount of sulfuric acid. When the temperature reaches about 90 °C, the leaching rate reaches a peak of 92%. The surface morphology of leaching residue under the two acid leaching conditions was studied by SEM–EDS. The surface elements of the leaching residue were analyzed, and the results are shown in Figure 4 and Figure 5.
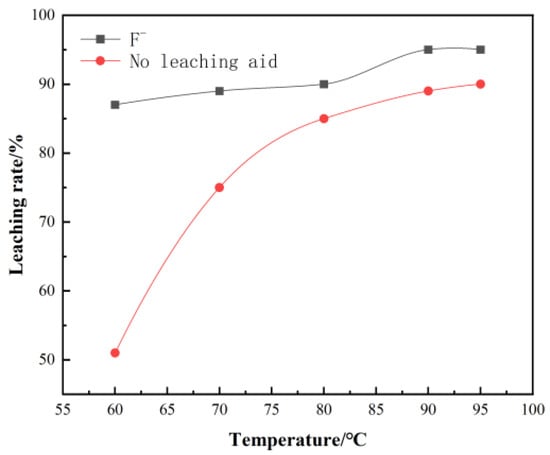
Figure 3.
Effect of temperature on vanadium leaching rate.
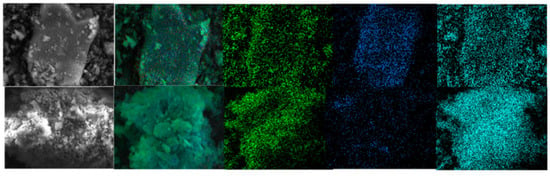
Figure 4.
Surface analysis of leaching residue (fine particles): up: non-activated; below: NaF.
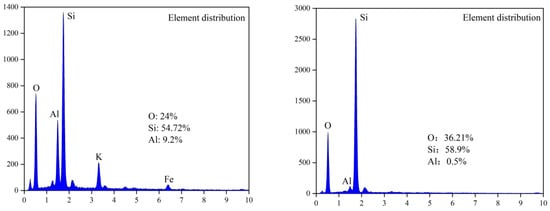
Figure 5.
Surface analysis of leaching residue (fine particles): left: un-activated; right: NaF.
According to the mineral surface structure, the vanadium-oxygen tetrahedron was surrounded by an aluminum-oxygen tetrahedron. Therefore, it can be judged whether the mineral crystal was destroyed due to the lack of aluminum atoms on the mineral surface. Figure 4 and Figure 5 show that, in the absence of an activator (F−), the aluminum content in the leaching residue was higher than that in the leaching residue with an activator. This indicates that, when the activator was present, most Al-O bonds were mainly broken, thereby releasing Al and V. Therefore, the Al and V content in the leaching residue were greatly reduced, which is consistent with the simulated results. In the presence of an activator (F−), the surface of the leaching residue was extremely uneven and contained many defects, ravines, and cracks. This showed that the mineral surface was greatly damaged, which improved the leaching rate of vanadium.
An AlFn complex is formed on the surface of biotite under the action of fluoride ions. There were three peaks at 939.16, 867.33, and 635.43 cm−1, as shown in Figure 6b. The peak at 1794.92 cm−1 disappeared, which was due to V-O bonds. This shows that the complex activation acid leaching greatly destroyed the mineral surface. This was realized by the adsorption and complexation of fluorine ions with the surface, which was basically consistent with the calculated results. The V-O chemical bond was weakened by the adsorption of fluoride ions.

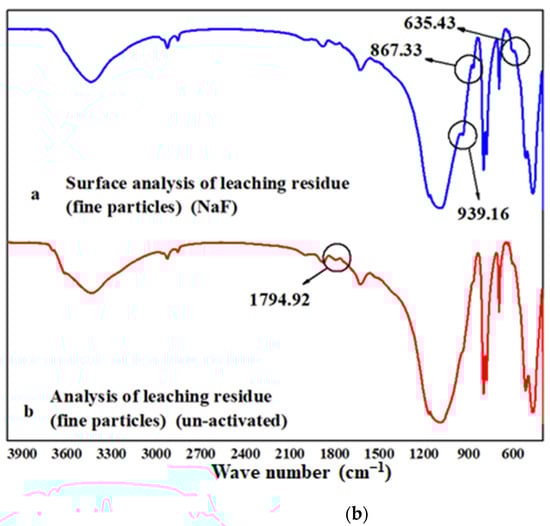
Figure 6.
EPMA and FTIR analysis: (a) EPMA analysis of leached slag: left: non-activated; right: NaF; (b) FTIR spectra of leached slag.
It was impossible to accurately analyze the leaching residue by SEM–EDS because the actual mineral contained too many interferences, which created interference. To fit the calculation model to the maximum extent and reflect the actual leaching of minerals, pure biotite (90% purity) was selected for non-activated acid leaching and activated acid leaching experiments. The main elements in the leaching residue under both conditions were analyzed by XPS, and the results are shown in Figure 7 and Figure 8.
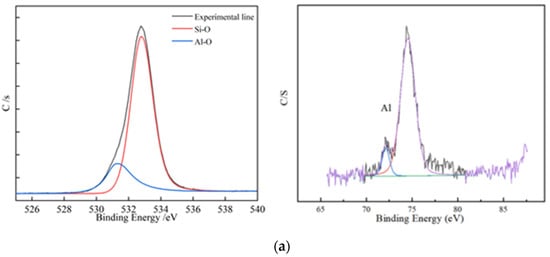
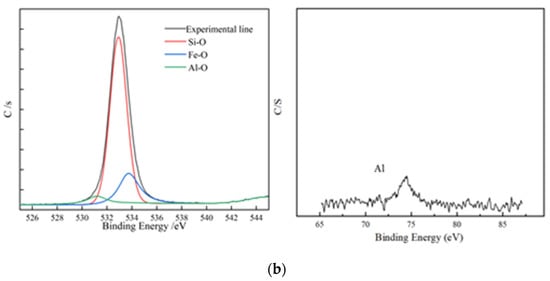
Figure 7.
XPS element analysis; (a) XPS element analysis results of residues from non-activated leaching; (b) XPS element analysis results of residues from activated leaching.
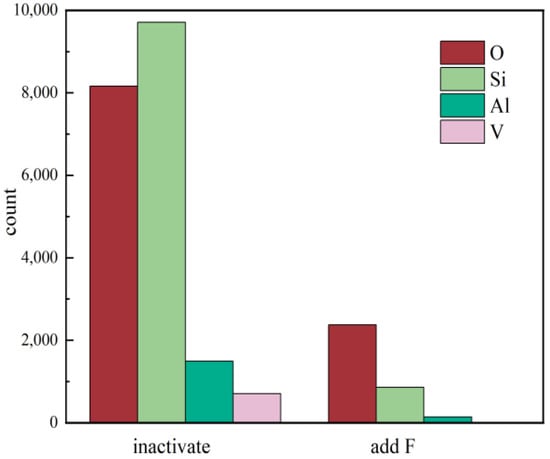
Figure 8.
Statistical analysis of EDS elemental distribution under two different leaching conditions.
According to the structure of biotite, two layers of Si-O and an Al-O tetrahedral structure wrapped the Fe-O octahedral structure. This means that if the tetrahedral structure was not completely removed, the octahedral structure could not be released. Figure 7 shows that, under the non-activated acid leaching conditions, no Fe-O components were present on the composition of surface oxygen elements. The Fe-O component became visible only during the activated acid leaching process, which showed that the addition of activator fluoride ions destroyed the tetrahedron. The XPS spectrum of Al shows that the signal-to-noise ratio of Al became extremely low during acid leaching. This means that many Al atoms migrated from the surface to the solution, and the Al-O tetrahedron was destroyed.
A comprehensive comparison of the elemental distribution of the leaching residues under both leaching conditions was carried out, and the total elemental content distribution under each acid leaching condition was statistically analyzed by EDS.
Figure 8 shows that the distribution of O, Al, and Si on the mineral surface was greatly reduced under the active acid leaching system, which means that the dissolution of aluminosilicate minerals is the fundamental cause of surface cation dissolution.
3.2. Study on Kinetics of Leaching Process
Different leaching processes have different control steps. According to the characteristics of the control process and the test results of the factors affecting the leaching rate, the preliminary steps were judged. Finally, the kinetic equation was calculated and control steps were determined by calculating the apparent activation energy of the reaction. The kinetic equation is as follows:
Liquid-layer diffusion control: r = kt (1)
Solid-layer diffusion control: 1 − (1 − r) 1/3 = kt (2)
Chemical reaction control: 1 − 2r/3 − (1 − r) 2/3 = kt (3)
In the leaching kinetics, the activation energy was calculated by Arrhenius Equation (1), and the control type was determined according to the activation energy. When the leaching process is controlled by diffusion, Ea is 4~12 kJ/mol; when the leaching process is controlled by chemical reaction, Ea > 42 kJ/mol. Different control steps, leaching rate, and leaching time obey different kinetic equations. If the chemical reaction is the controlling step, the function 1 − (1 − η) 1/3 is linear with the leaching time t. If it is the control step, the function 1 − 2/3 − (1 − η) 2/3 has a linear relationship with the leaching time t.
where A is the frequency factor, E is the apparent activation energy of the reaction, R is the gas constant, and T is the thermodynamic temperature.
3.2.1. Effect of Temperature on Activation Energy of Reaction
Under the conditions of stirring speed 300 r/min, liquid–solid ratio 3:1, and 3.616 mol/L H2SO4, the kinetic experiments of non-activated acid leaching and activated acid leaching were carried out. Figure 9 shows the kinetic curves of non-activated and activated acid leaching at different temperatures. Figure 9 and Figure 10 are the graphs under the dynamic equations corresponding to the three controls.
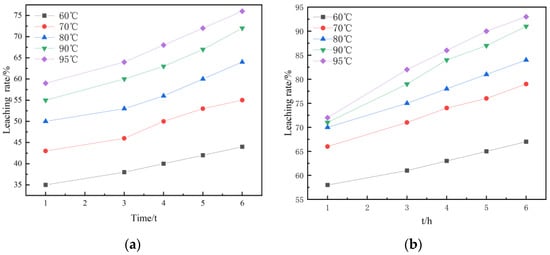
Figure 9.
Dynamic curves: (a) kinetic curves at different temperatures during non-activated acid leaching; (b) kinetic curves at different temperatures during activated acid leaching.
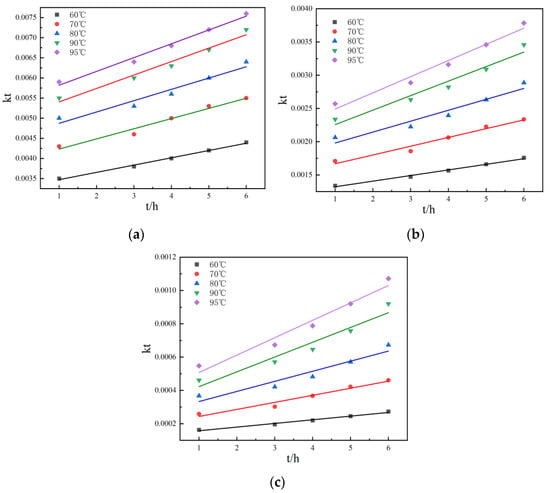
Figure 10.
Linear relationship: (a) the relationship between η and t at different temperatures during non-activated acid leaching; (b) the relationship between 1 − (1 − r) 1/3 and t at different temperatures during non-activated acid leaching; (c) the relationship between 1 − 2r/3 − (1 − r) 2/3 and t at different temperatures during non-activated acid leaching.
Figure 10 and Figure 11 show the kinetic curves at different temperatures during non-activated and activated acid leaching, respectively. It can be seen that 1 − (1 − r)1/3 has a good linear relationship with t; there is also a good linear relationship between 1 − 2r/3 − (1 − r) 2/3 and t, so it can be preliminarily judged that the leaching process is controlled by chemical reaction. In order to further determine the control steps, the reaction rate constants k and lnk can be determined. The relationship between K and lnk is shown in Table 2 and Table 3.

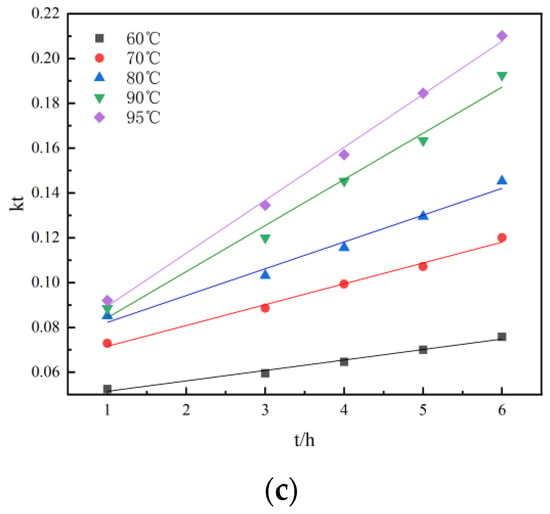
Figure 11.
Linear relationship: (a) the relationship between r and t at different temperatures during activated acid leaching; (b) The relationship between 1 − (1 − r)1/3 and t at different temperatures during activated acid leaching; (c) the relationship between 1 − 2r/3 − (1 − r) 2/3 and t at different temperatures during activated acid leaching.
Table 2.
The relationship between lnk and 1/T in inactive acid leaching at different temperatures.
Table 3.
The relationship between lnk and 1/T in activated acid leaching at different temperatures.
According to the Arrhenius equation and activation energy value in the range of activation energy controlled by chemical reaction, it can be observed that both the non-activated acid leaching process and activated acid leaching process are controlled by chemical reaction [20]. The apparent activation energy of the reaction obtained by the linear slope in Figure 12 and Figure 13 is 38.04 kJ/mol and 40.75 kJ/mol.
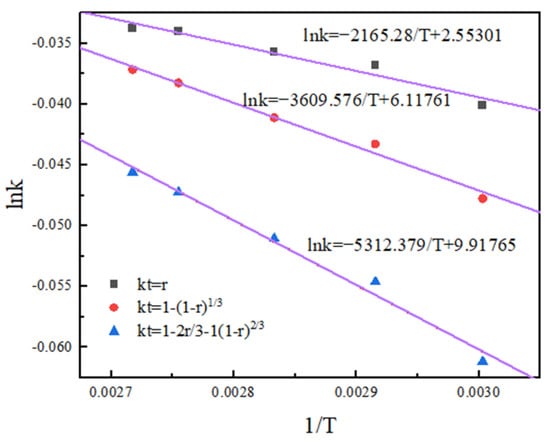
Figure 12.
Arrhenius diagram of non-activated acid leaching.
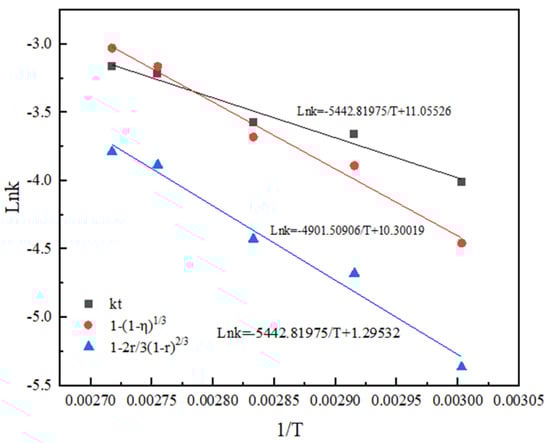
Figure 13.
Arrhenius diagram of activated acid leaching.
The results show that activated acid leaching does not change the control step of the leaching process, but greatly reduces the activation energy of the reaction. The leaching reaction is more likely to occur, and the leaching rate is improved.
3.2.2. Effect of Sulfuric Acid Concentration on Reaction Order
The reaction order reflects the influence of leaching-agent concentration on the reaction rate. The greater the reaction order, the more significant the effect of leaching-agent concentration on the reaction rate. Under the conditions of leaching temperature 90 °C, stirring speed 300 r/min, and liquid–solid ratio 3:1, the kinetic experiments of non-activated acid leaching and activated acid leaching were carried out to investigate the effect of sulfuric acid concentration on the reaction order.
Figure 14 shows the leaching kinetics curves of different sulfuric acid concentrations under non-activated acid leaching and activated acid leaching. It can be seen from the figure that the leaching rate of vanadium increases with an increase in sulfuric acid concentration.
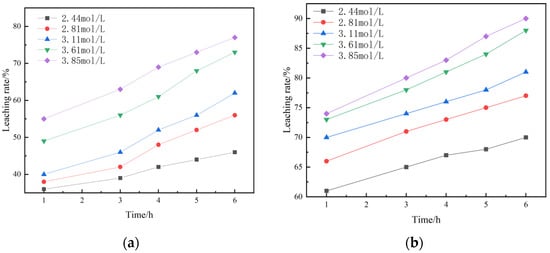
Figure 14.
(a) Kinetic curves of non-activated acid leaching under different sulfuric acid concentrations; (b) Kinetic curves of activated acid leaching under different sulfuric acid concentrations.
According to the above test results, it is preliminarily determined that the leaching process is controlled by chemical reaction. Therefore, the data in the figure are substituted into the kinetic equations corresponding to the two controls for calculation and plotting to obtain Figure 15.
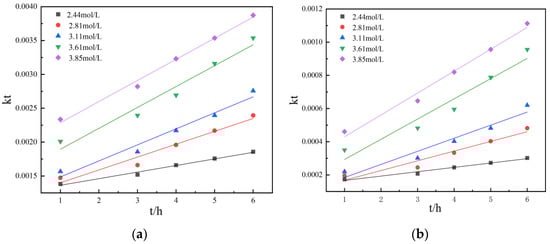
Figure 15.
(a) The relationship between 1 − (1 − η) 1/3 and t under different sulfuric acid concentrations during non-activated acid leaching; (b) the relationship between 1 − 2η/3 − (1 − η)2/3 and t under different sulfuric acid concentrations during non-activated acid leaching.
It can be seen that in the case of non-activated acid leaching, 1 − (1 − η) 1/3, 1 − 2η/3 − (1 − η)2/3 and t are linear relationship. The leaching rates of different sulfuric acid concentrations were brought into the kinetic equation of chemical reaction control for calculation and mapping, see Figure 15. In this way, the leaching kinetic equations under different sulfuric acid concentrations are obtained. The kinetic equations are shown in Table 4 and Table 5.
Table 4.
Relationship between lnk and 1/T in non-activated acid leaching.
Table 5.
Relationship between lnk and 1/T in activated acid leaching.
The diagram is drawn with the logarithm of sulfuric acid concentration as abscissa and the logarithm of leaching rate as ordinate, as shown in Figure 16. The slope of the straight line in the figure is the reaction order of the leaching reaction.
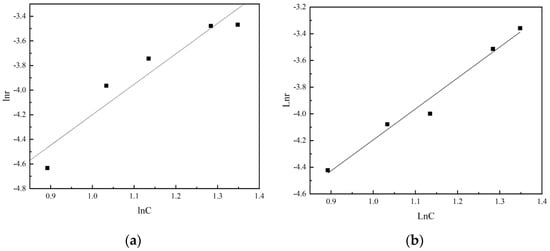
Figure 16.
(a) Logarithmic diagram of leaching rate of vanadium and sulfuric acid concentration in non-activated acid leaching. (b) Logarithmic diagram of leaching rate of vanadium and sulfuric acid concentration in activated acid leaching.
It can be seen from the figure that the reaction order of non-activated acid leaching is 2.5, while the reaction order of activated acid leaching is reduced to 2.32. It is indicated that the destruction of acid solution to the structure of vanadium-bearing minerals is enhanced due to the activation of activator during activated acid leaching, thus reducing the influence of sulfuric acid concentration on leaching rate.
3.3. Quantum Chemical Calculation
3.3.1. Structural Optimization
DFT was used for calculations, and the convergence test of biotite was realized in the CASTEP program. Through the generalized gradient approximation (GGA)functional, the calculated energy consumption was 370 eV, and the k-point grid was 2 × 3 × 1. The interactions between ionic electrons and valence electrons were described by an ultrasoft pseudopotential and plane wave basis set. The Broyden–Fletcher–Goldfarb–Shanno (BFGS) algorithm was used to minimize the convergence conditions: atomic force < 0.03 eV/AOC, stress < 0.05 GPa, atomic displacement < 1 × 10⁻³, and energy change < 1 × 10⁻⁵ eV. Finally, using biotite as the calculation model, the exposed surface in the biotite crystal was studied. The (002) surface was the most active part. The biotite split to form a biotite surface (002). After the surface optimization, all atoms were relaxed except the lower atoms, with five layers and 15 μΩ vacuum space.
Combined with the analysis of the mineral phase composition and valence state of vanadium, it was found that biotite was the most important vanadium-bearing mineral in shale vanadium ore. Vanadium was mainly formed as a low-V(III)) homogeneous phase to partially replace Si and existed in the lattice structure of aluminosilicate minerals such as biotite.
Therefore, biotite was used as the doped Al-Si tetrahedral structure. The dopant was trivalent vanadium, and the number of dopant elements was two. As for the number of doped atoms, it must follow the formation of aluminum silicate. Vanadium cannot completely replace silicon. Moreover, the distribution of vanadium in biotite is very uneven and the amount is far lower than that of silicon and aluminum. Therefore, in the single-layer TOT structure, replacing a silicon atom with a vanadium atom is enough to obtain the desired results. In addition, since too many atoms will increase the calculation time, the total number of elements should not exceed 200, to ensure the consistency of the calculation results and reduce computing costs.
3.3.2. Acid Leaching Simulation
The dissolution process during leaching can be simulated by a series of atomic defect models. When the absence of each atom on the crystal surface corresponds to a defect model, the model can be used to simulate the state of surface atom removal and surface element relaxation.
The calculation model consists of three parts. (1) The crystal model of vanadium-containing minerals is constructed: according to the formation mechanism of silicate minerals, vanadium replaces silicon in biotite to become a vanadium-containing ore trough model; (2) Activator-crystal surface interactions: the activator (F−) and leaching agent (H+) are placed at the O, Al, and V sites of the (002) surface of biotite, respectively. Periodic boundary conditions are used to avoid boundary effects; (3) Surface atomic dissolution process: the continuous separation of elements from surface to solution.
3.4. Structural Analysis of Biotite
The crystal structure model of biotite is shown in Figure 17a. Figure 17b is an optimized biotite plate with five layers and 15 μΩ vacuum space.
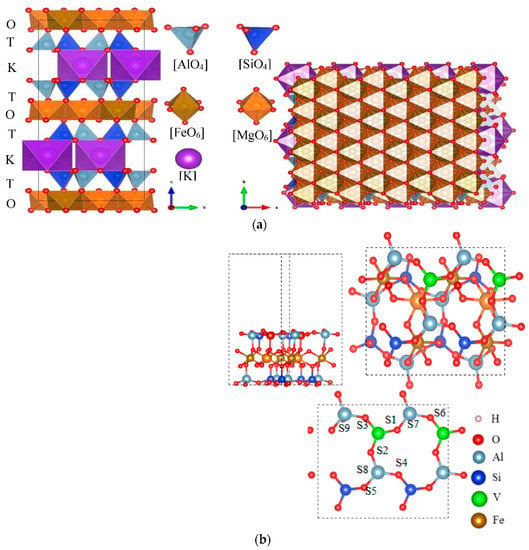
Figure 17.
The Figure shows that the unit cells of the mica structure are stacked in a TOT layered structure; (a) crystal structure of biotite; (b) surface model of biotite.
Two tetrahedral layers (T) are clamped by an octahedral (O) layer, and the tetrahedra in the T layer are connected by oxygen atoms on the lower triangular face. Six tetrahedra form a six-membered ring structure, and the rings are interconnected to each other to form an infinitely extended plane. Since the trivalent aluminum atoms in the silicon tetrahedron are partially replaced in the T layer, the entire T layer is negatively charged; therefore, the interlayer potassium ions act as compensation charges, so that the overall system is electrically neutral. The central atom of the octahedron in the O layer combined with the surrounding oxygen atoms in a six-coordinated configuration. Four oxygen atoms are shared with the apical oxygen atoms of the T-layer tetrahedron, and the other two oxygen atoms are provided by the hydroxyl groups located in the six-membered ring cavity.
3.5. Computational Analysis Based on DFT
3.5.1. Dissolution Behavior of Biotite by Hydrogen Ions
We performed calculations using the Materials Studio software CASTEP template, and the calculation structure was visualized in terms of changes in the surface structure, adsorption results, and the fracture and formation of surface chemical bonds.
In the direct acid leaching system, all elements (O) around vanadium must form water molecules to separate from the surface so that vanadium can migrate from the surface to the leaching solution. O and H+ require two steps to form water molecules. The first step is hydroxylation, which is shown in Figure 18.
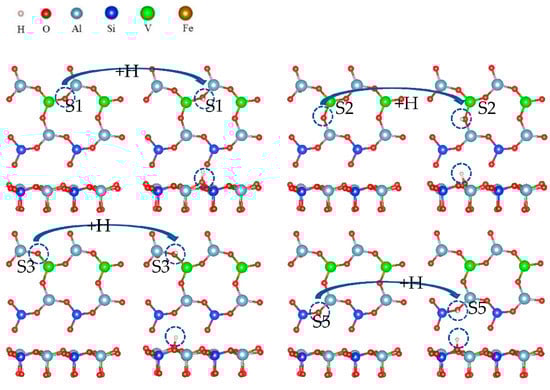
Figure 18.
Formation process of surface hydroxyl groups.
Hydroxylation involves the formation of a hydroxyl group by the adsorption of hydrogen ions on surface oxygen atoms. Figure 18 shows that a hydrogen atom and an oxygen atom are bound together by covalent bonds. This is the process in which hydrogen ions combine with surface oxygen atoms to form hydroxyl groups during acid leaching. The hydroxylation process is also a spontaneous process.
Changes in free energy and bond length after surface hydroxylation are shown in Table 2. It can be seen that the four bond lengths did not reach 2.2, so the hydroxylation process could not break the surface bonds. The free energy was less than 0, so the reaction proceeded spontaneously.
The hydroxylation process is only the first step for the oxygen atom to separate from the surface, and the most critical step is dehydration. After surface hydroxylation, hydrogen ions reacted with hydroxyl to form water. The hydration process of the O(S1) site is shown in Figure 19.
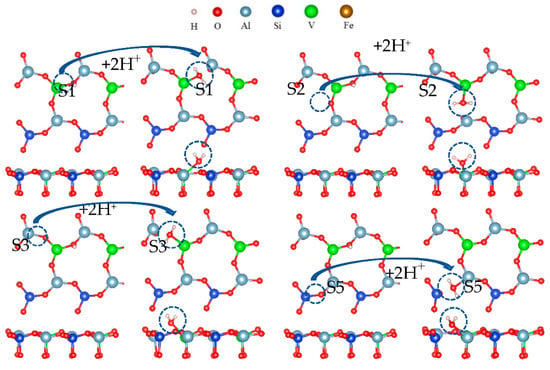
Figure 19.
Formation process of surface water molecules.
It can be seen from Figure 19 that two hydrogen atoms and one oxygen atom were bound in the acid leaching system, and three atomic nuclei constituted an isosceles triangle with two protons at the bottom. Table 3 shows changes in the free energy and bond length after the formation of the water molecule. During the formation of a water molecule, the Al-O or V-O bonds on the surface were broken, and the free energy was negative. The formation of a water molecule was spontaneous.
According to the results in Table 6 and Table 7, the bond length did not reach a certain length during hydroxylation, and the Al-O bond was not broken. Only after the formation of a water molecule did the bond length reach 2.2 Ω, and the Al-O bond was broken.
Table 6.
Changes in free energy and bond length during hydroxylation.
Table 7.
Changes in free energy and bond length during water formation.
Hydroxyls can exist on the surface as the final product of the reaction between oxygen atoms and hydrogen ions, and hydroxide ions can appear on the surface as the final product of the reaction between oxygen atoms and hydrogen ions.
In the direct acid leaching system, an atom is hydroxylated to a stable state, no water molecules are formed, and the mineral crystals are not destroyed. However, above a certain value, the surface chemical bond will be broken. Table 8 shows the free energy of hydroxyl groups to form water molecules.
Table 8.
Free energy of hydroxyl groups forming water molecules.
Figure 20 shows the formation process of water molecules from hydroxyl groups in which the Al-O bond was broken. As a highly polar bond, the O-H bond in the hydroxyl group combined with a hydrogen atom to form a water molecule.
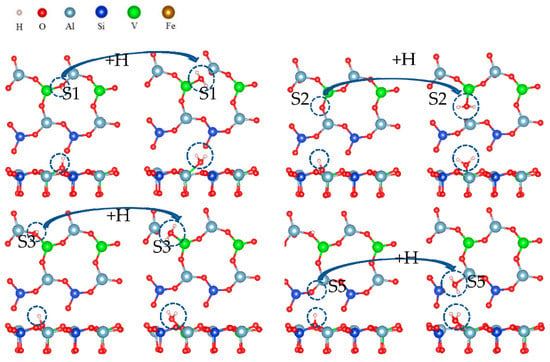
Figure 20.
The formation process of water by hydroxyl groups bonding with hydrogen ions on the surface.
Table 8 lists the free energy of the formation of water molecules from hydroxyl groups. The free energy of hydroxylation was very similar to that of the final formation of water, which means that it is very difficult to combine hydroxyl with hydrogen ions to form water molecules.
When vanadium-bearing biotite is in an acidic environment, oxygen atoms will adsorb hydrogen ions and form a polyhydroxy state on the surface of biotite. When the number of surface hydroxyls reaches saturation, the hydroxyl group continue to combine with H+ to form water molecules. This means that, in an acid leaching system without fluorine ions, some oxygen atoms form hydroxyl groups rather than water molecules. The combination of H+ and O under the action of fluoride-free is key to the release of vanadium, but in the presence of fluoride, the adsorption of fluoride ions (NaF) will affect the surface hydroxylation process and the formation of water, so the two cases are calculated.
3.5.2. Dissolution Behavior of Biotite by Hydrogen Ions
To illustrate the effect of fluoride on the leaching process in more detail, the leaching process containing fluoride is simulated. The hydroxylation process during the adsorption of fluoride ions is simulated in Figure 21. Figure 21 shows the process in which an oxygen atom combines with hydrogen ions at the S2 site to generate water molecules during the adsorption of fluoride ions.
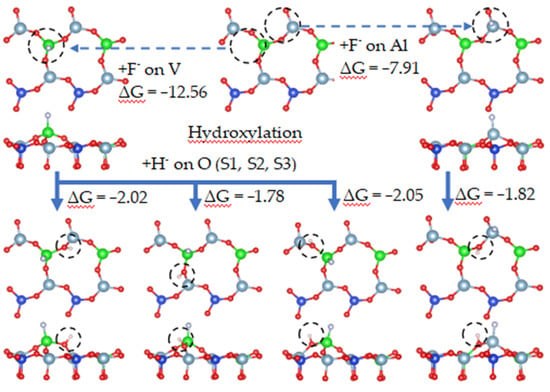
Figure 21.
Hydroxylation process under fluoride dissolution.
On the biotite surface, fluorine ions were placed on the cations, and hydrogen ions were placed on the oxygen atoms to construct the calculation model for DFT. The calculation results are shown in Figure 21. The adsorption process of fluorine ions on cations was spontaneous, and its free energy was smaller than that of hydroxylation, which means that the adsorption of fluoride ions was more stable than that of hydroxylation. When fluoride ions were adsorbed on vanadium or aluminum, the free energies of hydroxylation at O(S1), O(S2), and O(S3) were −2.02 eV, −1.78 eV, and −2.05 eV, respectively. It can be determined that the adsorption of ions affects the hydroxylation process.
It can be seen from Figure 22 that, when fluorine ions were adsorbed on the surface, each oxygen atom directly combined with two hydrogen ions to form a water molecule. The free energy of water formation at O(S1), O(S2), O(S3), and O(S5) were −4.01 eV, −4.27 eV, −3.81 eV, and −7.42 eV, respectively. When water molecules formed, the Al-O bonds broke.
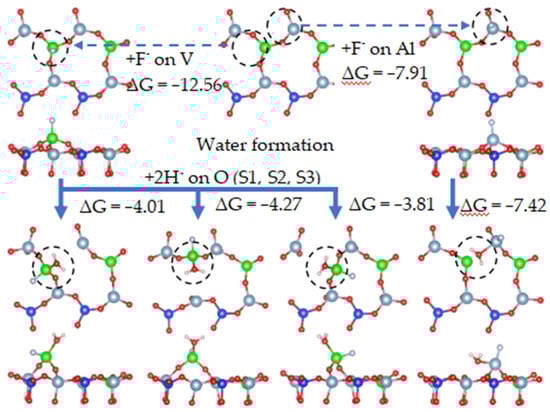
Figure 22.
Water formation under fluoride ion dissolution.
It can be observed from the above simulated leaching process that the free energy of water formation was much lower than that of hydroxylation, indicating that water formed by the combination of hydroxyl groups and hydrogen ions occurred preferentially. Therefore, we continued to simulate the process of hydroxyl groups binding with hydrogen ions to form water molecules in the presence of adsorbed fluoride ions, as shown in Figure 23.
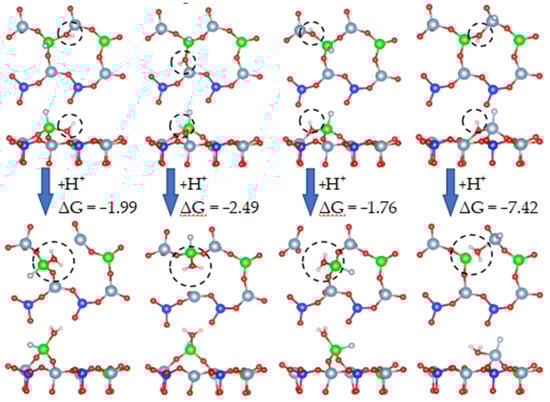
Figure 23.
Dissolution behavior of fluoride ions on biotite surface (from hydroxyl groups to water molecules).
Figure 23 shows that, when each oxygen atom combined with two hydrogen ions to form a water molecule, the system was the most stable. Water molecules appeared on the surface as the final product of the reaction between oxygen atoms and hydrogen ions. Therefore, during activated acid leaching, oxygen atoms no longer remained in the hydroxyl state but combined with two hydrogen ions to form water molecules.
Fluoride ions can stably adsorb on the cations located on the surface of vanadium-bearing biotite, and the free energy of F− adsorption is much lower than that of H+ adsorption. Therefore, F− will be preferentially adsorbed on the surface of biotite.
When cations coordinated with fluoride ions, the oxygen atom directly combined with two hydrogen atoms to form a water molecule, and the adsorption of fluoride ions can catalyze the formation of surface water molecules, indirectly promoting the fracture of Al-O and V-O bonds and accelerating the separation of surface cations. This is one of the mechanisms by which fluorine ions corroded the biotite surface.
3.5.3. Dissolution Behavior of Mica Surface by Fluoride Ions
When the surface of vanadium-containing biotite contains an oxygen deficiency, the complexation properties of fluoride ions play a major role in improving the leaching rate. Fluoride ions will combine with cations to form a complex in the case of tetrahedral oxygen atom defects. The cations will be directly stripped from the surface in the form of a complex, thus completing the extraction process of vanadium. The dissolution of fluorine ions on a surface with oxygen defects is simulated in Figure 24.
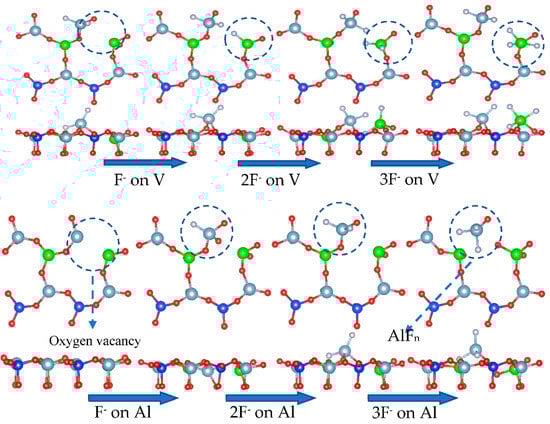
Figure 24.
Dissolution behavior of mica surface by fluoride ions.
Assuming that O(S3) first forms a water molecule, the oxygen vacancy at the S3 site in Figure 24 leads to the destruction of the Al-O tetrahedron, which exposes aluminum to an environment containing fluoride ions, allowing it to complex with fluorine ions. When an aluminum atom combines with three fluorine ions, two Al-O bonds break, and the aluminum atom migrates into the solution.
DFT calculations revealed from a thermodynamics perspective that the coordination number of fluorine and aluminum in the process of activated acid leaching was 2–4 (Figure 25a). Therefore, aluminum can be separated from the surface when no more than four fluorine ions are attached to the aluminum atom, which is consistent with the simulated results. When aluminum atoms are removed from the surface, vanadium will enter the solution in the form of VOn compounds. When defects are present in the vanadium-oxygen tetrahedron, vanadium is exposed and complexes with fluorine ions. However, the complexation process is different from that of aluminum. When more than three fluorine ions bind with vanadium atoms, the vanadium-oxygen bond does not break, which means it is difficult to separate vanadium from the surface via complexation.
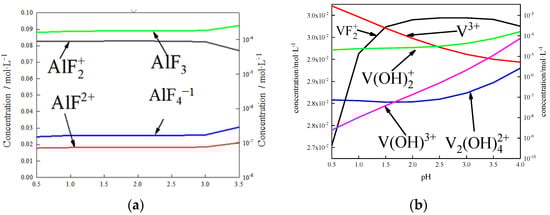
Figure 25.
Simulation of the solution under complexation conditions: (a) effect of pH on the form and content of Al in solution; (b) effect of pH on the form and content of V in solution.
The state of vanadium in the solution was calculated by thermodynamics, as shown in Figure 25b. The complexes of fluorine ions and vanadium rarely existed as VFn. Vanadium atoms mainly existed as hydroxides or simple ions in the solution. Combined with Figure 25, aluminum and fluoride ions combined to form complexes that dissolved from the surface. Vanadium was isolated on the surface in the form of VOn and dissolved from the surface under the action of H+. This is another important mechanism involved in dissolving fluorine ions from the biotite surface.
4. Conclusions
Based on DFT calculations, the acidic extraction of vanadium from shale vanadium ore was simulated using sodium fluoride as the activator. Shale vanadium ore has a TOT structure. Even if the lattice is not fully destroyed during the acid leaching, the leaching agent and activator ions could enter the mineral lattice. When the tetrahedral structure in the TOT structure was completely destroyed, elements in the tetrahedral structure were released, and the elements in the octahedral structure wrapped by the tetrahedron could also be released.
During activated acidic leaching, the energy of the hydroxylation and water formation processes was higher when F− and H+ were adsorbed together. This promoted the leaching of vanadium. When F− ions were adsorbed alone on the surface of the tetrahedral-deficient biotite, the fluorine ions combined with V cations to form complexes. The cations were directly stripped from the surface in the form of complexes to complete the leaching process of vanadium.
After activated leaching, the surface of vanadium-bearing minerals became extremely irregular, and the number of voids and cracks increased greatly. In addition, many aluminum atoms in the leaching residue disappeared, and the correlation of oxygen, silicon, and other elements decreased significantly. The addition of fluoride ions greatly damaged the Al-O and Fe-O bonds, effectively destroying the tetrahedral structure and improving the leaching rate of vanadium. Through pure mineral leaching test and leaching process simulations, it is shown that activated acid leaching is much better than non-activated acid leaching.
The kinetic analysis shows that the leaching process obeys the kinetic equation controlled by chemical reaction. When the leaching aid is added, the reaction activation energy and reaction order can be reduced, and the influence of temperature and sulfuric acid concentration on leaching can be weakened, so as to reduce energy consumption and acid consumption while ensuring higher leaching rate.
Through quantum chemical calculation, the action process of leaching agent and activator on the lattice surface of vanadium-containing minerals in the adsorption process was analyzed from the microscopic point of view, the chemical bond breakage on the surface during the adsorption process was taken as the main criterion, and the leaching process that could not be characterized by the test was analyzed in detail.
Author Contributions
Y.T.: validation, data curation, formal analysis, writing—original draft, quantum chemicals, writing—review, dynamic test and editing. G.Y.: methodology, supervision, project administration, writing—review and editing. H.Z.: quantum chemical method and editing. Y.H.: formal analysis, writing—review and editing. Q.Z.: validation, writing—review and editing. X.W.: dynamic test, editing. S.Z.: investigation, writing—review and editing. X.K., Y.Z., X.X., Y.R., and C.S.: investigation, writing—review and editing. All authors have read and agreed to the published version of the manuscript.
Funding
This work was financially supported by the National Natural Science Foundation of China (Nos. 51964028).
Acknowledgments
Funding from the National Natural Science Foundation of China and the National Key Basic Research is gratefully appreciated.
Conflicts of Interest
The authors declare that they have no known competing financial interests or personal relationships that could have appeared to influence the work reported in this paper.
References
- Ye, G.; Zhang, S.; Wei, H. Process Mineralogy Characteristics of Stone Coal and Its Relationship to Vanadium Extraction. Chin. J. Rare Met. 2014, 38, 146–157. [Google Scholar]
- Ye, G.; Tang, Y.; Zuo, Q.; Hu, Y.; Tao, Y.; Chen, Z. Study on the extraction of vanadium and iron from the direct acid leaching solution of vanadium-containing steel slag by tertiary amine TOA. Conserv. Util. Miner. 2021, 41, 17–24. [Google Scholar]
- Wen, J.; Jiang, T.; Zhou, W.; Gao, H.; Xue, X. A cleaner and efficient process for extraction of vanadium from high chromium vanadium slag: Leaching in (NH4)2SO4-H2SO4 synergistic system and NH4+ recycle. Sep. Purif. Technol. 2019, 216, 126–135. [Google Scholar] [CrossRef]
- Li, S. Study on Acid Leaching Mechanism of Mica-Type Vanadium-Bearing Stone Coal Flotation Concentrate. Master’s Thesis, Wuhan University of Technology, Wuhan, China, 2016. [Google Scholar]
- Chen, B.; Bao, S.; Zhang, Y.; Li, S. A high-efficiency and sustainable leaching process of vanadium from shale in sulfuric acid systems enhanced by ultrasound. Sep. Purif. Technol. 2020, 240, 116624. [Google Scholar] [CrossRef]
- Hu, P.; Zhang, Y.; Liu, T.; Huang, J.; Yuan, Y.; Zheng, Q. Selective Leaching of Vanadium from Stone Coal by Oxalic Acid Direct Leaching. Chin. J. Rare Met. 2017, 41, 918–924. [Google Scholar]
- Zhang, C.; Sun, C.; Yin, W.; Tian, M. Extraction of vanadium from illite-type vanadium-bearing stone by coal acid with calcium fluoride as leaching aid. Multipurp. Util. Miner. Resour. 2019, 5, 42–47. [Google Scholar]
- Yang, X.; Zhang, Y.; Huang, J.; Liu, T.; Fu, L. Effect of Leaching agent CX on Acidic Leaching of Vanadium from Stone Coal. Met. Mine 2012, 3, 86–89. [Google Scholar]
- Wang, F.; Zhang, Y.; Liu, T.; Huang, J.; Zhao, J.; Zhang, G.; Liu, J. A mechanism of calcium fluoride-enhanced vanadium leaching from stone coal. Int. J. Miner. Process. 2015, 145, 87–93. [Google Scholar] [CrossRef]
- Klyushnikov, A.M. Sulphuric-Acid Leaching of Ural Oxidized Nickel Ore with Sodium Sulfite and Fluoride Additives. J. Min. Sci. 2018, 54, 141–146. [Google Scholar] [CrossRef]
- Ma, B.; Yang, W.; Pei, Y.; Wang, C.; Jin, B. Effect of activation pretreatment of limonitic laterite ores using sodium fluoride and sulfuric acid on water leaching of nickel and cobalt. Hydrometallurgy 2017, 169, 411–417. [Google Scholar] [CrossRef]
- Tripathy, A.K.; Behera, B.; Aishvarya, V.; Sheik, A.R.; Dash, B.; Sarangi, C.K.; Bhattacharya, I.N. Sodium fluoride assisted acid leaching of coal fly ash for the extraction of alumina. Miner. Eng. 2019, 131, 140–145. [Google Scholar] [CrossRef]
- Wen, W. Applied Fundamental Study on Solvent Extraction of V and Cr and Control of Metal Ion Species by Primary Amines. Ph.D. Thesis, Tianjin University, Tianjin, China, 2019. [Google Scholar]
- Zhang, Y.; Liu, T. Removal process of structural oxygen from tetrahedrons in muscovite during acid leaching of vanadium-bearing shale. Minerals 2018, 5, 208–216. [Google Scholar] [CrossRef]
- Zhu, S.; Khan, M.A.; Kameda, T.; Xu, H.; Wang, F.; Xia, M.; Yoshioka, T. New insights into the capture performance and mechanism of hazardous metals Cr3+ and Cd2+ onto an effective layered double hydroxide based material. J. Hazard. Mater. 2022, 426, 128062. [Google Scholar] [CrossRef] [PubMed]
- Mao, L.; Zhang, P.; Ju, H.; Zhou, X.; Xue, Z.; Wang, C.; Sun, J.; Jia, Y.; Shao, F.; Zou, X.; et al. Solvent extraction for lithium isotope separation by 4-NO2-B15C5/[BMIm][NTf2] system. J. Mol. Liq. 2022, 367, 120357. [Google Scholar] [CrossRef]
- Zhang, T. The adsorption of rate earth ions on the surface of kaolin and the effect of organic acid on it: A DFT study. Master’s Thesis, Jiangxi University of Science and Technology, Ganzhou, China, 2020. [Google Scholar]
- Nie, Z.; Ma, L.; Xi, X.; Guo, F.; Nie, Z. Studying the leaching mechanism of spent SCR catalyst with different leaching agents (NaOH, H2SO4, HCl and HNO3) using DFT calculations. Appl. Surf. Sci. 2022, 584, 152577. [Google Scholar] [CrossRef]
- Zhu, S.; Xia, M.; Chu, Y.; Khan, M.A.; Lei, W.; Wang, F.; Muhmood, T.; Wang, A. Adsorption and Desorption of Pb(II) on l -Lysine Modified Montmorillonite and the simulation of Interlayer Structure. Appl. Clay Sci. 2019, 169, 40–47. [Google Scholar] [CrossRef]
- Chen, Z.; Ye, G.; Xiang, P.; Tao, Y.; Tang, Y.; Hu, Y. Effect of activator on kinetics of direct acid leaching of vanadium from clay vanadium ore. Sep. Purif. Technol. 2022, 281, 119937. [Google Scholar] [CrossRef]


Publisher’s Note: MDPI stays neutral with regard to jurisdictional claims in published maps and institutional affiliations. |
© 2022 by the authors. Licensee MDPI, Basel, Switzerland. This article is an open access article distributed under the terms and conditions of the Creative Commons Attribution (CC BY) license (https://creativecommons.org/licenses/by/4.0/).