Abstract
Raw coffee beans are seen as valuable sources of bioactive compounds, such as alkaloids and chlorogenic acids. In this study, an efficient and eco-friendly method for the simultaneous extraction of caffeine, trigonelline, and chlorogenic acids from raw beans of two coffee species was developed, using green solvents and an unconventional method of extraction (assisted by ultrafast rotary disintegrator/homogenizer (UT-AE)). The experimental extraction conditions were optimized according to a completely randomized design (CRD), considering the following variables: solvent type (four deep eutectic solvents (DESs), water, and aqueous choline chloride solution (50 wt.%); temperature (25, 45, and 65 °C); and extraction technique (solid-liquid extraction with agitated heating and assisted by ultrafast rotary disintegrator/homogenizer). The extract obtained with choline chloride solution (50 wt.%) exhibited high total phenolic compounds and the highest antioxidant capacity. An analysis using high-performance liquid chromatography with a diode array detector (HPLC-DAD) indicated the presence of chlorogenic acids, caffeine, and trigonelline in all the extracts, in different amounts. The results obtained by the analysis of phenolic compounds and HPLC indicated that the aqueous solution of choline chloride (50% wt.%) was the most suitable solvent for the extraction of chlorogenic acids, while the water-based extracts showed high values of caffeine and trigonelline. DESs, in turn, seems to promote a protective effect on the antioxidant activity of biomolecules.
1. Introduction
Coffee is currently ranked as the second highest commodity traded internationally, after petroleum [1]. Although the main marketing route of coffee beans is beverage production, there is growing interest in the bioactive compounds in raw coffee beans [2]. The two most valuable coffee varieties are Coffea arabica and Coffea canephora, which are highly valued due to their economic and commercial importance. These species exhibit distinct chemical compositions, especially concerning the contents of alkaloids (caffeine and trigonelline) and chlorogenic acids [3].
Caffeine is a heat-stable methylxanthine that causes stimulation of the central nervous system, and it is widely consumed as a psychoactive substance [4,5]. In addition to caffeine, another alkaloid found in raw coffee beans is trigonelline [6,7]. During the roasting process, this alkaloid changes to volatile compounds (methylpyridinium and nicotinic acid), contributing to the aroma fraction of the coffee [8]. Trigonelline also plays an outstanding role in the central nervous system, exhibiting anti-migraine, antibacterial, antiviral, and antitumor activities [6].
Epidemiological studies have indicated that among the beverages commonly consumed, coffee has exceptional antioxidant activity, which is associated with the high content of chlorogenic acids in its composition [9,10]. The outstanding properties of chlorogenic acids include hepato-protective, anti-inflammatory, antiviral, antimicrobial, anti-diabetic, and anti-hypertensive activities [1,11].
As previously described, chlorogenic acids and alkaloids have a range of beneficial activities for human health. However, to employ these bioactive compounds efficiently and widely, the application of suitable extraction methods and compatible solvents is required. Conventional organic solvents (e.g., methanol, ethanol, acetone, and chloroform) are known to produce toxic residual compounds and to decrease the extract quality. Therefore, the replacement of these solvents for green, biodegradable, low toxic, and biocompatible alternatives is necessary [12,13].
For this purpose, DESs have been extensively applied in the extraction of bioactive compounds from several matrices. The main advantages of these solvents are nontoxicity (or low toxicity), simple preparation, low cost, and the capability to tune their physical-chemical properties [14]. The solvent designer ability of a DES is related to the selection of its forming compounds, since DESs are mixtures composed of a hydrogen bond acceptor (HBA), such as a quaternary ammonium salt, complexed by hydrogen bonds with a hydrogen bond donor (HBD), such as an amide, amine, alcohol, or carboxylic acid [15].
Extraction assisted by the ultrafast rotary disintegrator/homogenizer (UT-AE) method has been demonstrated to be a promising alternative for the extraction of bioactive compounds from natural matrices, enabling a substantial decrease in extraction time, solvent consumption, and energy expenditure [16]. Therefore, the employment of green designer solvents such as the DESs in unconventional extraction methods (e.g., UT-AE) makes it possible to increase the extraction efficiency (EE) and to potentialize the applications of plant-based extracts since the process acquires an eco-friendly status [17].
In view of the beneficial physiological effects associated with the bioactive compounds present in raw coffee beans, the aim of this study was to develop a biocompatible and efficient method for the simultaneous extraction of trigonelline, caffeine, and chlorogenic acids present in raw C. arabica and C. canephora beans. Thus, a range of choline chloride-based DESs were evaluated combined with the UT-AE method. In addition, an aqueous choline chloride solution and pure water were also applied as solvents. The extraction conditions were optimized by means of a completely randomized experimental design (CRD). The extraction performance was evaluated based on the total phenolic compounds (TPC), antioxidant activity (2,8-diphenyl-1-picrylhydrazyl (DPPH); ferric reduction antioxidant power (FRAP); and levels of caffeine, trigonelline, and chlorogenic acid high-performance liquid chromatography analysis (HPLC).
2. Materials and Methods
2.1. Coffee Samples
The samples of raw Coffea arabica beans were obtained from a local coffee shop (Café do Mercado) in Curitiba (Paraná State, Brazil). Raw Coffea canephora beans were acquired from the Cooxupé Cooperative, located in the Guaxupé Municipality, in Minas Gerais, Brazil. The coffee beans were authenticated by the Cooxupé cooperative (Cidade de Guaxupé, MG, Brazil). Only coffee cherries ripened were collected.
The raw beans were previously immersed in liquid nitrogen. Subsequently, each sample was ground in a knife mill (MR 320, Requipal, Curitiba, Brazil), sieved using a 20-mesh screen, and vacuum-packed in the absence of light for 30 days. The physical-chemical characterization of the raw coffee beans was performed using a standard procedure (IAL, 2008; AOAC, 2005). The detailed experimental procedures and the results of the physical-chemical characterizations are available in the Supplementary Material, cf. Figure S1.
2.2. Chemicals
The preparation of the DESs was based on the following compounds: choline chloride (purity ≥ 98%), purchased from Inlab (São Paulo, Brazil); glycerol (purity ≥ 99%), lactic acid (purity ≥98%), acetic acid, and 1.2-propanediol (purity ≥ 99%), obtained from Sigma-Aldrich (São Paulo, Brazil); and xylose (purity ≥ 98%), obtained from Dinâmica (Indaiatuba, Brazil).
The chemicals used in the analytical procedures and for the standard solutions were as follows: Folin-Ciocalteu reagent, quercetin (purity ≥ 99%), 2,4,6-tris(2-pyridyl)-s-triazine (purity ≥ 98%), trolox (purity ≥ 97%), 2,2-diphenyl-1-picryl-hydrazyl, ferric chloride (purity ≥ 97%), gallic acid (purity ≥ 98%), aluminum chloride (purity ≥ 99%), potassium acetate (purity ≥ 99%), all obtained from Sigma-Aldrich (São Paulo, Brazil); sodium carbonate (purity ≥ 99%), purchased from Nuclear; ethanol (purity ≥ 99.5%), purchased from Panreac (Barcelona, Spain); anhydrous sodium acetate (purity ≥ 99%), obtained from Dinâmica (Indaiatuba, Brazil); and monobasic sodium phosphate (purity ≥ 98%), obtained from Neon (São Paulo, Brazil).
2.3. DES Preparation
Preparation of the DESs employed the heating method proposed by Dai et al. (2013), [18] where the HBA and HBD were weighed and mixed, according to a pre-established molar ratio. Then, the mixture was subjected to heating, with continuous stirring, in a Dubnoff bath (Ethik Technology), until the formation of a homogeneous and transparent liquid. For alcohols or lactic acid as HBD, the bath temperature was set at 50 °C, while for a sugar-based DES, the temperature was 70 °C. The molecular structures of the HBA and HBD used in the composition of the DESs, as well as the logarithmic n-octanol/water partition coefficients (log K(ow)) of each compound, can be seen in Figure 1. The HBA: HBD molar ratios were 1:2 for choline chloride with lactic acid (CCLA), 1,2-propanediol (CCP), or glycerol (CCGY), and 2:1 for choline chloride with xylose (CCXY).
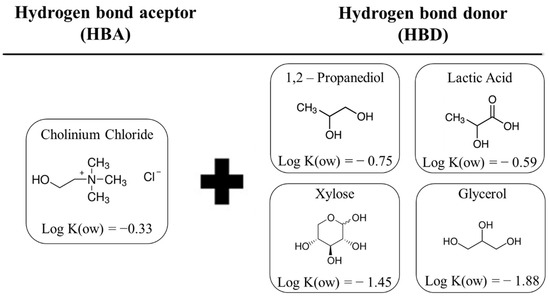
Figure 1.
Molecular structures of the HBA and HBD used in the composition of the DES, together with the logarithmic n-octanol/water partition coefficients (log K(ow)).
2.4. Optimization of Extraction Conditions by Experimental Design
A CRD was applied to optimize the solid–liquid extraction (SLE) of the bioactive compounds from C. arabica raw coffee beans. Thus, the CRD considered three variables: extraction method (conventional magnetic stirring, i.e., MS-AE and UT-AE), solvent (DES, water, and an aqueous solution of choline chloride 50 wt.% [19]), and temperature (25, 45, and 65 °C). Thereby, 36 treatments were performed in duplicate, totaling 72 assays.
Subsequently, for the SLE of C. canephora bioactive compounds, the conditions that showed the lowest yields for C. arabica were excluded from the CRD. Therefore, the extraction temperatures evaluated were 45 °C and 65 °C, and the DES-based solvents CCXY and CCGY were excluded from the CRD. The extraction techniques remained the same (i.e., MS-AE and UT-AE). In addition, two replicates of the central point in the experiments were added, totaling 32 assays.
The EE of the bioactive compounds from both raw coffee beans was evaluated through TPC, antioxidant activity (DPPH and FRAP), and HPLC analysis. Moreover, to investigate the interactions among the three CRD variables, the response surface methodology (RSM) was applied.
2.5. Solid–Liquid Extraction (SLE)
MS-AE was performed for 60 min, under constant stirring, in glass-lined cells connected to a circulating water bath with temperature control. The sample/solvent ratio used was 1:20 m/v. In the UT-AE (Ultra-Turrax® Model T25, IKA, Staufen, Germany), the samples were submitted to intense agitation (13,000 rpm) for 10 min while connected to a circulating water bath with temperature control. The UT-AE was carried out through the same conditions as the MS-AE concerning the sample preparation and the solid/liquid ratio.
2.6. Evaluation of Raw Coffee Bean Extracts
For all the analyses (TPC, antioxidant activities, and HPLC), the extracts were centrifuged at 1200 rpm for 15 min (Heraeus Fresco 21, Thermo Scientific, Waltham, MA, USA). The suspensions were collected and stored until the time of analysis. For the HPLC analysis, the suspension was filtered through 0.22 µm filters.
2.7. TPC and Chemical Antioxidant Activity of the Extracts
The concentration of TPC in the raw coffee bean-based extracts was measured using the Folin–Ciocalteu method proposed by Singleton and co-workers [20]. The DPPH (2,8-diphenyl-1-picrylhydrazyl) method and the ferric reduction antioxidant power (FRAP) assay were employed to evaluate the antioxidant activity. Therefore, the DPPH analyses were performed according to the method by Brand-Williams and co-workers [21], which is based on the capture of the organic radical; the FRAP assay was performed as proposed by Benzie and Strain [22], with some modifications.
Further details about the described assays are available in Figure S1 (Supplementary Material). All the analyses were performed in triplicate, and the results were expressed as mean ± standard deviation.
2.8. Extract Composition Profiles Determined by High-Performance Liquid Chromatography (HPLC)
The identification and quantification of caffeine, trigonelline, and chlorogenic acids were performed by liquid chromatography with a diode array detector (HPLC-DAD, model Dionex UltiMate 3000, Thermo Scientific, Germany,). For both analysis, an ACE 5 C18 column (250 mm × 4.6 mm i.d; 2.6 µm) kept at 25 °C was used.
The determination of caffeine and trigonelline employed the methodology proposed by Toci et al. [23], with some modifications. The chromatographic conditions were as follows: injection volume of 100 µL, the mobile phase was methanol (phase A) and ultrapure water (phase B) at a flow rate of 1.0 mL.min-1, the elution program was from 5% of A (3 min) to 15% A (3 min) to 25% A (3 min) to 35% A (3 min) to 40% A (3 min). The DAD detector was programmed for acquisition from 200 to 700 nm, and the quantification was performed at wavelengths of 272 and 265 nm for caffeine and trigonelline, respectively.
The determination of chlorogenic acids employed the methodology proposed by Trugo and Macrae [24] with some modifications. The chromatographic conditions were as follows: injection volume of 100 µL, the mobile phase was 0.01 M trisodium citrate buffer solution with pH adjusted to 2.5 (phase A) and methanol (phase B) at a flow rate of 1.0 mL.min−1, the elution program was from 100% A (19 min) to 80% A (10 min.) to 60% A to 100% A (5 min). The DAD detector was programmed for acquisition from 200 to 700 nm. The quantification was performed at a wavelength of 360 nm, as shown in Figure S2.
Quantification of chlorogenic acid isomers was achieved by comparing the peak areas of the components of interest with a calibration curve obtained using 5-CQA as an external standard. Each isomer could be quantified individually according to the molar extinction coefficients (ε) reported in the literature, using Equation (1) [24]. The following groups of chlorogenic acids isomers were quantified: three caffeoylquinic acid isomers with caffeoyl groups in positions 3, 4, and 5; three dicaffeoylquinic acid isomers with caffeoyl groups in positions 3, 4-, 3, 5-, and 4, 5; and a feruloylquinic acid isomer:
where RF is the response factor established for 5-CQA, ε1 is the molar absorptivity of 5-CQA (1.95), ε2 is the molar absorptivity of the isomer in question, Mr1 is the relative molecular mass of 5-CQA (354.32 μg/mL), Mr2 is the relative molecular mass of the isomer in question, and A is the area for the target isomer.
2.9. Statistical Analysis
Statistical analyses were performed using the Statistica v. 10.0 software (StatSoft, Tulsa, OK, USA). The hypothesis of normality was assessed using the Shapiro–Wilk test (p ≥ 0.05), followed by homoscedasticity determination using the Bartlett test. Subsequently, comparison of the means was performed using one-way ANOVA and the Tukey post hoc test (p ≥ 0.05).
3. Results and Discussion
3.1. Optimization of Extraction Conditions by Experimental Design
The SLE can be affected by multiple parameters, independently or interactively, such as temperature, time, solvent, and the extraction technique choice. However, in addition to promoting high levels of extraction of the target compounds, it is required that the SLE can maintain the bioactive compounds’ functionalities. Hence, a CRD was employed to maximize the EE and to preserve the bioactive compounds’ activities in the raw coffee bean extracts. Thereby, the CRD made it possible to evaluate the influence of the parameters (temperature, solvent, and technique) in the extraction performance and also afforded a better understanding of the interactions between the independent variables and the composition of the extracts. The results of both raw coffee bean extracts in terms of TPC and antioxidant activity (DPPH and FRAP) are available in Table 1 and Table 2.

Table 1.
TPC and antioxidant activities (DPPH and FRAP) obtained for the conventional (MS-AE) and unconventional (UT-AE) extraction methods from Coffea arabica.
Table 2.
TPC and antioxidant activities (DPPH and FRAP) obtained for the conventional (MS-AE) and unconventional (UT-AE) extraction methods from Coffea canephora.
3.2. TPC Content
According to Table 1, the optimal extraction condition of TPC from raw C. arabica beans was at 65 °C through the MS-AE technique and with the aqueous solution of ChCl 50 wt.% as the solvent. Ueda and co-workers [19] previously described the 50 wt.% aqueous solution of choline chloride as the potential extraction media for bioactive compounds. For raw C. canephora bean extraction (Table 2), the optimized SLE condition was achieved at the same temperature with the UT-AE technique and using the same solvent. In addition, the CRD results of TPC extraction from both raw coffee bean samples are demonstrated in Figure 2a,b.
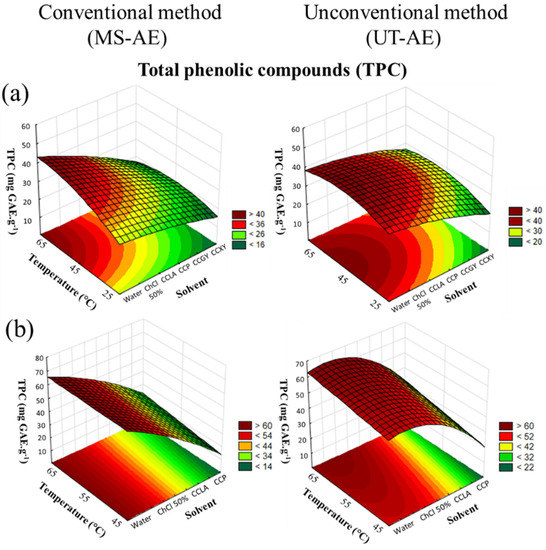
Figure 2.
3D surface plots of TPC content (mg GAE g−1) from (a) Coffea arabica and (b) Coffea canephora, as a function of temperature (°C), solvent, and extraction technique.
As depicted in Figure 2a,b, the CRD results from both raw coffee bean samples showed that the three variables evaluated significantly affected the SLE, especially the solvent choice (p < 0.05). Concerning the interactions between the three variables (Table S2), for C. arabica, only the interaction between the choice of the solvent and the extraction technique was statistically significant. For the SLE of C. canephora bioactive compounds (Figure 2b), the interactions between temperature and solvent and between temperature and technique showed the existence of a significant dependence between the variables in terms of TPC content. More details about the ANOVA results are provided in the Supplementary Material, cf. Tables S2 and S3.
Concerning the extraction techniques, for the SLE of the C. arabica species, the UT-AE boosted the EE for most the extracts, except for the solvent aqueous solution of ChCl 50 wt.% and water (Table 1). For the TPC extraction of C. canephora species (Table 2), the SLE was positively affected by the UT-AE technique considering all the obtained extracts. This result could be related to the high-speed shearing homogenization promoted by the ultrafast rotary disintegrator/homogenizer equipment, which contributed to enhance the mass transfer process. In addition, the SLE efficiency and selectivity were strongly affected by the samples particle size [24]. Thus, the UT-AE technique can simultaneously break the matrix cell walls and extract the bioactive compounds from a wide range of plant materials [16,25]. Moreover, the UT-AE technique reduces the extraction time, which is beneficial for the process since long extraction periods can lead to the degradation of valuable bioactive compounds.
Related to the temperature influence in the SLE, the TPC content increased with an increase in temperature. This positive effect occurred due to a reduction in the solvent viscosity, which favored the mass transfer process and the solubility of the bioactive compounds available in the raw coffee bean samples to the solvent [26,27,28,29]. In addition, the temperature impact in the SLE was more evident in the DES-based extracts, which presented an elevated viscosity.
For both raw coffee bean species, the aqueous solution of ChCl 50 wt.% promoted the highest total polyphenolic content. Furthermore, the maximum TPC values for C. arabica (Table 1) were 46.5 ± 2.2 and 54.6 ± 1.4 mg GAE g−1, and for C. canephora (Table 2) they were 68.9 ± 0.9 and 57.7 ± 0.2 mg GAE. g−1, with UT-AE and the MS-AE techniques, respectively. For the SLE carried out with water as a solvent, the TPC values for C. arabica (Table 1) were 36.94 ± 0.04 and 40.3 ± 6.7 mg GAE g−1, and for C. canephora (Table 2) they were 62.4 ± 0.4 and 61.4 ± 0.5 mg GAE g−1, with UT-AE and the MS-AE techniques, respectively. Thus, these results indicated that in most cases the presence of choline chloride boosted the extraction of polyphenols from the raw coffee beans samples.
As reported by Oliveira and co-workers [30], green solvents such as aqueous solutions of choline chloride presented the ability to increase the solubility of some compounds. According to the authors, the solubility of curcumin and gallic acid, which are bioactive compounds, are positively affected by the presence of an additive. Additionally, gallic acid is a phenolic acid that is widely found in natural matrices, which belongs to the same group of the majority of the bioactive compounds available in raw coffee beans samples, such as the chlorogenic acids [1]. Therefore, it can be assumed that the presence of choline chloride in the SLE enhances the EE of phenolic compounds from C. arabica and C. canephora.
Concerning the DES-based extractions, a substantial variance in the TPC values was observed. For the SLE of C. arabica bioactive compounds, the CCP-based DES provided the maximum EE of TPC, displaying the yields of 37.4 ± 6.3 mg GAE g−1 with the UT-AE technique. Furthermore, the raw coffee bean extracts obtained with the CCXY-based DES and employing the MS-AE technique showed limited capacity to extract the bioactive compounds according to the TPC assay, displaying a maximum yield of 17.3 ± 0.3 mg GAE g−1. This outcome could be explained by the high viscosity of xylose which reduces the EE. Sugar-based DESs are particularly known for their high viscosity, which occurs due to the large number of hydroxyl groups available in the sugar molecules that boost the formation of hydrogen bonds with the HBA [14,18].
For the SLE of C. canephora bioactive compounds, the CCLA-based DES was capable of enhancing the EE, reaching a maximum value of 47.8 ± 1.4 mg GAE. g−1 through the UT-AE technique. This finding can be correlated to the high solute-solvent affinity between the polyphenols in the raw coffee bean samples and the CCLA. In sequence, the 1,2-propanediol-based DES was able to reach a maximum TPC value of 43.1 ± 1.4 mg GAE. g−1 under the application of the UT-AE technique.
As regards previous works involving the extraction of bioactive compounds from raw coffee bean species, Cheong et al. [31] obtained a maximum TPC value of 53.76 mg GAE. g−1 from the SLE of raw C. arabica beans with a ternary mixture (acetone-methanol-water) as the solvent and under the Soxhlet extraction method. In contrast to the authors’ findings, this work demonstrated the promising potential of employing biocompatible, green, and design solvents, such as an aqueous solution of choline chloride 50 wt.% and the DESs in the SLE, since they can provide equal or a higher yield of TPC. Hečimović et al. [32] investigated the extraction of C. Canephora bioactive compounds employing water as the solvent and the conventional stirring method at 100 °C. As a result, the authors obtained lower TPC content than the present work, reaching a maximum value of 42.37 mg GAE. g−1.
3.3. Chlorogenic Acids, Caffeine, and Trigonelline Contents
The bioactive compounds (chlorogenic acids, caffeine, and trigonelline) that were identified in the raw C. arabica and C. canephora bean extracts are listed in Table 3 and Table 4.
Table 3.
Contents of CGAs, caffeine, and trigonelline obtained using the conventional (MS-AE) and unconventional (UT-AE) methods of extraction. The results are expressed on a dry mass basis (mg 100g−1) from Coffea arabica.
Table 4.
Contents of CGAs, caffeine, and trigonelline obtained using the conventional (MS-AE) and unconventional (UT-AE) methods of extraction. The results are expressed on a dry mass basis (mg 100g−1) from Coffea canephora.
3.3.1. Chlorogenic Acids
As demonstrated in Table 3 and Table 4, the optimal extraction condition of total CGA compounds from raw C. arabica and C. canephora beans was at 65 °C, through the UT-AE technique, and employing the aqueous solution of ChCl 50 wt.% as the solvent. According to the CRD results (Figure 3a,b), for both raw coffee bean species, the extraction of the chlorogenic acids (CGAs) was significantly affected by solvent choice and temperature variation (p < 0.05).
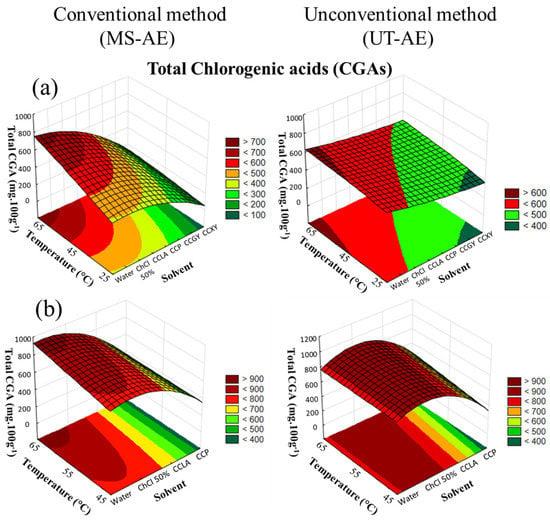
Figure 3.
3D surface plots of total chlorogenic acids (CGAs) (mg 100g−1) from (a) Coffea arabica and (b) Coffea canephora as a function of temperature (°C), solvent, and extraction technique.
For the SLE of C. arabica species (Figure 3a), the extraction technique, solvent choice and temperature rise significantly affected the extraction process (p < 0.05), and all the interactions among the variables exhibited a substantial impact on the CGAs extraction. Furthermore, for the SLE of C. canephora bioactive compounds (Figure 3b), an increase in temperature did not substantially influence the EE of CGAs (p > 0.05). Regarding the interactions among the variables (temperature, solvent, and technique), there was no significant dependence between the variables concerning the CGA content obtained through the extraction process (data available in Supplementary Material, cf. Tables S4 and S5).
The highest yields of total CGA content extracted from C. arabica were achieved through the UT-AE technique with the aqueous solution of ChCl 50 wt.%, followed by the SLE carried out with water as the solvent and and following the MS-AE technique. For the obtention of the CGAs from the C. canephora species (Table 4), the UT-AE technique improved the SLE of most the raw coffee bean-based extracts, except for the extraction with water as the solvent. Overall, these results indicated that UT-AE employment positively affects the EE of the CGAs in the majority of the raw coffee bean-based extracts.
Regarding the temperature effect on extraction capacity, an increase in temperature enhanced the total CGA content in both raw coffee bean extracts under the MS-AE and UT-AE techniques. In addition, as previously observed in the extraction of TPC from C. arabica and C. canephora, this promising effect of temperature was particularly observed for the DES-based extracts due to the reduction in their high viscosity. Sato et al. [33] applied hydrothermal extraction to obtain bioactive compounds (caffeoylquinic acids (CQAs), phenolics, melanoidin, and caffeine) from raw C. arabica beans. The authors observed the same positive effect of increased temperature as in the present work.
The CGA extraction from C. arabica and C. canephora species was substantially increased with the aqueous solution of ChCl 50 wt.% as the solvent, reaching maximum values with the UT-AE method and at 65 °C. For the C. arabica species, the highest yield of total CGAs was 821.14 ± 0.01 mg 100g−1, and for C. canephora, the highest yield was 996.5 ± 0.3 mg 100g−1 (Table 3 and Table 4). In addition, this solvent also promoted the highest extraction capacity of the 5-ACQ isomer in both raw coffee bean samples. Subsequently, the SLE conducted with water was the second most efficient solvent to extract total CGAs from both raw coffee bean samples through the MS-AE technique, reaching amounts of 811.9 ± 0.2 mg 100g−1 and 923.5 ± 0.2 mg 100g−1 for C. arabica and C. canephora, respectively (Table 3 and Table 4).
It is well-known that the physical-chemical properties of the solvent will affect the EE of targeted bioactive compounds. Thereby, for both raw coffee bean species, the SLE conducted with the DES evaluated was capable of extracting the CGAs from the matrices. However, for the CGA extraction from the C. arabica and C. canephora samples (Table 3 and Table 4), the most suitable DES-based solvents were CCP (606.43 ± 0.01 mg 100g−1) and CCLA (702.9 ± 0.5 mg 100g−1), respectively. These results were obtained at 65 °C and through the MS-AE technique for the C. arabica species and the UT-AE technique for the C. canephora species. Therefore, the choice of DES-forming compounds (HBA and HBD) plays a crucial role in the extraction yield.
Concerning C. arabica CGA extraction, the CCXY-based SLE displayed the lowest extraction capacity as compared with the other DESs through the MS-AE technique at 65 °C (Table 3). This outcome is a consequence of the high viscosity of sugar-based DESs. As a result, the mass transfer process between the solute and the solvent was negatively affected. Additionally, as reported by Yoo et al. [14], the DES HBD-forming compound choice considerably influences the EE of chlorogenic acids from spent coffee grounds. The authors evaluated DESs composed of choline chloride as the HBA and amines, alcohols, acids, and sugars as the HBDs. According to their findings, the sugar-based DESs also promoted the lowest yields, indicating the viscosity influence in the extraction process.
Considering previous research, Syakfanaya et al. [34] employed DESs based on betaine as the HBA, and sorbitol and urea as the HBDs, in the SLE of caffeine, and CGA from raw C. canephora beans. Their results showed that the maximum CGA yield was obtained with the DES composed of betaine/sorbitol (1:2), reaching an amount of 1.35 g 100g−1 CGA. This value is substantially inferior to the results obtained by the present work comparing the DES evaluated. Therefore, the choline chloride as the HBA proved to be more suitable than betaine in the extraction of CGAs from raw coffee bean samples.
3.3.2. Alkaloids: Caffeine and Trigonelline
As can be seen in Table 3 and Table 4, the alkaloids trigonelline and caffeine were identified in all the obtained extracts considering both raw coffee bean species. The C. canephora extracts exhibited the highest caffeine amounts (239.4 ± 0.5 mg 100g−1), whereas the C. arabica extracts displayed the highest trigonelline contents (201.1 ± 0.3 mg 100g−1) through the optimal extraction condition (i.e., MS-AE, at 65 °C, with water as the solvent). The caffeine and trigonelline quantities in raw coffee beans are essentially influenced by several factors such as variety; genetic, environmental and climatic aspects; and postharvest conditions [35].
The CRD results showed that for the SLE of C. arabica (Figure 4a), all variables analyzed significantly influenced the caffeine extraction (p < 0.05). For the extraction of caffeine from C. canephora (Figure 4b), the technique did not considerably impact the SLE (p > 0.05).
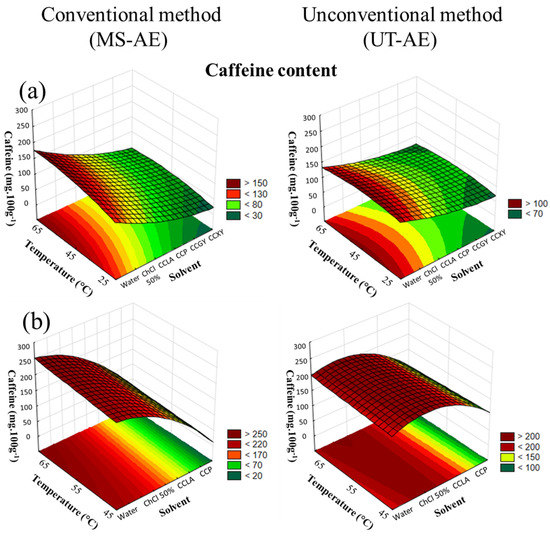
Figure 4.
3D surface plots of caffeine content (mg 100g−1) from (a) Coffea arabica and (b) Coffea canephora as a function of temperature (°C), solvent, and extraction technique.
For both raw coffee bean species (Figure 4a,b), the solvent choice displayed a superior impact on the extraction, followed by an increase in temperature. Regarding the interactions among the variables, the solvent–technique interaction showed a significant dependence for C. arabica and C. canephora, being the most substantial interaction noticed (data available in Supplementary Material, cf. Tables S6 and S7).
The CRD results of trigonelline extraction from C. arabica and C. canephora species are available in Figure 5a,b.
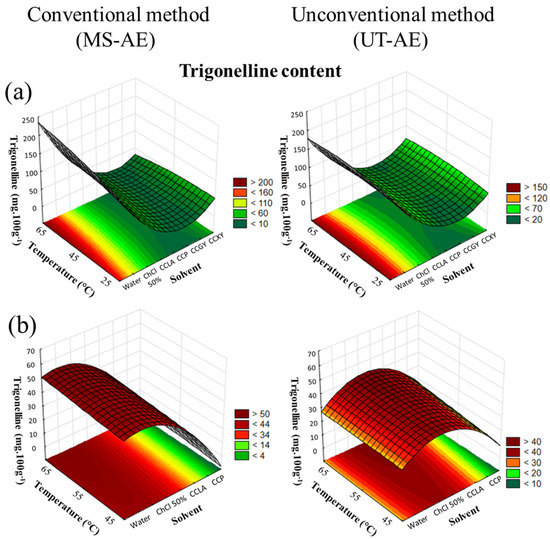
Figure 5.
3D surface plots of trigonelline content (mg 100g−1) from (a) Coffea arabica and (b) Coffea canephora as a function of temperature (°C), solvent, and extraction technique.
According to Figure 5a, the SLE of trigonelline from C. arabica species was significantly affected by the solvent choice and temperature (p < 0.05). Related to the interactions among the variables, the solvent–temperature and the solvent–technique interactions presented a substantial effect on the trigonelline extraction. For the C. canephora species (Figure 5b), the SLE of trigonelline was substantially influenced by the solvent choice and the extraction technique (p < 0.05). Concerning the interactions evaluated in the CRD, the solvent–temperature interaction promoted a significant effect on SLE (data available in Supplementary Material, cf. Tables S8 and S9).
As previously observed for CGA extraction, an increase in temperature also promoted the enhancement of the EE of caffeine and trigonelline from both raw coffee bean samples. Nevertheless, caffeine is available in raw C. arabica and C. canephora beans in the coffee silverskin (i.e., a thin seed skin that covers the green coffee bean) and in the matrix cell walls. Thus, the caffeine in the silverskin can be easily accessed through low temperatures due to the high mass transfer, as can be seen in Table 3 and Table 4, at 25 °C. However, the caffeine found in the coffee beans’ cell walls is attached to the CGAs and other compounds, resulting in the formation of insoluble oligomeric structures. Hence, increased extraction temperature promoted cell walls breakage, which boosted the extraction of caffeine [36,37].
Concerning solvent choice, since both alkaloids are hydrophilic molecules, the SLE carried out with water boosted the EE. These results indicate that the choline chloride presence did not positively affect the extraction process of caffeine and trigonelline. In addition, as reported by Oliveira et al. [30], the authors noticed the same behavior for caffeine solubility. Thus, considering that caffeine is a hydrophilic molecule, the presence of the additive (ChCl) is supposed to compete with caffeine in forming hydrate complexes with water. Therefore, the caffeine solubility in water is reduced by the additive, as can be seen in Table 3 and Table 4.
For the SLE conducted with DESs, the extraction of caffeine from C. arabica and C. canephora reached maximum yields with CCLA as the solvent. This result can be associated with the hydrophobicity of the HBDs employed in the DES preparation and the target bioactive compound. Therefore, the caffeine logarithm of the octanol/water partition (Log KOW) is similar to the lactic acid (−0.55 and −0.72, respectively). Overall, this similarity between the solute and the DES-forming compound Log KOW indicated that the EE is enhanced with lactic acid as the HBD. Nevertheless, the HBD choice did not influence the SLE process of trigonelline. Thus, for C. arabica, similar yields were found with CCLA and CCXY, while for C. canephora, CCPA and CCP promoted almost the same EE (Table 3 and Table 4). These results indicated that for DES-based SLE, other variables such as the temperature and extraction technique had a greater influence on the extraction process.
3.4. Antioxidant Activity (DPHH and FRAP)
The antioxidant activities of C. arabica and C. canephora through the DPPH and FRAP assay are available in Table 1 and Table 2. Thus, based on the obtained results, for the antioxidant activity of C. arabica bioactive compounds, the optimal condition was achieved through the MS-AE technique, employing the aqueous solution of ChCl 50 wt.% as the solvent and at 65 °C. In addition, the same temperature provided the greatest capacity to preserve the bioactive compounds from C. canephora samples. Nevertheless, for C. canephora extraction, the UT-AE technique made it possible to increase this antioxidant capacity. In relation to the solvent influence, water and the aqueous solution of ChCl 50 wt.% displayed similar outcomes.
According to the CRD results, concerning both antioxidant activity assays and for both raw coffee bean species, the solvent choice was the variable that had more influence on the SLE (Figure 6 and Figure 7).
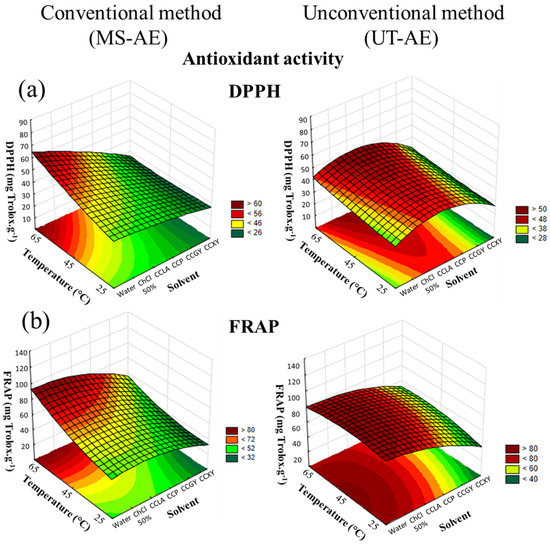
Figure 6.
3D surface plots of Coffea arabica antioxidant activity according to (a) DPPH and (b) FRAP assay (mg Trolox g−1) as a function of temperature (°C), solvent, and extraction technique.
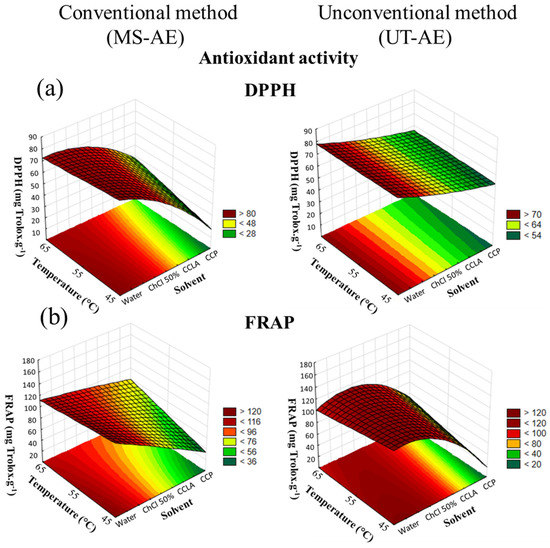
Figure 7.
3D surface plots of Coffea canephora antioxidant activity according to (a) DPPH and (b) FRAP assay (mg Trolox g−1) as a function of temperature (°C), solvent, and extraction technique.
Regarding the interactions among the variables through the FRAP assay, none of the interactions analyzed had a significant role in the C. canephora bioactive compounds extraction process (Figure 7). However, for the SLE of C. arabica (Figure 6), the temperature–technique interaction showed significant dependence. With regard to the DPPH assay, the interactions between solvent and technique, and between temperature and technique exhibited substantial dependence in the C. canephora extraction process (p < 0.05), and for C. arabica, the only significant interaction effect was between temperature and technique (p < 0.05) (data available in Supplementary Material, cf. Tables S10–S13).
Overall, the antioxidant activity of the C. arabica and C. canephora extracts is related to the TPC, total CGAs, and caffeine and trigonelline contents. Thus, temperature rise was a variable that positively affected all the analyses employed at the optimal extraction condition, including the antioxidant activity measured by the DPPH and FRAP assays. In addition, for the C. arabica-based extracts, the extraction technique that boosted the capacity to preserve the bioactive compounds was the MS-AE. This technique also increased the TPC, as well as caffeine and trigonelline extraction. In contrast, the most suitable method that was able to maintain the bioactive compounds from the C. canephora species was the UT-AE method. This outcome was also noticed for the SLE of TPC and CGAs.
Relate to the extraction processes carried out with DES-based solvents, the capacity to preserve the bioactive compounds from the C. arabica species was improved with CCP as the solvent. In addition, according to the FRAP assay (Table 1), this solvent promoted a similar antioxidant activity as comparing with the SLE conducted with water as the solvent at the optimal extraction condition (65 °C and with the MS-AE technique). This result demonstrated that, even though water and the aqueous solution of ChCl 50 wt.% as the solvents enabled more efficient extraction of the bioactive compounds from the C. arabica species, DES-based solvents exhibited a comparable capacity to preserve these target compounds. Thus, the hydrogen bond formation between DES-forming compounds (HBA and HBD) decreases the solute mobility and oxygen exposition, reducing the oxidative reaction [38]. Furthermore, the FRAP assay (Table 2) also showed that the antioxidant activity of C. canephora extracts was also boosted with CCP as the solvent at the optimal extraction condition (65 °C and with the UT-AE technique).
4. Conclusions
This work evaluated the effects of different green solvents, temperatures, and extraction techniques for the recovery and preservation of bioactive compounds present in raw coffee bean extracts. The solvent designer ability of the DES and aqueous solutions were evaluated. The use of a choline chloride aqueous solution (50 wt.%) as solvent provided the highest yields in terms of polyphenols, while the use of water provided the highest yields in terms of alkaloids. However, the extracts obtained using these solvents had a lower capacity to maintain the antioxidant activity as compared with the use of DESs.
Three different temperatures (25, 45, and 65 °C) were evaluated, with a higher temperature favoring extraction of the bioactive compounds. Considering the extraction technique, extractions using the UT-AE technique provided fast and efficient recovery of the biocompounds present in the raw coffee beans. All the parameters were evaluated according to a CRD optimization procedure. The results demonstrated the remarkable ability of the designer solvents to extract and preserve the antioxidant activity of bioactive compounds found in raw coffee beans. In addition, the extracts obtained in the present work, which were rich in phenolic compounds and alkaloids, could be used as food additives with antioxidant and psychoactive properties.
Supplementary Materials
The following supporting information can be downloaded at: https://www.mdpi.com/article/10.3390/separations9120423/s1, Physicochemical Analyses description; Table S1. Raw coffee bean (C. arabica and C. canephora) physiochemical composition; Table S2. Analysis of variance (ANOVA) regarding the content of total phenolic compounds (TPC) of extracts from Coffea arabica; Table S3. Analysis of variance (ANOVA) regarding the content of total phenolic compounds (TPC) of extracts from Coffea canephora; Table S4. Analysis of variance (ANOVA) of the total chlorogenic acids content of Coffea arabica extracts; Table S5. Analysis of variance (ANOVA) of the total chlorogenic acids content of Coffea canephora extracts; Table S6. Analysis of variance (ANOVA) of the caffeine content of Coffea arabica extracts; Table S7. Analysis of variance (ANOVA) of the caffeine content of Coffea canephora extracts; Table S8. Analysis of variance (ANOVA) of the trigonelline content of Coffea arabica extracts; Table S9. Analysis of variance (ANOVA) of the trigonelline content of Coffea canephora extracts; Table S10. Analysis of variance (ANOVA) regarding antioxidant activity by DPPH assay of Coffea arabica extracts; Table S11. Analysis of variance (ANOVA) regarding antioxidant activity by FRAP assay of Coffea arabica extracts; Table S12. Analysis of variance (ANOVA) regarding antioxidant activity by DPPH assay of Coffea canephora extracts; Table S13. Analysis of variance (ANOVA) regarding antioxidant activity by FRAP assay of Coffea canephora extracts; Figure S1. Evaluation of raw C. arabica and C. canephora bean extracts potential according to total phenolic compounds (TPC) and antioxidant activity (DPPH and FRAP); Figure S2. Chlorogenic acid chromatogram from Coffea arabica extract at 360 nm.
Author Contributions
L.Z.R., conceptualization, investigation, methodology, data curation, writing—original draft; M.A.A., investigation, methodology, data curation, writing—review and editing; K.M.U., investigation, methodology, writing—review and editing; F.C.L., investigation, methodology, writing—review and editing; A.T.T., conceptualization, funding acquisition, project administration, resources, supervision, writing—review and editing; L.I.-M., funding acquisition, resources, writing—review and editing; M.R.M., conceptualization, funding acquisition, project administration, resources, supervision, writing—review and editing; F.O.F., investigation, methodology, writing—review & editing. All authors have read and agreed to the published version of the manuscript.
Funding
This study was financed by the Coordenação de Aperfeiçoamento de Pessoal de Nível Superior—Brasil (CAPES), Finance Code 001. M. R. Mafra and L. Igarashi-Mafra are grateful to the Brazilian National Council for Scientific and Technological Development (CNPq, Grants 315667/2021-4 and 316815/2021-7).
Institutional Review Board Statement
Not Applicable.
Informed Consent Statement
Not Applicable.
Conflicts of Interest
The authors declare that they have no known competing financial interests or personal relationships that could have appeared to influence the work reported in this paper.
References
- Getachew, A.T.; Chun, B.S. Influence of hydrothermal process on bioactive compounds extraction from green coffee bean. Innov. Food Sci. Emerg. Technol. 2016, 38, 24–31. [Google Scholar] [CrossRef]
- Sarraguça, M.C.; Pascoa, R.N.M.J.; Lopo, M.; Sarraguça, J.M.G.; Lopes, J.A. Bioactive Compounds in Coffee as Health Promotors. In Natural Bioactive Compounds from Fruits and Vegetables as Health Promoters Part II; Sarraguca, M.C., Pascoa, R., Lopo, M., Sarraguca, J., Lopes, J.A., Eds.; Bentham Science Publishers: Sharjah, United Arab Emirates, 2016; pp. 180–220. [Google Scholar]
- Babova, O.; Occhipinti, A.; Maffei, M.E. Chemical partitioning and antioxidant capacity of green coffee (Coffea arabica and Coffea canephora) of different geographical origin. Phytochemistry 2016, 123, 33–39. [Google Scholar] [CrossRef] [PubMed]
- Quadra, G.R.; Paranaíba, J.R.; Vilas-Boas, J.; Roland, F.; Amado, A.M.; Barros, N.; Dias, R.J.P.; Cardoso, S.J. A global trend of caffeine consumption over time and related-environmental impacts. Environ. Pollut. 2020, 256, 2016–2021. [Google Scholar] [CrossRef] [PubMed]
- McLellan, T.M.; Caldwell, J.A.; Lieberman, H.R. A review of caffeine’s effects on cognitive, physical and occupational performance. Neurosci. Biobehav. Rev. 2016, 71, 294–312. [Google Scholar] [CrossRef] [PubMed]
- Arai, K.; Terashima, H.; Aizawa, S.I.; Taga, A.; Yamamoto, A.; Tsutsumiuchi, K.; Kodama, S. Simultaneous determination of trigonelline, caffeine, chlorogenic acid and their related compounds in instant coffee samples by HPLC using an acidic mobile phase containing octanesulfonate. Anal. Sci. 2015, 31, 831–835. [Google Scholar] [CrossRef]
- Yisak, H.; Redi-abshiro, M.; Chandravanshi, B.S. Selective determination of caffeine and trigonelline in aqueous extract of green coffee beans by FT-MIR-ATR spectroscopy. Vib. Spectrosc. 2018, 97, 33–38. [Google Scholar] [CrossRef]
- Ky, C.-L.; Louarn, J.; Dussert, S.; Guyot, B.; Hamon, S.; Noirot, M. Caffeine, trigonelline, chlorogenic acids and sucrose diversity in wild Coffea arabica L. and C. canephora P. accessions. Food Chem. 2001, 75, 223–230. [Google Scholar] [CrossRef]
- Pellegrini, N.; Serafini, M.; Colombi, B.; Del Rio, D.; Salvatore, S.; Bianchi, M.; Brighenti, F. Total Antioxidant Capacity of Plant Foods, Beverages and Oils Consumed in Italy Assessed by Three Different In Vitro Assays. J. Nutr. 2003, 133, 2812–2819. [Google Scholar] [CrossRef]
- Monteiro, Â.; Colomban, S.; Azinheira, H.G.; Guerra-Guimarães, L.; Silva, M.D.C.; Navarini, L.; Resmini, M. Dietary antioxidants in coffee leaves: Impact of botanical origin and maturity on chlorogenic acids and xanthones. Antioxidants 2020, 9, 6. [Google Scholar] [CrossRef]
- Naveed, M.; Hejazi, V.; Abbas, M.; Kamboh, A.A.; Khan, G.J.; Shumzaid, M.; Ahmad, F.; Babazadeh, D.; FangFang, X.; Modarresi-Ghazani, F.; et al. Chlorogenic acid (CGA): A pharmacological review and call for further research. Biomed. Pharmacother. 2018, 97, 67–74. [Google Scholar] [CrossRef]
- Barbieri, J.B.; Goltz, C.; Batistão Cavalheiro, F.; Theodoro Toci, A.; Igarashi-mafra, L.; Mafra, M.R.; Batistão, F.; Theodoro, A.; Igarashi-mafra, L.; Mafra, M.R. Deep eutectic solvents applied in the extraction and stabilization of rosemary (Rosmarinus officinalis L.) phenolic compounds. Ind. Crops Prod. 2020, 144, 112049. [Google Scholar] [CrossRef]
- Azmir, J.; Zaidul, I.S.M.; Rahman, M.M.; Sharif, K.M.; Mohamed, A.; Sahena, F.; Jahurul, M.H.A.; Ghafoor, K.; Norulaini, N.A.N.; Omar, A.K.M. Techniques for extraction of bioactive compounds from plant materials: A review. J. Food Eng. 2013, 117, 426–436. [Google Scholar] [CrossRef]
- Yoo, D.E.; Jeong, K.M.; Han, S.Y.; Kim, E.M.; Jin, Y.; Lee, J. Deep eutectic solvent-based valorization of spent co ff ee grounds. Food Chem. 2018, 255, 357–364. [Google Scholar] [CrossRef]
- Martins, M.A.R.R.; Pinho, S.P.; Coutinho, J.A.P.P. Insights into the Nature of Eutectic and Deep Eutectic Mixtures. J. Solut. Chem. 2019, 48, 962–982. [Google Scholar] [CrossRef]
- Xu, W.; Zhai, J.; Cui, Q.; Liu, J.; Luo, M.; Fu, Y.; Zu, Y. Ultra-turrax based ultrasound-assisted extraction of five organic acids from honeysuckle (Lonicera japonica Thunb.) and optimization of extraction process. Sep. Purif. Technol. 2016, 166, 73–82. [Google Scholar] [CrossRef]
- Zhou, P.; Wang, X.; Liu, P.; Huang, J.; Wang, C.; Pan, M.; Kuang, Z. Enhanced phenolic compounds extraction from Morus alba L. leaves by deep eutectic solvents combined with ultrasonic-assisted extraction. Ind. Crops Prod. 2018, 120, 147–154. [Google Scholar] [CrossRef]
- Dai, Y.; Van Spronsen, J.; Witkamp, G.J.; Verpoorte, R.; Choi, Y.H. Natural deep eutectic solvents as new potential media for green technology. Anal. Chim. Acta 2013, 766, 61–68. [Google Scholar] [CrossRef]
- Ueda, K.M.; Ronko, L.Z.; Toci, A.T.; Igarashi-Mafra, L.; Mafra, M.R.; Farias, F.O. Green Designer Solvents for Boosting the Extraction of Biocompounds from Eugenia pyriformis Cambess Leaves. ACS Food Sci. Technol. 2022, 2, 532–540. [Google Scholar] [CrossRef]
- Singleton, V.L.; Rossi, J.A., Jr. Colorimetry of total phenolics with phosphomolybdic-phosphotungstic acid reagents. Am. J. Enol. Vitic. 1965, 16, 144–158. [Google Scholar]
- Brand-Williams, W.; Cuvelier, M.E.; Berset, C. Use of a free radical method to evaluate antioxidant activity. LWT-Food Sci. Technol. 1995, 28, 25–30. [Google Scholar] [CrossRef]
- Benzie, I.F.F.; Strain, J.J. The ferric reducing ability of plasma (FRAP) as a measure of “antioxidant power”: The FRAP assay. Anal. Biochem. 1996, 239, 70–76. [Google Scholar] [CrossRef] [PubMed]
- Toci, A.; Farah, A.; Trugo, L.C. Efeito do processo de descafeinação com diclorometano sobre a composição química dos cafés arábica e robusta antes e após a torração. Quim. Nova 2006, 29, 965–971. [Google Scholar] [CrossRef]
- Trugo, L.C.; Macrae, R. Chlorogenic acid composition of instant coffees. Analyst 1984, 109, 263. [Google Scholar] [CrossRef] [PubMed]
- Sari, F.; Velioglu, Y.S. Effects of particle size, extraction time and temperature, and derivatization time on determination of theanine in tea. J. Food Compos. Anal. 2011, 24, 1130–1135. [Google Scholar] [CrossRef]
- Toazza, C.E.B.; Leal, F.C.; Marques, C.; Oliveira, G.; Farias, F.O.; Belan, A.L.D.; Leite, N.F.; Mafra, M.R.; Igarashi-Mafra, L.; Masson, M.L. Bioactive compounds extraction from different lemongrass species: Strategies and deep eutectic solvents evaluation. J. Food Process Eng. 2022, 1–14. [Google Scholar] [CrossRef]
- Xu, H.; Wang, W.; Liu, X.; Yuan, F.; Gao, Y. Antioxidative phenolics obtained from spent coffee grounds (Coffea arabica L.) by subcritical water extraction. Ind. Crops Prod. 2015, 76, 946–954. [Google Scholar] [CrossRef]
- Wei, Z.; Qi, X.; Li, T.; Luo, M.; Wang, W.; Zu, Y.; Fu, Y. Application of natural deep eutectic solvents for extraction and determination of phenolics in Cajanus cajan leaves by ultra performance liquid chromatography. Sep. Purif. Technol. 2015, 149, 237–244. [Google Scholar] [CrossRef]
- Ruesgas-Ramón, M.; Figueroa-Espinoza, M.C.; Durand, E. Application of Deep Eutectic Solvents (DES) for Phenolic Compounds Extraction: Overview, Challenges, and Opportunities. J. Agric. Food Chem. 2017, 65, 3591–3601. [Google Scholar] [CrossRef]
- Oliveira, G.; Farias, F.O.; Sosa, F.H.B.; Mafra, M.R. Green solvents to tune the biomolecules’ solubilization in aqueous media: An experimental and in silico approach by COSMO-RS. J. Mol. Liq. 2021, 341, 117314. [Google Scholar] [CrossRef]
- Cheong, M.W.; Tong, K.H.; Ong, J.J.M.; Liu, S.Q.; Curran, P.; Yu, B. Volatile composition and antioxidant capacity of Arabica coffee. Food Res. Int. 2013, 51, 388–396. [Google Scholar] [CrossRef]
- Hečimović, I.; Belščak-Cvitanović, A.; Horžić, D.; Komes, D. Comparative study of polyphenols and caffeine in different coffee varieties affected by the degree of roasting. Food Chem. 2011, 129, 991–1000. [Google Scholar] [CrossRef]
- Sato, T.; Takahata, T.; Honma, T.; Watanabe, M.; Wagatsuma, M.; Matsuda, S.; Smith, R.L.; Itoh, N. Hydrothermal Extraction of Antioxidant Compounds from Green Coffee Beans and Decomposition Kinetics of 3- o-Caffeoylquinic Acid. Ind. Eng. Chem. Res. 2018, 57, 7624–7632. [Google Scholar] [CrossRef]
- Syakfanaya, A.M.; Saputri, F.C.; Munim, A. Simultaneously Extraction of Caffeine and Chlorogenic Acid from Coffea canephora Bean using Natural Deep Eutectic Solvent-Based Ultrasonic Assisted Extraction. Pharmacogn. J. 2019, 11, 267–271. [Google Scholar] [CrossRef]
- Alonso-Salces, R.M.; Serra, F.; Reniero, F.; HÉberger, K. Botanical and Geographical Characterization of Green Coffee (Coffea arabica and Coffea canephora): Chemometric Evaluation of Phenolic and Methylxanthine Contents. J. Agric. Food Chem. 2009, 57, 4224–4235. [Google Scholar] [CrossRef]
- Shalmashi, A.; Abedi, M.; Golmohammad, F.; Eikani, M.H. Isolation of caffeine from tea waste using subcritical water extraction. J. Food Process Eng. 2009, 33, 701–711. [Google Scholar] [CrossRef]
- Narita, Y.; Inouye, K. High antioxidant activity of coffee silverskin extracts obtained by the treatment of coffee silverskin with subcritical water. Food Chem. 2012, 135, 943–949. [Google Scholar] [CrossRef]
- Dai, Y.; Rozema, E.; Verpoorte, R.; Choi, Y.H. Application of natural deep eutectic solvents to the extraction of anthocyanins from Catharanthus roseus with high extractability and stability replacing conventional organic solvents. J. Chromatogr. A 2016, 1434, 50–56. [Google Scholar] [CrossRef]


Publisher’s Note: MDPI stays neutral with regard to jurisdictional claims in published maps and institutional affiliations. |
© 2022 by the authors. Licensee MDPI, Basel, Switzerland. This article is an open access article distributed under the terms and conditions of the Creative Commons Attribution (CC BY) license (https://creativecommons.org/licenses/by/4.0/).