Article

Metabolite Profiling of Tartary Buckwheat Extracts in Rats Following Co-Administration of Ethanol Using UFLC-Q-Orbitrap High-Resolution Mass Spectrometry

1
Department of Pharmacy, Union Hospital, Tongji Medical College, Huazhong University of Science and Technology, Wuhan 430022, China
2
School of Pharmacy, Tongji Medical College, Huazhong University of Science and Technology, Wuhan 430022, China
3
Hubei Provincial Key Laboratory of Quality and Safety of Traditional Chinese Medicine Health Food, Jing Brand Research Institute, Jing Brand Co., Ltd., Daye 435100, China
4
The Third Affiliated Hospital of School of Medicine, Shihezi University, 45 Beisan Road, Laojie Street, Shihezi 832002, China
*
Authors to whom correspondence should be addressed.
These authors contributed equally to this work.
Separations 2022, 9(12), 407; https://doi.org/10.3390/separations9120407
Submission received: 1 November 2022 / Revised: 27 November 2022 / Accepted: 29 November 2022 / Published: 2 December 2022
(This article belongs to the Special Issue Chromatography-Mass Spectrometry Technology Research)

Abstract

:
Tartary buckwheat, a gluten-free pseudocereal, has received considerable attention owing to its unique nutritional ingredients and beneficial health effects such as anti-tumor, anti-oxidation, anti-inflammation and hepatoprotective activities. Pharmacokinetic and metabolite profiling have been preliminarily assessed for Tartary buckwheat extracts. However, its metabolites have not yet been characterized in vivo after co-administration with ethanol when Tartary buckwheat extracts are used for the treatment of alcoholic liver disease. In this paper, a Q-Exactive orbitrap high-resolution mass spectrometer was employed to identify the metabolites of Tartary buckwheat extracts in rat biological samples. Compared with previous metabolite profiling results, a total of 26 novel metabolites were found in rat biological samples, including 11, 10, 2 and 5 novel metabolites in rat plasma, bile, urine and feces, respectively, after oral co-administration of 240 mg/kg Tartary buckwheat extracts with ethanol (42%, v/v). The major metabolic pathways of the constituents in Tartary buckwheat extracts involved hydroxylation, methylation, glucuronidation, acetylation and sulfation. Quercetin and its metabolites may be the pharmacological material basis of Tartary buckwheat for the protective effect against alcoholic liver injury. The research enriched in vivo metabolite profiling of Tartary buckwheat extracts, which provided experimental data for a comprehensive understanding and rational use of Tartary buckwheat against alcoholic liver disease.

1. Introduction

In 2014, the World Health Organization (WHO) roughly estimated that 38% of all individuals over the age of 15, accounting for more than 2 billion people, consumed alcohol all over the world [1]. Among those, approximately 950 million were heavy drinkers [2]. In China, alcohol is considered as a critical part of Chinese culture. The WHO also revealed a striking increase in per capita alcohol consumption in China from 1978 to 2010 [1,3]. As is known, alcohol use has a close association with a range of acute and chronic health problems. Recently, a large number of studies have confirmed that alcohol is a risk factor for high blood pressure, brain damage and liver cirrhosis [4,5,6].
Buckwheat (Fagopyrum tataricum) is initially cultivated in southwest China and the Himalayan area [7]. Among four major species of buckwheat, Tartary buckwheat (F. tataricum (L.) Gaertn.) has drawn growing attention owing to its particular nutritional composition and beneficial health effects [8]. Up to now, several reviews have summarized the chemical composition and therapeutic activity of Tartary buckwheat [9,10]. To be specific, a number of classes of chemical compounds including flavonoids, phenolics, fagopyritols, triterpenoids, steroids, fatty acids and volatile compounds were identified [11,12]. Among those, phenolic compounds were regarded as the major active components. Moreover, diverse therapeutic effects including anti-tumor [13], anti-oxidation [14], anti-inflammation [15], anti-diabetes [16], anti-bacteria [17], anti-fatigue [18] and hepatoprotective activities against trimethylamine-N-oxide diet [19] or ethanol-induced liver injury [20] have been reported.
Tartary buckwheat has shown convincing medicinal potential for ethanol induced liver injury. More recently, Tartary buckwheat extracts demonstrated a hepatoprotective effect against alcohol-induced liver injuries at least in part due to its anti-oxidant and anti-apoptotic activities as well as altered hepatic glycerophospholipid metabolism [21,22]. However, it is worth noting that pharmacokinetic processes may be altered after the co-administration of ethanol. Previously, our group published that co-administration with ethanol increased the bioavailability of quercetin and kaempferol to a different extent, probably due to altered intestinal absorption and metabolic activity [23]. Additionally, another group has identified the in vivo metabolites and characterized the metabolic pathways of Tartary buckwheat extracts in rats [24]. However, the effect of co-administration of ethanol on in vivo metabolism of Tartary buckwheat extracts remains unknown. Therefore, it is necessary to provide more information concerning in vivo metabolite profiling of Tartary buckwheat extracts in rats following co-administration with ethanol. In the present study, an ultrafast liquid chromatography (UFLC)-Q-Orbitrap high-resolution mass spectrometry (HRMS) platform was used to carry out such work.

2. Materials and Methods

2.1. Chemicals and Reagents

Quercetin, kaempferol, rutin, Kaempferol-3-O-rutinoside, N-trans-feruloyltyramine, acacetin and apigenin were all obtained from the National Institute for the Control of Pharmaceutical and Biological Products (Beijing, China). Deionized water was freshly prepared using a Milli-Q purification system (Millipore, Billerica, MA, USA). Acetonitrile and methanol of HPLC-grade were purchased from Fisher Scientific (Fair Lawn, NJ, USA). All other chemicals and solvents were of analytical grade and obtained from commercial sources. Tartary buckwheat extracts and ethanol were produced by Jing Brand Co., Ltd. (Daye, China).

2.2. Tartary Buckwheat Extracts

One gram Tartary buckwheat powder was immersed with 20 mL of 70% methanol solution for 30 min followed by ultrasonic extraction for 40 min. The extracts were centrifuged at 4000× g for 10 min and the supernatant was filtered by 0.45 µm microporous filtration membrane. Finally, diluted solution with final concentration of 5 or 50 µg/mL was prepared for LC-MS/MS analysis.

2.3. Animal Experiments

Six- to eight-week-old adult Wistar rats (200 ± 20 g, n = 12) were purchased from Laboratory animal center, Tongji Medical College, Huazhong University of Science and Technology. The rats were housed in metabolic cages in a temperature (25 ± 2 °C) controlled room with an alternating 12 h light/dark cycle. Upon arrival, animals were acclimated for 1 week and fed with a standard rodent diet. The animal study protocol was approved by the Animal Care and Ethics Committee of Tongji Medical College at Huazhong University of Science and Technology (NO. 2563, June 2020).
All animals were randomly divided into two groups. The first group was used for plasma, urine and feces sample collection, while the other group was for bile sample collection. The Tartary buckwheat extracts suspended in 42% (v/v) ethanol with a total concentration of 24 mg/mL were administered intragastrically to each group of rats at a dose of 240 mg/kg according to a previous study [24]. The dosing volume was 10 mL/kg, which met good practice concerning administration volumes for rats [25]. Blood samples were collected by femoral arterial cannulation pre–dose and 0.5, 1, 3, 6 h post–dose. Bile samples were collected by bile intubation and drainage at time intervals of −6 to 0, 0 to 6, 6 to 12 and 12 to 24 h. Urine and feces samples were harvested at predefined time periods of −24 to 0, 0 to 12, 12 to 24 and 24 to 48 h. Samples collected before administration served as blank controls. All biological samples collected were frozen at cryogenic freezer with −80 °C.

2.4. Sample Preparation

After acetonitrile was added into the plasma, bile and urine samples (6:1, v/v), the mixture was vortexed for 3 min and centrifugated at 1500× g for 10 min at 4 °C. The supernatant was evaporated to dryness by an SPD1010 Speed Vac Concentrator at 45 °C, 5.1 Vac for 2 h. The residue was redisolved in 100 μL of neat solution containing methanol and water (1:1, v/v), followed by centrifugation at 16,000× g for 10 min at 4 °C. The supernatant was used for LC-MS/MS analysis.
Feces samples were homogenized and cleaned up with acetonitrile (1:6, w/v) by ultrasonication for 20 min and centrifuged at 12,000× g for 10 min at 4 °C. The supernatant was evaporated using the abovementioned SPD1010 SpeedVac Concentrator under the same condition. The residue was redisolved in 100 μL of neat solution containing methanol and water (1:1, v/v), Afterward, the supernatant was obtained after centrifugation at 16,000× g for 10 min at 4 °C. The supernatant was used for LC-MS/MS analysis.

2.5. Instrumentation and Analytical Conditions

A Shimadzu Prominence UFLC system consisted of two binary pumps (LC-30AD), an auto-sampler (SIL-30AC), a degasser (DGU-20A5) and a column oven (CTO-30A) (Shimadzu Corporation, Kyoto, Japan). Chromatographic separation was performed on a BEH C18 column (2.1 × 100 mm, 1.7 µm, Waters Co., Milford, MA, USA). The mobile phase was composed of 0.1% (v/v) acetic acid in water (mobile phase A) and 0.1% (v/v) acetic acid in methanol (mobile phase B). The gradient program was: 0–2 min at 15% B; 2–15 min at 15–30% B; 15–35 min at 30–90% B; 35–40 min at 90% B; 40–45 min at 15% B. The flow rate, column oven temperature and injection volume were 0.3 mL/min, 40 °C and 10 µL, respectively.
Mass spectrometric analysis was carried out using a Q-Exactive orbitrap HRMS (Thermo Fisher Scientific, Bremen, Germany) equipped with an electrospray ionization source under the positive ionization mode. The mass spectrometric parameters were the same as our previous work [23].

2.6. Data Analysis

Mass spectrometric data were acquired and processed using the Xcalibur 2.0 software (Thermo Fisher Scientific Inc., Waltham, MA, USA). The inferred metabolites were identified based on the following workflow. The chemical database including molecular weight, chemical composition and structure of chemical components derived from Tartary buckwheat extracts were initially established. Then, the mass fragmentation was characterized for typical chemical components. Next, the potential metabolites were screened based on the mass spectrometric spectra and typical diagnostic fragment ions between the pre– and post–dosing samples [23]. Isomers were characterized by Clog P values obtained from Chemdraw 14.0. A longer retention time was commonly observed in the reverse-phase chromatographic condition for the metabolites with higher Clog P [26,27]. Finally, Isopro software was used to exclude false positive results such as in-source collision and isotope peaks. The self-control approach was employed to exclude metabolites that were not derived from Tartary buckwheat. After that, we compared all the metabolites with the previously published literature [24] to identify novel metabolites which had not been detected in previous work using Tartary buckwheat alone.

3. Results and Discussion

3.1. Identification and Analysis Strategy Establishment

In this study, a valid strategy was proposed for in vivo metabolite profiling of Tartary buckwheat extracts in rats following co-treatment of ethanol (Figure 1). Firstly, a chemical database consisting of components of Tartary buckwheat exacts and other possible ingredients was set according to literature and pre–experiment. Secondly, a neat solution of reference standards and biological samples was detected by UFLC-HRMS and original data was obtained. After that, the discovery and identification of Tartary buckwheat exact metabolites were processed as described in Section 2.6. Finally, diagnostic product ions and neutral loss were used for the elucidation of the identified metabolite structure by comparing fragmentation pathways with established chemical database.

3.2. Chemical Components

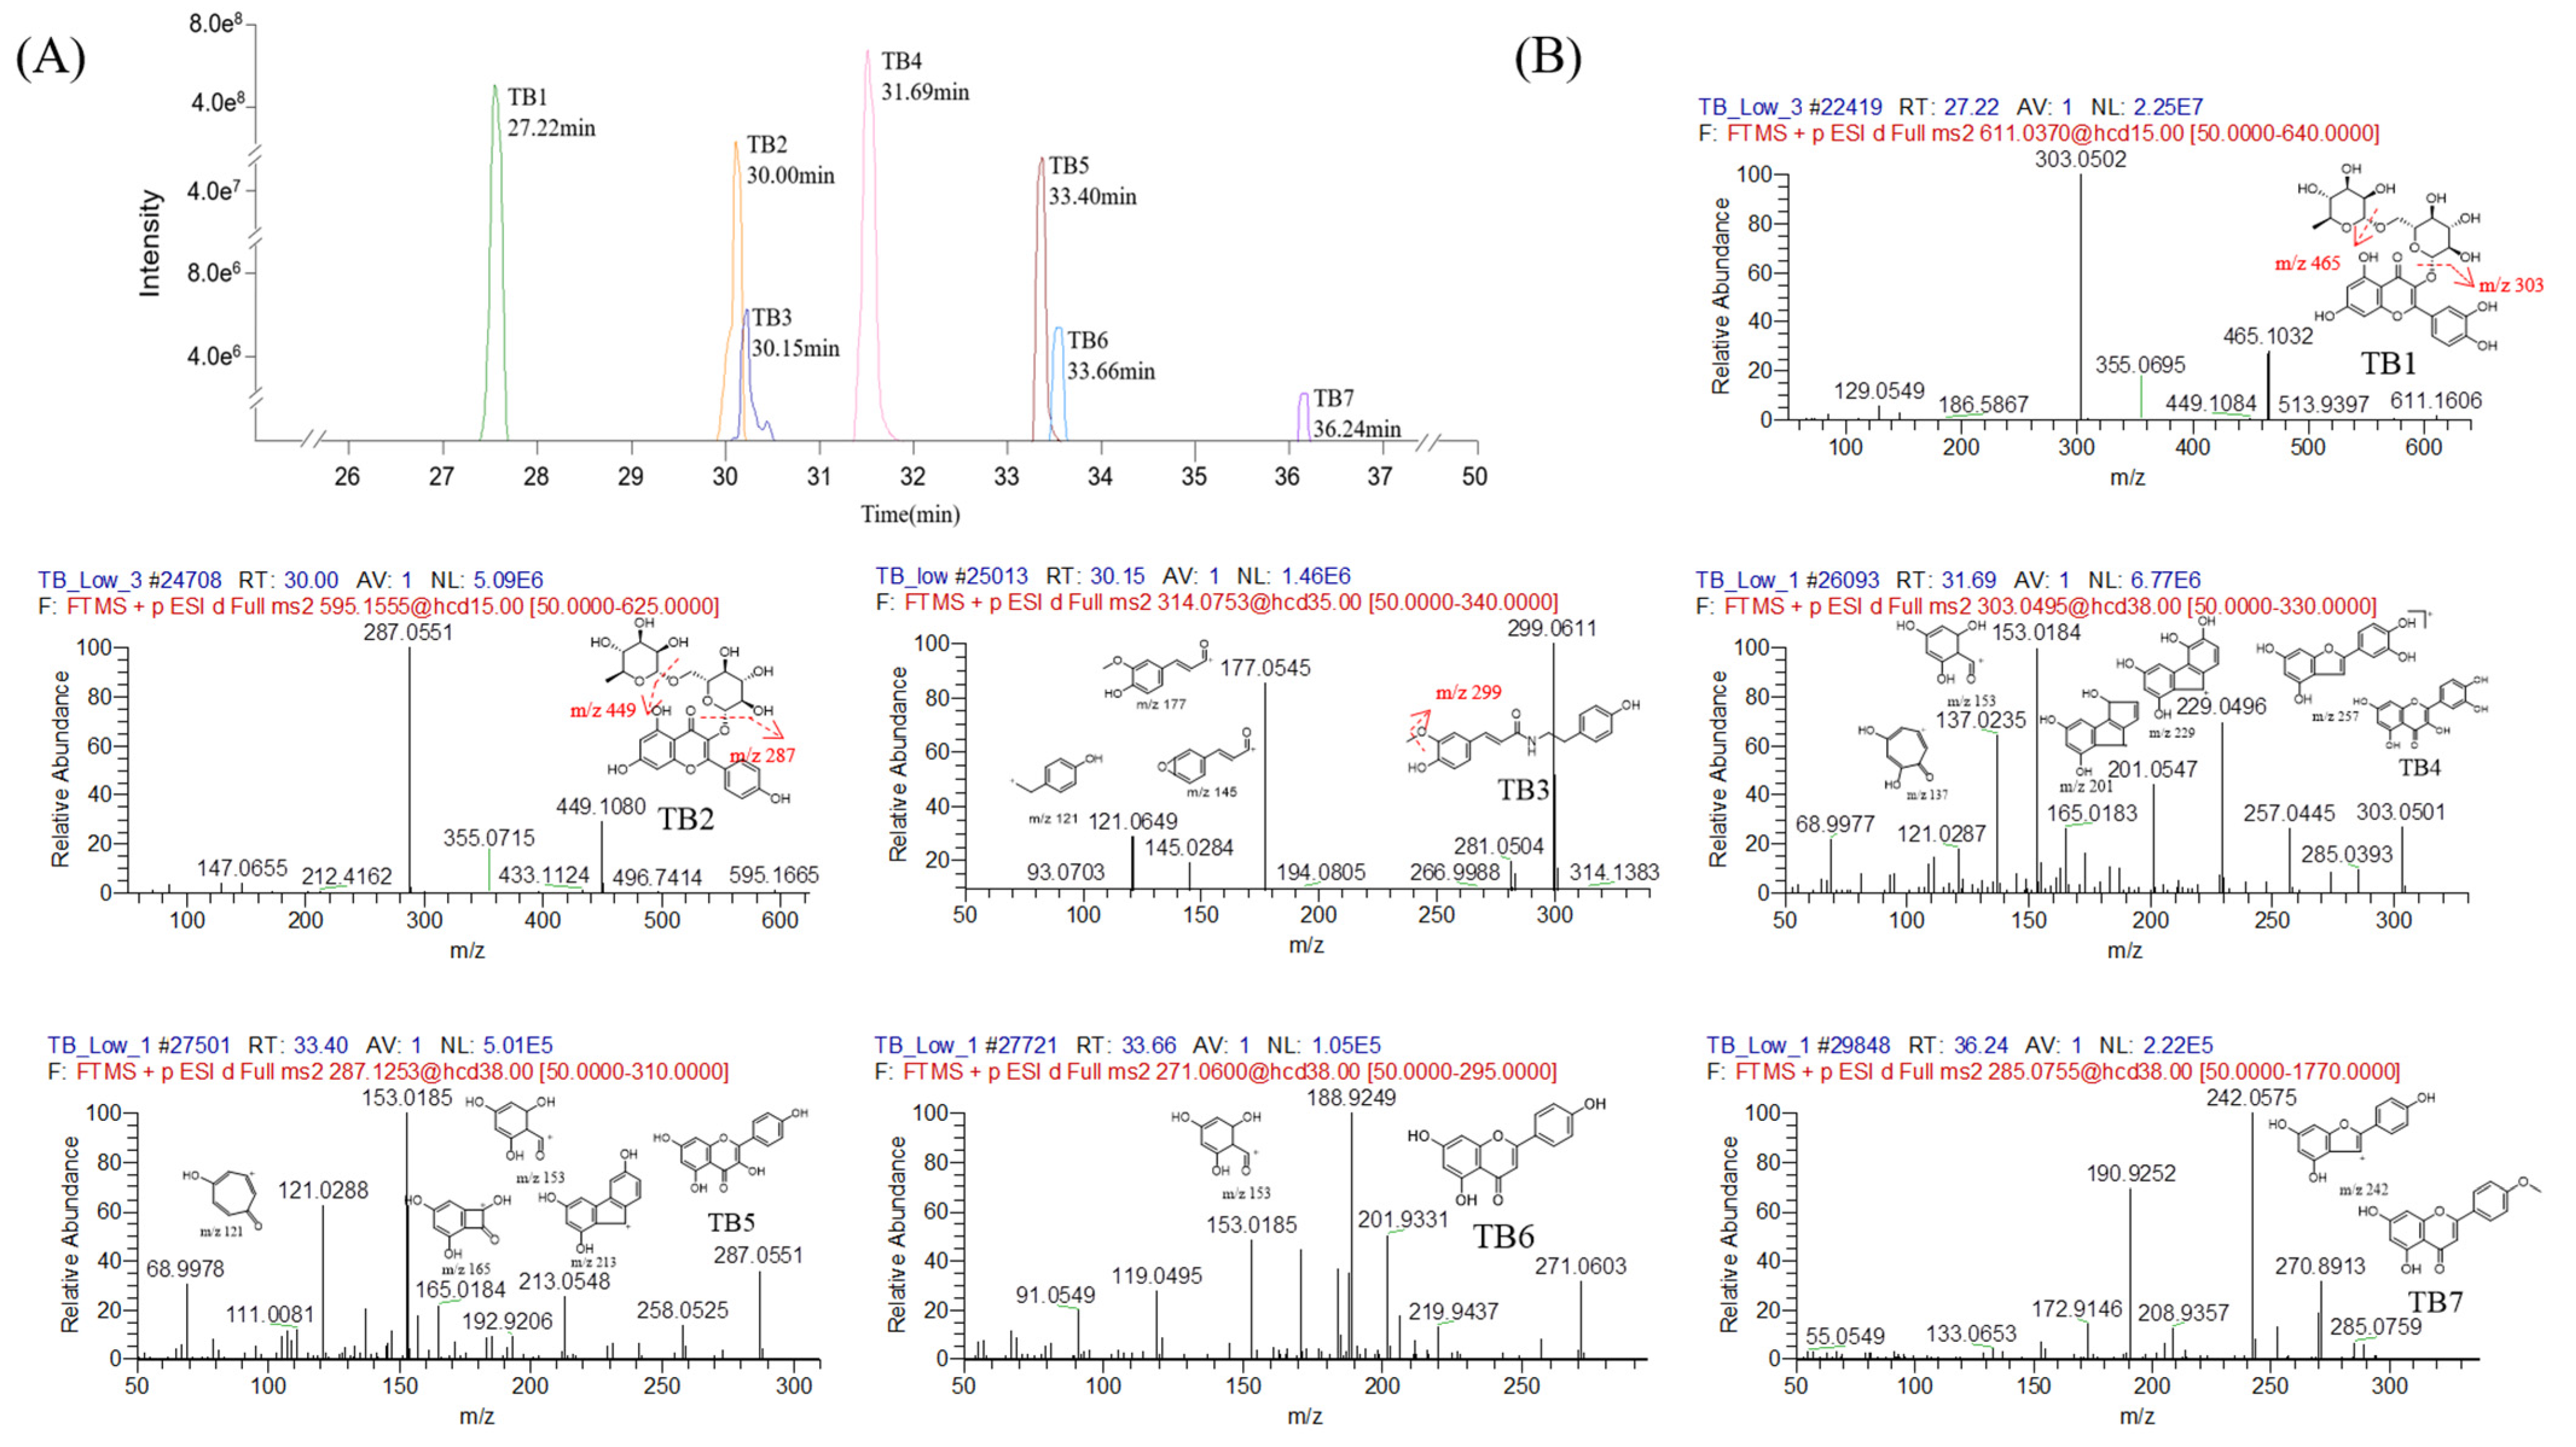
To optimize the chromatographic conditions, the chromatograms were compared based on resolution of separation using acetonitrile and methanol as the organic mobile phase. Gradient procedures using acetonitrile resulted in poor peak shapes with compromised chromatographic separation for TB6 and TB7 (Figure S1). Moreover, TB3 could not be eluted under such conditions. As such, gradient conditions using methanol were tried and a significant improvement in mass spectrometric response and chromatographic separation was obtained (Figure S1 and Figure 2). According to the best separation conditions described above, a total of seven major chemical components were unambiguously identified in Tartary buckwheat extracts using corresponding reference standards in the current study. The observed accurate masses, mass errors and characteristic fragment ions of the proposed chemical components are listed in Table 1. The corresponding chromatogram and MS/MS (MS2) spectra are shown in Figure 2. Several research groups presented a thorough elucidation of the chemical composition of Tartary buckwheat. Among these components, rutin, quercetin, Kaempferol-3-O-rutinoside and kaempferol are the classic components in Tartary buckwheat [9,28], while apigenin and acacetin were found in Tartary buckwheat root or leaves [29,30]. Intriguingly, N-trans-Feruloyltyramine was the single same compound detected in both our study and another previous investigation, in the latter of which quercetin and kaempferol were identified as metabolites in rats [24]. Such discrepancies in the chemical components in Tartary buckwheat extracts might be related to the different plant parts (seeds vs. whole plant) and extraction procedures.
TB1 (tR = 27.22 min) generated a protonated molecular ion at m/z 611.1606 (calculated for C27H30O16). The characteristic product ion at m/z 303 was observed with the highest mass spectrometric response by the consecutive loss of rhamnose (146 Da) and glucose (162 Da). TB 1 was in accordance with the retention time and fragment ions of a reference standard of rutin.
TB2 showed an elution time at 30.00 min with protonated molecular ion at m/z 595.1665 (calculated for C27H30O15). The fragment ions at m/z 449 and 287 with the highest two mass spectrometric intensity were generated due to the gradual loss of rhamnose (146 Da) and glucose (162 Da) [31]. TB2 was confirmed as Kaempferol-3-O-rutinoside by matching both retention time and fragmentation pathway with the corresponding reference standard.
TB3 was eluted at 30.15 min and produced protonated molecular ion at m/z 314.1383 (calculated for C18H19NO4). In the MS2 spectrum, the fragment ions consisted of m/z 299 [314-CH3]+, m/z 177 [314-C8H10NO2]+, m/z 145 [314-C8H10NO2-CH2-H2O]+, m/z 121 [314-C10H10NO4]+. The above fragment ions provided characteristic fragment pathways of N-trans-Feruloyltyramine standard, which was also consistent with the data proposed by Xu et al. [32].
TB4 (tR = 31.69 min) showed a [M+H]+ ion at m/z 303.0501 (calculated for C15H10O7). The fragment ions at m/z 285 [303-H2O]+, m/z 257 [303-H2O-CO]+, m/z 229 [30-H2O-2CO]+, m/z 201 [303-H2O-3CO]+ and m/z 165 [303-CO-C6H6O2]+, which were consistent with the fragment ions of the reference standard quercetin.
TB5 (tR = 33.40 min) displayed molecular ion at m/z 287.0551 (calculated for C15H10O6). Typical product ions at m/z 213 [287-H2O-2CO]+ and at m/z 165 [287-CO-C6H6O]+ and at m/z 153 [287-CO-C6H6O-CH2]+ formed by retro Diels-Alder reaction cleavage were detected in the MS2 spectrum. The kaempferol standard exhibited identical elution time and MS2 spectrum.
TB6 was eluted at 33.66 min and identified as apigenin with a protonated molecular ion at m/z 271.0603 (calculated for C15H10O5). In the MS2 spectrum, the major fragment ion at m/z 189 [271-3H2O-CO]+ with the highest mass spectrometric response together with m/z 119 generated by retro Diels–Alder reaction cleavage was in accordance with the fragments of apigenin standard.
TB7 (tR = 36.24 min) was proposed as acacetin by m/z 285.0759 (calculated for C16H12O5). In the MS2 spectra, the [M+H]+ ion at m/z 285 was fragmented into the ions [285-CH3-CO]+ at m/z 242 and [285-2H2O-CO-CH2O]+ at m/z 191.

3.3. Metabolite Profiling in Biological Samples

As is known, substances are commonly absorbed into the circulation system and take effect in the body. A series of metabolites generated after the absorption of chemical components of traditional Chinese medicine can exert diverse therapeutic effects on hosts. An investigation of the formed metabolites together with their biological activity is of great importance for comprehensive understanding and rational use of traditional Chinese medicine. The components in the blood are most likely to play a critical role in treating disease. A high content of flavonoids such as rutin and quercetin was found in Tartary buckwheat, which could protect fibroblasts from oxidative stress due to its in vivo metabolites [33]. In our study, the largest number of metabolites (11 out of 26) was derived from plasma, in which eight metabolites were produced by the further metabolism of TB4 quercetin, indicating that quercetin and its metabolites may be the pharmacological material basis of Tartary buckwheat for the protective effect against alcoholic liver injury. Previous studies also confirmed the protective effect of quercetin and its metabolites [34,35,36,37,38,39]. For example, Yoo-Jung Lee reported that two quercetin metabolites including 3′-O-methyl quercetin and quercetin-3-O-glucuronide demonstrated protective effects against ethanol-induced liver injury through ROS generation, lipid peroxidation and oxidative stress pathways [34]. Moreover, the metabolites, for instance, quercetin sulphate and quercetin glucuronide, might have the biological activity to potentially inhibit xanthine oxidase [35]. As such, these eight quercetin-based metabolites could be used as potential functional metabolites. In addition to the hepatoprotective effect of kaempferol [36], glycosylated kaempferol is also capable of modulating lipid and glucose metabolism through adiponectin and AMPK pathways [37]. Similarly, apigenin exerts hepatoprotective activity against alcohol-induced liver injury [38] and acetaminophen-induced hepatotoxicity [39]. However, it is also worth noting that the biological activity of a substance might change after in vivo metabolism. Therefore, further study is essential to investigate the therapeutic efficacy and pharmacological features of in vivo metabolites against alcoholic liver disease, which provides a reasonable in-depth mechanism for the clinical application of Tartary buckwheat.
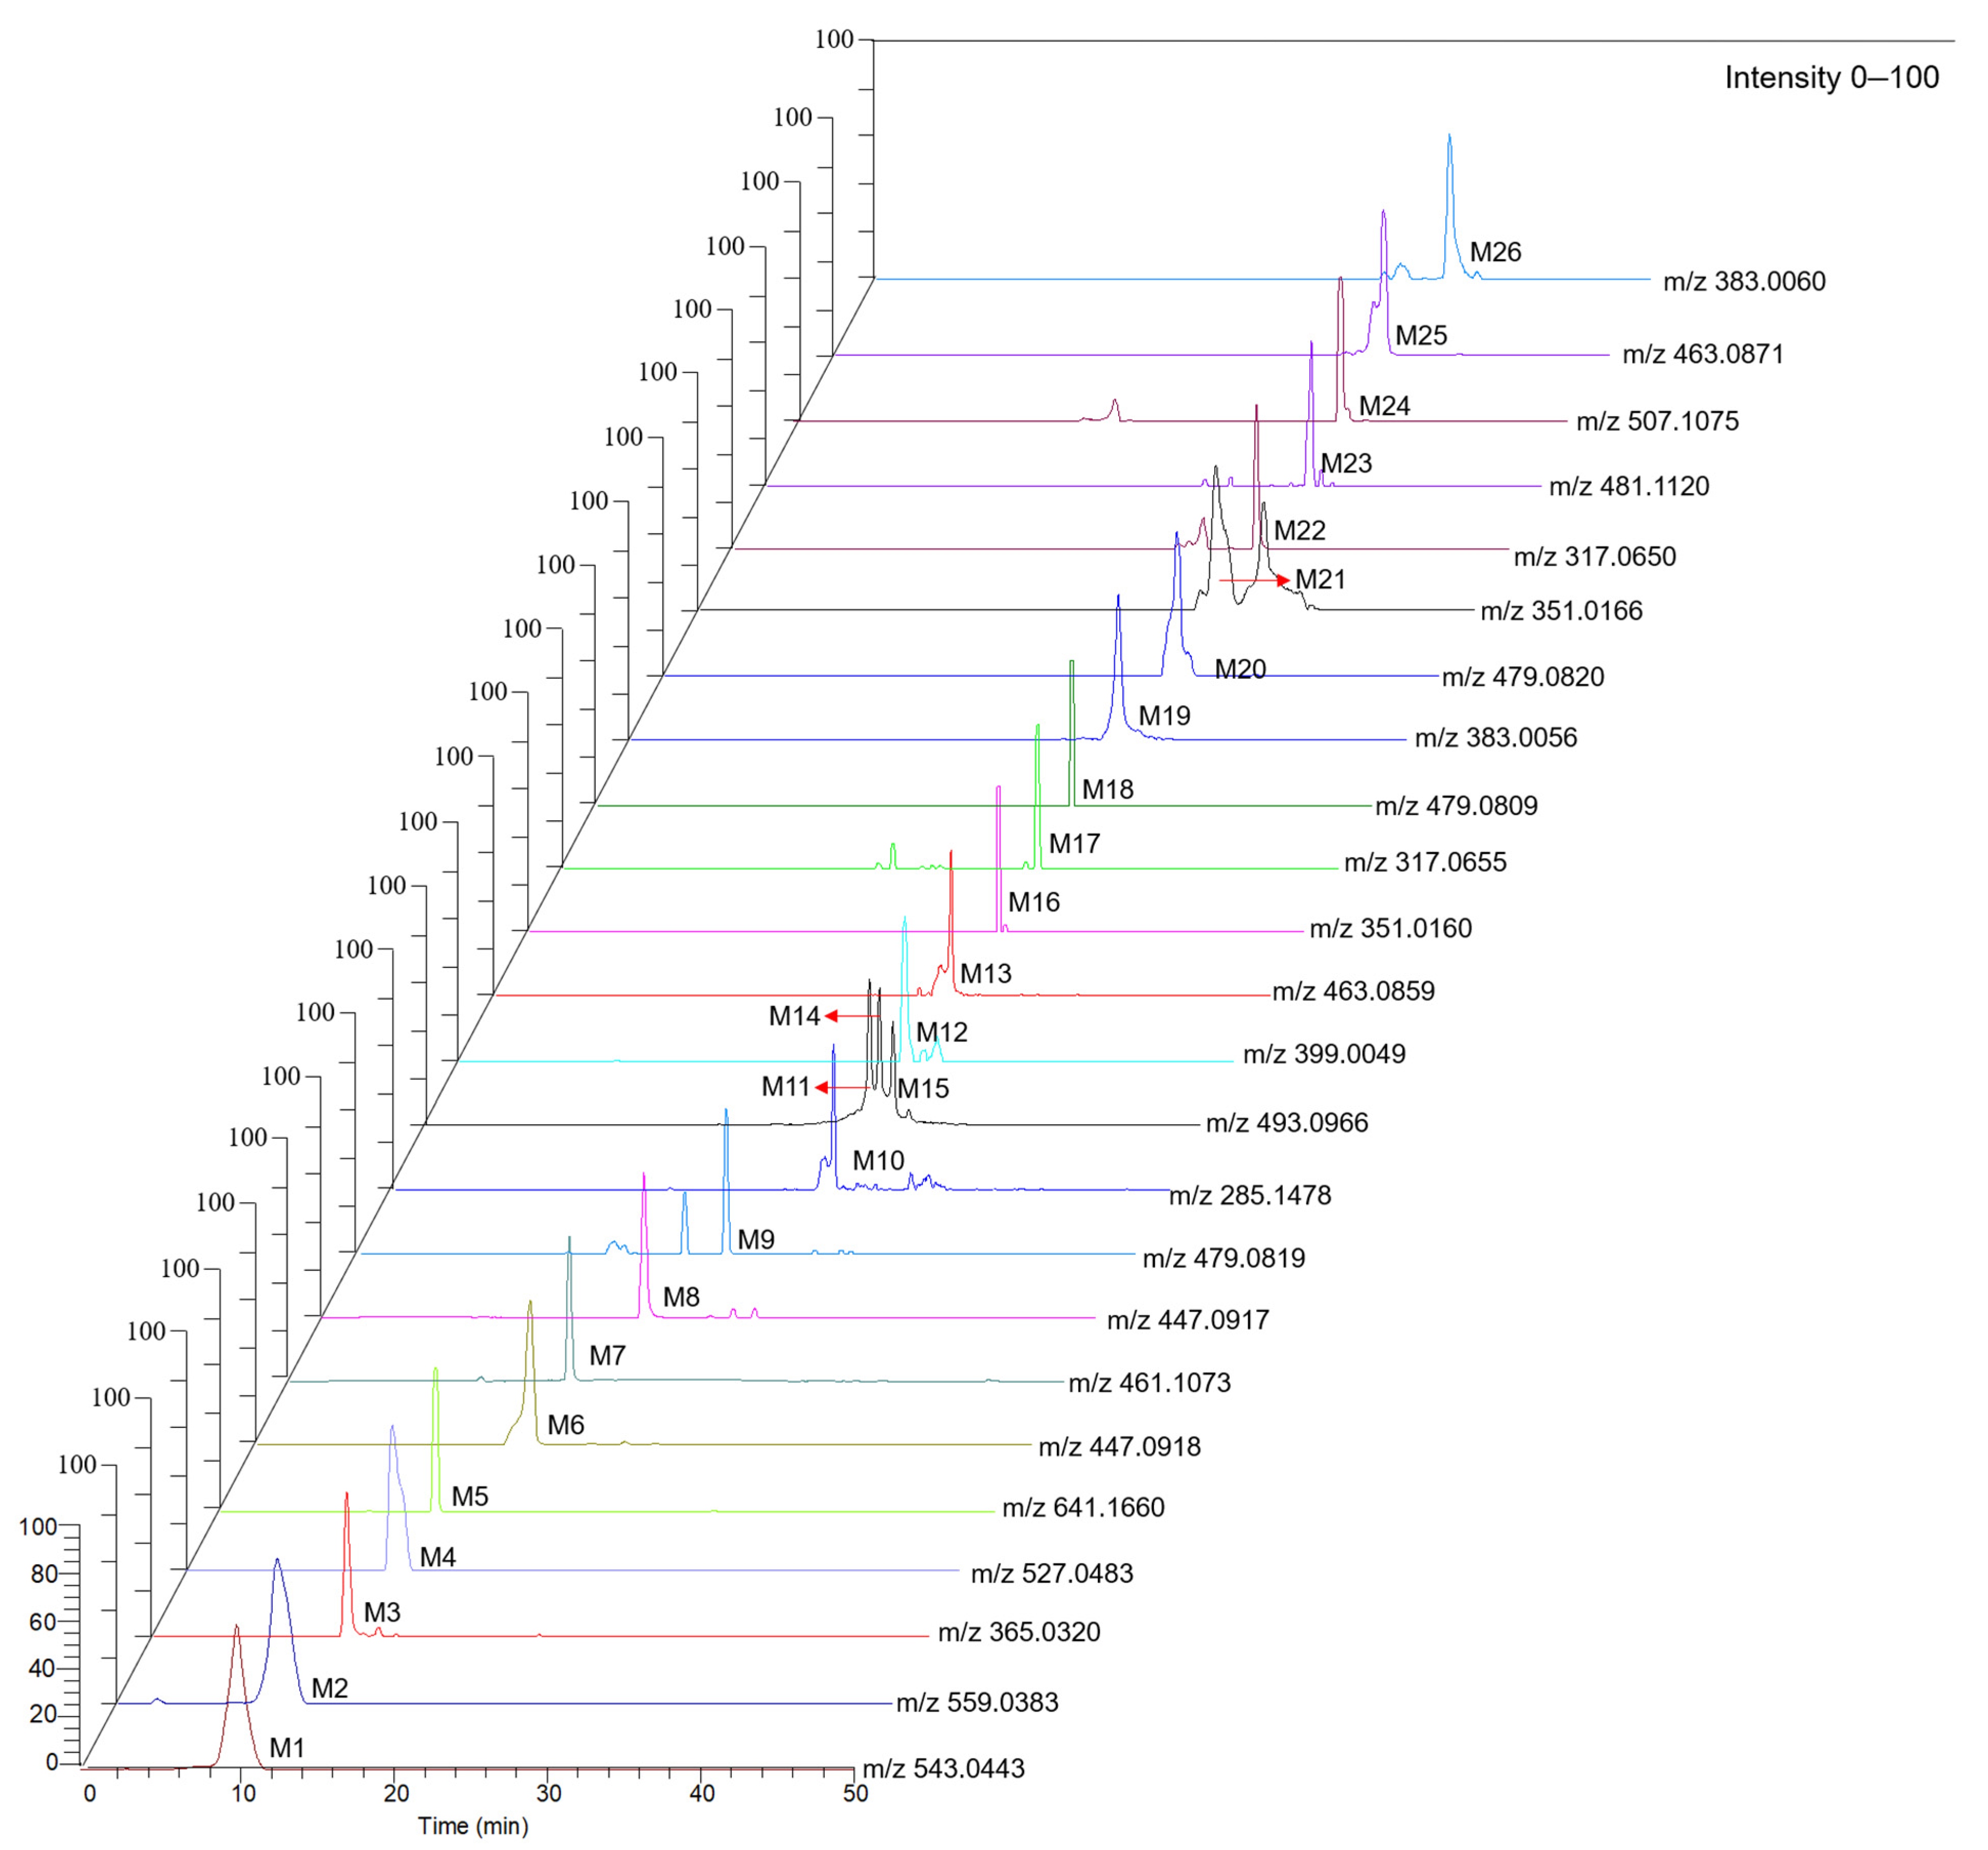
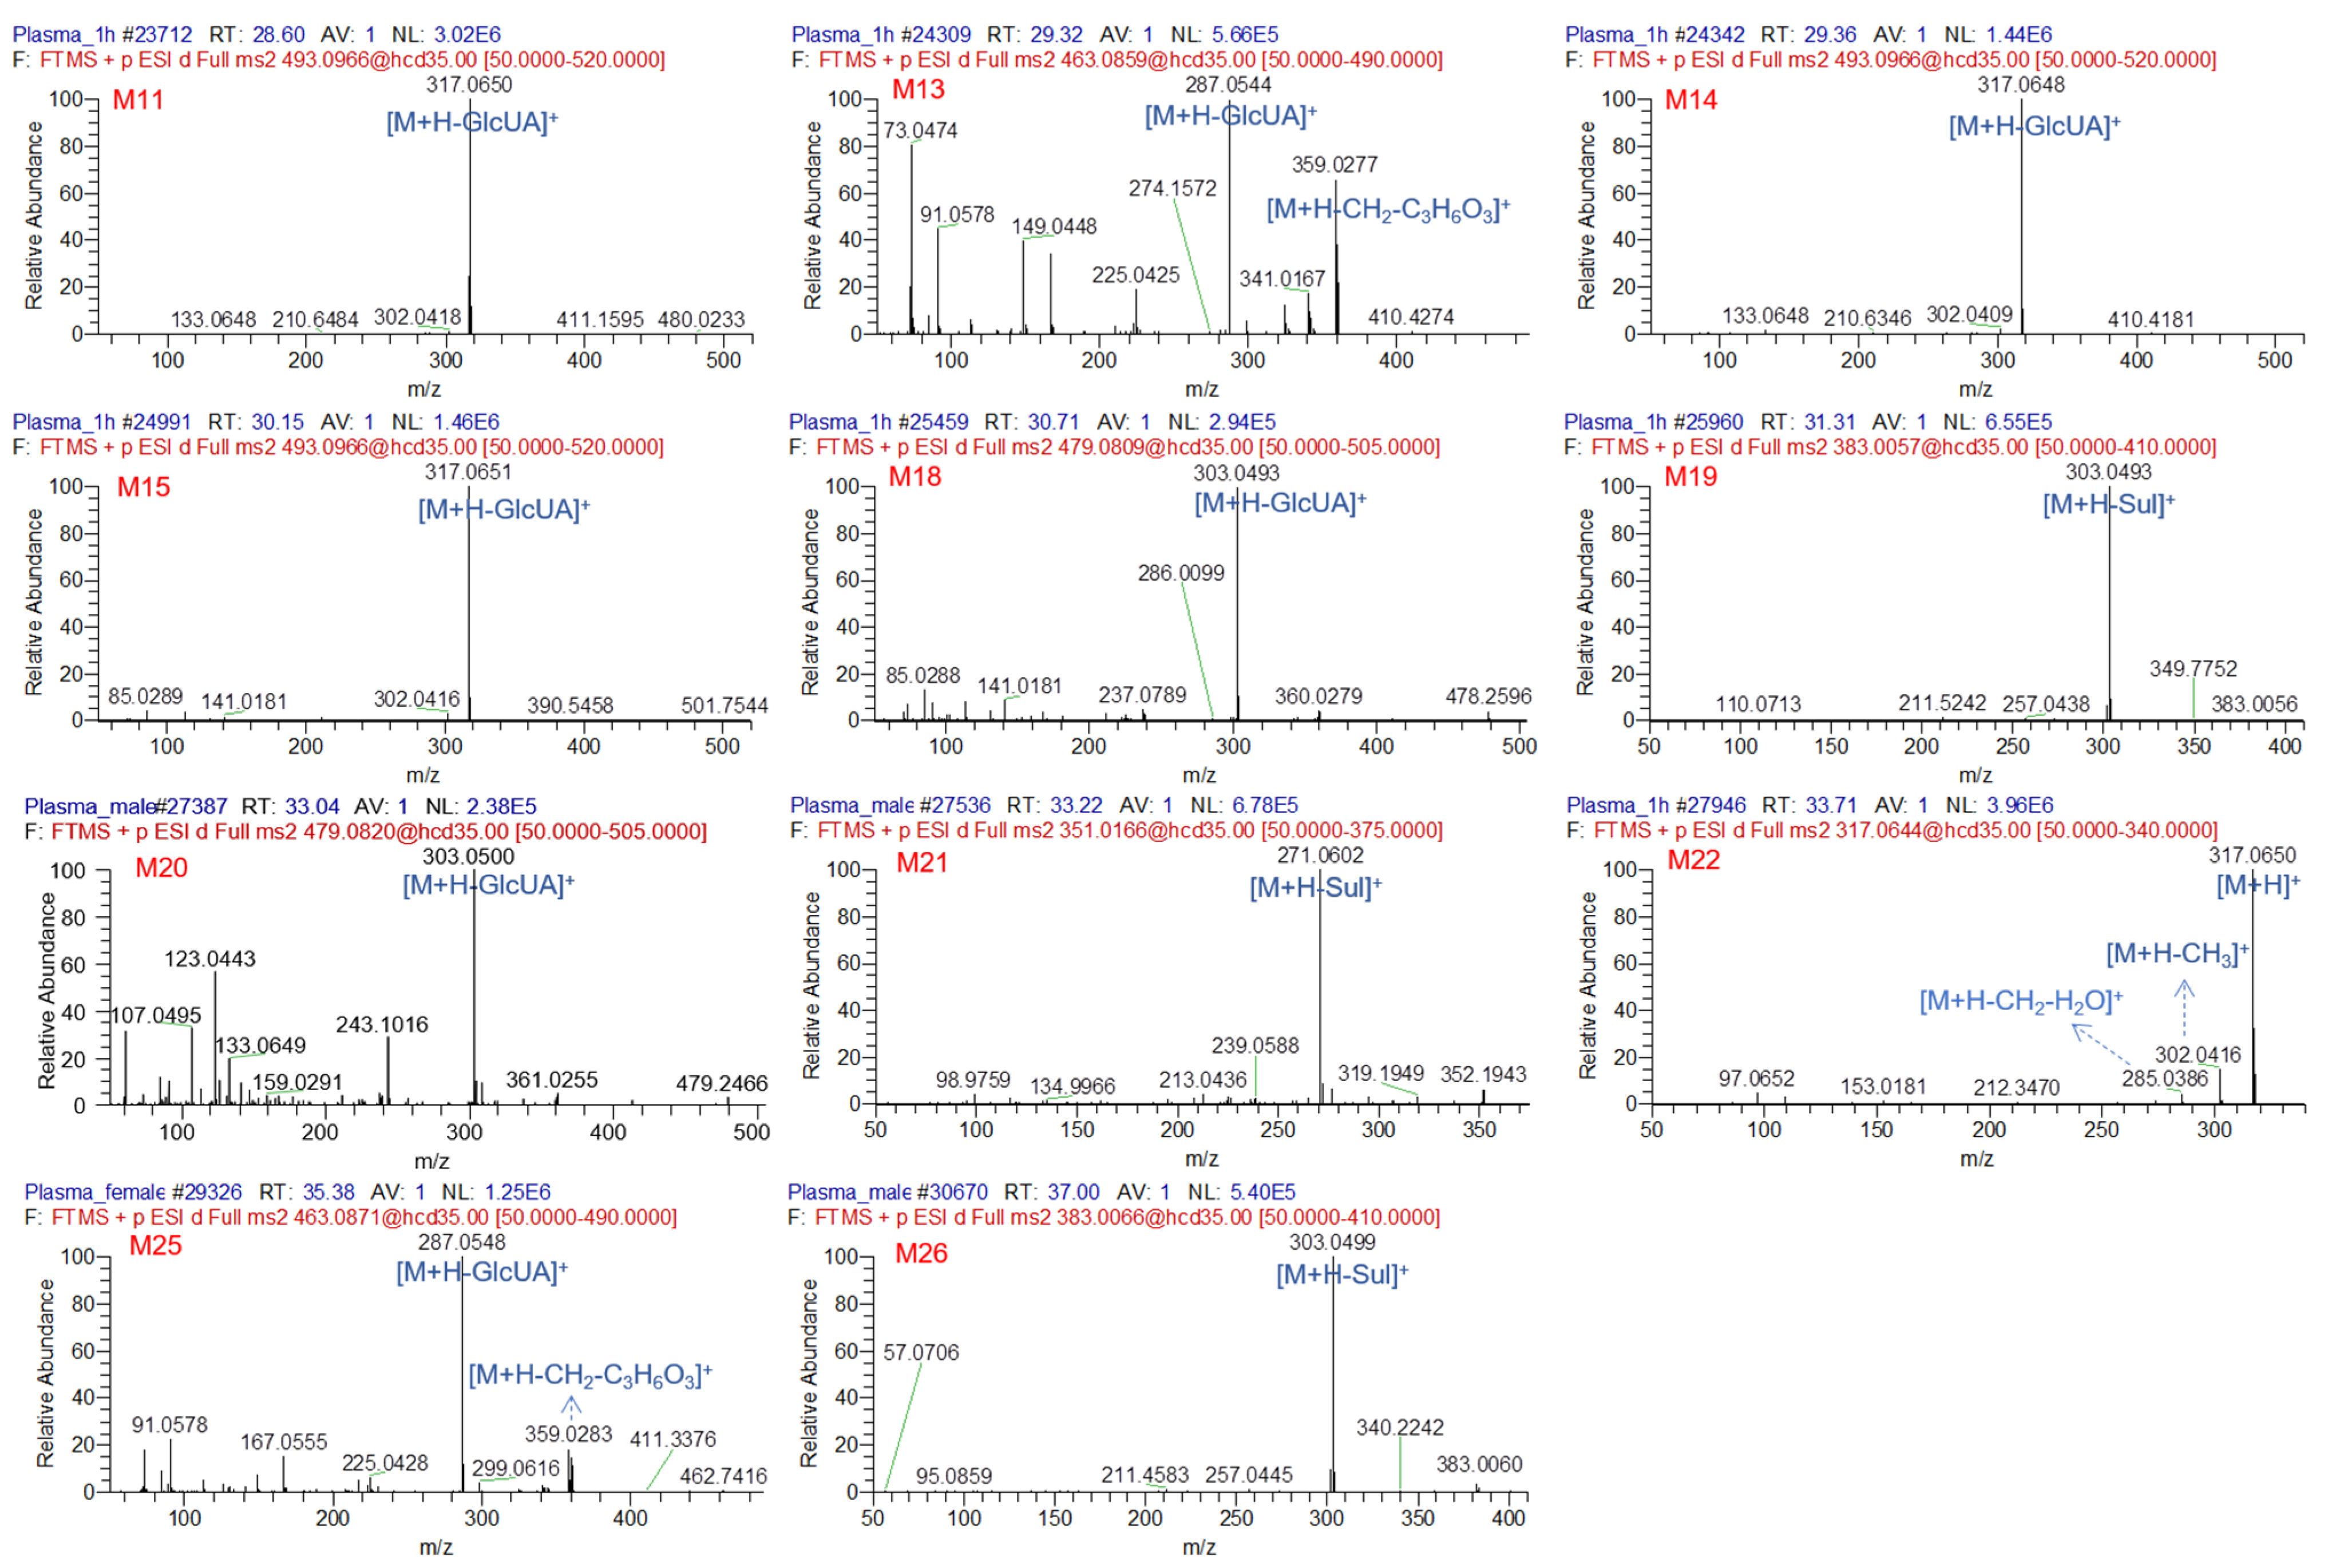
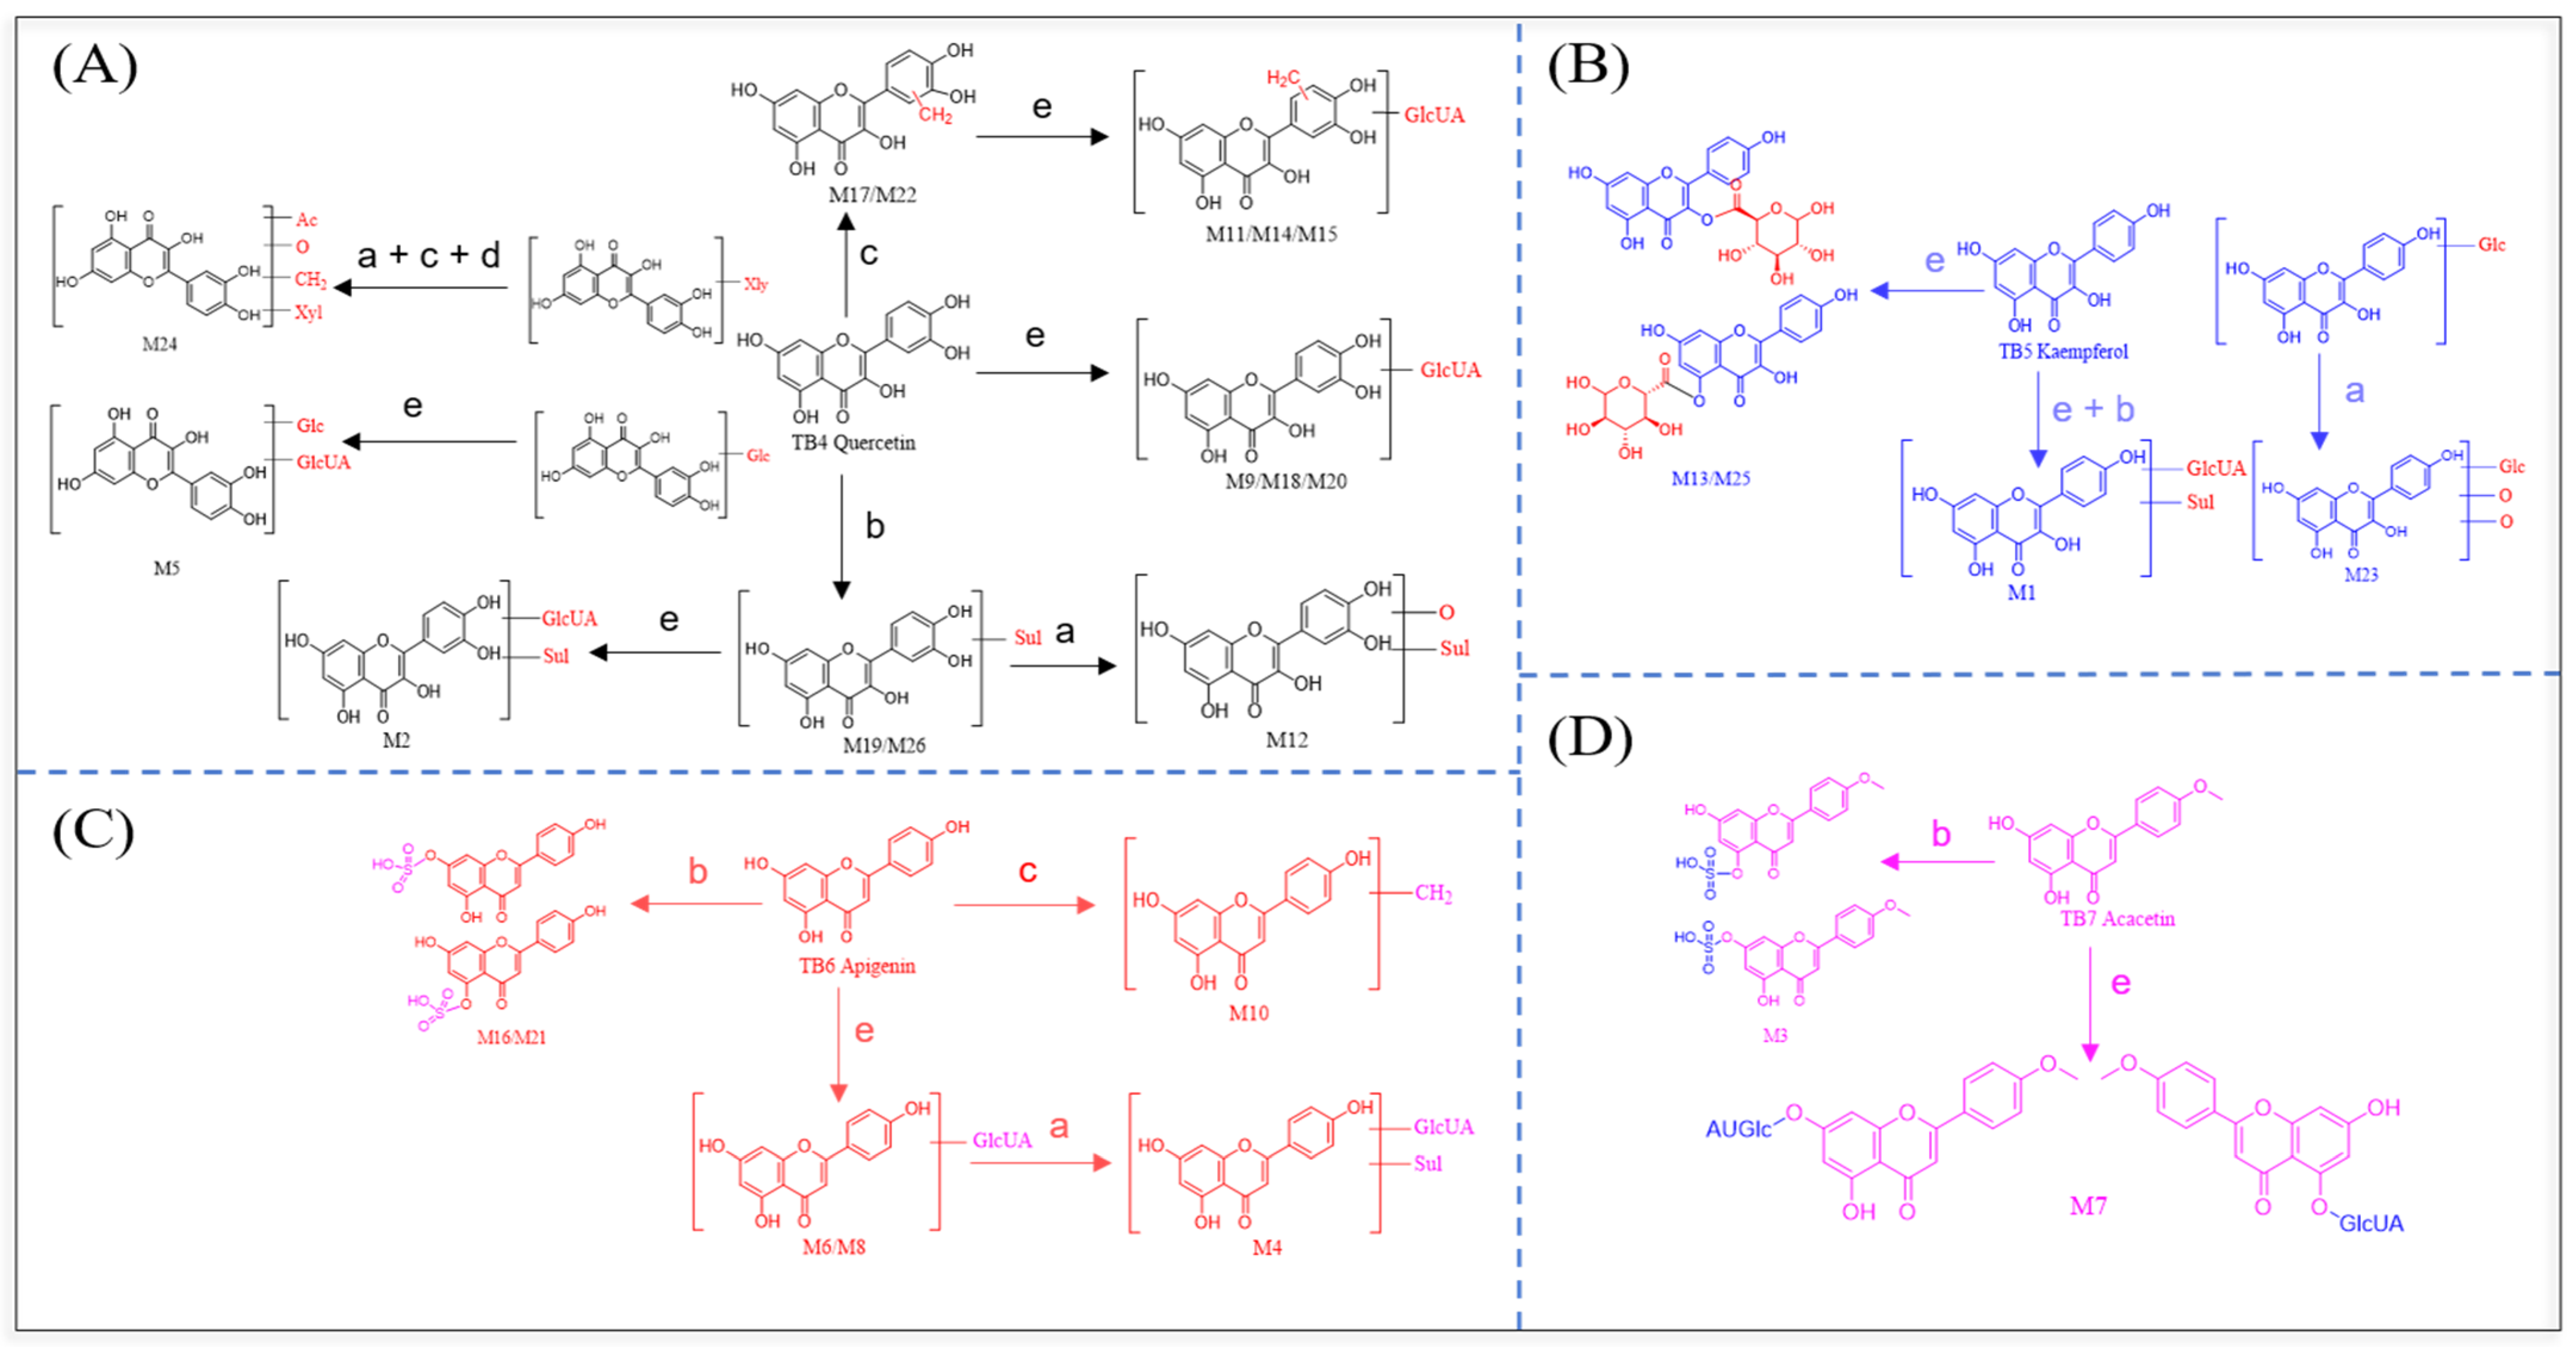
In 2014, 16 metabolites were detected for in vivo metabolism study of whole plant derived Tartary buckwheat extracts in rat feces, urine, bile and plasma [24]. Recently, our group found that the bioavailability and metabolic profiling of quercetin and kaempferol were affected by co-administration with ethanol in beagle dogs since ethanol might alter intestinal permeability as well as hepatic and intestinal metabolic enzyme activity [23]. Therefore, co-administration with ethanol also influences the metabolic fate of chemical compounds of interest. As a result, the current study identified 26 novel metabolites in rat biological samples including plasma, bile, urine and feces after oral co-administration of ethanol and Tartary buckwheat extracts compared with previous findings [24]. The extracted ion chromatograms of metabolites identified in plasma, bile, urine and feces are depicted in Figure 3. Moreover, MS/MS (MS2) spectra of 11 novel metabolites identified in plasma are demonstrated in Figure 4, while MS2 spectra of metabolites for the other three biological matrices including bile, urine and feces are presented in Supplementary Figures S2–S4, respectively. The chromatographic and fragmentation information for the identified metabolites is summarized in Table 2. The proposed metabolic pathways of the major components in Tartary buckwheat extracts are depicted in Figure 5. It is worth noting that three metabolites (M11, M14, M15) with m/z 493.0966 (calculated for C22H20O13), two metabolites (M13, M25) with m/z 463.0859 or 463.0871 (calculated for C21H18O12) and two metabolites (M17, M22) with m/z 317.0655 or 317.0650 (calculated for C16H12O7) were detected in this study, while previous investigation only reported each of these metabolites. The metabolic pathways of Tartary buckwheat extracts included hydroxylation, methylation, glucuronidation, acetylation and sulfation.

3.3.1. Metabolite Identification in Plasma

Metabolite 11 (M11, tR = 28.60 min), M14 (tR = 29.36 min) and M15 (tR = 30.15 min) were determined at m/z 493.0966 to have the same molecular formula C22H20O13. The typical product ion at m/z 317 with the highest mass spectrometric intensity was owning to the neutral loss of glucuronide (176 Da) from the precursor ion at m/z 493. The fragmentation pathway of product ion at m/z 317 was consistent with the previous fragmentation pattern proposed by Day et al. [35]. Of note, the different retention time of M11, M14 and M15 indicated the different position of glucuronide group, which contributed to the change in polarity of these molecules and in turn elution behavior. Since the fragment ion at m/z 317 was suggested to be a protonated ion of methylated quercetin, M11, M14 and M15 were tentatively identified as methylated quercetin glucuronide.
M13 (tR = 29.32 min) and M25 (tR = 35.38 min) displayed [M+H]+ ion at m/z 463.0859 and 463.0871 (calculated for C21H18O12), respectively. In MS2 spectra, fragment ion at m/z 359 was observed because of the loss of CH2 (14 Da) and C3H6O3 (90 Da). The characteristic loss of C3H6O3 corresponded to a sugar ring opening together with aldose-ketose isomerization-based retro-aldol condensation [40]. Moreover, the product ion at m/z 287 was generated by the loss of glucuronide (C6H8O6 176 Da). However, intermolecular hydrogen bond attraction could occur because of the hydroxyl group (C-3 and C-5) and carbonyl group (C-4), indicating that the glucuronidated metabolites may be formed at C-3 and C-5 positions [24]. The Clog p values of 3-OH and 5-OH were estimated to be −1.14 and −1.4 by Chemdraw 14.0. Therefore, M13 and M25 were identified as 3-OH kaempferol glucuronide and 5-OH kaempferol glucuronide, respectively.
M18 and M20 showed elution time at 30.71 min and 33.04 min with protonated molecular ions at m/z 479.0809 and 479.0820 (calculated for C21H18O13). The characteristic fragment ion at m/z 303 [479-glucuronide (176 Da)]+ was found in the MS2 spectrum. Therefore, M18 and M20 were proposed to be quercetin glucuronide. Moon et al. also identified quercetin glucuronide in human plasma after oral consumption of fried onions [41]. Nevertheless, the position of the glucuronide group on quercetin remains unclear since glucuronidation might occur at different possible positions (3-, 5-, 7-, 3′- and 4′-).
M19 (tR = 31.31 min) and M26 (tR = 37.00 min) displayed protonated molecular ions at m/z 383.0056 and 383.0060 (calculated for C15H10O10S), respectively. The molecular weight of both metabolites was increased by 80 Da in comparison with TB4 (quercetin), indicating the formation of sulphated metabolites. Thus, M19 and M26 were tentatively identified as quercetin sulphate, which was previously identified in human plasma and urine after intake of red onions [35,42].
The molecular formula of M21 (tR = 33.22 min) was deduced to be C15H10O8S. M21 presented the adduct molecular ion at m/z 351.0166, which gave rise to the major fragment ion at m/z 271 [351-sulphate (80 Da)]+ due to the loss of a sulphate moiety from apigenin skeleton. Hence, M21 was characterized as apigenin sulphate.
M22 (tR = 33.71 min) generated [M+H]+ ion at m/z 317.0650 (calculated for C16H12O7). In the MS2 spectrum, the product ion at m/z 302 presented the characteristic fragment ions at m/z 285 [317-CH2-H2O]+, which were in good agreement with the fragmentation pattern of quercetin aglycone. Catechol-O-methyltransferase (COMT), an intercellular enzyme, plays an important role in methylation in vivo and catalyzes only one of the two neighbor catechol hydroxyls [43]. As such, methylation was thought to occur at the B ring. Therefore, M22 was tentatively identified methylated quercetin.

3.3.2. Metabolite Identification in Bile

The quasi-molecular ion peak at m/z 543.0443 (calculated for C21H18O15S) was eluted at 10.03 min (M1). In the MS2 spectrum, the cleavage fragment ions consisted of m/z 463 [543-sulphate (80 Da)]+, m/z 287 [543-sulphate (80 Da)-glucuronide (176 Da)]+. Thus, M1 was proposed to be kaempferol glucuronide sulphate.
M2 (tR = 10.23 min) exhibited [M+H]+ ion at m/z 559.0383 (calculated for C21H18O16S). The major fragment ions of m/z 479 and m/z 383 were generated by the neutral loss of sulphate (80 Da) and glucuronide (176 Da), respectively. The fragment ion at m/z 303 was produced by the loss of both sulphate and glucuronide. Meanwhile, Mullen et al. reported the same cleavage features [42], which provided substantial evidence to confirm that M2 was quercetin glucuronide sulphate.
M3 was eluted at 12.47 min with m/z 365.0320 (calculated for C16H12O8S). The molecular weight was increased by 80 Da compared with acacetin. The MS2 spectrum showed typical fragment ion at m/z 285 by dropping a sulphate moiety (80 Da). The sulfation site could be suggested at either 5-O-or 7-O-position of A ring. Thus, M3 was identified as acacetin-5/7-sulphate.
M4 (tR = 13.35 min) displayed [M+H]+ ion at m/z 527.0483 with molecular formula of C21H18O14S, for which fragment ions at m/z 351 and 271 were detected in the MS2 spectra due to the continuous loss of glucuronide (176 Da) and sulphate (80 Da). Therefore, M4 was proposed to be apigenin glucuronide sulphate.
M6 (tR = 17.71 min) and M8 (tR = 20.88 min) generated protonated molecular ions at m/z 447.0918 and 447.0917 (calculated for C21H18O11), respectively. Fragment ion at m/z 271 was observed due to a neutral loss of glucuronide (176 Da) in the MS2 spectrum. It was deduced that a glucuronide moiety was added to apigenin. Thus, M6 and M8 were characterized as apigenin glucuronide isomers with different chromatographic retention behavior.
M7 (tR = 18.09 min) produced protonated molecular ion at m/z 461.1073 (calculated for C22H20O11). In the MS2 spectrum, the typical fragment ion [461-glucuronide (176 Da)]+ at m/z 285 (the highest relative intensity) was produced in keeping with the fragmentation pattern of acacetin glucuronide. Therefore, M7 was tentatively characterized as either acacetin-5-O-glucuronide or acacetin-7-O-glucuronide.
M9 (tR = 23.54 min) presented the protonated molecular ion at m/z 479.0819 (calculated for C22H22O12) and major fragment ion at m/z 303 [479-glucuronide (176 Da)]+. Moreover, the fragment ions at m/z 285, 257, 225 in the MS2 mass spectrum were similar to the fragments of reference standard quercetin. M9 was deduced as quercetin glucuronide.
M16 (tR = 30.29 min) displayed quasi-molecular ion at m/z 351.0160 (calculated for C15H10O8S). The typical product ion at m/z 271 with the highest mass spectrometric intensity was observed in the MS2 spectrum, indicating sulphated product of apigenin. Therefore, M16 was tentatively proposed to be apigenin sulphate.
M17 (tR = 30.56 min) showed molecular ion at m/z 317.0655 (calculated for C16H12O7). In the MS2 spectrum, a number of diagnostic fragment ions were found at m/z 303 [317-CH2]+, at m/z 285 [317-CH2-H2O]+ and at m/z 165 [317-CH2-CO-C6H6O2]+. Thus, M17 was identified as methyl quercetin. Methylation might take place at C-3′ or C-4′ position of B-ring [24], which provided plausible explanations for M17 and M22 sharing the same molecular weight but with different chromatographic retention time.

3.3.3. Metabolite Identification in Urine

M5 was detected at m/z 641.1660 (calculated for C28H32O17) and eluted at 13.82 min. The protonated molecule yielded ions at m/z 465 due to the loss of glucuronide. The fragment ions at m/z 321 [641-C15H10O7-H2O]+, m/z 303 [641-glucuronide (176 Da)-glucose (162 Da)]+. As such, M5 was tentatively deduced as quercetin glucoside glucuronide. In addition, M16 (tR = 30.29 min) with m/z 351.0160 (calculated for C15H10O8S) was also detected in urine. As shown in metabolite identification results in bile, M16 was tentatively identified as apigenin sulphate.

3.3.4. Metabolite Identification in Feces

M9 (tR = 23.54 min) with molecular ion at m/z 479.0819 (calculated for C22H22O12) was also detected in feces and proposed to be quercetin glucuronide according to the abovementioned fragmentation pattern.
M10 (tR = 28.23 min) displayed molecular ion at m/z 285.1478 (calculated for C18H20O3). In the MS2 spectrum, the precursor ion fragmented into m/z 271 [285-CH2]+, m/z 267 [285-H2O]+, m/z 239 [285-H2O-CO]+, m/z 191 [285-2H2O-CO-CH2O]+, m/z 173 [191-CO]+, m/z 133 (the highest relative intensity)[285-C6H6O2-CH2-CO]+. Since the accurate molecular weight and retention time were different to acacetin, M10 was tentatively identified as methyl apigenin.
M12, extracted at 28.74 min, generated a molecular ion at m/z 399.0049 (calculated for C15H10O11S). The MS2 spectra yielded typical fragment ions at m/z 319 [399-sulphate (80 Da)]+, 303 [399-sulphate (80 Da)-O]+, 245 [399-CH2-CO2]+. Moreover, the characteristic ions at m/z 257, 229, 193, 185, 163 and 72 were identical to the fragmentation ions of quercetin. Thus, M12 was identified as hydroxyl quercetin sulphate.
M23 (tR = 35.11 min) showed protonated molecular ion at m/z 481.1120 (calculated for C25H20O10). The characteristic product ion at m/z 287 with the highest mass spectrometric intensity was produced in the MS2 mass spectrum, corresponding to the continuous loss of a glycoside, H2O and CH2 moieties. M23 was identified as hydroxyl kaempferol glucoside.
M24 (tR = 35.17 min) exhibited molecular ion at m/z 507.1075 (calculated for C30H18O8). In the MS2 spectrum, the product ions at m/z 465 [507-C2H2O (42 Da)]+, m/z 447 [507-C2H4O2 (60 Da)]+ and m/z 357 [507-C2H4O2 (60 Da)-C3H6O3 (90 Da)]+ were observed. The gradual loss of 60 and 90 Da indicated that the substituent on the precursor structure may be pentose instead of hexose [44]. As such, M24 was the product formed by acetylation, methylation and hydroxylation. Thus, M24 was identified as acetylated methyl hydroxyl quercetin xyloside.

3.4. Identification of False Positive Peak

It is reported that mass spectrometric data naturally consisted of a large amount of features pertaining to chemical components as well as identified metabolites [45]. There exist critical challenges to obtain reliable metabolite identification results while isotopes and in-source fragments eluted at similar chromatographic retention time and precursor ions may lead to false positive metabolites characterization shown in Figure 6 [46,47].
As such, we proposed an effective and convenient method using the retention time, fragmentations and Isopro software to identify the false positive peaks. The identified false positive peaks are shown in the Table 3.
The generation of in-source fragmentation was induced at the intermediate transmission stage in mass spectrometers [47,48]. It is difficult to predict the exact mass of in-source fragments due to the particularity of each metabolite. It is worth noting that peaks with different mass-to-charge ratios belong to the same metabolite due to the similar elution time and fragmentation patterns [45]. Accordingly, the false positive peaks such as in-source fragments were recognized by its comparable retention time and highly overlapped fragmentations in comparison to the genuine metabolites. As an example, M5 (tR = 13.82 min) was proposed to be quercetin glucoside glucuronide with MS2 fragment ion at m/z 480. Interestingly, a molecular ion at m/z 480.1183 eluted at 13.79 min with analogous peak shape was found to present the same fragment ions as M5 including m/z 480, 321, 303, 162. As described above, the peak at m/z 480.1183 was considered as a false positive metabolite due to in-source mass spectrometry collision (Figure 6B).
Since supplemental information of the precursor ion would be provided in the forms of isotope pattern by a high resolution mass spectrum, it should be noted that some data mining software can miss genuine metabolites when the isotopes were matched and eluted at similar retention time [49]. Isopro software can predict the isotopic pattern of each molecular formula. The isotope peaks were characterized along with the following steps: 1. The relative 12C/13C isotopomer abundances and their exact mass weight were provided by Isopro software to obtain the isotope ratios. 2. The peak area of the genuine metabolite and isotope were manually integrated by Xcalibur 2.0 Software to calculate the peak area ratios. 3. The isotope can be initially identified if the peak area ratio is close to the isotope ratio with the similar retention time and fragmentation. Here, M1 (tR = 10.03 min) was proposed to be kaempferol glucuronide sulphate, which displayed molecular ion at m/z 543.0443. The Isopro software showed that the isotopic distribution at m/z 544.0575 presented a relative abundance of 0.1816. The peak area ratio of m/z 543.0443 and 544.0575 was calculated to be 4.380, which was close to the isotope ratio (3.999). Apart from that, in comparison to the precursor ion at m/z 543 together with typical fragment ions at m/z 463, 367, 287, the mass spectra of m/z 544 was identical. In consequence, the peak at m/z 544.0575 was identified as an isotope derived false positive metabolite (Figure 6C).

4. Conclusions

In the current study, the major chemical composition of Tartary buckwheat extracts as well as in vivo metabolites were further clarified by UFLC-Q-Orbitrap HRMS along with post data-mining tools. Seven prototype compounds were verified in Tartary buckwheat extracts. Compared with the reported metabolites in the previous study, 26 novel metabolites were detected and identified in rat plasma, bile, urine and feces sample after oral co-administration with ethanol. The metabolic pathways of Tartary buckwheat extracts included hydroxylation, methylation, glucuronidation, acetylation and sulfation. Our research findings concerning the prototype components and in vivo metabolites offered a comprehensive understanding of the therapeutic efficacy and preclinical safety of Tartary buckwheat extracts co-administered with ethanol. Undoubtedly, it is essential to carry out further study to investigate whether these metabolites exhibit biological activities as well as toxicity and to provide sensible recommendations for Tartary buckwheat against alcohol induced liver injury.

Supplementary Materials

The following supporting information can be downloaded at https://www.mdpi.com/article/10.3390/separations9120407/s1. Figure S1: Typical Chromatograms of chemical components (TB1–TB7) of Tartary buckwheat extracts using a BEH C18 column. The mobile phase consisted of acetonitrile (mobile phase B) and water containing 0.1% formic acid (mobile phase A). The gradient profile was as follows: 0–20 min at 50–95% B; 20.01–25 min at 50% B. The flow rate was set at 0.3 mL/min and the LC column temperature was maintained at 40 °C. The sample injection volume was 10 µL. TB1: Rutin; TB2: Kaempferol-3-O-rutinoside; TB3: N-trans-Feruloyltyramine; TB4: Quercetin; TB5: Kaempferol; TB6: Apigenin; TB7: Acacetin. The total analytical run was 25 min; Figure S2: the MS2 spectra of metabolites identified in rat bile after oral co-administration of Tartary buckwheat extracts with ethanol; Figure S3: the MS2 spectra of metabolites detected in rat urine after oral co-administration of Tartary buckwheat extracts with ethanol; Figure S4: the MS2 spectra of metabolites identified in rat feces after oral co-administration of Tartary buckwheat extracts with ethanol.

Author Contributions

Conceptualization, L.X., Y.Z. (Yongjun Zhang) and J.H.; methodology, W.L., J.X. and Y.Z. (Yao Zhang); software, L.X.; validation, Y.W., Y.H. and Q.Y.; formal analysis, Y.Y., X.J. and L.S.; investigation, Y.W., Y.Z. (Yao Zhang), S.W. and J.X.; resources, L.X., W.L., Y.Z. (Yao Zhang), Q.Y. and Z.W.; data curation, L.X.; writing—original draft preparation, L.X.; writing—review and editing, J.X., S.W. and J.H.; visualization, W.L., X.J., Y.H., Q.Y. and Z.W.; supervision, J.H. and Y.Z. (Yongjun Zhang); project administration, J.H. and Y.Z. (Yongjun Zhang); funding acquisition, J.H. All authors have read and agreed to the published version of the manuscript.

Funding

This research was funded by Hubei Province Major Basic Research Development Program (2020BCB045).

Institutional Review Board Statement

The animal study protocol was approved by approved the Animal Care and Ethics Committee of Tongji Medical College at Huazhong University of Science and Technology (NO. 2563, June 2020).

Informed Consent Statement

Not applicable.

Data Availability Statement

The data presented in this work are available in the article and supplementary materials.

Acknowledgments

Zhongze Cheng (School of Pharmacy, Weifang Medical University) was appreciated for metabolite structure analysis.

Conflicts of Interest

The authors declare no conflict of interest.

References

  1. World Health Organization. Available online: https://www.who.int/publications/i/item/global (accessed on 1 September 2022).
  2. Asrani, S.K.; Mellinger, J.; Arab, J.P.; Shah, V.H. Reducing the global burden of alcohol-associated liver disease: A blueprint for action. Hepatology 2021, 73, 2039–2050. [Google Scholar] [CrossRef] [PubMed]
  3. Jiang, H.; Room, R.; Hao, W. Alcohol and related health issues in China: Action needed. Lancet. Glob. Health 2015, 3, e190–e191. [Google Scholar] [CrossRef] [PubMed] [Green Version]
  4. Pearson, M.M.; Kim, N.J.; Berry, K.; Moon, A.M.; Su, F.; Vutien, P.; Green, P.K.; Williams, E.C.; Ioannou, G.N. Associations between alcohol use and liver-related outcomes in a large national cohort of patients with cirrhosis. Hepatol. Commun. 2021, 5, 2080–2095. [Google Scholar] [CrossRef] [PubMed]
  5. Fuchs, F.D.; Fuchs, S.C. The Effect of alcohol on blood pressure and hypertension. Curr. Hypertens. Rep. 2021, 23, 42. [Google Scholar] [CrossRef]
  6. Sushma; Divakar, A.; Kanchan, S.; Jha, G.; Mishra, S.; Sharma, D.; Rath, S.K. Alcohol induced impairment/abnormalities in brain: Role of micrornas. Neurotoxicology 2021, 87, 11–23. [Google Scholar] [CrossRef] [PubMed]
  7. Zhu, F. Buckwheat starch: Structures, properties, and applications. Trends Food Sci. Technol. 2016, 49, 121–135. [Google Scholar] [CrossRef]
  8. Ge, R.H.; Wang, H. Nutrient components and bioactive compounds in Tartary buckwheat bran and flour as affected by thermal processing. Int. J. Food Prop. 2020, 23, 127–137. [Google Scholar] [CrossRef] [Green Version]
  9. Zhu, F. Chemical composition and health effects of Tartary buckwheat. Food Chem. 2016, 203, 231–245. [Google Scholar] [CrossRef]
  10. Luthar, Z.; Golob, A.; Germ, M.; Vombergar, B.; Kreft, I. Tartary buckwheat in human nutrition. Plants 2021, 10, 700. [Google Scholar] [CrossRef]
  11. Jing, R.; Li, H.Q.; Hu, C.L.; Jiang, Y.P.; Qin, L.P.; Zheng, C.J. Phytochemical and pharmacological profiles of three fagopyrum buckwheats. Int. J. Mol. Sci. 2016, 17, 589. [Google Scholar] [CrossRef]
  12. Qin, P.; Ma, T.; Wu, L.; Shan, F.; Ren, G. Identification of Tartary buckwheat tea aroma compounds with gas chromatography-mass spectrometry. J. Food Sci. 2011, 76, S401–S407. [Google Scholar] [CrossRef]
  13. Guo, X.; Zhu, K.; Zhang, H.; Yao, H. Purification and characterization of the antitumor protein from Chinese tartary buckwheat (Fagopyrum tataricum Gaertn.) water-soluble extracts. J. Agric. Food Chem. 2007, 55, 6958–6961. [Google Scholar] [CrossRef] [PubMed]
  14. Choi, S.Y.; Choi, J.Y.; Lee, J.M.; Lee, S.; Cho, E.J. Tartary buckwheat on nitric oxide-induced inflammation in RAW264.7 macrophage cells. Food Funct. 2015, 6, 2664–2670. [Google Scholar] [CrossRef]
  15. Lee, M.S.; Shin, Y.; Jung, S.; Kim, S.Y.; Jo, Y.H.; Kim, C.T.; Yun, M.K.; Lee, S.J.; Sohn, J.; Yu, H.J.; et al. The Inhibitory effect of Tartary Buckwheat extracts on adipogenesis and inflammatory response. Molecules 2017, 22, 1160. [Google Scholar] [CrossRef] [Green Version]
  16. Yao, Y.; Shan, F.; Bian, J.; Chen, F.; Wang, M.; Ren, G. D-chiro-inositol-enriched Tartary buckwheat bran extract lowers the blood glucose level in KK-Ay mice. J. Agric. Food Chem. 2008, 56, 10027–10031. [Google Scholar] [CrossRef] [PubMed]
  17. Zhong, L.; Lin, Y.; Wang, C.; Niu, B.; Xu, Y.; Zhao, G.; Zhao, J. Chemical profile, antimicrobial and antioxidant activity assessment of the crude extract and its main flavonoids from Tartary buckwheat sprouts. Molecules 2022, 27, 374. [Google Scholar] [CrossRef] [PubMed]
  18. Jin, H.M.; Wei, P. Anti-fatigue properties of Tartary buckwheat extracts in mice. Int. J. Mol. Sci. 2011, 12, 4770–4780. [Google Scholar] [CrossRef] [Green Version]
  19. Hu, Y.; Zhao, Y.; Yuan, L.; Yang, X. Protective effects of Tartary buckwheat flavonoids on high TMAO diet-induced vascular dysfunction and liver injury in mice. Food Funct. 2015, 6, 3359–3372. [Google Scholar] [CrossRef]
  20. Jin, H.R.; Lee, S.; Choi, S.J. Pharmacokinetics and protective effects of Tartary buckwheat flour extracts against ethanol-induced liver injury in rats. Antioxid 2020, 9, 913. [Google Scholar] [CrossRef]
  21. Cao, P.; Wu, Y.; Li, Y.; Xiang, L.; Cheng, B.; Hu, Y.; Jiang, X.; Wang, Z.; Wu, S.; Si, L.; et al. The important role of glycerophospholipid metabolism in the protective effects of polyphenol-enriched Tartary buckwheat extract against alcoholic liver disease. Food Funct. 2022. [Google Scholar] [CrossRef]
  22. Yang, Q.; Luo, C.; Zhang, X.; Liu, Y.; Wang, Z.; Cacciamani, P.; Shi, J.; Cui, Y.; Wang, C.; Sinha, B.; et al. Tartary buckwheat extract alleviates alcohol-induced acute and chronic liver injuries through the inhibition of oxidative stress and mitochondrial cell death pathway. Am. J. Transl. Res. 2020, 12, 70–89. [Google Scholar] [PubMed]
  23. Liu, Y.; Gan, J.; Liu, W.; Zhang, X.; Xu, J.; Wu, Y.; Yang, Y.; Si, L.; Li, G.; Huang, J. Pharmacokinetics and novel metabolite identification of Tartary buckwheat extracts in beagle dogs following co-administration with ethanol. Pharmaceutics 2019, 11, 525. [Google Scholar] [CrossRef] [PubMed] [Green Version]
  24. Ren, Q.; Li, Y.; Wu, C.; Wang, C.; Jin, Y.; Zhang, J. Metabolism of secondary metabolites isolated from Tartary buckwheat and its extract. Food Chem. 2014, 154, 134–144. [Google Scholar] [CrossRef]
  25. Diehl, K.H.; Hull, R.; Morton, D.; Pfister, R.; Rabemampianina, Y.; Smith, D.; Vidal, J.M.; van de Vorstenbosch, C. A good practice guide to the administration of substances and removal of blood, including routes and volumes. J. Appl. Toxicol. 2001, 21, 15–23. [Google Scholar] [CrossRef]
  26. Liang, C.; Zhang, X.; Diao, X.; Liao, M.; Sun, Y.; Zhang, L. Metabolism profiling of nevadensin in vitro and in vivo by UHPLC-Q-TOF-MS/MS. J. Chromatogr. B Anal. Technol. Biomed. Life Sci. 2018, 1084, 69–79. [Google Scholar] [CrossRef] [PubMed]
  27. Zhang, X.; Yin, J.; Liang, C.; Sun, Y.; Zhang, L. UHPLC-Q-TOF-MS/MS method based on four-step strategy for metabolism study of fisetin in vitro and in vivo. J. Agric. Food Chem. 2017, 65, 10959–10972. [Google Scholar] [CrossRef]
  28. Lee, J.M.; Lee, K.H.; Yoon, Y.-H.; Cho, E.J.; Lee, S.J.N.P.S. Identification of triterpenoids and flavonoids from the seeds of Tartary buckwheat. Nat. Prod. Sci. 2013, 19, 137–144. [Google Scholar]
  29. Choi, M.; Sathasivam, R.; Nguyen, B.V.; Park, N.I.; Woo, S.-H.; Park, S.U.J.P. Expression analysis of phenylpropanoid pathway genes and metabolomic analysis of phenylpropanoid compounds in adventitious, hairy, and seedling roots of Tartary buckwheat. Plants 2021, 11, 90. [Google Scholar] [CrossRef]
  30. Li, J.; Yang, P.; Yang, Q.; Gong, X.; Ma, H.; Dang, K.; Chen, G.; Gao, X.; Feng, B. Analysis of flavonoid metabolites in buckwheat leaves using UPLC-ESI-MS/MS. Molecules 2019, 24, 1310. [Google Scholar] [CrossRef] [Green Version]
  31. Yang, W.; Su, Y.; Dong, G.; Qian, G.; Shi, Y.; Mi, Y.; Zhang, Y.; Xue, J.; Du, W.; Shi, T.; et al. Liquid chromatography-mass spectrometry-based metabolomics analysis of flavonoids and anthraquinones in Fagopyrum tataricum L. Gaertn. (tartary buckwheat) seeds to trace morphological variations. Food Chem. 2020, 331, 127354. [Google Scholar] [CrossRef]
  32. Xu, S.; Liu, Y.; Xiang, L.; Zhou, F.; Li, H.; Su, Y.; Xu, X.; Wang, Q. Metabolites identification of bioactive compounds daturataturin a, daturametelin i, n-trans-feruloyltyramine, and cannabisin f from the seeds of datura metel in rats. Front. Pharmacol. 2018, 9, 731. [Google Scholar] [CrossRef] [PubMed]
  33. Spencer, J.P.; Kuhnle, G.G.; Williams, R.J.; Rice-Evans, C. Intracellular metabolism and bioactivity of quercetin and its in vivo metabolites. Biochem. J. 2003, 372, 173–181. [Google Scholar] [CrossRef] [PubMed] [Green Version]
  34. Lee, Y.J.; Beak, S.Y.; Choi, I.; Sung, J.S. Quercetin and its metabolites protect hepatocytes against ethanol-induced oxidative stress by activation of Nrf2 and AP-1. Food Sci. Biotechnol. 2018, 27, 809–817. [Google Scholar] [CrossRef] [PubMed]
  35. Day, A.J.; Mellon, F.; Barron, D.; Sarrazin, G.; Morgan, M.R.; Williamson, G. Human metabolism of dietary flavonoids: Identification of plasma metabolites of quercetin. Free Radic. Res. 2001, 35, 941–952. [Google Scholar] [CrossRef]
  36. Wang, M.; Sun, J.; Jiang, Z.; Xie, W.; Zhang, X. Hepatoprotective effect of kaempferol against alcoholic liver injury in mice. Am. J. Chin. Med. 2015, 43, 241–254. [Google Scholar] [CrossRef] [Green Version]
  37. Choi, E.H.; Chun, Y.S.; Kim, J.; Ku, S.K.; Jeon, S.; Park, T.S.; Shim, S.M. Modulating lipid and glucose metabolism by glycosylated kaempferol rich roasted leaves of Lycium chinense via upregulating adiponectin and AMPK activation in obese mice-induced type 2 diabetes. J. Funct. Foods 2020, 72, 104072. [Google Scholar] [CrossRef]
  38. Wang, F.; Liu, J.C.; Zhou, R.J.; Zhao, X.; Liu, M.; Ye, H.; Xie, M.L. Apigenin protects against alcohol-induced liver injury in mice by regulating hepatic CYP2E1-mediated oxidative stress and PPARα-mediated lipogenic gene expression. Chem. Biol. Interact. 2017, 275, 171–177. [Google Scholar] [CrossRef] [PubMed]
  39. Zhang, J.; Liang, X.; Li, J.; Yin, H.; Liu, F.; Hu, C.; Li, L. Apigenin attenuates acetaminophen-induced hepatotoxicity by activating amp-activated protein kinase/carnitine palmitoyltransferase i pathway. Front. Pharmacol. 2020, 11, 549057. [Google Scholar] [CrossRef]
  40. Leal, A.; de Oliveira, A.P.; Santos, R.F.D.; Soares, J.M.D.; Lavor, E.M.; Pontes, M.C.; Lima, J.T.; Santos, A.; Tomaz, J.C.; Oliveira, G.G.; et al. Determination of phenolic compounds, in vitro antioxidant activity and characterization of secondary metabolites in different parts of Passiflora cincinnata by HPLC-DAD-MS/MS analysis. Nat. Prod. Res. 2020, 34, 995–1001. [Google Scholar] [CrossRef]
  41. Moon, J.H.; Tsushida, T.; Nakahara, K.; Terao, J. Identification of quercetin 3-O-beta-D-glucuronide as an antioxidative metabolite in rat plasma after oral administration of quercetin. Free Radic. Biol. Med. 2001, 30, 1274–1285. [Google Scholar] [CrossRef]
  42. Mullen, W.; Boitier, A.; Stewart, A.J.; Crozier, A. Flavonoid metabolites in human plasma and urine after the consumption of red onions: Analysis by liquid chromatography with photodiode array and full scan tandem mass spectrometric detection. J. Chromatogr. A 2004, 1058, 163–168. [Google Scholar] [CrossRef] [PubMed]
  43. Guo, J.; Xue, C.; Shang, E.X.; Duan, J.A.; Tang, Y.; Qian, D. Identification of hyperoside metabolites in rat using ultra performance liquid chromatography/quadrupole-time-of-flight mass spectrometry. J. Chromatogr. B Anal. Technol. Biomed. Life Sci. 2011, 879, 1987–1992. [Google Scholar] [CrossRef] [PubMed]
  44. Kachlicki, P.; Piasecka, A.; Stobiecki, M.; Marczak, Ł. Structural characterization of flavonoid glycoconjugates and their derivatives with mass spectrometric techniques. Molecules 2016, 21, 1494. [Google Scholar] [CrossRef] [PubMed] [Green Version]
  45. Domingo-Almenara, X.; Montenegro-Burke, J.R.; Benton, H.P.; Siuzdak, G. Annotation: A computational solution for streamlining metabolomics analysis. Anal. Chem. 2018, 90, 480–489. [Google Scholar] [CrossRef] [Green Version]
  46. Gathungu, R.M.; Larrea, P.; Sniatynski, M.J.; Marur, V.R.; Bowden, J.A.; Koelmel, J.P.; Starke-Reed, P.; Hubbard, V.S.; Kristal, B.S. Optimization of electrospray ionization source parameters for lipidomics to reduce misannotation of in-source fragments as precursor ions. Anal. Chem. 2018, 90, 13523–13532. [Google Scholar] [CrossRef]
  47. Xu, Y.F.; Lu, W.; Rabinowitz, J.D. Avoiding misannotation of in-source fragmentation products as cellular metabolites in liquid chromatography-mass spectrometry-based metabolomics. Anal. Chem. 2015, 87, 2273–2281. [Google Scholar] [CrossRef] [Green Version]
  48. Parcher, J.F.; Wang, M.; Chittiboyina, A.G.; Khan, I.A. In-source collision-induced dissociation (IS-CID): Applications, issues and structure elucidation with single-stage mass analyzers. Drug Test. Anal. 2018, 10, 28–36. [Google Scholar] [CrossRef]
  49. Watson, D.G. A rough guide to metabolite identification using high resolution liquid chromatography mass spectrometry in metabolomic profiling in metazoans. Comput. Struct. Biotechnol. J. 2013, 4, e201301005. [Google Scholar] [CrossRef]
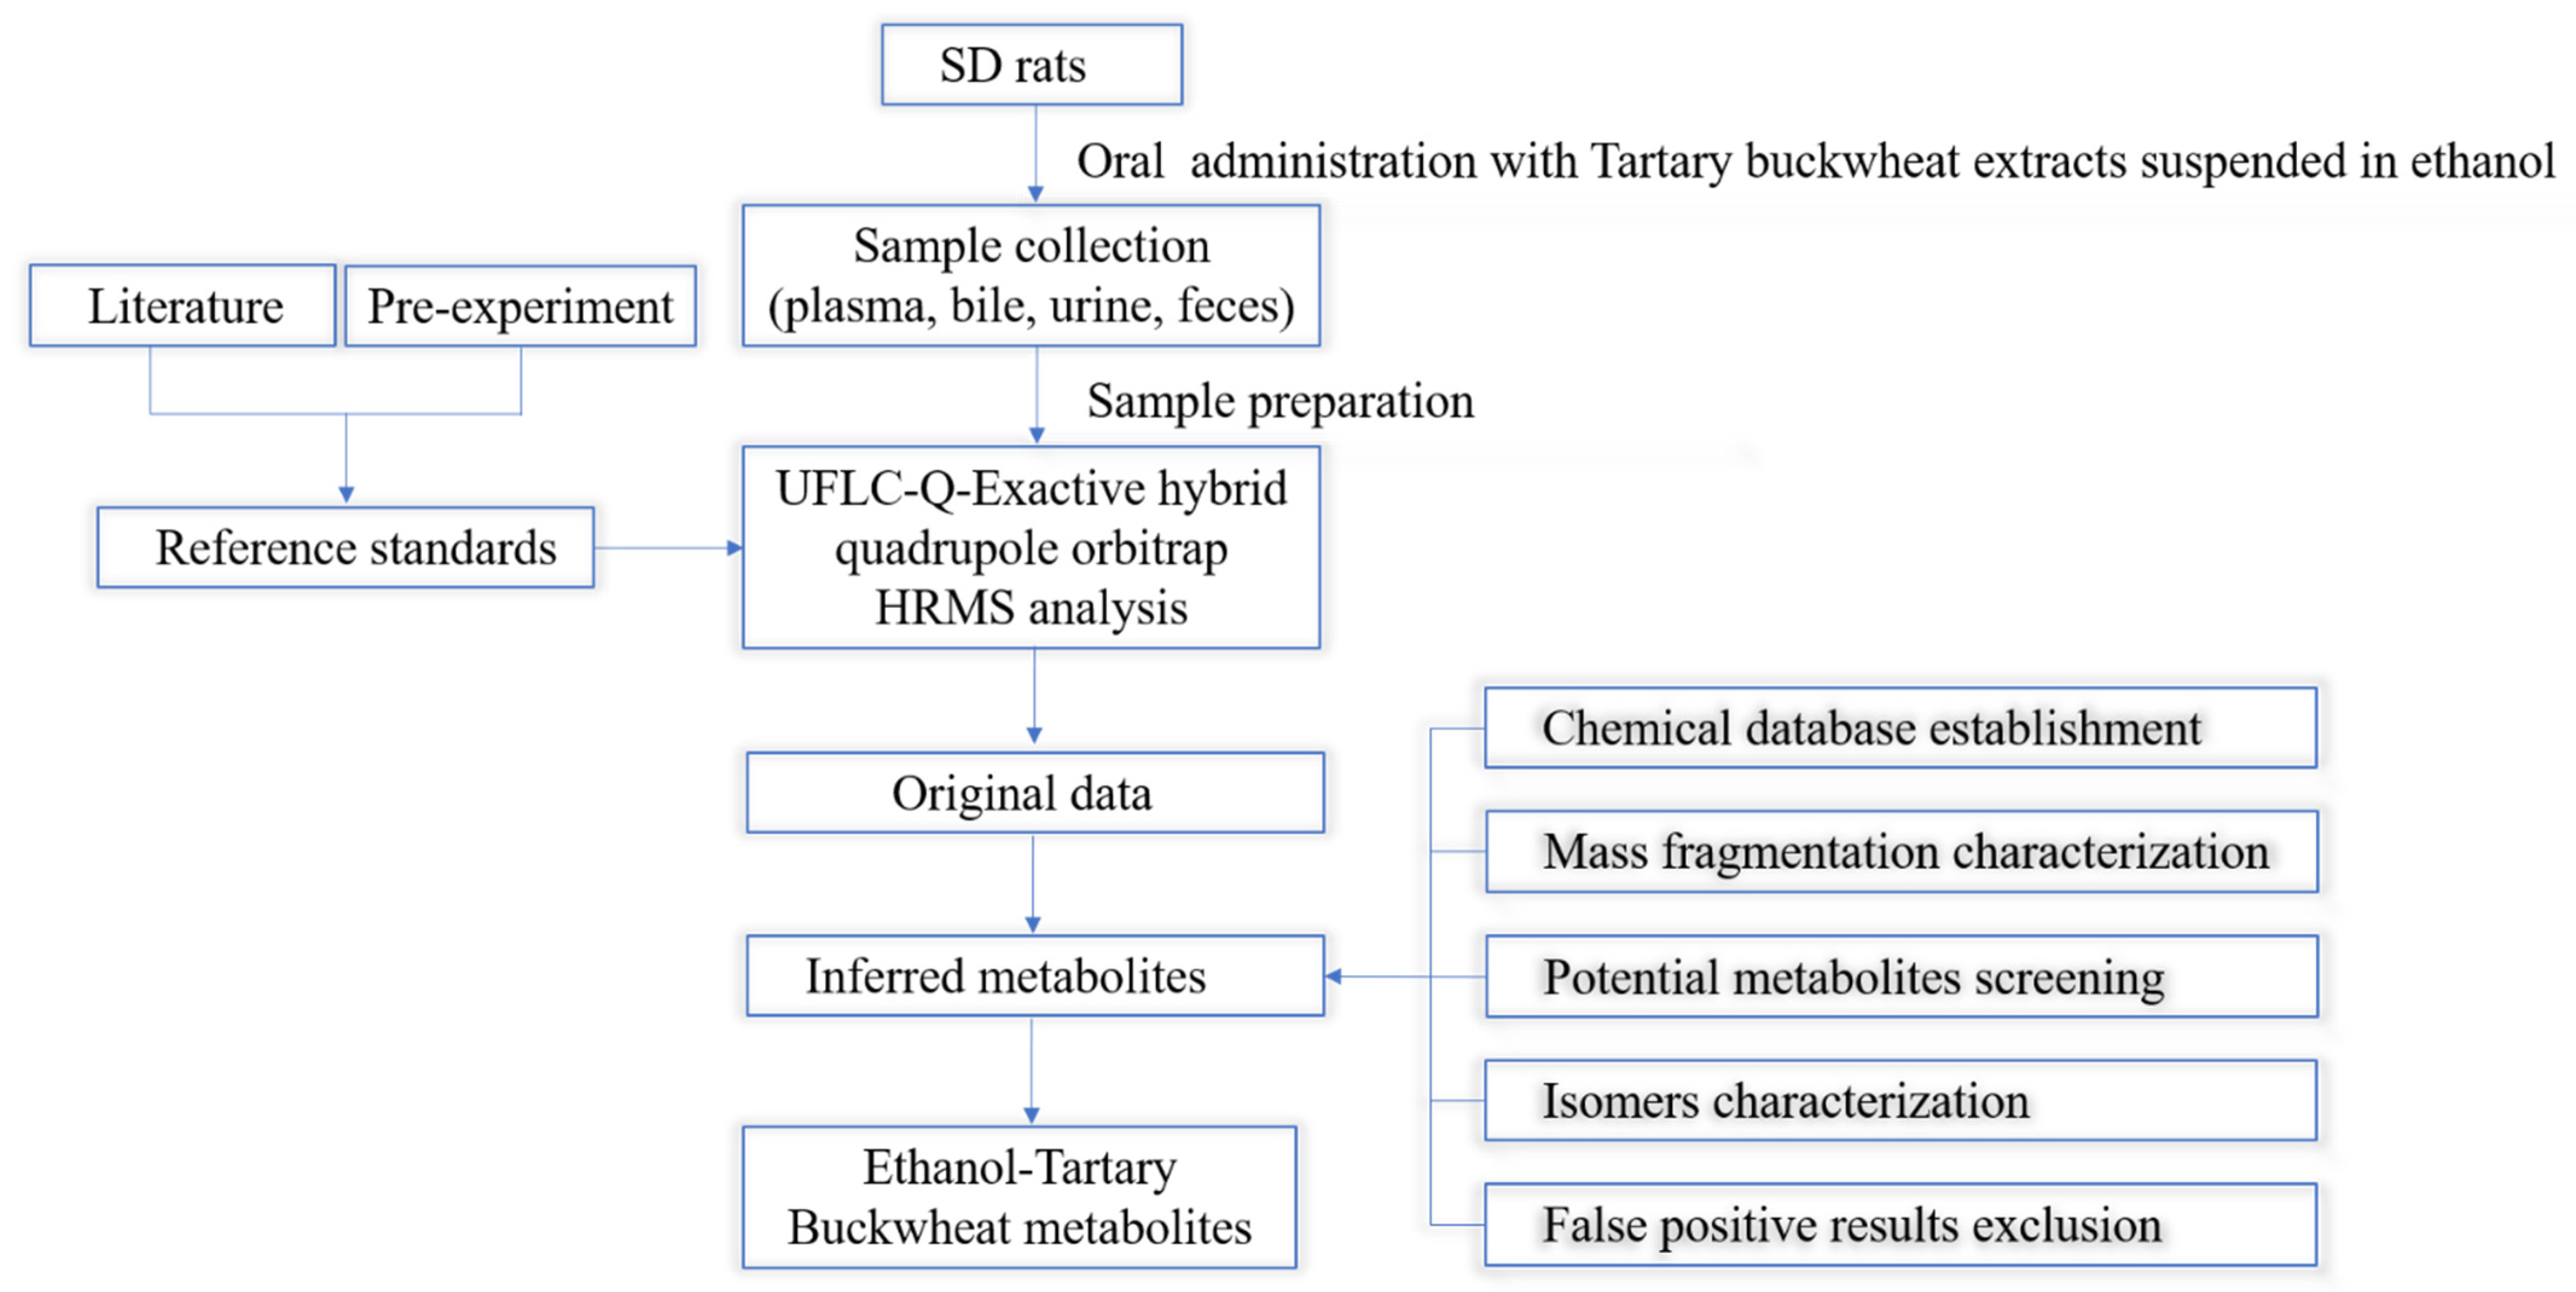
Figure 1. Established metabolite identification and analysis strategy for Tartary buckwheat extract metabolites in rats following co-administration of ethanol.
Separations 09 00407 g001
Figure 2. The typical chromatogram (A) and MS/MS (MS2) spectra (B) of chemical components (TB1-TB7) of Tartary buckwheat extracts. TB1: Rutin; TB2: Kaempferol-3-O-rutinoside; TB3: N-trans-Feruloyltyramine; TB4: Quercetin; TB5: Kaempferol; TB6: Apigenin; TB7: Acacetin.
Separations 09 00407 g002
Figure 3. Extracted ion chromatograms of the novel metabolites of Tartary buckwheat extracts identified in rat plasma, bile, urine and feces after co-administration with ethanol.
Separations 09 00407 g003
Figure 4. The MS2 spectra of metabolites detected in rat plasma after oral co-administration of Tartary buckwheat extracts with ethanol.
Separations 09 00407 g004
Figure 5. The proposed metabolic pathways of (A) quercetin, (B) kaempferol, (C) apigenin and (D) acacetin in Tartary buckwheat extracts in rat biological samples (a. hydroxylation, b. sulfation, c. methylation, d. acetylation, e. glucuronidation).
Separations 09 00407 g005
Figure 6. Identification of in-source fragmentation and isotopic peaks: (A) extracted ion chromatogram of in-source fragment or isotopic peaks; (B) fragment ions for M5 and its in-source fragmentation peak; (C) fragment ions for M1 and its isotopic peak.
Separations 09 00407 g006
Table 1. Mass spectrometric information of proposed major chemical components in Tartary buckwheat extracts.
No. tR (min)Formula[M+H]+ (m/z)Error (ppm)Fragment Ions (m/z)Identification
TB127.22 C27H30O16611.1606 −0.98 611, 465, 303Rutin
TB230.00 C27H30O15595.1665 0.34 595, 449, 287Kaempferol-3-O-rutinoside
TB330.15 C18H19NO4314.1383 −2.86 314, 299, 177, 145, 121N-trans-Feruloyltyramine
TB431.69 C15H10O7 303.0501 −1.32 303, 285, 257, 229, 201, 165, 153, 121 Quercetin
TB533.40 C15H10O6287.0551 −1.74 287, 213, 165, 153, 121Kaempferol
TB633.66 C15H10O5271.0603 −1.11 271, 189, 153Apigenin
TB736.24 C16H12O5285.0759 −1.40 285, 271, 242, 191Acacetin
Table 2. Summary of the metabolites of Tartary buckwheat extracts in rat plasma (P), bile (B), urine (U) and feces (F).
No.tR
(min)
Formula[M+H]+ (m/z)Error
(ppm)
Fragment Ions (m/z)SourceStructural IdentificationMetabolic Pathway
M110.03C21H18O15S543.0443−0.37463, 367, 287BKaempferol glucuronide sulphateGlucuronidation, Sulfation
M210.23C21H18O16S559.0383−1.97479, 383, 303BQuercetin glucuronide sulphateGlucuronidation, Sulfation
M312.47C16H12O8S365.0320−3.01285BAcacetin-5/7-sulphateSulfation
M413.35C21H18O14S527.0483−2.47351, 271BApigenin glucuronide sulphateGlucuronidation, Sulfation
M513.82C28H32O17641.1660−9.05641, 480, 465, 321, 303UQuercetin glucoside glucuronideGlucuronidation
M617.71C21H18O11447.0918−2.01271BApigenin glucuronideGlucuronidation
M718.09C22H20O11461.1073−2.39285BAcacetin-5/7-O-glucuronideGlucuronidation
M820.88C21H18O11447.0917−2.24271BApigenin glucuronideGlucuronidation
M923.54C21H18O13479.0819−1.46303, 285, 257, 225B, FQuercetin glucuronideGlucuronidation
M1028.23C18H20O3285.1478−4.56285, 271, 267, 239, 133FMethyl apigeninMethylation
M1128.60C22H20O13493.0966−3.24317PMethyl quercetin glucuronideMethylation, Glucuronidation
M1228.74C15H10O11S399.00496.77399, 319, 303, 245, 229FHydroxyl quercetin sulphateHydroxylation, Sulfation
M1329.32C21H18O12463.0859−3.89359, 287P3-OH kaempferol glucuronideGlucuronidation
M1429.36C22H20O13493.0966−3.24317PMethyl quercetin glucuronideMethylation, Glucuronidation
M1530.15C22H20O13493.0966−3.24317PMethyl quercetin glucuronideMethylation, Glucuronidation
M1630.29C15H10O8S351.0160−4.27351, 271B, UApigenin sulphateSulfation
M1730.56C16H12O7317.0655−1.89303, 285, 165B3′-/4′-Methyl quercetinMethylation
M1830.71C21H18O13479.0809−3.55479, 303PQuercetin glucuronideGlucuronidation
M1931.31C15H10O10S383.0056−4.44303PQuercetin sulphateSulfation
M2033.04C21H18O13479.0820−1.25303PQuercetin glucuronideGlucuronidation
M2133.22C15H10O8S351.0166−2.56271PApigenin sulphateSulfation
M2233.71C16H12O7317.0650−3.47302, 285PMethyl quercetinMethylation
M2335.11C25H20O10481.1120−3.12481, 315, 287FHydroxyl kaempferol glucosideHydroxylation
M2435.17C30H18O8507.1075−0.99507, 465, 447, 357FAcetylated methyl hydroxyl quercetin xylosideMethylation, Hydroxylation, Acetylation
M2535.38C21H18O12463.0871−1.30359, 287P5-OH Kaempferol glucuronideGlucuronidation
M2637.00C15H10O10S383.0060−3.39303PQuercetin sulphateSulfation
Table 3. The false positive metabolites of Tartary buckwheat extracts in rat biological samples.
No.MetaboliteRetention Time of True Metabolite (min)m/zFragments of True MetaboliteRetention Time of False Positive Peakm/z of the False PositivesFragments of False Positive Peak (min)
1Kaempferol glucuronide sulphate10.03543.0443 463, 367, 28710.04 544.0575 a463, 367, 287
2Quercetin glucuronide sulphate10.23559.0383 479, 383, 30310.27 560.0316 a479, 383, 303
3Apigenin glucuronide sulphate13.35527.0483 351, 27113.64 528.0517 a351, 271
4Quercetin glucoside glucuronide13.82641.1660 641, 480, 465, 321, 30313.82 481.1211 b480, 321, 303, 162
5Apigenin glucuronide17.71447.0918 27117.55 448.0948 a271
6Methyl quercetin glucuronide28.60 493.0966 31728.57 494.0988 a317, 302
7Kaempferol glucuronide29.32 463.0859 359, 28729.38 464.0894 a359, 287
8Methyl quercetin glucuronide29.36 493.0966 31729.20 494.0988 a317, 302
9Methyl quercetin glucuronide30.15493.0966 31730.14 494.0988 a317, 302
10Quercetin glucuronide33.04 479.082030333.01 303.0495 b285, 153
11Methyl quercetin33.71 317.0650302, 28533.62 318.0680 a317, 302, 285
a: isotopic peaks; b: in-source fragmentation peaks.
Publisher’s Note: MDPI stays neutral with regard to jurisdictional claims in published maps and institutional affiliations.