Abstract
In this study, we investigated the formation of protein–phenolic complexes from dephenolized hazelnut meal protein isolates (dHPI) and hazelnut skin phenolic extracts (HSE) and their effects on the bioaccessibility of both hazelnut proteins and phenolics. The dHPI–HSE complexes were of considerable size and were dependent on HSE concentration due to aggregation. Although catechin was the main component of HSE, it did not cause aggregation, except for a slight rise in particle size. According to fluorescence quenching, the hazelnut protein–phenolic extract complex had a linear Stern–Volmer plot expressing static quenching between 0–0.5 mM concentration; the interaction was mainly dependent on hydrogen bonding and van der Waals forces (ΔH < 0 and ΔS < 0), and the reaction was spontaneous (ΔG < 0). According to Fourier transform infrared (FTIR) spectroscopy results, higher phenolic extract concentration caused an increase in irregular structures in hazelnut protein, while the lowest catechin and phenolic concentration altered the regular structure. Skin extracts did not alter the digestibility of dephenolized proteins, but dephenolization reduced the degree of hydrolysis by pancreatin. The formation of the protein–phenolic complex had a beneficial effect on the bioaccessibility of hazelnut skin phenols, predominantly those on the galloylated form of the catechins, such as gallocatechin gallate and epigallocatechin gallate. Thus, the bioaccessibility and antioxidant activity analysis results showed that protein–phenolic complexes obtained from hazelnut meal and skin may promote the transition of phenolic compounds from the gastrointestinal tract without degradation.
1. Introduction
Hazelnuts are grown in countries with temperate climates around the world. In 2020, Turkey met most of the world’s requirements in hazelnut production (approximately 63% of the world production), followed by Italy (about 13%) [1]. After cracking their hard shells, they are processed as hazelnut oil, hazelnut paste, or directly used as natural or roasted fine particles. Hazelnut oil and protein contents are approximately 60% and 15%, respectively [2]. On the other hand, the protein content of defatted hazelnut meal after cold-press oil extraction is in the range of 35–41% [3]. Thus, the high protein content of hazelnut meal indicates it to be a potential plant-based protein source.
Protein–phenolic interactions occur with the proteins/phenolics found in the plant during food processing, or after the consumption of phenolics from other food sources [4]. These interactions are covalent or non-covalent and are affected by parameters such as temperature, pH, and types and concentrations of proteins or phenolics [5]. Although this has been a widely investigated subject in recent years, studies on the interactions of plant-based proteins with phenolics are limited. To the best of our knowledge, studies on the interaction of proteins obtained from nuts are also limited to walnuts or peanuts. Therefore, interactions of walnut protein isolate/walnut-hull phenolics [6] and walnut flour/phenolics from walnut flour/hull [7] were investigated in addition to the studies on the effect of walnut phenolics in walnut protein edible coatings [8].
Fluorescence-quenching experiments are based on the decrease in the fluorescence intensity of proteins that results from protein–ligand intermolecular interactions involving collisional effect, ground-state complex formation, no-radical energy transfer, etc. In addition, shifts in λmax may indicate important molecular events (folding/unfolding and position of fluorophore) caused by the interactions between phenolics and proteins. Moreover, fluorescence spectroscopy techniques may help in understanding how many phenolic molecules can bind to the protein and provide information on the thermal stability of this binding and interaction. Using fluorescence spectroscopy for the investigation of protein–phenolic interactions is a useful and novel approach for effectively understanding several features of these interactions in a sample-size and time-friendly manner. FTIR is one of the spectroscopic methods that provides information about the secondary structures of proteins. Moreover, dynamic light scattering (DLS) and ζ-potential are practical complementary techniques that can determine the changes in proteins with the formation of protein–phenolic complexes by monitoring alterations in hydrodynamic radius and charge distribution of the proteins, respectively.
It has been stated that protein–phenolic complexes formed as a result of interaction suppress the antioxidant effects of phenolic compounds during gastrointestinal digestion and form indigestible complexes [5,9]. However, phenols interacting with proteins during gastrointestinal digestion are thought to be protected from oxidation [10]. Therefore, as the gastric chyme waits for a certain time, the appearance of phenolic compounds in the blood may be delayed as a result of protein–phenolic interaction during digestion, and phenolics can be separated from the complexes in the gastrointestinal tract without any change in the total amount of phenolic substances [11].
In fact, there are no available studies that have investigated the interaction between the protein isolate, prepared from hazelnut meal after cold-press oil extraction and removal of remaining oil (defatting), and phenolic compounds obtained from the hazelnut skin via fluorescence spectroscopy techniques. In our study, protein isolate was prepared with hazelnut meal obtained from cold-press oil extraction after removing its remaining oil (defatting) and phenolics (dephenolization). Phenolic compounds were obtained from the hazelnut skin. Protein–phenolic complexes were examined by fluorescence quenching, FTIR analyses, and dynamic light scattering (DLS). Moreover, the bioaccessibility of phenolics after protein–phenolic complexation was also monitored after in vitro gastrointestinal digestion, such that changes in the degree of hydrolysis of proteins by pancreatin were also determined. Based on these results, we also show, for the first time, how to combine the interaction effects of hazelnut protein and phenolics on their gastrointestinal digestibility.
2. Materials and Methods
2.1. Materials
Hazelnut meal (Tombul variety) obtained after cold-press oil extraction, was kindly donated by the Hazelnut Research Institute, Giresun, Turkey. The meal was first characterized for fat, protein, moisture, and ash content by standard methods [12]. Then, the total carbohydrate content was calculated by subtracting the total fat, protein, ash, and moisture contents from 100.
Hazelnut skin was obtained from the roasting process of hazelnuts for direct consumption. α-Amylase (A1031, 1500 U/L), pepsin from porcine gastric mucosa (P7012, ≥25,000 U/mL), porcine bile extract (B8631, 160 mM), pancreatin from porcine pancreas (P7545, 8 × USP), Trolox ((±)-6-hydroxy-2,5,7,8-tetramethylchromane-2-carboxylic acid), DPPH (2,2-diphenyl-1-picrylhydrazyl) and HPLC-grade standards (catechin (C), gallic acid (GA), protocatechuic acid (PCA), gallocatechin gallate (GCG), (-)-epigallocatechin (EGC), epicatechin (EC), (-)-epigallocatechin gallate (EGCG), phlorizin, quercetin 3-O-rhamnoside (Q3R), quercetin (QUE)) were purchased from Sigma-Aldrich (St. Louis, Missouri, USA). Other reagents were purchased from Merck (Darmstadt, Germany). The chemicals were either of analytical or HPLC grade.
2.2. Preparation of Hazelnut Skin Extracts (HSE)
To begin, 200 mL of 70% aqueous ethanol was added to 30 ± 0.1 g of hazelnut skins, vortexed for 1 min, and then sonicated in a cooled ultrasonic bath for 15 min. Next, the treated samples were centrifuged for 10 min at 4000 rpm at 4 °C (Heidolph, Schwabach, Germany), and the supernatant was collected. Then, 200 mL 70% aqueous ethanol was added to the pellet, and this procedure was repeated two more times. Ethanol was evaporated using a rotary evaporator (IKA RV 10 auto pro V, Staufen, Germany), and the aqueous extract was freeze-dried (Christ Alpha 1–2 LD plus, Osterode am Harz, Germany) and kept at −20 °C until further analyses.
2.3. Preparation of Protein Isolate from Hazelnut Meal
Before protein extraction, hazelnut meal was first defatted and then dephenolized. Meal defatting was performed by stirring the meal in n-hexane overnight with a solid/solvent ratio of 1:4, followed by decantation and drying in a fuming hood [13]. Dephenolization of the defatted meal was performed using the same extraction method with hazelnut skin that is explained in Section 2.2. Total proteins were isolated from defatted and dephenolized hazelnut meal by means of alkali extraction and isoelectric precipitation [3,14]. A non-dephenolized sample was also extracted. Hazelnut meals were dissolved in distilled water at a solid/water ratio of 1:12. After pH adjustment to 12 (using 5M NaOH), the mixture was stirred for 1 h at room temperature. After centrifugation at full speed (14 480 g) for 10 min, the supernatant was collected, and the pellets were subjected to two further extractions under the same conditions, with a reduction of the volume of water to 2/3 of the initial. The supernatants were mixed and filtered through Whatman grade-4 filter paper to remove low-density particles. Protein precipitation accrued upon pH adjustment to 4.5 with HCl 5M. The heterogeneous solution was then centrifuged for 5 min at the same speed. The precipitate was dispersed in water, and the pH was readjusted to 7 before freeze-drying the proteins. This last step permitted better solubilization of the lyophilized proteins in the following analysis. The protein contents of the hazelnut meals and protein isolates were analyzed using the Kjeldahl method (nitrogen content × 5.18; AOCS method 950.48 [15]). The protein recovery from hazelnut meal was calculated as the ratio of the proteins extracted from 100 g dry meal (with consideration of the purity) to the meal’s protein content, multiplied by 100.
2.4. Amino Acid Profile of the Hazelnut Protein Isolate
A known amount of freeze-dried and powdered samples was mixed with 4 mL of 6 N HCl, followed by 30 s of nitrogen gas flushing; hydrolysis was carried out by keeping tubes at 110 °C for 24 h, after which hydrolyzed samples were filtered (syringe filter, PES, 0.2 μm) and diluted before AA determination using LC/APCI-MS. A 2 μL sample was injected into an LC-MS system (Agilent 1100 HPLC, Waldbron, Germany) through a C18 Phenomenex column (250 mm × 4.6 μm × 3 μm), which was linked to an Agilent 6120 quadrupole in SIM positive mode (Agilent Technologies, Germany). The peak area was compared to an AA standard mix (Ref# NCI0180. 20,088, Thermo ScientificPierce, Rockford, IL, USA) and quantified using Agilent MassHunter, Qualitative software [16].
2.5. Preparation of Protein–Phenolic Complex Solutions
The total phenolic content of the phenolic extract was calculated as mM catechin equivalent per g with the calibration graph of catechin solutions between 0.10–1 mM.
The mixture of protein and phenolic solutions were prepared according to Günal-Köroğlu et al. [17]. The stock protein solution was at 10 mg/mL concentration, and a dilution series of phenolic extract or catechin between 0–0.5 mM concentrations was prepared.
2.5.1. Particle Size, Size Distribution, and ζ-Potential Determination
Mean particle size, size distribution, and ζ-potential of protein–phenolic complexes were measured using a dynamic light-scattering analyzer (Nano-ZS, Malvern Instruments, Worcestershire, UK). Samples were diluted to a final concentration of 0.1% solid matter in 1X PBS (pH 7.4) to avoid multiple scattering effects [18]. In addition, constant values of the samples concerning refractive index and absorption of 1.33 and 0.1 were considered, respectively [19].
2.5.2. Fluorescence Quenching
Phosphate-buffered saline (10 × PBS) at pH 7 and 25% ethanol solution with PBS were used to dissolve protein and phenolic compounds, respectively. The stock solutions of dHPI and HSE were freshly prepared and mixed at 1:1 (v/v) shortly before analysis. The change in fluorescence emission intensity was measured after 2 min of adding HSE to dHPI. The addition of a constant volume of quencher to the protein solution avoided complications due to dilution effects within titration-type experiments.
A FS5 Spectrofluorometer (Edinburgh Instruments, Livingston, UK) with a 150 W Xenon lamp and a single-photon-counting photomultiplier (PMT) detector were used for all intrinsic fluorescence measurements (Hamamatsu, R928P). The excitation wavelength range (λex) was 280/295 nm, while the emission wavelength range (λem) was 290/310 to 420 nm (measured every 2 nm). Other instrument parameters were a slit width of 2 nm (for excitation and emission) and a photomultiplier (PMT) detector voltage of 1245 V.
The phenolic extracts did not absorb significant energy at the established emission wavelength. However, a blank was still prepared for each phenolic concentration, where the protein solution was replaced by phosphate-buffered saline (PBS). The respective spectrum of each phenolic extract was then subtracted from the emission spectrum of the corresponding mixture. Finally, each measurement was repeated in triplicate, and the mean and standard deviations were calculated.
Stern–Volmer Equation
The Stern–Volmer equation was used at different temperatures (298, 308, 318 K) to determine the fluorescence quenching in Equation (1) [20]:
where F0 is the fluorescence intensity of dHPI solution, F is the fluorescence intensity of dHPI–HSE solutions, [Q] is the concentration of phenolic extract in dHPI solution (mM), τ0 is the lifetime of the fluorophore in the absence of quencher (10−8 s), Ksv is the Stern–Volmer constant, defining the quenching efficiency (M−1), and Kq is equal to Ksv/τ0, the bimolecular quenching constant (M−1 s−1). The Stern–Volmer quenching constant Ksv for the dHPI–HSE system was obtained by the slope of the regression curves of (F0/F) against [Q].
The fluorescence quenching includes both static and dynamic quenching, and the maximum dynamic constant is 2.0 × 10¹⁰ M–1S–1 in an aqueous solution [21]. In the case where Kq is greater than the maximum dynamic constant, static quenching is dominant. The static quenching constants were also calculated in Equation (2) according to the double logarithmic equation [22]:
where KA is the intercept of the plot (binding constant), and n is the slope of the plot (the number of the binding sides).
Thermodynamic Parameters
Van’t Hoff equations were used to calculate the thermodynamic parameters at 298, 308, and 318 K (Equations (3)–(5)) [23,24]:
where KA represents the binding constant, R represents the universal gas constant (8.134 J mol−1 K−1), and T is the experimental temperature (K). ΔH, ΔS, and ΔG represent the changes in the enthalpy (kJ mol−1), entropy (kJ K−1 mol−1), and Gibbs free energy (kJ mol−1), respectively.
The following data (enthalpy change (ΔH) and entropy change (ΔS)) were used to assess the results: (a) hydrophobic forces when ΔH > 0 and ΔS > 0, (b) electrostatic interactions when ΔH < 0 and ΔS > 0, (c) electrostatic and hydrophobic interactions when ΔH > 0 and ΔS < 0, (d) H-bonding and van der Waals forces when ΔH < 0 and ΔS < 0 [25].
2.5.3. Fourier Transform Infrared (FTIR) Spectroscopy
The secondary structure of dHPI+HSE complexes was determined using an FTIR tensor II spectrophotometer (Bruker Optics Inc., Billerica, MA, USA). The materials in powder form were measured as absorbance at room temperature at wavelengths of 400–4000 cm−1. Signals were captured every four scans. The second derivative of the amide I region (1600–1700 cm−1) was smoothened by the Savitzky–Golay algorithm and was deconvoluted using a Gaussian peak-fit model with OriginPro 2022b software (Origin Lab Corporation, Northampton, MA, USA. USA). Relative percentages of the peaks corresponding to intermolecular β-sheet (1610–1645 and 1680–1700 cm−1), random coil (1641–1648 cm−1), α-helix (1648–1656 cm−1), and β-turn (1660–1680 cm−1) were calculated by the area of the deconvoluted peaks [26].
2.6. Assessment of Hazelnut Protein Digestibility by Pancreatin
According to the literature, hazelnut protein isolates are hydrolysed by pancreatin [27,28,29]. As the protein concentrations should be appropriate for proteolysis (protein/water ratio of 1:20), the concentrations of HSE and catechin were made to meet the protein/phenolic ratios used in the fluorescence quenching study. Before pancreatin addition (enzyme/substrate 1:20, w/w) under continuous stirring (400 rpm), the pH and the temperature of the protein–phenolic solutions were adjusted to 8 with 0.5 N NaOH and 40 °C. The pH was maintained and adjusted to 8 (by use of 0.5 N NaOH) every 15 min, and the volume of added NaOH was recorded for 2 h. The enzyme was inactivated by heating the mixture at 95 °C for 15 min [30]. After cooling, the solutions were centrifuged at 5000 g for 30 min to remove the insoluble matter. The supernatant containing the hydrolysates was freeze-dried and then stored at −80 °C until further use [31]. The degree of hydrolysis was calculated according to Adler-Nissen [32] with Equation (6):
where B is the base consumption in liters; Nb is the normality of the base; MP refers to the mass of protein in kg (nitrogen content × 5.18; (AOCS 1990)); htot is the total number of peptide bonds in the protein substrate (meqv/g protein) (the average htot = 8 meqv/g for most of the proteins [33]); α is the average degree of dissociation of the α-NH2 groups released during hydrolysis expressed in Equation (7):
where pK is the average pK of the α-NH2 groups liberated during hydrolysis, assumed to be 8 for hazelnut proteins [34]; the pH at which the proteolysis was conducted is 8, making α = 0.5 and 1/α = 2.
2.7. Simulated In Vitro Gastrointestinal Digestion for HSE Bioaccessibility
In vitro gastrointestinal digestion conditions were applied and the salivary, gastric, or intestinal fluids were prepared according to Minekus et al. [35] with some modifications. The flow diagram of the protocol is given in Figure 1. Considering the detectability of compounds after digestion, 0.5 mM catechin and HSE were used for in vitro gastrointestinal digestion analysis. Digests from the gastric and intestinal phases were centrifuged (Hettich, Tuttlingen, Germany) at 14,000 rpm and 4 °C for 5 min, and the supernatants were kept at 20 °C until further analyses.
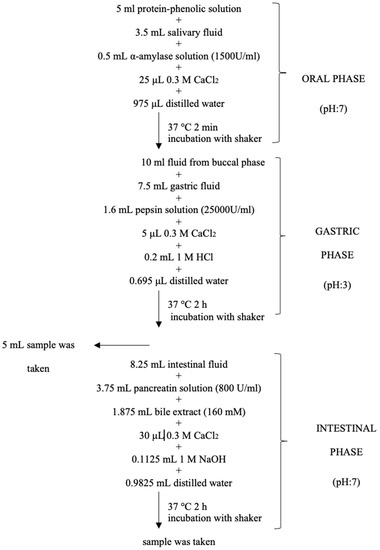
Figure 1.
Flow diagram of simulated in vitro gastrointestinal digestion; pH adjustment was made with 0.1 M HCl or 1 M NaOH for each phase.
2.7.1. Spectrophotometric Analyses
The total phenolic content (TPC) was determined using the Folin–Ciocalteu reagent according to a method modified from Turkmen, Sari, and Velioglu, [36] using gallic acid as a standard.
TPCs in the samples were calculated via the recovery index values of the samples as mg gallic acid equivalent (GAE) per gram extract (R1). TPC of the HSE or catechin solutions (HSE or C) at the initial phase was assumed as reference (R0) and the recovery index of the phenolic compounds (RI) in the samples was calculated according to Equation (8).
The total antioxidant capacity was assessed by two different assays, cupric ion reducing antioxidant capacity (CUPRAC) and DPPH (2,2-diphenyl-1-picrylhydrazyl) methods performed according to Apak et al. [37] and Kumaran and Karunakaran [38], respectively. In all assays, Trolox (6-hydroxy-2,5,7,8-tetramethylchroman-2-carboxylic acid) was used as a standard, and the results were expressed in terms of mg Trolox equivalent (TE) per 100 g of sample.
2.7.2. HPLC-DAD Analysis of Phenolic Compounds
The phenolic profiles of samples were identified using the method of Capanoglu et al. [39]. Sample extracts were filtered with a 0.45 μm membrane filter and analyzed using a Waters 2695 HPLC system equipped with a PDA (Waters 2996) detector. A Supelcosil LC-18 (25 cm × 4.60 mm, 5 μm column Sigma-Aldrich, Steinheim, Germany) was used. The mobile phases were composed of Milli-Q water with 0.1 percent (v/v) trifluoroacetic acid (TFA) (Mobile A) and acetonitrile with 0.1 percent (v/v) TFA (Mobile B). A linear gradient was utilized with 95% solvent A and 5% solvent B at 0 min, 65% solvent A and 35% solvent B at 45 min, and 25% solvent A and 75% solvent B at 47 min, returning to original conditions at 54 min. The flow rate was 1 mL/min. Detection was carried out at 280 and 360 nm. Identification was based on the retention times and distinctive UV spectra. External standards were used for quantification.
2.8. Statistical Analysis
All experiments were replicated three times, and the data were represented as mean ± SD. Data were statistically analyzed for multiple comparisons using SPSS software (version 28, IBM SPSS Inc., Armonk, NY, USA) for analysis of variance (ANOVA). Duncan’s novel multiple-range test was applied to compare different samples (p < 0.05). For size results, values with four digits were analyzed separately from the two- and three-digit groups (due to their extremely high size, all two/three-digit numbers would not seem significantly different).
3. Results and Discussion
3.1. Effect of Dephenolization on Protein Purity, Protein Recovery, and Amino Acid Profile
Proximate composition analyses were conducted on hazelnut meal samples. Protein, fat, ash, moisture, and total calculated carbohydrates of the hazelnut meal were 32.1 ± 1.7, 26.7 ± 1.3, 5.3 ± 0.01, 4.1 ± 0.04, and 31.8 ± 0.4%, respectively.
Dephenolization of hazelnut meal before protein isolation affected both protein recovery and the purity of the protein isolates. Indeed, dephenolization treatment led to a much higher purity of the isolates (98.4 ± 1.0%) than the non-dephenolized sample (78.7 ± 1.3%). However, the protein recovery was significantly lower in the dephenolized sample than that of the non-dephenolized sample (45.6 ± 4.5 vs. 76.7 ± 6.1%), which we assumed to be due to the protein loss during dephenolization treatment (there was a significant decrease in protein content after dephenolization) (Table 1). The amino acid profile of hazelnut meal protein isolate is shown in Table 2.

Table 1.
Protein content and protein recovery from defatted hazelnut meal (dry basis).
Table 2.
Amino acid profile of hazelnut meal protein isolate (mg/g protein).
3.2. Average Particle Size, Size Distribution, and ζ-Charge
The average particle size, polydispersity index (PDI), and ζ-potential of the protein isolates with or without the complexation/presence with/of phenolics are shown in Figure 2. The dephenolization of the protein isolates reduced their average size from 164.2 ± 2.9 nm (HPI) to 73.9 ± 5.6 nm (dHPI). The addition of HSE to dHPI at 0.05 mM resulted in particles of similar size to HPI (190.4 ± 2.9 nm, p-value = 0.8911). Interestingly, the size increased tremendously with the increase of HSE concentrations (1840.7 ± 102.3; 2908.3 ± 45.6 and 7807.3 ± 570.6 nm for dHPI+HSE: 0.125; 0.25; and 0.5 mM, respectively), while dHPI–C resulted in complexes with a size similar to HPI at all tested concentrations (p-values > 0.05). HPI showed a PDI of 0.4 ± 0.01, which increased upon dephenolization (dHPI) to 0.64 ± 0.1 and then decreased to the initial PDI after the addition of catechin (dHPI–C) at all concentrations (p-values > 0.05) (Figure 2A). The lowest PDI was reached by dHPI+HSE at the concentrations of 0.25 and 0.5 mM HSE, at 0.2 ± 0.0 and 0.2 ± 0.0, respectively.
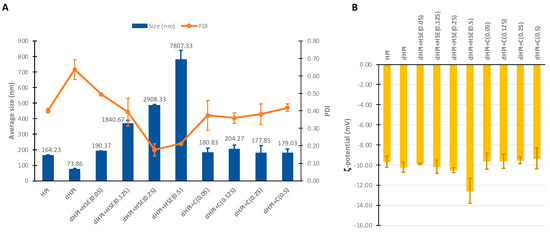
Figure 2.
DLS results of hazelnut protein isolates (HPI), dephenolized HPI (dHPI), and dHPI+HSE/C complexes at different concentrations of phenolics (mM). (A) Average size and polydispersity index (PDI). (B) ζ-potential.
All samples showed net negative surface charges at pH 7.4, as indicated by their ζ-potentials, with no significant differences (avg. ≈ −9.84 mV) except for dHPI+HSE (0.5) which showed higher absolute charge than the other samples (−12.6 ± 1.2 mV) (Figure 2B).
As HSE concentration increases, phenolics may function as bridging agents between protein molecules, leading to the creation of greater protein–phenolic complexes [6,40]. However, catechin did not increase the size of HPI with the same significance as HSE, even though it was the main compound in HSE. This could be ascribed to the presence of other phenolics with larger molecular sizes than catechin in the extract (e.g., GCG, EGC, EGCG, phlorizin, Q3R, QUE, as shown in Section 3.6.2 “HPLC-DAD Analysis of Phenolic Compounds”). Indeed, it has been reported that only phenolic compounds with sufficient size are able to interact with more than one site on the proteins, potentially forming cross-links between distant proteins, a process called the “multidentate” mechanism of protein–phenolic interaction that leads to protein aggregation [41]. In contrast, catechin, a relatively small molecule, would form a layer around the proteins without being able to link between them via the “monodentate” mechanism. Similarly, Dai et al. reported that the saturating level of SPI and catechin binding occurred when the catechin concentration increased over a specific point [42]. Since there was more catechin than SPI binding sites could accommodate, the complex particle size was not further increased.
The precipitation of these samples evidenced the aggregation of HPI+HSE samples after storage (Figure S1 in supplementary data). It is quite predictable for proteins to have a negative net charge in a solution with pH (7.4) above their isoelectric point (pI = 4.5) [43]. The slight increase in the surface charge of dHPI+HSE at the highest concentration of skin extracts could be inferred by this principle later due to the eventual saturation of protein particles with phenolics [43]. Proteins and peptides need to have relatively high absolute ζ-potential in order to avoid their natural tendency to aggregate in the aqueous environment [44]. This, together with the DLS results of the dHPI alone, strengthens the assumption that dHPI+HSE aggregated because of the presence of phenolics, not due to the pH of the medium or an eventual low net charge of the proteins. Bulkier phenolics in the extract had more bonding points (-OH groups) and were in galloylated form, resulting in more intense interactions [10], which may have caused some charged groups (amino acids) to become buried inside the protein such that these groups could no longer contribute to surface charge.
3.3. Fluorescence Quenching
Changes in the intrinsic fluorescence intensities (FI) of dHPI in the presence of an increasing concentration of HSE are shown in Figure 3.
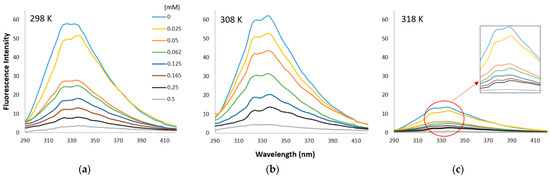
Figure 3.
Fluorescence emission spectra (at λex 280 nm) of dHPI+HSE complex at 298 (a), 308 (b), and 318 K (c) in phosphate buffer solution at pH 7 with an increase in HSE concentration (0–0.5 mM). Each curve represents a triplicate assay after correction for phenol extract fluorescence.
A broad and slightly shouldered peak was observed in the hazelnut protein itself, independent of phenol. This type of fluorescence intensity peak indicates the presence of a high amount of tyrosine (Tyr) amino acid in addition to the tryptophan (Trp). When the amino acid composition of the HPI was controlled, the concentration of Tyr and Trp were calculated as around 19.9 mg/g-protein and 25.3 mg/g-protein, respectively.
The fluorescence emission of the proteins is dominated by Trp, which absorbs at the longest wavelength. In the presence of Trp, although there were phenylalanine (Phen) and Tyr amino acids in the protein, the energy they absorbed was mainly transferred to Trp. Protein fluorescence is generally excited at 280 nm, but Phen displays a structured emission with a maximum near 282 nm. Therefore, Phen, having a very small quantum yield, was not excited as in this study. The emission maximum of Tyr and Trp in water occurs at 303 nm and 350 nm, respectively. Thus, in Figure 3, the observed emission peaks were due to the absorption of both Tyr and Trp at 280 nm. On the other hand, resonance energy transfers repeatedly occur from Tyr to Trp, so only a minor contribution of Try to the emission of most proteins can be observed.
To display the emission of Trp alone, the fluorescence intensity of the same samples was also excited at 295 nm, where the absorption is primarily due to Trp and no excitation of Tyr exists. In Figure 4, the fluorescence intensity of dHPI obtained at λex = 295 nm was much lower than 280 because only the Trp residues were excited at this wavelength, having a a lower quantum yield. This decreased fluorescence intensity at 295 nm was another indicator of the presence of Tyr in terms of the contribution of Tyr to the higher fluorescence intensity at 280 nm.
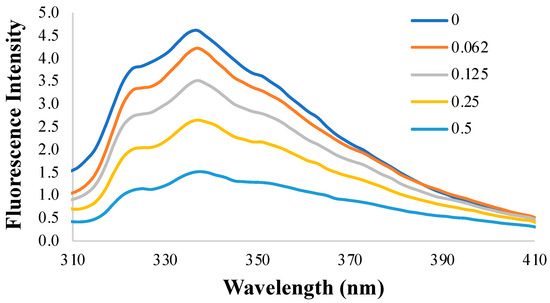
Figure 4.
Fluorescence intensity results of dHPI at the excitation wavelength of 295 nm with an increase in HSE concentration (0–0.5 mM) in PBS at pH 7 and room temperature.
There was a continuous decrease in the fluorescence intensity of HPI when the phenol concentration increased from zero to 0.5 mM at all temperature conditions. This means that a fluorescence quenching of hazelnut proteins was induced by phenolic extracts. Fluorescence quenching is the decrease of the quantum yield of fluorescence from a fluorophore and is induced by a variety of molecular interactions with quencher molecules [20]. For quenching, molecular contact is required between the fluorophore and the quencher. Due to molecular interaction or the change in the solvent composition, the excitation and emission behavior of fluorophores can be changed. For instance, Tyr is relatively insensitive to solvent polarity, while Trp is highly dependent upon polarity and/or the local environment [21] due to its unique complexity in having two nearby isoenergetic transitions. In contrast, emission from tyrosine appears to occur from a single electronic state.
The quenching ability of HSE (0–0.5 mM) on the fluorescence emission of native hazelnut protein was investigated at different temperatures (298, 308, 318 K) (Figure 3). The intensity of the fluorescence dropped considerably as the HSE concentration was increased at all temperatures.
When the effect of temperature on the changes in fluorescence intensity was compared in the presence of phenol extracts, no significant change was observed between 298 and 308 K (Figure 3). However, the further increase in temperature to 318 K resulted in a rapid decrease in protein fluorescence intensity, indicating that the hazelnut protein was thermally unstable at this temperature.
Although the phenol induced a decrease in fluorescence intensity, λmax for HPI was measured at 340 nm, which is the expected λmax for the indole group of Trp alone (Figure 4). Moreover, linear Stern–Volmer curves were observed at all temperature conditions (Figure 5a). This usually means that all main fluorescing residues of the protein were equally accessible to the solvent. If two fluorophore populations are present, and one class is not accessible to the quencher, then the Stern–Volmer plots will deviate from linearity toward the x-axis.
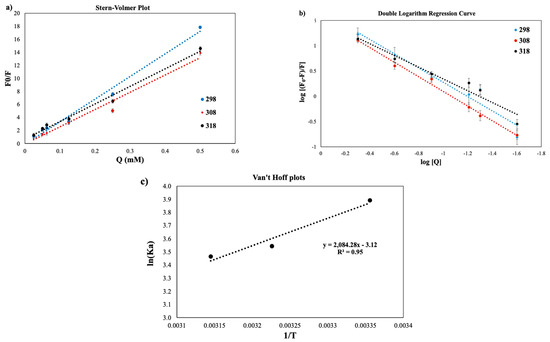
Figure 5.
Stern–Volmer plots (a), double logarithm regression curves (b), and Van’t Hoff plots (c) for dHPI+HSE complex at different temperatures (blue: 298 K; red: 308 K; black: 318 K) to calculate the number of binding sites (n), binding constant (KA), and thermodynamic parameters.
The fraction of accessible fluorescence was calculated from Equation (9):
F0/ΔF was found linear to 1/[Q] so that the slope gave 1/(fa Ka), and from the intercept to ordinate, 1/fa was found. Then, the effective quenching constant for the accessible fluorophore (Ka) was calculated as the ratio of 1/fa to 1/(fa Ka). The linear lines intersected the y-axis at a value of around 1, meaning that all the fluorescence was due to quenchable Trp. These data, therefore, conform to the assumptions from the Stern–Volmer curves that all the main fluorescing tryptophan residues were quenchable and no others buried within the protein or unavailable to the quencher are expected.
3.3.1. Stern–Volmer Plots
Stern–Volmer plots were obtained in Figure 5a by plotting the F and F0 values versus the phenolic extract concentration [Q] at different temperatures. The linearity of the Stern–Volmer plot indicates that there is only one quenching mechanism, which can be static or dynamic. The maximum dynamic bimolecular quenching constant (Kq) is 2 × 10¹⁰ M−1 s−1, while the major quenching process is static if Kq values are higher than this value [45,46]. Kq values of dHPI+HSE complexes were calculated as 34.716, 26.548, and 27.001 at 298, 308, and 318 K, respectively, indicating that the major quenching mechanism was static.
A non-fluorescent ground-state complex is formed between the fluorophore and quencher via static quenching [21], while the Stern–Volmer constant (Ksv) is lower at higher temperatures. The decrease in Ksv values as the temperature increases is observed in the case of the static quenching mechanism [22,47] due to its negative effect on the stability of complex formation [23,48,49].
Relatively high values were obtained from the Ksv values determined for β-lactoglobulin/α-casein/β-casein–catechin/derivatives complexes in the literature [50,51]. A fluorophore buried in a macromolecule is usually inaccessible to water-soluble quenchers, so the value of K is low. Larger values of K are found if the fluorophore is free in solution or on the surface of a biomolecule [21], and it is known that β-lactoglobulin has one Trp residue on the surface of the protein molecule and is accessible to the solvent [52]. Moreover, it has been reported in some studies that galloylated forms have higher binding affinity compared to catechin [50,51]. Relatively larger phenolic compounds provide two or more aromatic rings and hydroxyl groups for interactions. It was also reported that phenols with galloylated monomers (epigallocatechin gallate, EGCG) have a higher affinity for whey protein or β-lactoglobulin binding than non-gallate ones (gallic acid, chlorogenic acid, ferulic acid) [23,45]. The molecular weight of phenols, their structural flexibility, and the number of OH groups in their structures have greatly affected the formation of multiple bonds, as well as an increase in hydrophobicity with size [10]. Many of the phenolics found in HSE were in galloylated or glycosylated form, as well as a mixture of these. This explains the high binding affinity found in this study.
The number of binding sites (n) was calculated from the double logarithm regression curve (Figure 5b). The n values at all temperature conditions were greater than 1 as a result of intermolecular cross-linking between proteins at all temperatures, indicating that at least one phenol molecule independently interacted with the protein, while the other phenolic compound may have formed a bridge between the proteins. In addition, the decrease in Ka values with temperature indicates that the protein–phenolic interaction is exothermic, and the stability of the complex decreases [53].
3.3.2. Thermodynamic Parameters
Thermodynamic parameters were calculated from Van’t Hoff plot (Figure 5c) and are shown in Table 3. Since ΔH < 0 and ΔS < 0, hydrogen bonding and van der Waals forces were the main interaction mechanism between the dHPI and HSE. Since ΔH > ΔS, dHPI+HSE interaction was induced primarily by enthalpy [54]. Negative entropy (ΔS) resulted in an unfavorable increase in molecular order upon complex formation. The decrease in conformational mobility in the protein, as well as the exposure of hydrophobic surfaces to the solvent, both can contribute to unfavorable entropy [55]. Negative enthalpy (ΔH) implies that the enthalpy of the protein–phenolic complex is lower than that of the reactants (protein and phenolics), which relates to (1) the increase in bond enthalpy, the number of the bonds, and bond strength, and (2) immobilization of the sufficiently counteracted ligand by liberation of bound water [56]. Moreover, hydrogen bonding is an exothermic event [55].
Table 3.
Stern-Volmer constants and thermodynamic parameters of dHPI+HSE complex at different temperatures.
Favorable enthalpy contributions overcome unfavorable entropic contributions, and the reaction depends on temperature. Ultimately, molecular interactions must be strong enough due to complex formation to cover the loss of entropy. As temperature rises, hydrophobic interactions grow more powerful, and hydrogen bonds become weaker. A reduction in the binding constant with rising temperature implicates H-bonding as the main force [53].
ΔG for all dHPI–HSE complexation was negative, and the interaction was spontaneous. Generally, protein–phenolic interactions were reported as spontaneous reactions (ΔG < 0). On the other hand, mainly hydrogen bonding and van der Waals forces were responsible for catechin interactions with human serum albumin [56] and bovine serum albumin [57] in the literature.
3.4. Fourier Transform Infrared (FTIR) Spectroscopy
To further investigate whether any structural change of dHPI was associated with phenolic extract interactions, FTIR spectra of dHPIs were recorded with and without the addition of HSE (0.05, 0.125, and 0.25 mM) and catechin (0.125 mM). There are basic FTIR spectrum regions specific to each sample: (1) functional group regions between 1500 and 4000 cm−1 and (2) fingerprint regions between 400 and 1500 cm−1. The fingerprint region is unique for each protein. The characteristics of the side chains, the specifics of the force field, and hydrogen bonding all play a role in the complexity of the fingerprint region bands. In this region, a peak was observed at 1462 cm−1 originating from CH2 bending vibrations and 1396 cm−1 originating from CH3 bending vibrations [58].
Nine distinctive IR bands are produced by the amide groups of the protein backbone (amides A and B and amides I–VII) about the secondary structure and conformation of the protein backbone. The two most noticeable vibrational bands of the protein backbone are amides I (1600–1700 cm−1) and II (1500–1600 cm−1) [59]. The absorbance of dHPI had a characteristic amide I band at 1631 cm−1 (C=O stretching vibrations of peptide linkages), amide II at 1522 cm−1 (C-N stretching, 40% and N-H bending, 60% of amino acids), a wide amide A band at 3273 cm−1 (tensile vibration of intermolecular hydrogen bonding between O–H and N–H stretching occurring in the hydrogen bonds and intermolecular H bonding), and amide B at 2922 cm−1 (CH2 asymmetric stretch) and 2855 cm−1 (CH2 symmetric stretch) [42,58] (Figure 6).
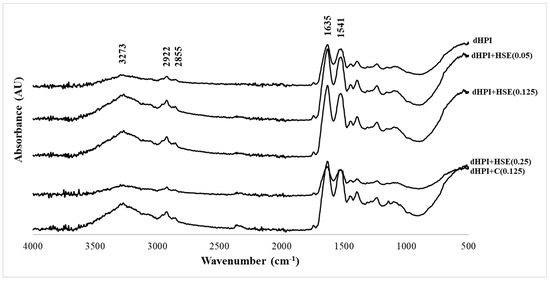
Figure 6.
FTIR spectra of dHPI, dHPI+HSE complex, and dHPI+C complex.
No new bands were formed in dHPI+HSE or dHPI+C complex formation. Thus, the protein–phenolic complex formation was mostly a physical process, and no covalent bonds were created between the matrix and the core [60]. Further, dHPI+HSE or dHPI+C complexes caused differences in all amide bands of native hazelnut protein. The amide A band of dHPI+HSE complexes was slightly shifted to 3276 cm−1, while dHPI+C complex had no shifts. The amide B band is attributable to the C–H tensile vibration of the CH3 and CH2 groups of protein [42]. The amide B band of all dHPI–phenolic complexes was shifted to 2925 cm−1.
Amide I and II bands were red-shifted from 1631/1522 to 1634/1525, 1637/1524, 1637/1524, and 1635/1525 cm−1 for dHPI+HSE (0.05), dHPI+HSE (0.125), dHPI+HSE (0.25), or dHPI+C (0.125) complexes, respectively. Hence, the secondary structure of hazelnut proteins was altered upon extract or catechin complexation (Figure 6). Any change in the intensity of the amide I and II bands was related to the protein C=O, C–N, and N–H groups with hydrogen and hydrophobic interactions [50].
The secondary structure content of samples is given in Table 4. The distinct decrease in the β-turn structure of dHPI+HSE (0.05) complex was supported by the transition to α-helix as with the dHPI+C (0.125) complex. A significant increase in the random coil was observed at the higher phenolic concentration compared to the native dHPI. There was a slight decrease in the α-helix and β-sheet structure of dHPI+HSE (0.25), although the number of random coils was increased. In the presence of phenolic at the lowest concentration (0.25 mM), regular structures (α-helix and β-sheet) increased, and the protein became more stable and rigid. The sum of the regular structures of the native protein was interrupted, and a more unfolded protein was formed via protein–phenolic interaction at medium to higher phenolic extract concentrations.
Table 4.
Intensity values of major FTIR bands and secondary structure content (%) of dHPI–phenolic complexes from FTIR data.
The protein/phenol ratio in the medium is of great importance for the protein–phenolic interaction. At low phenolic concentration (multisite ligand), the interaction regions of the proteins do not reach saturation (multidentate mechanism), and phenolics must be large enough to form bridges between proteins. In these conditions, the irregular structure gradually increased in the presence of phenolic extract at 0.05- and 0.125-mM concentration via the multidentate mechanism. As the phenolic concentration increased, several phenolics interact with one protein (monodentate mechanism) [41]. Most likely, the monodentate mechanism was seen at higher HSE concentrations because it was very close to the saturation point of the protein–phenolic interaction. Eventually, their regular structure of the protein was altered upon phenolic binding. Similar to this study, changes in the amide I band density of complexes with α-/β-casein or β-lactoglobulin and tea phenolic (catechin, epicatechin, epigallocatechin, and epigallocatechin gallate) [50,51] and rice bran protein/catechin complexes [61] were observed depending on the phenolic concentration, and the amide I band intensity increased at low phenol concentration and decreased as the concentration increased. Moreover, it was also reported that conformational changes were more noticeable for epigallocatechin and epigallocatechin gallate compared to catechin and epicatechin, since the bulkier and larger phenolics provided more perturbation [50,51].
3.5. Effect of Phenolics on the Digestibility of Hazelnut Proteins
The rate of hydrolysis of hazelnut proteins by pancreatin was fast during the first hour, then gradually decreased to become almost stagnant between 105 and 120 min, a typical proteolysis trend (Figure 7). Non-dephenolized proteins showed a higher digestibility in comparison with all dephenolized samples for all reaction times (p < 0.05), reaching a maximum of 32.6 ± 1.1% after 2 h. Within the dephenolized samples, the degree of hydrolysis was slightly reduced by the presence of HSE or catechin but progressively retrieved with time until no significant difference was observed after 120 min (DH ≈ 25%). Interestingly, the addition of HSE or catechin to the dephenolized hazelnut proteins did not restore the degree of hydrolysis achieved by non-dephenolized proteins.
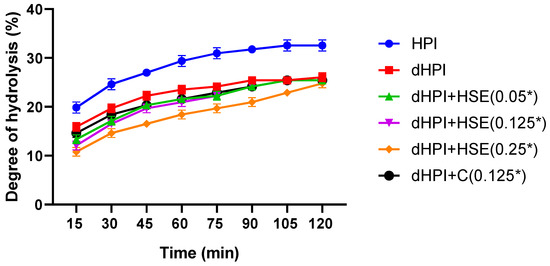
Figure 7.
Degree of hydrolysis of hazelnut protein isolates (HPI), dephenolized HPI (dHPI), and dHPI+HSE/C complexes at different concentrations of phenolics (mM). * The actual concentrations were 16.67 times higher, but protein/phenolic ratios were kept the same as those in the other parts of the study.
Although phenolics may have mostly a negative effect on the digestibility of proteins, data in the literature showed a quite unpredictable effect of phenolic compounds on the enzymatic digestibility of proteins [62]. Ni et al. showed a positive impact of salal fruit phenolic extracts on the degree of hydrolysis of whey protein by Flavourzyme® [63]. On the contrary, Wang and Tang reported an enhancement in the degree of hydrolysis, by trypsin, of buckwheat protein isolates upon dephenolization [64]. The enhancement of hydrolysis by the presence of phenolics may be ascribed to an eventual partial unfolding of the proteins caused by phenolics, facilitating the access of the protease to catalytic sites in non-dephenolized hazelnut protein isolates, which may have enhanced their hydrolysis [63]. This hypothesis is also supported by the decrease in the size of the dHP sample (Figure 2), which could be due to an eventual folding upon dephenolization, making some catalytic sites inaccessible inside the three-dimensional structure of the protein. The fact that the addition of phenolics did not improve the digestibility of the proteins implies that whatever happened upon dephenolization was irreversible. Finally, the recovery of the degree of hydrolysis in dHPI+HSE and dHPI+C after 120 min in comparison with dHPI supports the fact that the interactions between dHPI and phenolic compounds were non-covalent and thus reversible, which is in total correlation with the fluorescence quenching study (Section 3.2).
3.6. Simulated In Vitro Gastrointestinal Digestion
To determine the effect of in vitro gastrointestinal digestion on the phenolic extract and protein–phenolic solutions, total phenolic content and total antioxidant capacities were measured, and individual phenolic compounds were identified for each gastrointestinal digestion phase. The results vary in both extract and protein–phenolic solutions at each stage of in vitro gastrointestinal digestion due to their solubility at acidic or alkaline pH and interactions with enzymes.
3.6.1. Spectrophotometric Analyses
The changes in the total phenolic contents (TPC) of samples and recovery indexes (RI) of phenolic compounds at each digestion phase are shown in Table 5. At the initial phase, the TPC of phenolic solution systems was determined to be in the following order: extract solutions > protein–phenolic solutions. The HSE solutions followed a similar trend as the initial phase in the gastric phase, whereas the TPCs of the c solutions were found as protein–phenolic solution extract solutions. The TPCs of the extract solutions were higher in the intestinal phase than the TPCs of the protein–phenolic solutions, just as they were in the initial phase.
Table 5.
Total phenolic content (TPC), recovery index of phenolic compounds (RI), and antioxidant capacities (DPPH and CUPRAC methods) in gastrointestinal digestion phases.
TPCs of C and dHPI+C showed a significant increase in the intestinal phase compared with the initial phase, following a decreasing trend after gastric digestion. Similar trends were observed in the gastric and intestinal phases of HSE and dHPI+HSE samples, apart from the intestinal phase of HSE. After intestinal digestion, 136.1% and 78.2% of the phenolic compounds were present in the intestinal fraction for C and HSE extract solutions, respectively. However, 98.4% and 68.4% of these compounds were available in the dHPI+C and dHPI+HSE solutions, respectively.
In order to determine the effect of in vitro gastrointestinal digestion on total antioxidant capacity, DPPH and CUPRAC assays were performed. The total antioxidant capacities of initial solutions and gastric and intestinal phases are given in Table 5. The total antioxidant capacities of C and HSE extract solutions throughout the digestive tract varied between 94.0 ± 5.9 to 143.0 ± 0.5 mg TE/g extract and 128.7 ± 0.4 to 181.0 ± 11.9 mg TE/g extract, respectively, whereas the total antioxidant capacities of dHPI+C and dHPI+HSE protein–phenolic solutions ranged from 128.7 ± 0.4 to 181.0 ± 11.9 mg TE/g extract and 62.9 ± 7.0 and 106.8 ± 10.6 mg TE/g extract, respectively, throughout the gastrointestinal tract, according to the DPPH method. The DPPH values of the extract solutions decreased from the initial phase to the intestinal phase. In contrast, the DPPH values of the protein–phenolic solutions increased in the intestinal phase following the decrease in the gastric phase.
The total antioxidant capacities of C and HSE extract solutions across the gastrointestinal system changed from 1067.6 ± 23.0 to 2285.6 ± 90.5 mg TE/g extract and 321.2 ± 22.7 to 705.0 ± 8.9 mg TE/g extract, respectively; on the other hand, the total antioxidant capacities of dHPI+C and dHPI+HSE protein–phenolic solutions varied between 1849.3 ± 35.7 to 2175.0 ± 195.2 mg TE/g extract and 364.5 ± 19.4 and 763.3 ± 8.1 mg TE/g extract, respectively, throughout the digestive tract, according to the CUPRAC method. The CUPRAC values of the extract solutions decreased from the initial phase to the intestinal phase (p < 0.05). In contrast, the DPPH values of the protein–phenolic solutions increased in the intestinal phase following the reduction in the gastric phase (p < 0.05). In addition, the CUPRAC values of the extract solutions showed a significant increase in the intestinal phase compared with the initial phase, following a decreasing trend after gastric digestion (p < 0.05). Similar trends were found in the dHPI+HSE protein–phenolic solution (p < 0.05).
3.6.2. HPLC-DAD Analysis of Phenolic Compounds
The major phenolic compounds of initial and digested extract solutions and protein–phenolic solutions were detected by HPLC-DAD analysis. Comparisons of the phenolic profiles of samples are shown in Table 6. Up to 10 individual phenolic compounds were identified in the samples. Since the phenolic compounds identified in the HSE are mainly composed of catechins, the catechin standard was used as the control group in this study.
Table 6.
Phenolic profiles of initial gastric and intestinal phases of solutions after in vitro GI digestion.
In the analysed HSE initial extract solutions, gallic acid (GA) and protocatechuic acid (PCA) were detected as the hydroxybenzoic acids; gallocatechin gallate (GCG), (-)-epigallocatechin (EGC), catechin (C), epicatechin (EC), and (-)-epigallocatechin gallate (EGCG) were identified as flavanols; quercetin 3-O-rhamnoside (Q3R) and quercetin (QUE) were detected as flavonols, and phlorizin was identified as chalcone. On the other hand, no phenolic compounds were detected in the initial phases of protein–phenolic solutions of both dHPI+C and dHPI+HSE. A lower amount of catechin was observed in the C solution’s gastric phase compared to the initial amount (p < 0.05). Moreover, the amount of C that reappeared in the gastric phase of the dHPI+C solution was significantly lower than the amount determined in the gastric phase of the C solution (p < 0.05). The amounts of detected phenolic compounds other than GA and GCG decreased in the HSE solutions’ gastric phase compared to their initial levels (p < 0.05).
Furthermore, QUE was found to be below the limit of detection for the gastric and intestinal phases of HSE solutions. The phenolic compounds identified in the HSE solution, except for QUE, were re-detected in the gastric phase of the dHPI+HSE solution. There were significant reductions in the quantities of the phenolic compounds, except for PCA and C, between the gastric phases of HSE and dHPI+HSE (p < 0.05). C was metabolized with digestion, and GCG, EGC, C, and EC were detected in the intestinal phases of C and dHPI+C solutions, whereas EGCG was only determined in the C solution. GC and EC were significantly higher in the intestinal phases of the dHPI+C solution than in the C solution (p < 0.05). On the other hand, GA, GCG, EGC, EC and EGCG, and Q3R had better accessibility in the intestinal phase of the dHPI+HSE solution than in the intestinal phase of the HSE solution after digestion (p < 0.05).
To the best of our knowledge, there is no study investigating the changes of phenolic compounds of hazelnut skin during in-vitro gastrointestinal digestion in the literature. In contrast, many studies examined their phenolic profile and antioxidant activities. However, since tea and green tea principally contain high amounts of catechins, the bioaccessibility of tea catechins and the effect of protein–catechin interactions on their digestibility is a trending topic [50,65,66].
The inability to detect phenolic compounds from the initial phases of dHPI+C and dHPI+HSE complexes might be explained by concluding that as recovery lowered or disappeared, catechins and other phenolics bound to proteins more. These findings are in accordance with prior research on tea phenolics and milk proteins [50,66]. However, during the simulated gastric digestion, these bound phenolics and catechins were released from protein–phenolic complexes. The addition of hazelnut meal protein did not affect PCA and C recovery after gastric digestion. GA, GCG, and EGC might be more stable in acidic conditions compared to C, EC, and EGCG, but acid-catalyzed epimerization of EGCG might also occur [65].
GCG and EC were more stable after intestinal digestion in the dHPI+C complex, while EGC, C, and EGCG were more accessible in C solution. Some studies have also reported that EGC and EGCG are unstable, while EC and ECG are relatively stable [67,68]. The difference in intestinal stability of these catechins might be attributable to the fact that three adjacent hydroxyl groups in EGC and EGCG at positions 3′, 4′, and 5′ are more susceptible to the formation of semiquinone free radicals at near-neutral pH when a proton was donated [69]. Additionally, strong protein–flavonoid interactions are mediated by the hydrophobic binding of flavonoids with proline-rich regions of intact proteins and peptide fragments. According to the literature, larger polyphenols with a higher number of aromatic rings and hydroxyl groups are more effective in forming complexes with proline-rich peptides. Gallate catechins ECG, GCG, and EGCG have more aromatic and hydroxyl groups than non-galloylated catechins EC and EGC, resulting in higher binding activity with proteins. As a result, they become more stable during in vitro digestion, which explains GCG and EGCG’s increased bioaccessibility in HSE when complexed with hazelnut protein [65,66].
4. Conclusions
In the presence of hazelnut skin phenolics, large protein complexes were formed, with size depending on the HSE concentration; however, catechin formed relatively smaller complexes. This was related to the fact that the phenolics found in hazelnut skin were bulkier and more flexible. Moreover, it was found that the dominant forces in dHPI+HSE complex formation were hydrogen bonding and van der Waals forces. The reaction depended on temperature and was spontaneous (ΔH < 0; ΔS < 0; ΔG < 0). The interaction of dHPI and HSE caused significant changes in the secondary structure of proteins, which was mainly affected by the phenolic concentration. As phenolic concentration increased, the secondary structure of the protein loosened and the protein became disordered. This situation most likely increased the flexibility of the protein, improving its functional properties in particular. The protein–phenolic interactions principally had a positive effect on the bioaccessibility of hazelnut skin phenolics, mainly on the galloylated form of catechins such as GCG and EGCG. Research on phenolics and plant-based proteins isolated from natural sources is especially important for vegan formulations of foam-like products (mousse) or emulsions (mayonnaise), where the functional properties of proteins are essential. Furthermore, there is no definite opinion on whether the effects of protein–phenolic interactions on the bioavailability of phenols are positive or negative in their consumption. Therefore, more research on this subject must be conducted and brought to the literature.
Supplementary Materials
The following supporting information can be downloaded at https://www.mdpi.com/article/10.3390/separations9120406/s1: Figure S1: Visual evidence of precipitation occurrence in dHPI+HSE samples due to protein-phenolic aggregation.
Author Contributions
F.D.C., H.Y., N.A., B.G.S. and E.C. performed and designed the experiment; F.D.C., H.Y., N.A., D.G.K. and E.C. analyzed the data and wrote the manuscript. All authors have read and agreed to the published version of the manuscript.
Funding
This research was funded by Scientific Research Projects (BAP) Unit of Istanbul Technical University, grant numbers MAB-2022-43465 and MGA-2021-43489.
Conflicts of Interest
The authors declare no conflict of interest.
References
- FAOSTAT. Crops and Livestock Products. Available online: https://www.fao.org/faostat/en/#data/QCL (accessed on 21 October 2022).
- USDA. Food Composition Database. Available online: https://fdc.nal.usda.gov/fdc-app.html#/ (accessed on 21 October 2022).
- Saricaoglu, F.T.; Gul, O.; Besir, A.; Atalar, I. Effect of High Pressure Homogenization (HPH) on Functional and Rheological Properties of Hazelnut Meal Proteins Obtained from Hazelnut Oil Industry by-Products. J. Food Eng. 2018, 233, 98–108. [Google Scholar] [CrossRef]
- Rohn, S. Possibilities and Limitations in the Analysis of Covalent Interactions between Phenolic Compounds and Proteins. Food Res. Int. 2014, 65, 13–19. [Google Scholar] [CrossRef]
- Ozdal, T.; Capanoglu, E.; Altay, F. A Review on Protein–Phenolic Interactions and Associated Changes. Food Res. Int. 2013, 51, 954–970. [Google Scholar] [CrossRef]
- Su, S.; Wan, Y.; Guo, S.; Zhang, C.; Zhang, T.; Liang, M. Effect of Peptide–Phenolic Interaction on the Antioxidant Capacity of Walnut Protein Hydrolysates. Int. J. Food Sci. Technol. 2018, 53, 508–515. [Google Scholar] [CrossRef]
- Labuckas, D.O.; Maestri, D.M.; Perelló, M.; Martínez, M.L.; Lamarque, A.L. Phenolics from Walnut (Juglans regia L.) Kernels: Antioxidant Activity and Interactions with Proteins. Food Chem. 2008, 107, 607–612. [Google Scholar] [CrossRef]
- Grosso, A.L.; Riveros, C.; Asensio, C.M.; Grosso, N.R.; Nepote, V. Improving Walnuts’ Preservation by Using Walnut Phenolic Extracts as Natural Antioxidants through a Walnut Protein-Based Edible Coating. J. Food Sci. 2020, 85, 3043–3051. [Google Scholar] [CrossRef]
- Rawel, H.M.; Rohn, S. Nature of Hydroxycinnamate-Protein Interactions. Phytochem. Rev. 2010, 9, 93–109. [Google Scholar] [CrossRef]
- Jakobek, L. Interactions of Polyphenols with Carbohydrates, Lipids and Proteins. Food Chem. 2015, 175, 556–567. [Google Scholar] [CrossRef]
- Zhang, H.; Yu, D.; Sun, J.; Liu, X.; Jiang, L.; Guo, H.; Ren, F. Interaction of Plant Phenols with Food Macronutrients: Characterisation and Nutritional–Physiological Consequences. Nutr. Res. Rev. 2014, 27, 1–15. [Google Scholar] [CrossRef]
- AOAC. Official Methods of Analysis of the Association of Official Analytical Chemists; The Association: Arlington, VA, USA, 1990; Volume 2. [Google Scholar]
- Saad, N.; Mohd Esa, N.; Ithnin, H.; Husna Shafie, N. Optimization of Optimum Condition for Phytic Acid Extraction from Rice Bran. Afr. J. Plant Sci. 2011, 5, 168–176. [Google Scholar]
- Tatar, F.; Tunç, M.T.; Kahyaoglu, T. Turkish Tombul Hazelnut (Corylus avellana L.) Protein Concentrates: Functional and Rheological Properties. J. Food Sci. Technol. 2015, 52, 1024–1031. [Google Scholar] [CrossRef] [PubMed]
- AOCS. Official Methods and Recommended Practices of the American Oil Chemists’ Society, 15th ed.; Helrich, K., Ed.; AOCS Press: Arlington, VA, USA, 1990; ISBN 0-935584-42-0. [Google Scholar]
- Harrysson, H.; Hayes, M.; Eimer, F.; Carlsson, N.G.; Toth, G.B.; Undeland, I. Production of Protein Extracts from Swedish Red, Green, and Brown Seaweeds, Porphyra Umbilicalis Kützing, Ulva Lactuca Linnaeus, and Saccharina Latissima (Linnaeus) J. V. Lamouroux Using Three Different Methods. J. Appl. Phycol. 2018, 30, 3565–3580. [Google Scholar] [CrossRef]
- Günal-Köroğlu, D.; Turan, S.; Capanoglu, E. Interaction of Lentil Protein and Onion Skin Phenolics: Effects on Functional Properties of Proteins and in Vitro Gastrointestinal Digestibility. Food Chem. 2022, 372, 130892. [Google Scholar] [CrossRef] [PubMed]
- Adrar, N.; Bahadori, F.; Ceylan, F.D.; Topçu, G.; Bedjou, F.; Capanoglu, E. Stability Evaluation of Interdigitated Liposomes Prepared with a Combination of 1,2-Distearoyl-Sn-Glycero-3-Phosphocholine and 1,2-Dilauroyl-Sn-Glycero-3-Phosphocholine. J. Chem. Technol. Biotechnol. 2021, 96, 2537–2546. [Google Scholar] [CrossRef]
- Bernat, N.; Cháfer, M.; Rodríguez-García, J.; Chiralt, A.; González-Martínez, C. Effect of High Pressure Homogenisation and Heat Treatment on Physical Properties and Stability of Almond and Hazelnut Milks. LWT-Food Sci. Technol. 2015, 62, 488–496. [Google Scholar] [CrossRef]
- Papadopoulou, A.; Green, R.J.; Frazier, R.A. Interaction of Flavonoids with Bovine Serum Albumin: A Fluorescence Quenching Study. J. Agric. Food Chem. 2004, 53, 158–163. [Google Scholar] [CrossRef] [PubMed]
- Lakowicz, J.R. Principles of Fluorescence Spectroscopy, 3rd ed.; Springer: Baltimore, MD, USA, 2006; ISBN 978-0-387-46312-4. [Google Scholar]
- Zhang, Y.; Chen, S.; Qi, B.; Sui, X.; Jiang, L. Complexation of Thermally-Denatured Soybean Protein Isolate with Anthocyanins and Its Effect on the Protein Structure and in Vitro Digestibility. Food Res. Int. 2018, 106, 619–625. [Google Scholar] [CrossRef]
- Jia, J.; Gao, X.; Hao, M.; Tang, L. Comparison of Binding Interaction between β-Lactoglobulin and Three Common Polyphenols Using Multi-Spectroscopy and Modeling Methods. Food Chem. 2017, 228, 143–151. [Google Scholar] [CrossRef]
- Seedher, N.; Agarwal, P. Complexation of Fluoroquinolone Antibiotics with Human Serum Albumin: A Fluorescence Quenching Study. J. Lumin 2010, 130, 1841–1848. [Google Scholar] [CrossRef]
- Ross, P.D.; Subramanian, S. Thermodynamics of Protein Association Reactions: Forces Contributing to Stability. Biochemistry 1981, 20, 3096–3102. [Google Scholar] [CrossRef]
- Shi, M.; Huang, L.Y.; Nie, N.; Ye, J.H.; Zheng, X.Q.; Lu, J.L.; Liang, Y.R. Binding of Tea Catechins to Rice Bran Protein Isolate: Interaction and Protective Effect during in Vitro Digestion. Food Res. Int. 2017, 93, 1–7. [Google Scholar] [CrossRef]
- Berdutina, A.V.; Neklyudov, A.D.; Ivankin, A.I.; Karpo, B.S.; Mitaleva, S.I. Comparison of Proteolytic Activities of the Enzyme Complex from Mammalian Pancreas and Pancreatin. Appl. Biochem. Microbiol. 2000, 36, 363–367. [Google Scholar] [CrossRef]
- Karamać, M.; Kosińska-Cagnazzo, A.; Kulczyk, A. Use of Different Proteases to Obtain Flaxseed Protein Hydrolysates with Antioxidant Activity. Int. J. Mol. Sci. 2016, 17, 1027. [Google Scholar] [CrossRef] [PubMed]
- Moreno, C.; Mojica, L.; de Mejía, E.G.; Camacho Ruiz, R.M.; Luna-Vital, D.A. Combinations of Legume Protein Hydrolysates Synergistically Inhibit Biological Markers Associated with Adipogenesis. Foods 2020, 9, 1678. [Google Scholar] [CrossRef]
- Daliri, H.; Ahmadi, R.; Pezeshki, A.; Hamishehkar, H.; Mohammadi, M.; Beyrami, H.; Heshmati, M.K.; Ghorbani, M. Quinoa Bioactive Protein Hydrolysate Produced by Pancreatin Enzyme- Functional and Antioxidant Properties. LWT 2021, 150, 111853. [Google Scholar] [CrossRef]
- Çağlar, A.F.; Göksu, A.G.; Çakır, B.; Gülseren, İ. Tombul Hazelnut (Corylus avellana L.) Peptides with DPP-IV Inhibitory Activity: In Vitro and in Silico Studies. Food Chem. X 2021, 12, 100151. [Google Scholar] [CrossRef] [PubMed]
- Adler-Nissen, J. Determination of the Degree of Hydrolysis of Food Protein Hydrolysates by Trinitrobenzenesulfonic Acid. J. Agric. Food Chem. 1979, 27, 1256–1262. [Google Scholar] [CrossRef]
- Nielsen, P.M.; Petersen, D.; Dambmann, C. Improved Method for Determining Food Protein Degree of Hydrolysis. J. Food Sci. 2001, 66, 642–646. [Google Scholar] [CrossRef]
- Thurlkill, R.L.; Grimsley, G.R.; Scholtz, J.M.; Pace, C.N. PK Values of the Ionizable Groups of Proteins. Protein Sci. 2006, 15, 1214–1218. [Google Scholar] [CrossRef]
- Minekus, M.; Alminger, M.; Alvito, P.; Ballance, S.; Bohn, T.; Bourlieu, C.; Carriere, F.; Boutrou, R.; Corredig, M.; Dupont, D.; et al. A Standardised Static in Vitro Digestion Method Suitable for Food-an International Consensus. Food Funct. 2014, 5, 1113–1124. [Google Scholar] [CrossRef]
- Turkmen, N.; Sari, F.; Velioglu, Y.S. Effects of Extraction Solvents on Concentration and Antioxidant Activity of Black and Black Mate Tea Polyphenols Determined by Ferrous Tartrate and Folin–Ciocalteu Methods. Food Chem. 2006, 99, 835–841. [Google Scholar] [CrossRef]
- Apak, R.; Güçlü, K.; Özyürek, M.; Karademir, S.E. Novel Total Antioxidant Capacity Index for Dietary Polyphenols and Vitamins C and E, Using Their Cupric Ion Reducing Capability in the Presence of Neocuproine: CUPRAC Method. J. Agric. Food Chem. 2004, 52, 7970–7981. [Google Scholar] [CrossRef] [PubMed]
- Kumaran, A.; Karunakaran, J.R. Antioxidant and Free Radical Scavenging Activity of an Aqueous Extract of Coleus Aromaticus. Food Chem. 2006, 97, 109–114. [Google Scholar] [CrossRef]
- Capanoglu, E.; Beekwilder, J.; Boyacioglu, D.; Hall, R.; de Vos, R. Changes in Antioxidant and Metabolite Profiles during Production of Tomato Paste. J. Agric. Food Chem. 2008, 56, 964–973. [Google Scholar] [CrossRef]
- Jing, H.E.; Xing, Y.F.; Huang, B.O.; Yi-Zheng Zhang, A.; Zeng, C.M. Tea Catechins Induce the Conversion of Preformed Lysozyme Amyloid Fibrils to Amorphous Aggregates. J. Agric. Food Chem. 2009, 57, 11391–11396. [Google Scholar] [CrossRef]
- Chu, Q.; Bao, B.; Wu, W. Mechanism of Interaction between Phenolic Compounds and Proteins Based on Non-Covalent and Covalent Interactions. Med. Res. 2018, 2, 180014. Available online: http://www.medicineresearch.org/EN/Y2018/V2/I3/180014 (accessed on 21 October 2022).
- Dai, S.; Lian, Z.; Qi, W.; Chen, Y.; Tong, X.; Tian, T.; Lyu, B.; Wang, M.; Wang, H.; Jiang, L. Non-Covalent Interaction of Soy Protein Isolate and Catechin: Mechanism and Effects on Protein Conformation. Food Chem. 2022, 384, 132507. [Google Scholar] [CrossRef]
- Ghribi, A.M.; Gafsi, I.M.; Sila, A.; Blecker, C.; Danthine, S.; Attia, H.; Bougatef, A.; Besbes, S. Effects of Enzymatic Hydrolysis on Conformational and Functional Properties of Chickpea Protein Isolate. Food Chem. 2015, 187, 322–330. [Google Scholar] [CrossRef]
- Mohan, A.; Rajendran, S.R.C.K.; He, Q.S.; Bazinet, L.; Udenigwe, C.C. Encapsulation of Food Protein Hydrolysates and Peptides: A Review. RSC Adv. 2015, 5, 79270–79278. [Google Scholar] [CrossRef]
- Cao, Y.; Xiong, Y.L. Interaction of Whey Proteins with Phenolic Derivatives Under Neutral and Acidic PH Conditions. J. Food Sci. 2017, 82, 409–419. [Google Scholar] [CrossRef]
- Chen, Z.; Wang, C.; Gao, X.; Chen, Y.; Santhanam, R.K.; Wang, C.; Xu, L.; Chen, H. Interaction Characterization of Preheated Soy Protein Isolate with Cyanidin-3-O-Glucoside and Their Effects on the Stability of Black Soybean Seed Coat Anthocyanins Extracts. Food Chem. 2019, 271, 266–273. [Google Scholar] [CrossRef] [PubMed]
- Al-Shabib, N.A.; Khan, J.M.; Malik, A.; Rehman, M.T.; AlAjmi, M.F.; Husain, F.M.; Hisamuddin, M.; Altwaijry, N. Molecular Interaction of Tea Catechin with Bovine β-Lactoglobulin: A Spectroscopic and in Silico Studies. Saudi Pharm. J. 2020, 28, 238–245. [Google Scholar] [CrossRef] [PubMed]
- Liu, C.; He, W.; Chen, S.; Chen, J.; Zeng, M.; Qin, F.; He, Z. Interactions of Digestive Enzymes and Milk Proteins with Tea Catechins at Gastric and Intestinal PH. Int. J. Food Sci. Technol. 2017, 52, 247–257. [Google Scholar] [CrossRef]
- Wu, X.; Wu, H.; Liu, M.; Liu, Z.; Xu, H.; Lai, F. Analysis of Binding Interaction between (−)-Epigallocatechin (EGC) and β-Lactoglobulin by Multi-Spectroscopic Method. Spectrochim. Acta A Mol. Biomol. Spectrosc. 2011, 82, 164–168. [Google Scholar] [CrossRef] [PubMed]
- Hasni, I.; Bourassa, P.; Hamdani, S.; Samson, G.; Carpentier, R.; Tajmir-Riahi, H.A. Interaction of Milk α- and β-Caseins with Tea Polyphenols. Food Chem. 2011, 126, 630–639. [Google Scholar] [CrossRef]
- Kanakis, C.D.; Hasni, I.; Bourassa, P.; Tarantilis, P.A.; Polissiou, M.G.; Tajmir-Riahi, H.A. Milk β-Lactoglobulin Complexes with Tea Polyphenols. Food Chem. 2011, 127, 1046–1055. [Google Scholar] [CrossRef]
- Yılmaz, H.; Lee, S.; Chronakis, I.S. Interactions of β-Lactoglobulin with Bovine Submaxillary Mucin vs. Porcine Gastric Mucin: The Role of Hydrophobic and Hydrophilic Residues as Studied by Fluorescence Spectroscopy. Molecules 2021, 26, 6799. [Google Scholar] [CrossRef]
- Acharya, D.P.; Sanguansri, L.; Augustin, M.A. Binding of Resveratrol with Sodium Caseinate in Aqueous Solutions. Food Chem. 2013, 141, 1050–1054. [Google Scholar] [CrossRef]
- Tang, B.; Huang, Y.; Ma, X.; Liao, X.; Wang, Q.; Xiong, X.; Li, H. Multispectroscopic and Docking Studies on the Binding of Chlorogenic Acid Isomers to Human Serum Albumin: Effects of Esteryl Position on Affinity. Food Chem. 2016, 212, 434–442. [Google Scholar] [CrossRef]
- Petrucci, R.H.; Herring, F.G.; Madura, J.D.; Bissonnette, C. (Eds.) Spontaneous Change: Entropy and Gibbs Energy. In General Chemistry: Principles and Modern Applications; Pearson: Toronto, ON, Canada, 2011; pp. 819–862. ISBN 978-0-13-206452-1. [Google Scholar]
- Li, X.; Wang, S. Study on the Interaction of (+)-Catechin with Human Serum Albumin Using Isothermal Titration Calorimetry and Spectroscopic Techniques. New J. Chem. 2014, 39, 386–395. [Google Scholar] [CrossRef]
- Li, X.; Hao, Y. Probing the Binding of (+)-Catechin to Bovine Serum Albumin by Isothermal Titration Calorimetry and Spectroscopic Techniques. J. Mol. Struct. 2015, 1091, 109–117. [Google Scholar] [CrossRef]
- Dogan, A.; Siyakus, G.; Severcan, F. FTIR Spectroscopic Characterization of Irradiated Hazelnut (Corylus avellana L.). Food Chem. 2007, 100, 1106–1114. [Google Scholar] [CrossRef]
- Ferraro, V.; Madureira, A.R.; Sarmento, B.; Gomes, A.; Pintado, M.E. Study of the Interactions between Rosmarinic Acid and Bovine Milk Whey Protein α-Lactalbumin, β-Lactoglobulin and Lactoferrin. Food Res. Int. 2015, 7, 450–459. [Google Scholar] [CrossRef]
- Han, L.; Lu, K.; Zhou, S.; Zhang, S.; Xie, F.; Qi, B.; Li, Y. Development of an Oil-in-Water Emulsion Stabilized by a Black Bean Protein-Based Nanocomplex for Co-Delivery of Quercetin and Perilla Oil. LWT 2021, 138, 110644. [Google Scholar] [CrossRef]
- Li, D.; Zhao, Y.; Wang, X.; Tang, H.; Wu, N.; Wu, F.; Yu, D.; Elfalleh, W. Effects of (+)-Catechin on a Rice Bran Protein Oil-in-Water Emulsion: Droplet Size, Zeta-Potential, Emulsifying Properties, and Rheological Behavior. Food Hydrocoll. 2020, 98, 105306. [Google Scholar] [CrossRef]
- Cirkovic Velickovic, T.D.; Stanic-Vucinic, D.J. The Role of Dietary Phenolic Compounds in Protein Digestion and Processing Technologies to Improve Their Antinutritive Properties. Compr. Rev. Food Sci. Food Saf. 2018, 17, 82–103. [Google Scholar] [CrossRef]
- Ni, H.; Hayes, H.; Stead, D.; Liu, G.; Yang, H.; Li, H.; Raikos, V. Interaction of Whey Protein with Polyphenols from Salal Fruits (Gaultheria Shallon) and the Effects on Protein Structure and Hydrolysis Pattern by Flavourzyme®. Int. J. Food Sci. Technol. 2020, 55, 1281–1288. [Google Scholar] [CrossRef]
- Wang, X.Y.; Tang, C.H. Physicochemical and Antioxidant Properties of Buckwheat Protein Isolates with Different Polyphenolic Content Modified by Limited Hydrolysis with Trypsin–ProQuest. Food Technol. Biotechnol. 2012, 50, 17–24. [Google Scholar]
- Xie, Y.; Kosińska, A.; Xu, H.; Andlauer, W. Milk Enhances Intestinal Absorption of Green Tea Catechins in in Vitro Digestion/Caco-2 Cells Model. Food Res. Int. 2013, 53, 793–800. [Google Scholar] [CrossRef]
- Green, R.J.; Murphy, A.S.; Schulz, B.; Watkins, B.A.; Ferruzzi, M.G. Common Tea Formulations Modulate in Vitro Digestive Recovery of Green Tea Catechins. Mol. Nutr. Food Res. 2007, 51, 1152–1162. [Google Scholar] [CrossRef]
- Chen, Z.-Y.; Yan Zhu, Q.; Fan Wong, Y.; Zhang, Z.; Yin Chung, H. Stabilizing Effect of Ascorbic Acid on Green Tea Catechins. J. Agric. Food Chem. 1998, 46, 2512–2516. [Google Scholar] [CrossRef]
- Zhu, Q.Y.; Huang, Y.; Tsang, D.; Chen, Z.Y. Regeneration of α-Tocopherol in Human Low-Density Lipoprotein by Green Tea Catechin. J. Agric. Food Chem. 1999, 47, 2020–2025. [Google Scholar] [CrossRef] [PubMed]
- Shim, S.M.; Yoo, S.H.; Ra, C.S.; Kim, Y.K.; Chung, J.O.; Lee, S.J. Digestive Stability and Absorption of Green Tea Polyphenols: Influence of Acid and Xylitol Addition. Food Res. Int. 2012, 45, 204–210. [Google Scholar] [CrossRef]


Publisher’s Note: MDPI stays neutral with regard to jurisdictional claims in published maps and institutional affiliations. |
© 2022 by the authors. Licensee MDPI, Basel, Switzerland. This article is an open access article distributed under the terms and conditions of the Creative Commons Attribution (CC BY) license (https://creativecommons.org/licenses/by/4.0/).