1. Introduction
One of the important instruments in the field of analytical chemistry is the gas chromatograph mass spectrometer (GC-MS) [
1,
2]—an instrument that is able to separate, detect and identify many compounds that reside within analyzed samples. The GC vaporizes the compounds, separates them in time and then outputs them into the MS [
3,
4,
5,
6,
7,
8,
9,
10,
11,
12,
13,
14,
15,
16,
17,
18,
19]. In the common quadrupole based MS [
20,
21] the molecules are ionized and are then focused by a series of ion-lenses and guided into the quadrupole mass filter, which has a scan like operating procedure: the voltages on its rods, if kept constant, allow only a small range of
m/
z values to pass and reach the ion detector, while all other ions collide with the rods and neutralize. By varying the rod voltages quickly and repeatedly, a scan over a range of the desired
m/
z values is performed. The detector located at the end of the quadrupole detects the exiting ions and a mass spectrum is constructed, showing the distribution of masses for every scan.
In most GC-MS systems the molecules are ionized using an electron ionization (EI) ion source where electrons are emitted from a hot filament, accelerated and then hit the thermal molecules, stripping them from one of their electrons and by that ionizing them. This ionization process is a violent one and in most (or all) electron-molecule encounters the molecule breaks down into smaller fragment ions, a breakage that is mostly beneficial as the fragmentation patterns can be used for the elucidation of structural information and better identification via mass spectral libraries.
The novel Cold-EI GC-MS interface [
22] expands the molecules in a supersonic molecular beam until they are vibrationally cold, ionizes them as they go through a special fly-through EI ion source [
22,
23,
24] and then guides the ions into the quadrupole mass analyzer. In Cold EI the abundances of molecular ions are enhanced due to the elimination of sample compounds’ internal heat (vibrational energy), as internally cold molecules are more stable and can better withstand the energetic encounter with the ionizing electron without breaking into fragments. The molecular ion is the most (and many times the only) characteristic ion as the fragmentation pattern can be similar for many compounds, and therefore it is often vital for sample compound identification.
GC-MS with Cold EI improves all the central performance aspects of GC-MS and uniquely provides enhanced molecular ions, improved sample identification, significantly extended range of compounds amenable for analysis, uniform response to all analytes (internal quantitation), faster analysis, greater selectivity, and lower limits of detection [
25,
26,
27,
28,
29,
30,
31,
32,
33].
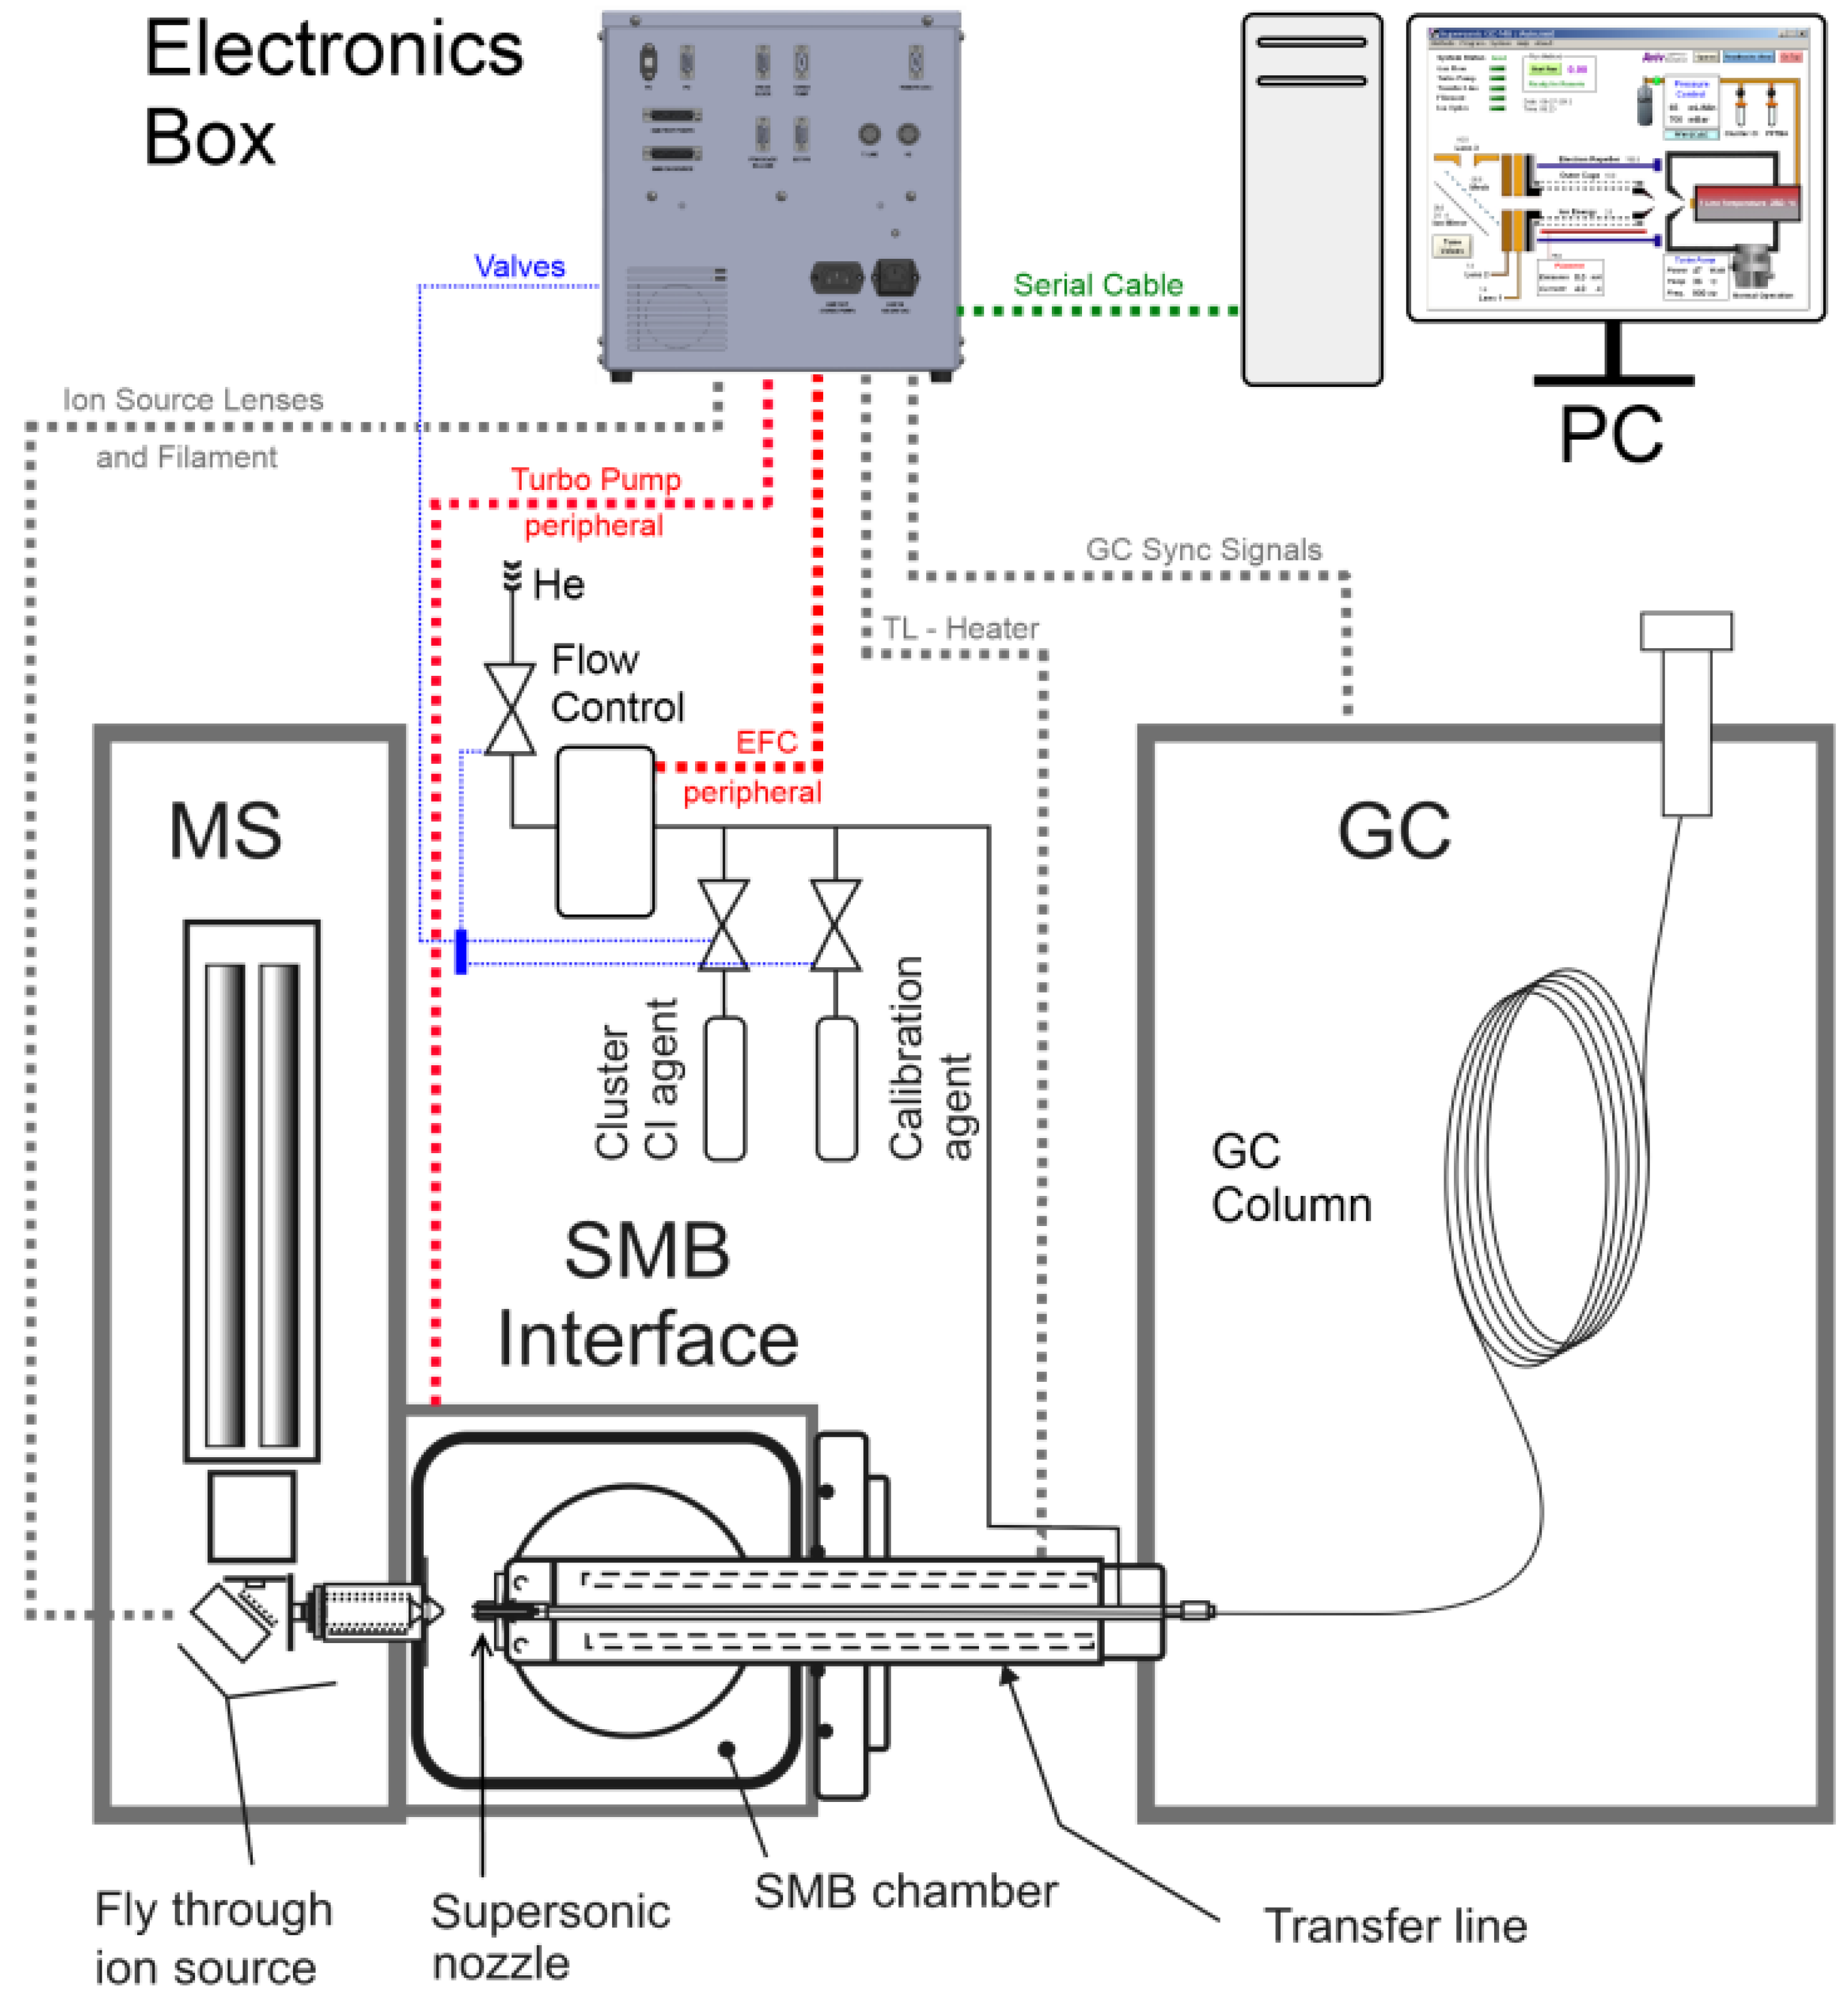
A digital circuit based on a Texas Instruments controller was developed, along with personal computer (PC) software, to provide the operators a fully functional control system for the optimal operation of the Cold-EI interface, with its filament control, ion-lenses, heaters, vacuums system, gas flow control and on/off valves. This paper describes the implementation of this comprehensive system controller with an emphasis on three features: (1) filament emission-current stabilization control, (2) mass dependent voltages of the fly-through ion source lenses and their synchronization with the quadrupole scan and (3) the pulse width modulation (PWM) heaters with their thermocouple feedbacks and proportional integral differential (PID) controls. A simplified sketch of our Cold-EI GC-MS can be seen in
Figure 1.
1.1. Filament Control
One important parameter in GC-MS analyses is the filament emission current as it determines the ionization rate and should therefore be regulated. The filament’s sensitivity dictates the need for a sophisticated control with an output voltage that is not a linear function of the error. On one hand, a fast response control was desirable in order to keep the emission current constant, but on the other hand, the filament must be protected from damage caused by large filament current transients or by overheating. The implemented digital solution was based on a digital signal controller (DSC) with several modes of operation. A smart algorithm with a fast response to small signals and a slow response to large signals was used. In addition, several protective measures were introduced to prevent the current from reaching unsafe values.
1.2. Static and Dynamic Ion Source Lenses
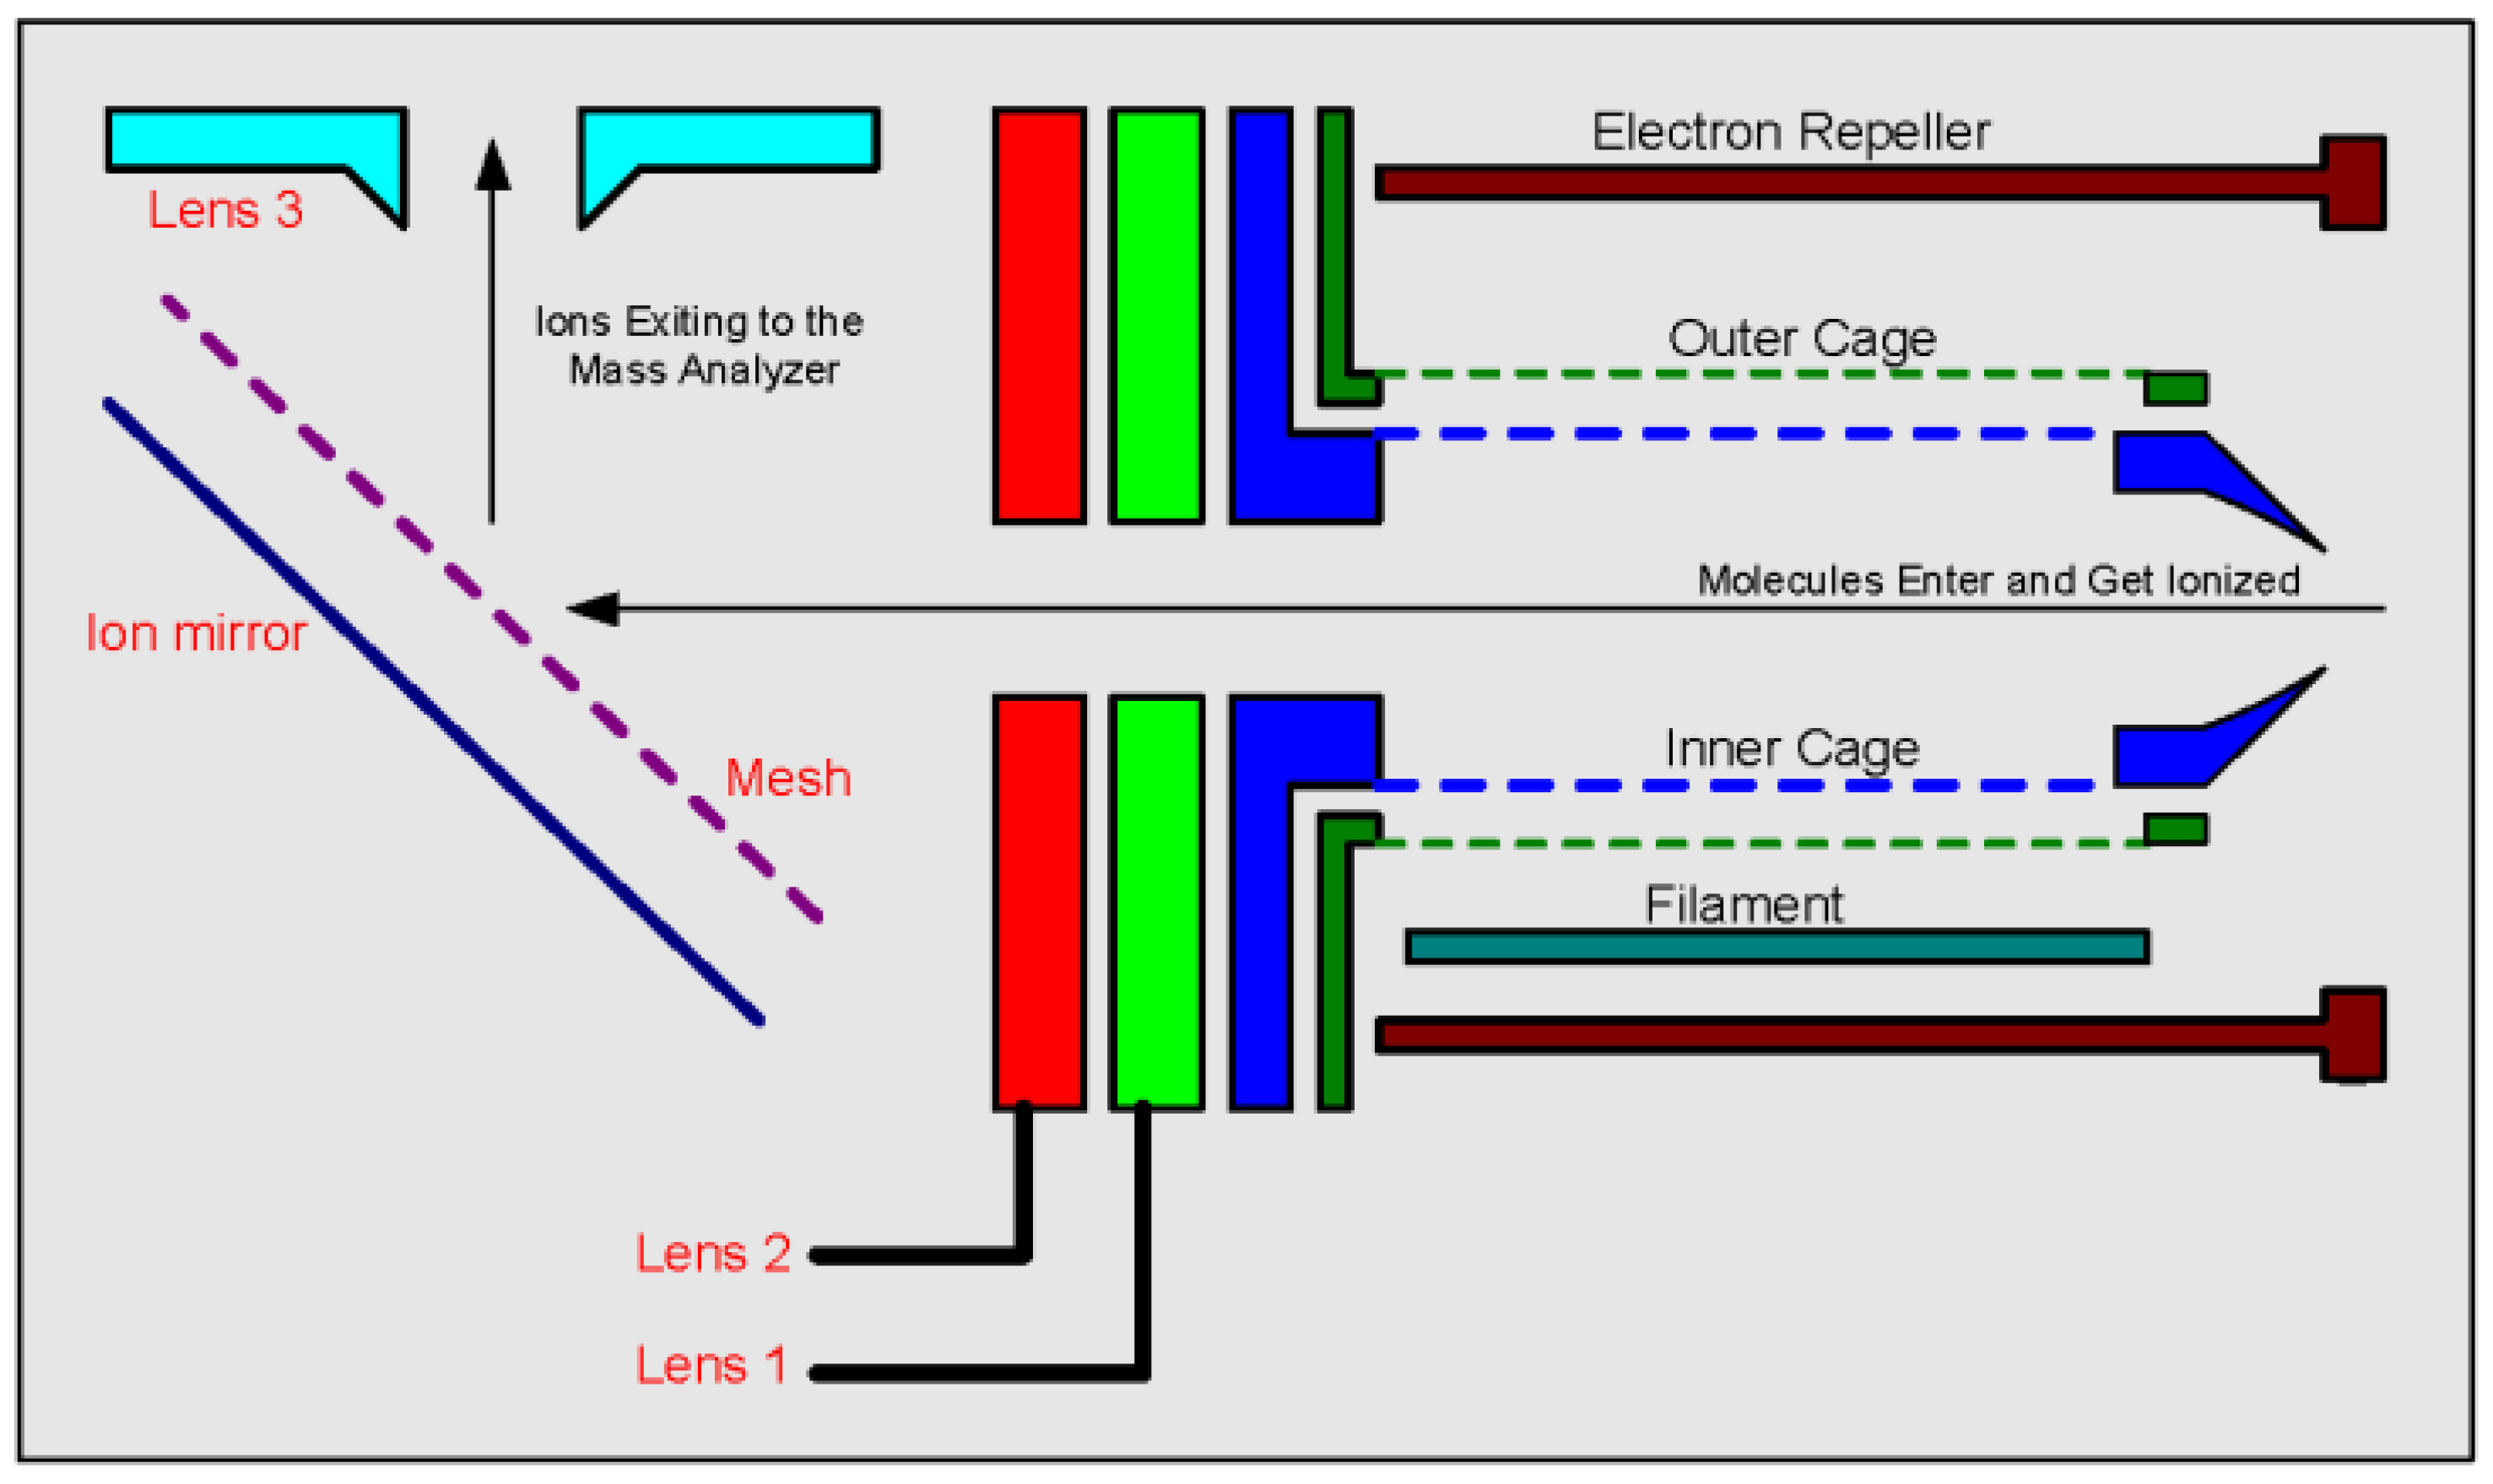
A scheme of the system’s fly-through ion source, through which the molecules fly, become ions and maneuvered into the mass analyzer, can be seen in
Figure 2. The focusing and guiding of ions into the quadrupole are performed by electrostatic voltages on the ion source lenses. The controller described in this paper enables the manipulation of these voltages that can be tuned for the optimal highest signal. As mentioned above, the quadrupole performs scans during which, at every given moment, only a small range of
m/
z values can pass and reach the ion detector. The voltages on the ion source lenses can be optimized for each specific
m/
z value to increase the amount of ions reaching the quadrupole. It can be beneficial, in terms of sensitivity, for the voltages on these ion-lenses to be synchronized with the quadrupole voltages scan, so that all the ion manipulating elements are perfectly tuned to the same specific
m/
z value at any given time. A dynamic mass-dependent optimization controller was implemented using the DSC and high voltage amplifiers. A fast algorithm was used in order to calculate the optimized voltages in real time, utilizing only a small amount of memory (see
Section 3). The controller is able to optimize up to 8 independent high voltage channels ranging between ±150 V at a rate of 100 µs, and can work in two operation modes: static and dynamic. In certain cases this dynamic mass-dependent optimization can increase the signal by a factor of 2 or more.
1.3. PWM Heater Controls
Another real-time control implemented with the comprehensive controller is a pulsed-width modulator (PWM) for the heating of the transfer-line between the GC and the MS. In the GC, the injected solution is vaporized and its different compounds are separated from one another using an analytical column. Most of the column, through which the compounds travel, resides within the GC oven that controls its temperature, but a segment at its end exits the oven, passes through a heated tube called a “transfer line” and is inserted into the MS (see
Figure 1). The heating of the transfer line is vital as it keeps the eluting compounds in the gas phase and retains their separation from one another. The transfer line is heated (normally between 150 °C to 350 °C) by an electric cartridge heater of 48 Volt/200 Watts, while the temperature is measured by a K type thermocouple.
The implemented controller makes it possible to use a temperature program, allowing the temperature to reach its maximum value only at the end of analysis to reduce the undesired effect of “column bleeding” (releasing of the inner coating of the column due to the elevated temperature). This heating method also keeps the transfer line portion of the column passivated (long time column bleed can induce column active sites) and helps in the analysis of relatively volatile thermally labile compounds. In our system the transfer-line heater serves another important purpose—it also heats a supersonic expansion nozzle through which the molecules exit on their way to the MS (see
Figure 1). The nozzle’s temperature affects several key aspects of the analysis process such as the nozzle flow rate and the supersonic molecular beam (SMB) cooling efficiency, and should therefore be considered in the method development step.
1.4. Peripheral Device Controls and Other Features
The full operation of the Cold-EI interface requires control over several peripheral devices (see
Figure 1): a turbo-molecular vacuum pump that pumps the SMB chamber in which the beams are formed, and a controller that can stabilize requested gas flows and pressures. The controller was designed to allow transparent serial communication between the PC and any such serial device, through the controller itself.
The comprehensive controller was also programmed to monitor digital signals coming from the GC for synchronization purposes (see
Figure 1), allowing the Cold-EI interface’s methods to automatically start and end along with the GC-MS analysis. In addition it controls 8 pneumatic valves that manipulate the passage of gas through the system as well as the introduction of Methanol (which is used to create clusters) and perfluorotributylamine (PFTBA) for the calibration of the mass spectrometer.
2. Electronic Circuit
Figure 3 is a block diagram of the electronic circuit that is composed of several blocks. The main block that is the heart of the system is a Texas Instruments [
8] TMS320F28335 150 Mhz DSC. This controller includes 512 KB of Flash memory for programming and 68 KB of SRAM for data. In addition, it has 16 channels of fast analog digital converter (ADC) (80 ns), floating point unit (FPU), and a wide range of peripheral units (UART, PWM, SPI, I2C, TIMERS and more). The digital analog converter (DAC) is Analog Devices AD5360, a 16 channels, 16 bits, serial input, ±10 volt, digital to analog converter. The DAC communicate with the controller by SPI bus and a few more digital I/O pins.
Two outputs of the DAC are connected to the high voltage (HV) amplifiers to produce the voltage to the cathode and the anode of the system. The HV amplifiers are based on a Cirrus-Logic PA241 operational amplifier. The PA241 is a 350 V/60 mA power operational amplifier.
Eight outputs of the DAC are connected to the others HV amplifiers to produce a voltage to the electrostatic lenses of the system. The HV amplifiers are based on a Cirrus-Logic PA240 operational amplifier, a 350 V power operational amplifier that exhibits a unity gain bandwidth of 3 MHz and slew rate of 30 V/µs, and it is suitable for the task of fast mass programming.
The FILAMENT AMP and EMISS SENS blocks are used for driving and sensing the filament current, and for sensing the emission current, respectively. Since the filament potential is floating relative to the ground, the connections to the filament, in both directions, are isolates using the ISO12412 operational amplifier. The VOUT10 of the DAC is amplified by the OPA549—a low-cost, high-voltage (60 V), high-current (10 A) operational amplifier which is ideal for driving a wide variety of loads. This stage has a voltage unity gain and it works as a current amplifier. The filament current senses using a 0.05 ohm resistor producing 50 mV/A. The emission current senses using a 50 ohm resistor producing 50 mV/mA.
Implementing the temperature controller—4 PWM channels of the DSC were used in order to regulate the current of the heater by the PWM technique. The IGBT blocks includes: an opto-coupler to isolate the DSC from power devices, a smart gate driver TD350 and isolated gate bipolar transistors (IGBT) for switching as described in
Figure 4. TD350 is an advanced gate driver for IGBT, while the control and protection functions are included and allow the design of high reliability. An innovative active Miller clamp function avoids the need for a negative gate drive in most applications. The TD350 includes a two-level turn-off feature with adjustable level and delay. This function protects against excessive over-voltage at turn-off in case of over-current or short-circuit conditions.
The ADC accepts a voltage in the range of 0–3 volt, thus, all sensing voltage and current must be scaled to this range. The BUFFERS 1&2 blocks are scale buffers for ADC. In our system, each of the currents is measured by two channels with different gains, in order to get high sensitivity in a small signal. The BUFFERS3 block is a scale buffer for monitoring the mass spectrometer voltage. In the system described here, the attenuation is 1/20 to allow input voltages in the range of 0–50 volt.
The TC AMP block consists of the AD595. This amplifier is a complete instrumentation amplifier and thermocouple cold junction compensator on a monolithic chip. It combines an ice point reference with a pre calibrated amplifier to produce a high level (10 mV/°C) output directly from a thermocouple signal. This gain, after scaling, enables temperature measurements in the range of 0 °C–500 °C
The BIT DRIVER block is 3.3 V to 12 V/1 A bit driver using L293. These bits are used to set the pneumatics valves on and off. The UART MUX block is a simple digital multiplexer used for communication with three peripherals: one Turbo Pump and two Mass Flow Meters, to a single universal asynchronous receiver transmitter (UART).
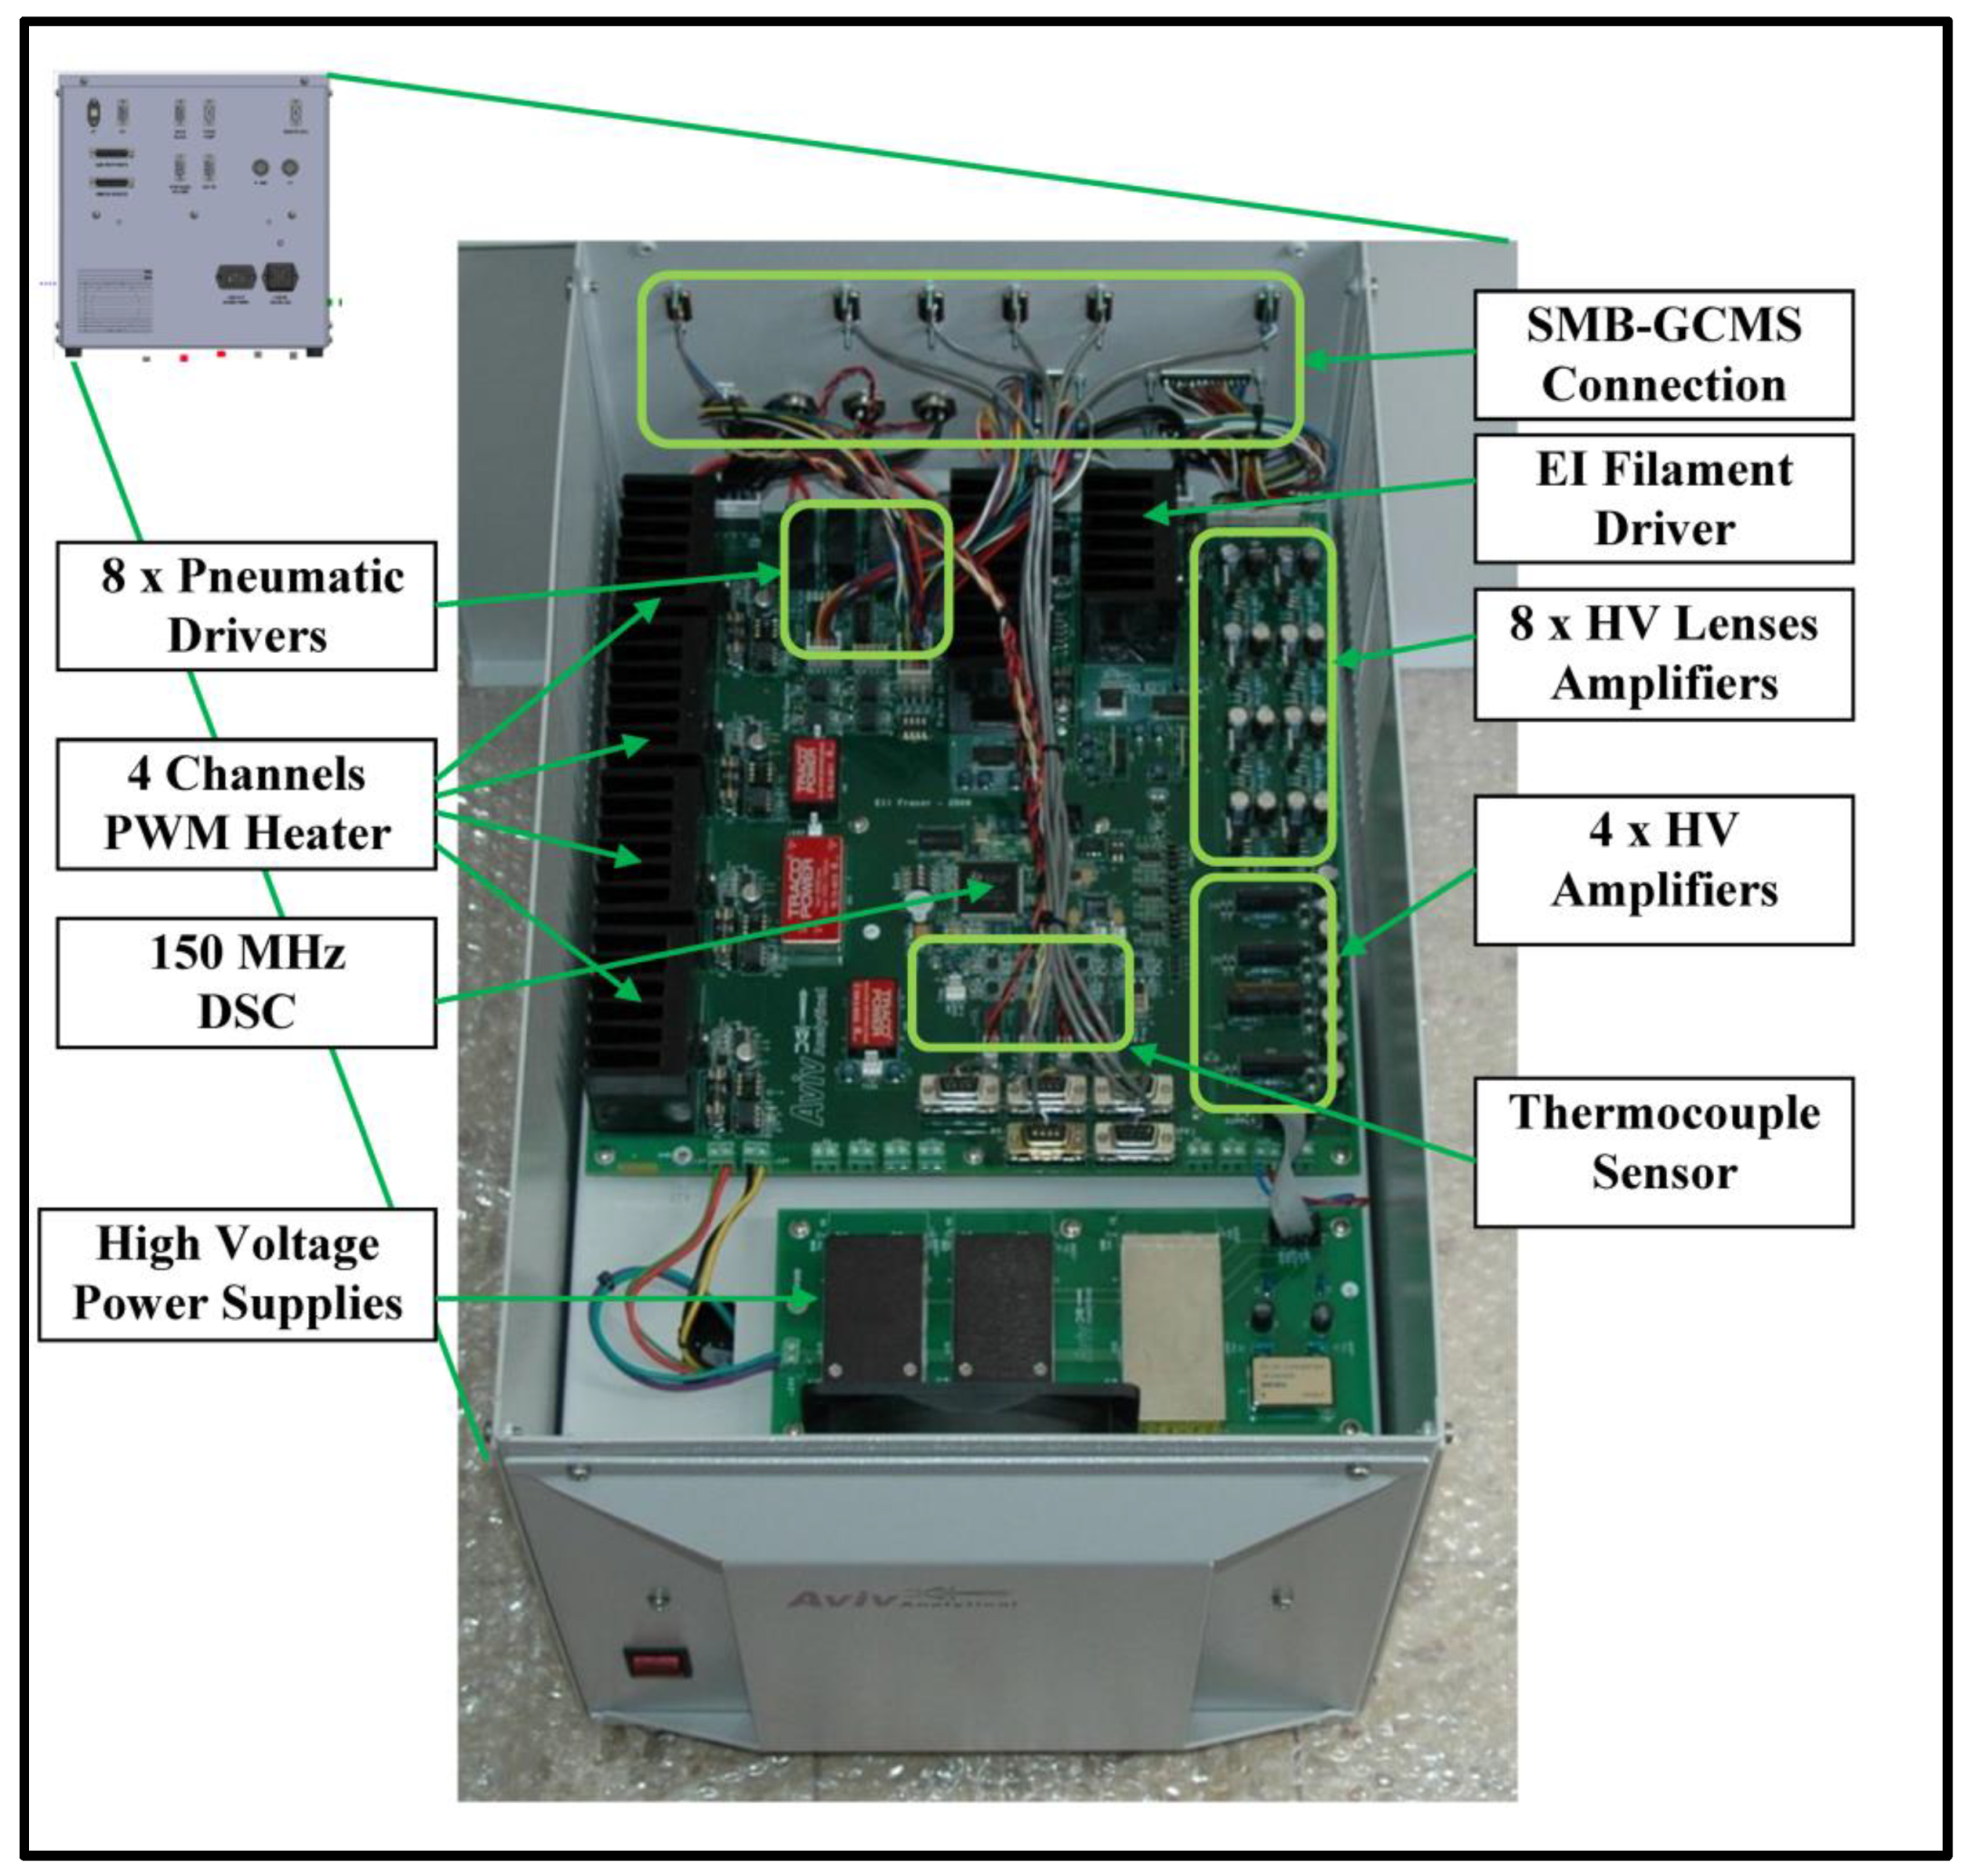
Figure 5 is a photograph of the complete controller electronics printed circuit board (PCB). In the left side there are 4 PWM channels. In the right side there are 12 HV amplifiers, 8 for mass programming and 4 for the anode, cathode, and cages. In the upper mid side one can see the filament and the mirror current amplifiers. The DSC is found in the center of the PCB with all the necessary peripherals.
3. Embedded Software and GUI
Code composer studio (CCS) 8.3 environment and C language are used to write the embedded program. The real time mechanism of our software is based on a hardware timer (TIMER0) that produces an interrupt with highest priority every 100 µs. This clock is the trigger for the sampling process, the feedback control process, the mass programming control process and for the PWM PID loop. The high speed over-sampling enables us to digitally filter the measured signals.
As mentioned above, a control with fast responses is needed in order to keep the emission current constant, but the filament’s sensitivity to large current transients and overheating must be taken under consideration. The use of a digital control, implemented by software, makes this challenge simple. The controller has three modes of operation: (a) constant voltage; (b) constant filament current; (c) constant emission current. The constant voltage mode, works in an open loop, while the other two modes used a PID control to regulate the relevant variable. Each mode has its own PID coefficients that can be programmed via the PC.
The mass programming input voltage is one of Agilent’s original ion source voltages that is not used for other purposes due to the incorporation of the new dedicated fly-through ion source. This voltage can be made to scan with the rest of the system between 0.2 V and 42.7 V with a step-size of 0.168 V, consisting of 256 values (8 bit). The system discussed here can uses positive voltages between 0–50 V representing m/z values between 0–1000 Th.
Since there are 8 independent channels (lenses), 8 × 256 × 2 bytes of random access memory were needed to store the full conversion tables used for their voltage programming (If the input voltage resolution is 12-bit, then the memory size is 8 × 4096 × 2 bytes). In order to minimize memory consumption and work only with the controller internal random access memory (RAM), a small lookup table was used, utilizing a small amount of memory, and interpolation was used to calculate the programming voltage in real time. A total of 8 predetermined mass values and 8 programming voltage values were used for each lens. All of the mid point voltages between the pre-determined mass values are linearly interpolated with 16 bits resolution. The transmission time of 24 bits to the serial DAC, by 10 MHz serial peripheral interface (SPI) bus, is about 2.5 µs, so the time for 8 channels is about 20 µs. One can see that the overhead of that routine is about 20% of the 100 µs clock. In this condition there is enough time for other tasks the system performs.
The thermocouple’s voltage is monitored every 100 µs. The temperature is averaged continuously and the PID loop is calculated using FPU command [
34].
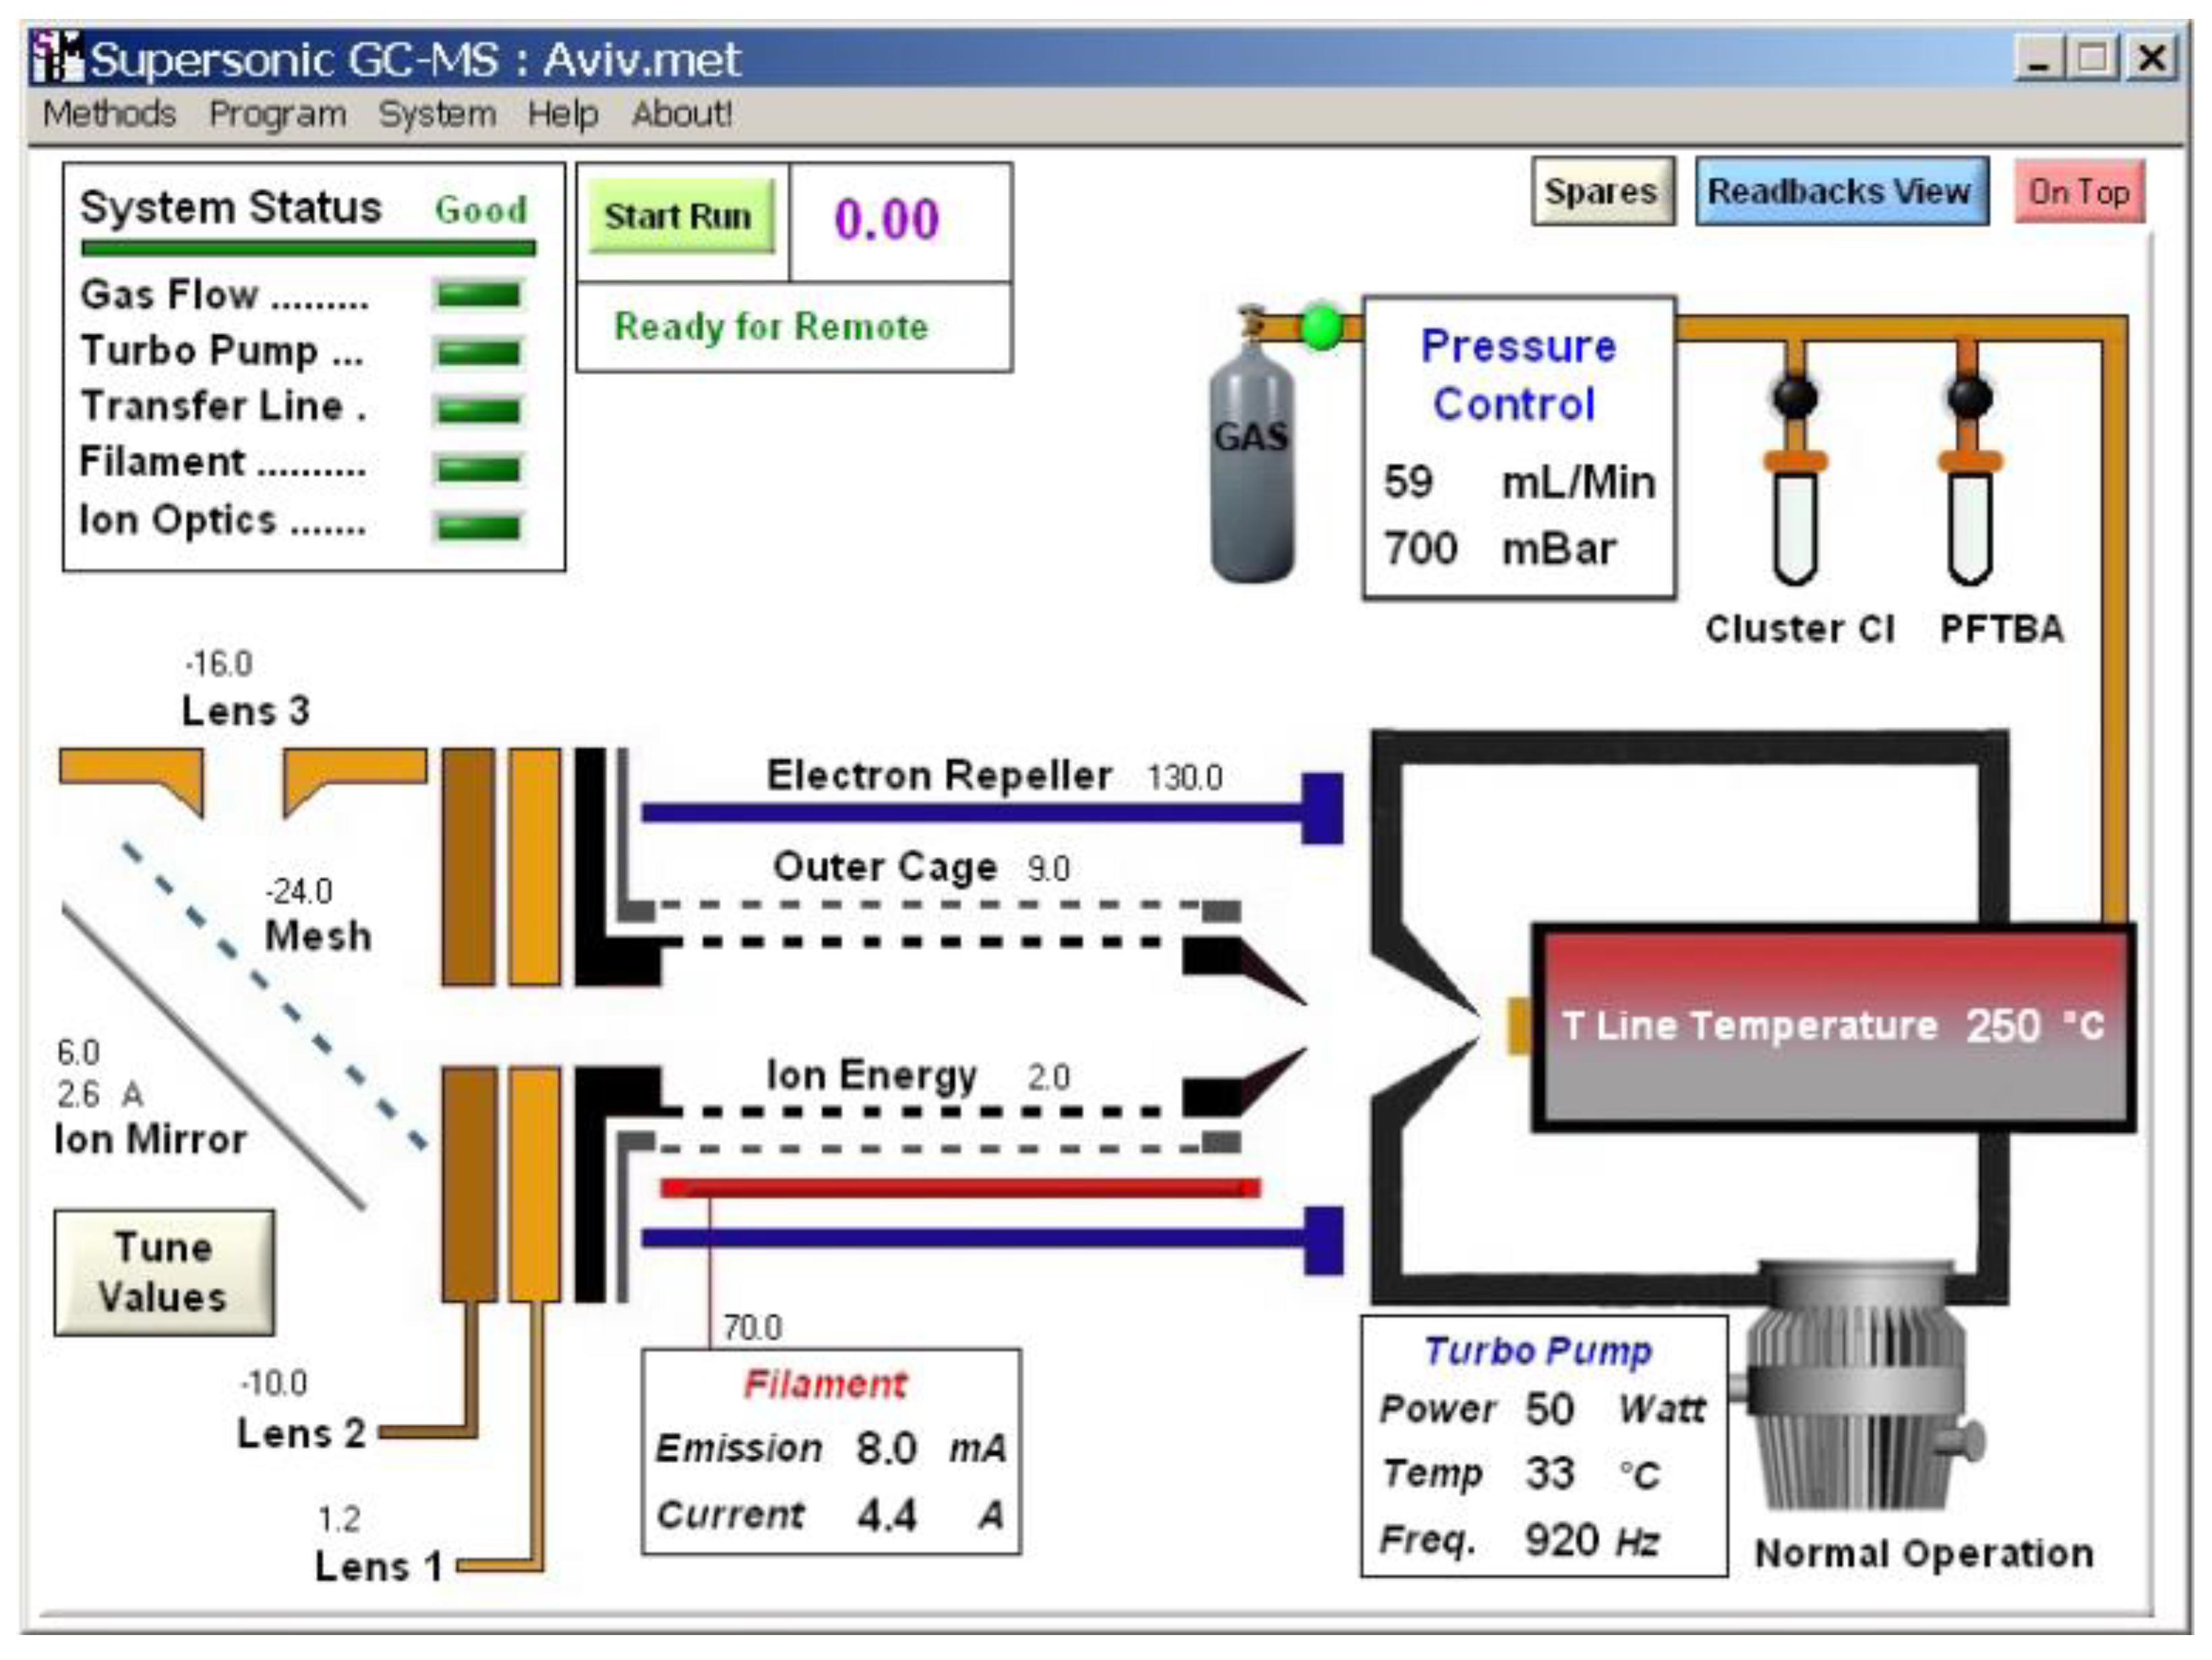
To control the system, a comprehensive application was written using the National Instrument Lab Windows CVI environment.
Figure 6 shows the main graphical user interface (GUI) panel.
4. Results
Using the above GUI several experiments were run to test and characterize the performance of the controller in all three operation modes, its response to rapid changes, its slew-rate and fast response margin, and its stability, all of which gave excellent results [
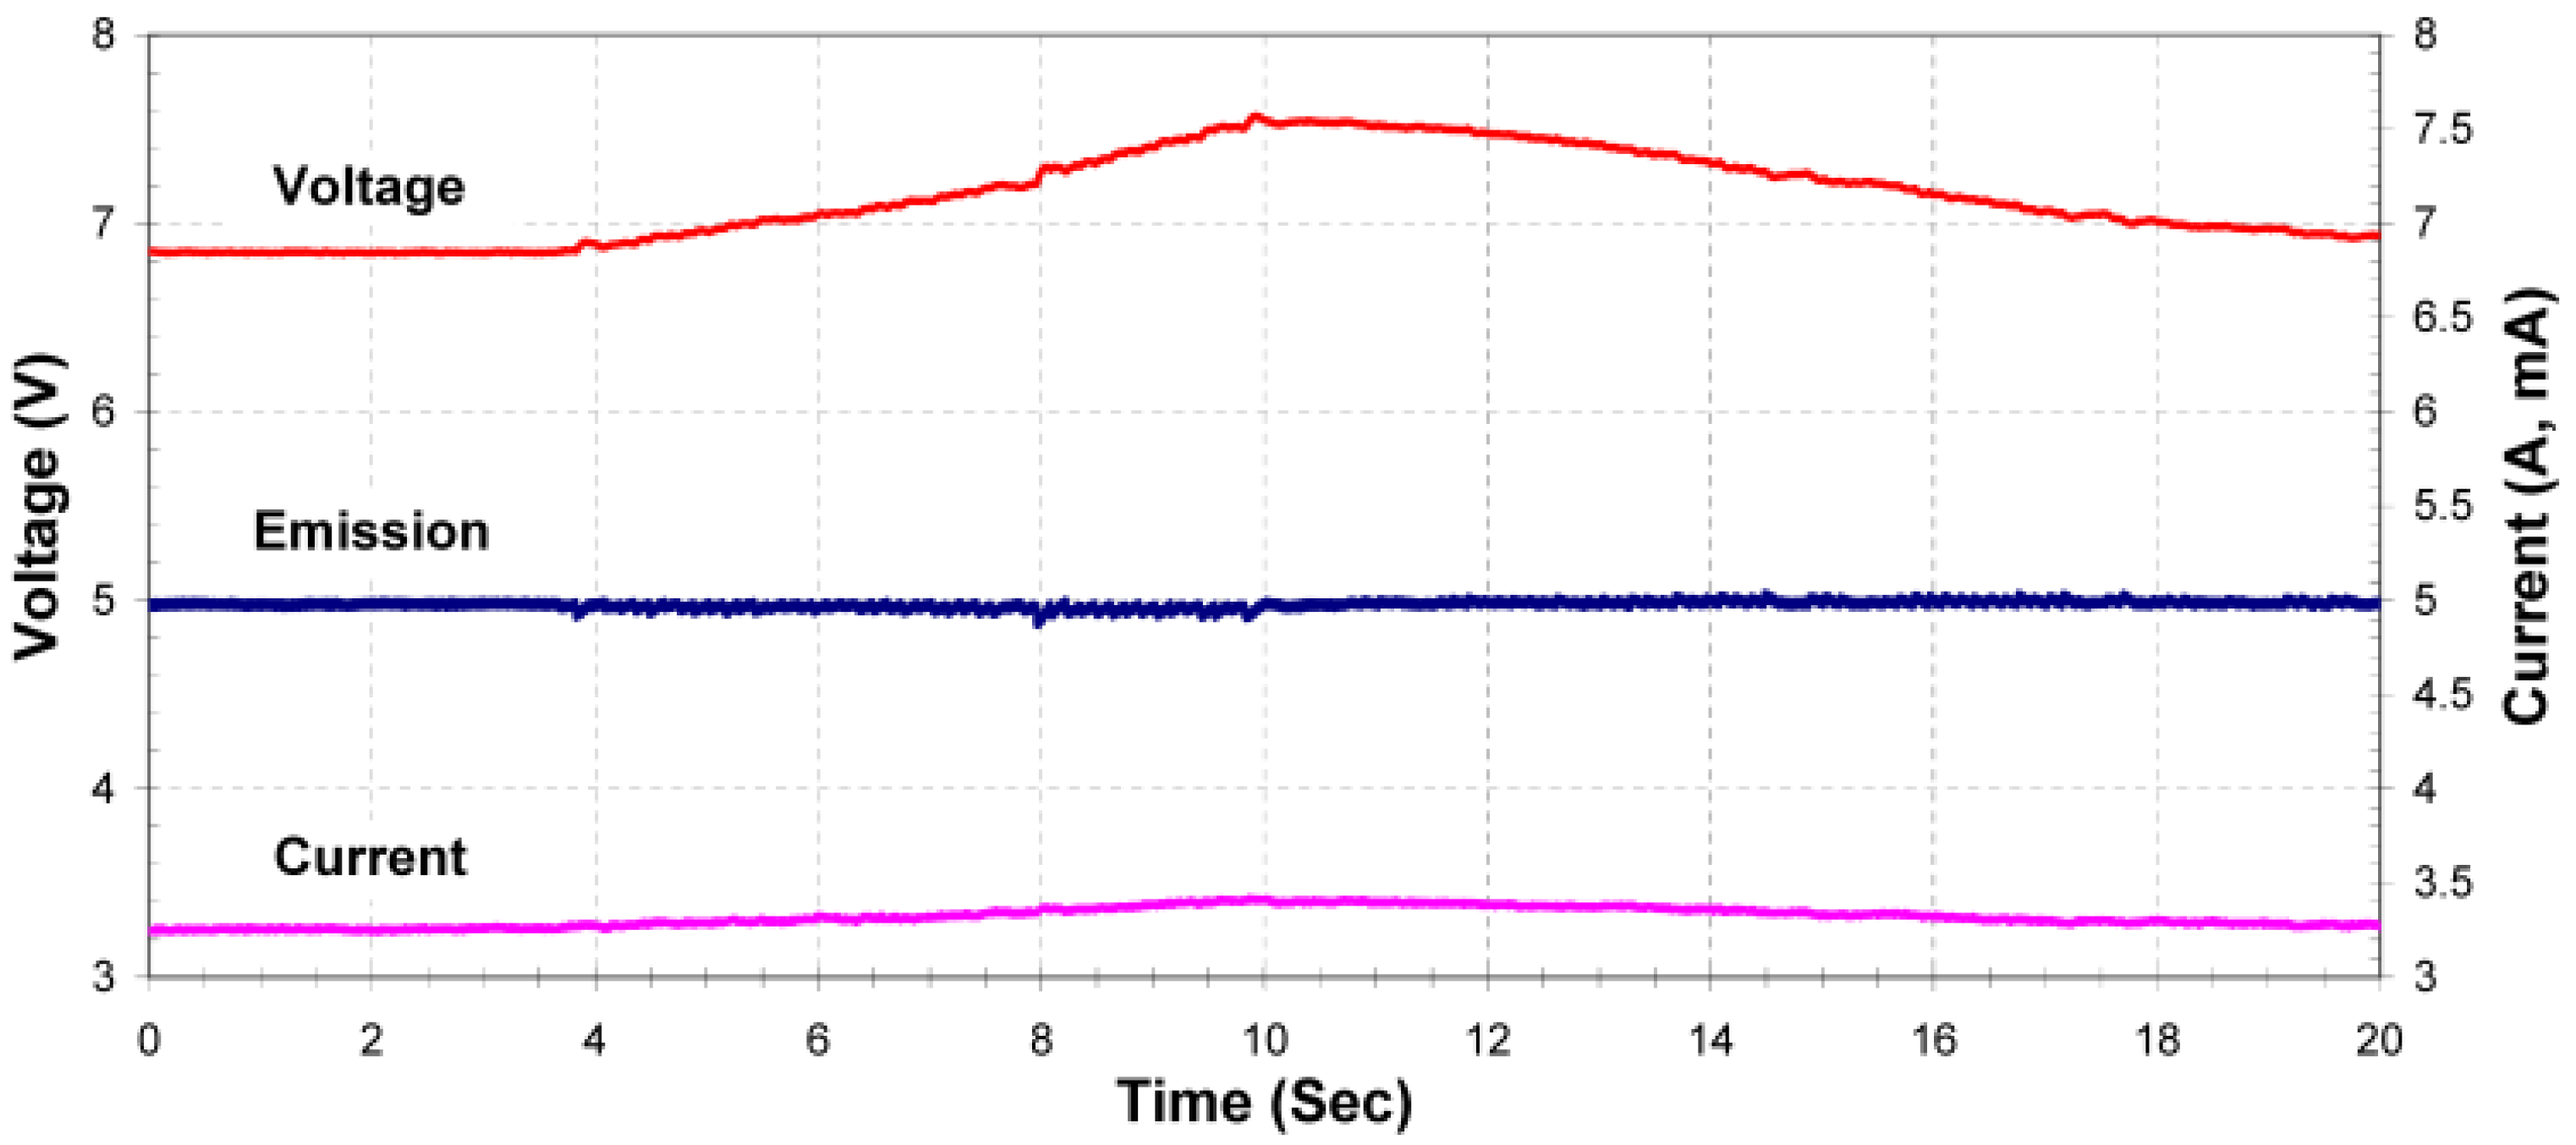
24]. The results of a controller stability test during an external disturbance can be seen in
Figure 7. During this experiment the controller was in the constant emission mode when a small amount of methanol was injected into the system, cooling the filament. As can be seen, the controller maintained a stable emission current while the filament voltage and current were modified by the controller to compensate for the cooling effect.
Several tests were conducted using the mention above GUI for the characterization and testing of the ion lens mass-programming feature with excellent results [
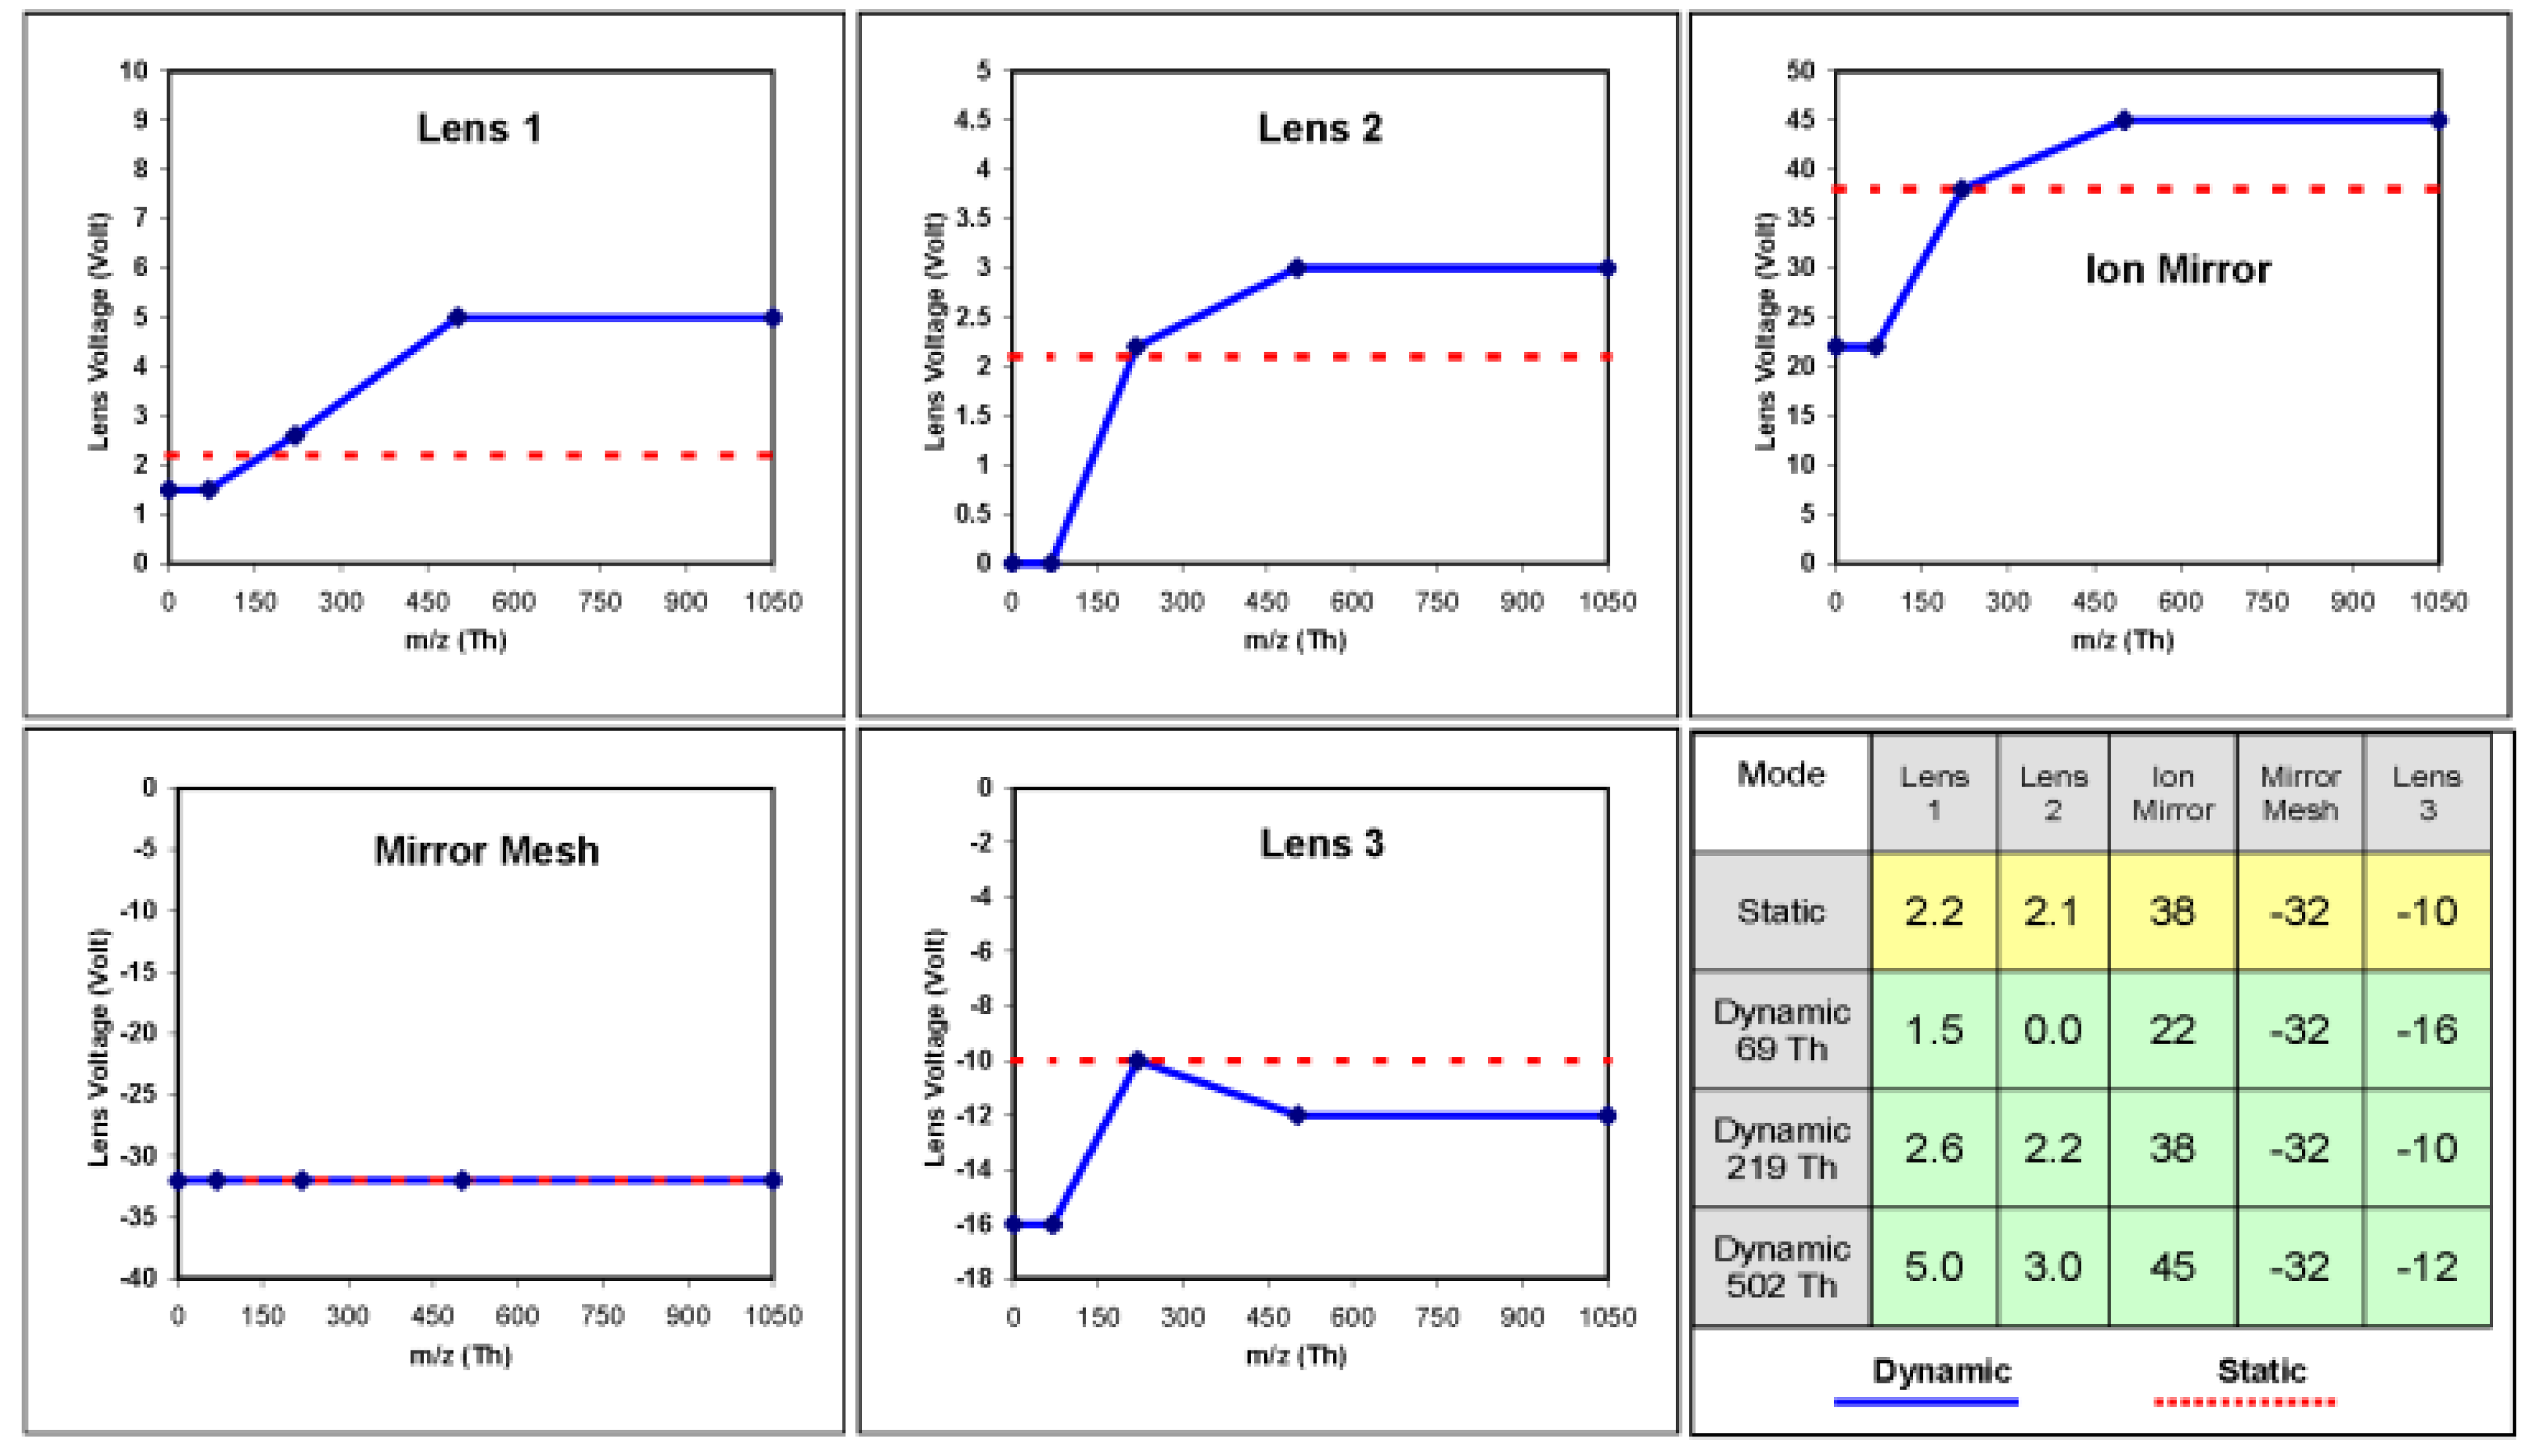
35]. To demonstrate the benefits of dynamic voltages a mixture of 5 compounds was injected to be analyzed by the GC-MS system, the mixture contained octafluoronapthalene (OFN), hexadecane, methylstearate, cholesterol and dotriacontane. In the first experiment, used as control, the lenses were all given constant voltages (without mass programming) that were previously chosen to give the best general response. A list of the lenses and their static voltages can be seen in
Figure 8 (static voltages row in the table). In the second experiment the lenses were fine tuned to produce different voltages at different masses using PFTBA as the tuning compound with the ions at 69 Th (Thomson units =
m/
z), 219 Th and 502 Th. A list of the lenses and their mass dependent voltages can be seen in
Figure 8 (dynamic voltages rows in the table).
Figure 8 also shows graphs of the mass dependent voltages (solid lines) and static voltages (dashed lines) of each lens.
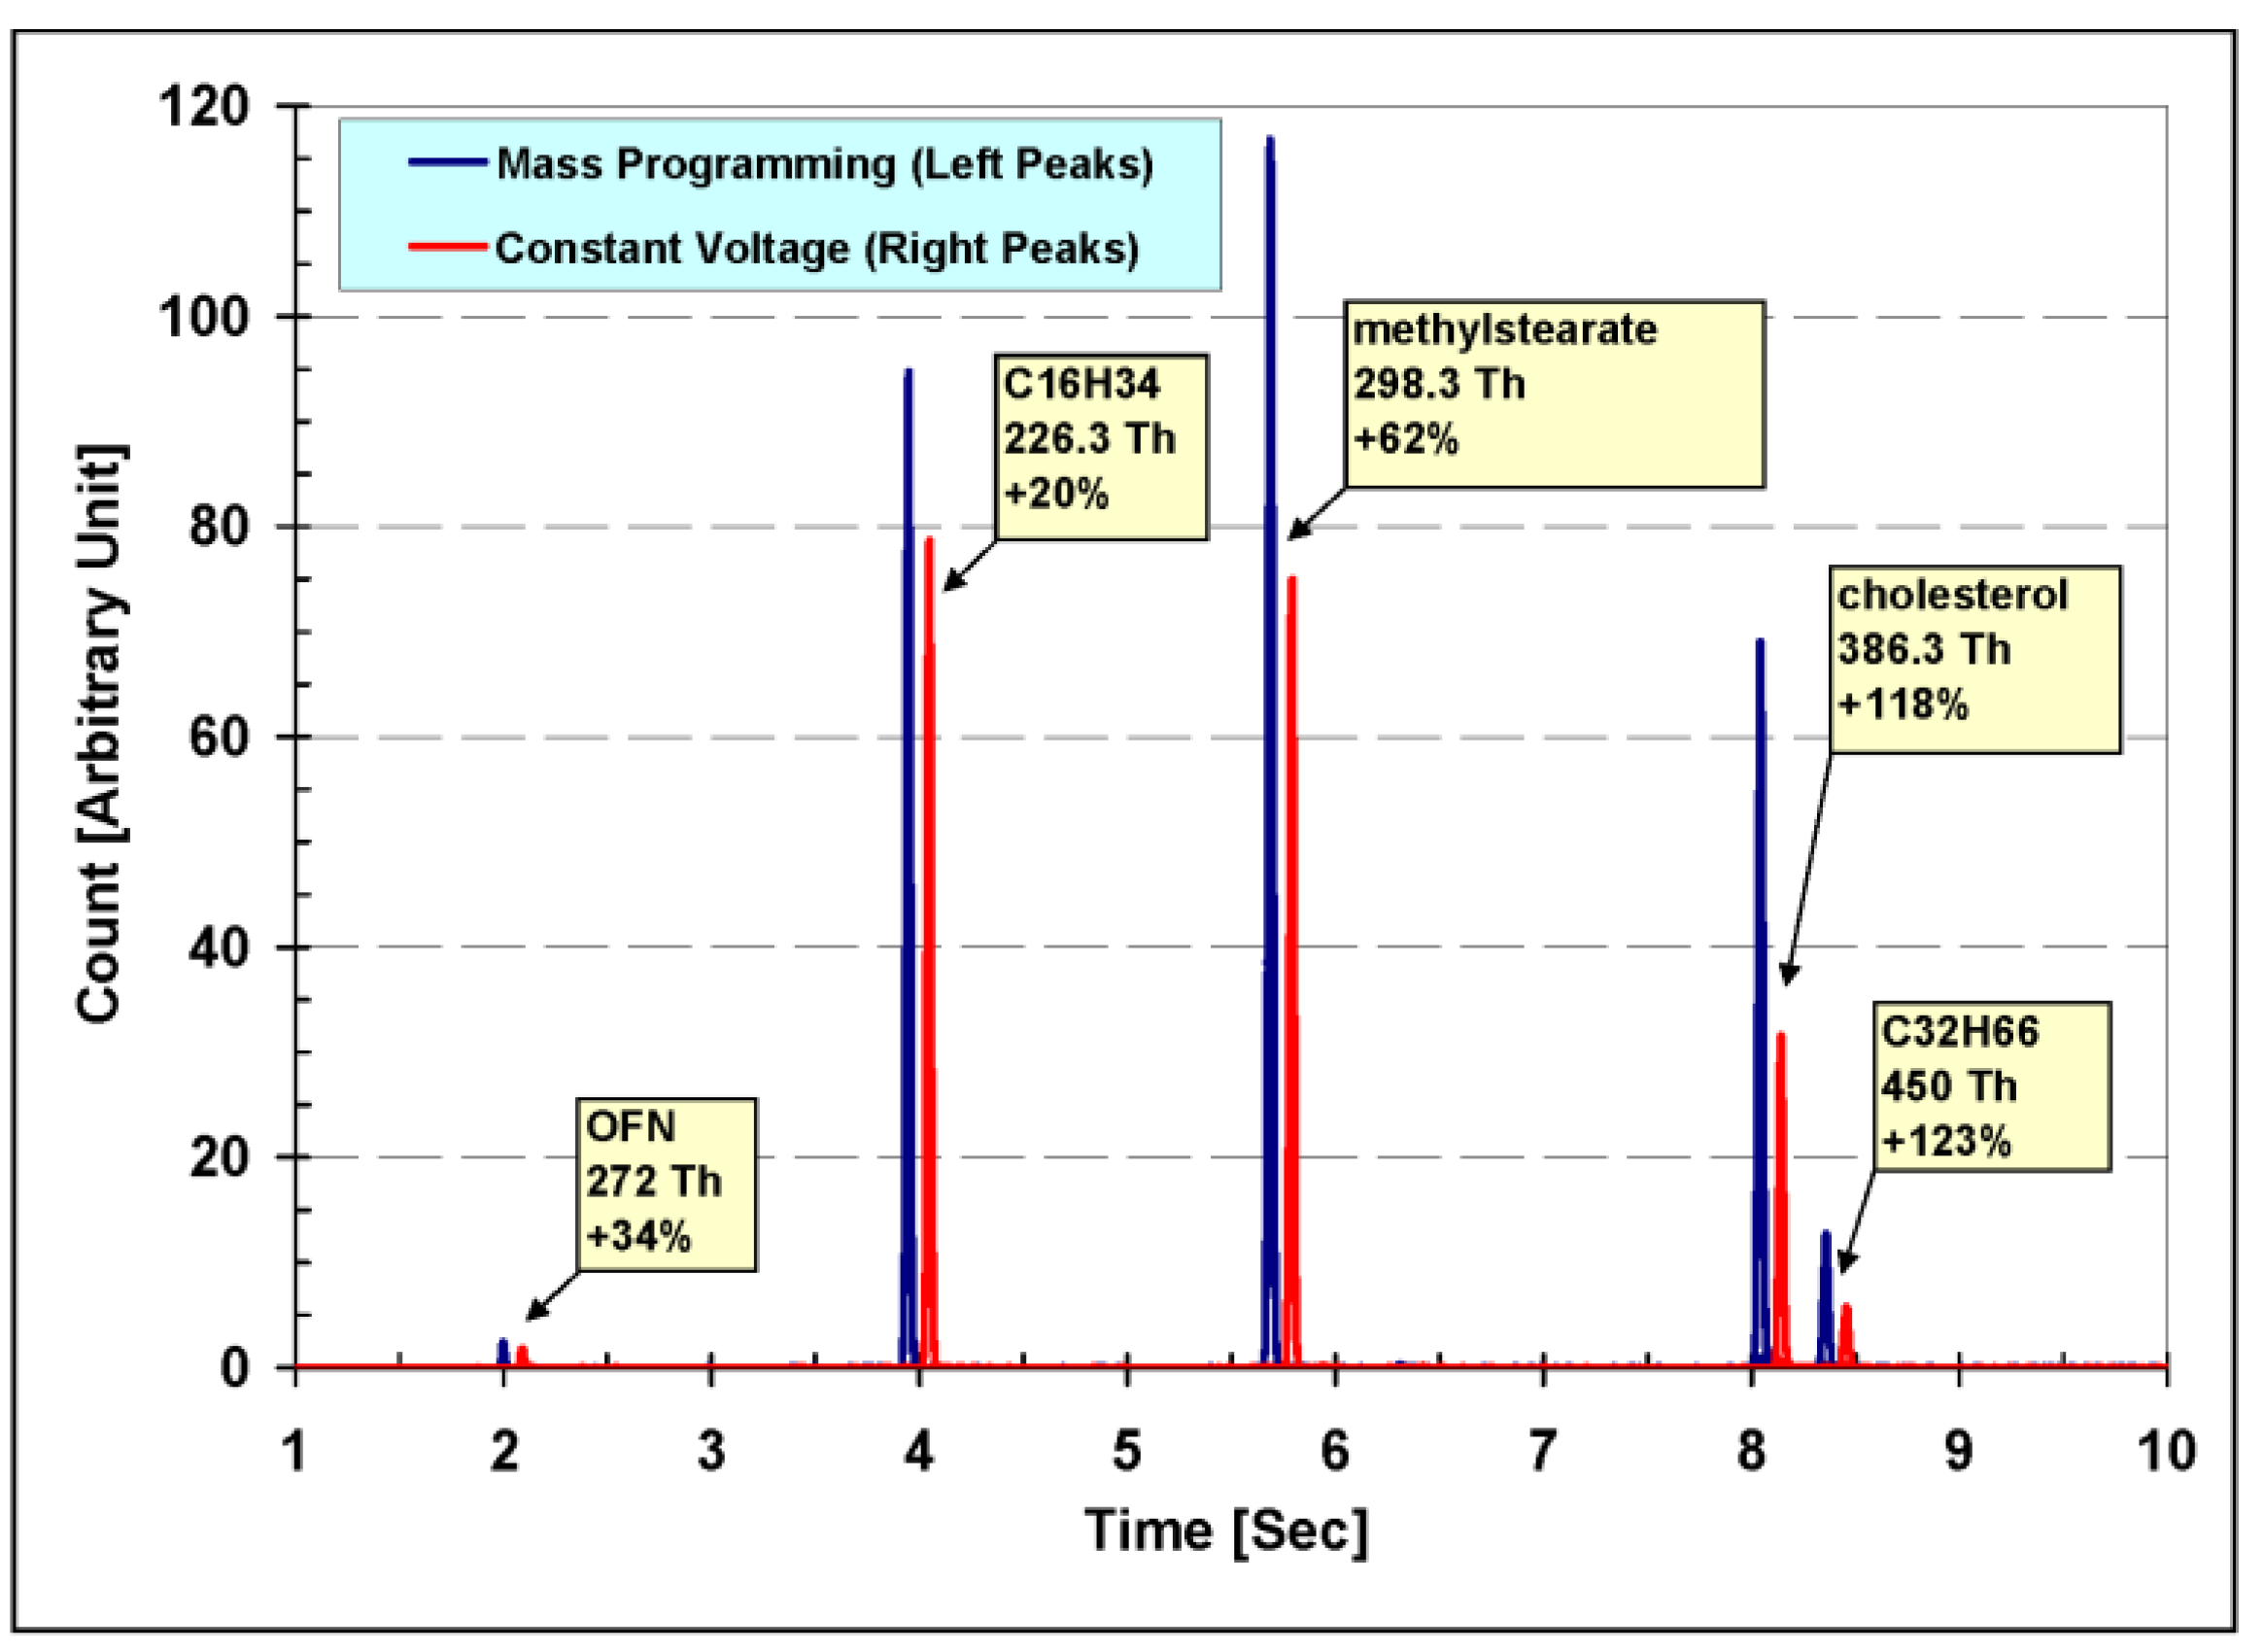
The results of both experiments can be seen together in
Figure 9, showing the measured single ion monitoring (SIM) chromatograms of the ions with
m/
z values of 272.0 Th, 226.3 Th, 298.3 Th, 386.3 Th and 450.5 Th—the molecular ions of the five compounds introduced. The chromatogram measured in the first experiment (using static voltages) is shifted 6 s forward to facilitate the graphical comparison.
Looking at
Figure 9 it is easy to see the benefits of synchronized dynamic voltages: In a single experiment, running with constant conditions, dynamic voltages increased the signal for each and every ion scanned. The reason for the relatively small (20%) signal increase for hexadecane (C
16H
34), provided with dynamic voltages, is clear when the graphs in
Figure 8 are examined: The optimum static voltages used in the first experiment were mainly chosen to be those who maximize the signal of the ions at 219 Th, and therefore the effect of dynamic voltages on ions with masses in the vicinity of 219 Th are small. The signal for the 450 Th ion (C
32H
66) for example increased by 123% which is a significant increase. It is obvious that correctly tuned dynamic voltages can guarantee the optimal signal for each mass.
The PWM heater control was tested with several user selected PID constant values with good results. The flexible transfer-line temperature enabled by the controller makes it possible to devise smarter operation-methods with enhanced results as discussed before.
GC–MS with standard EI typically serves for the analysis of terpenes in cannabis extracts [
36,
37,
38,
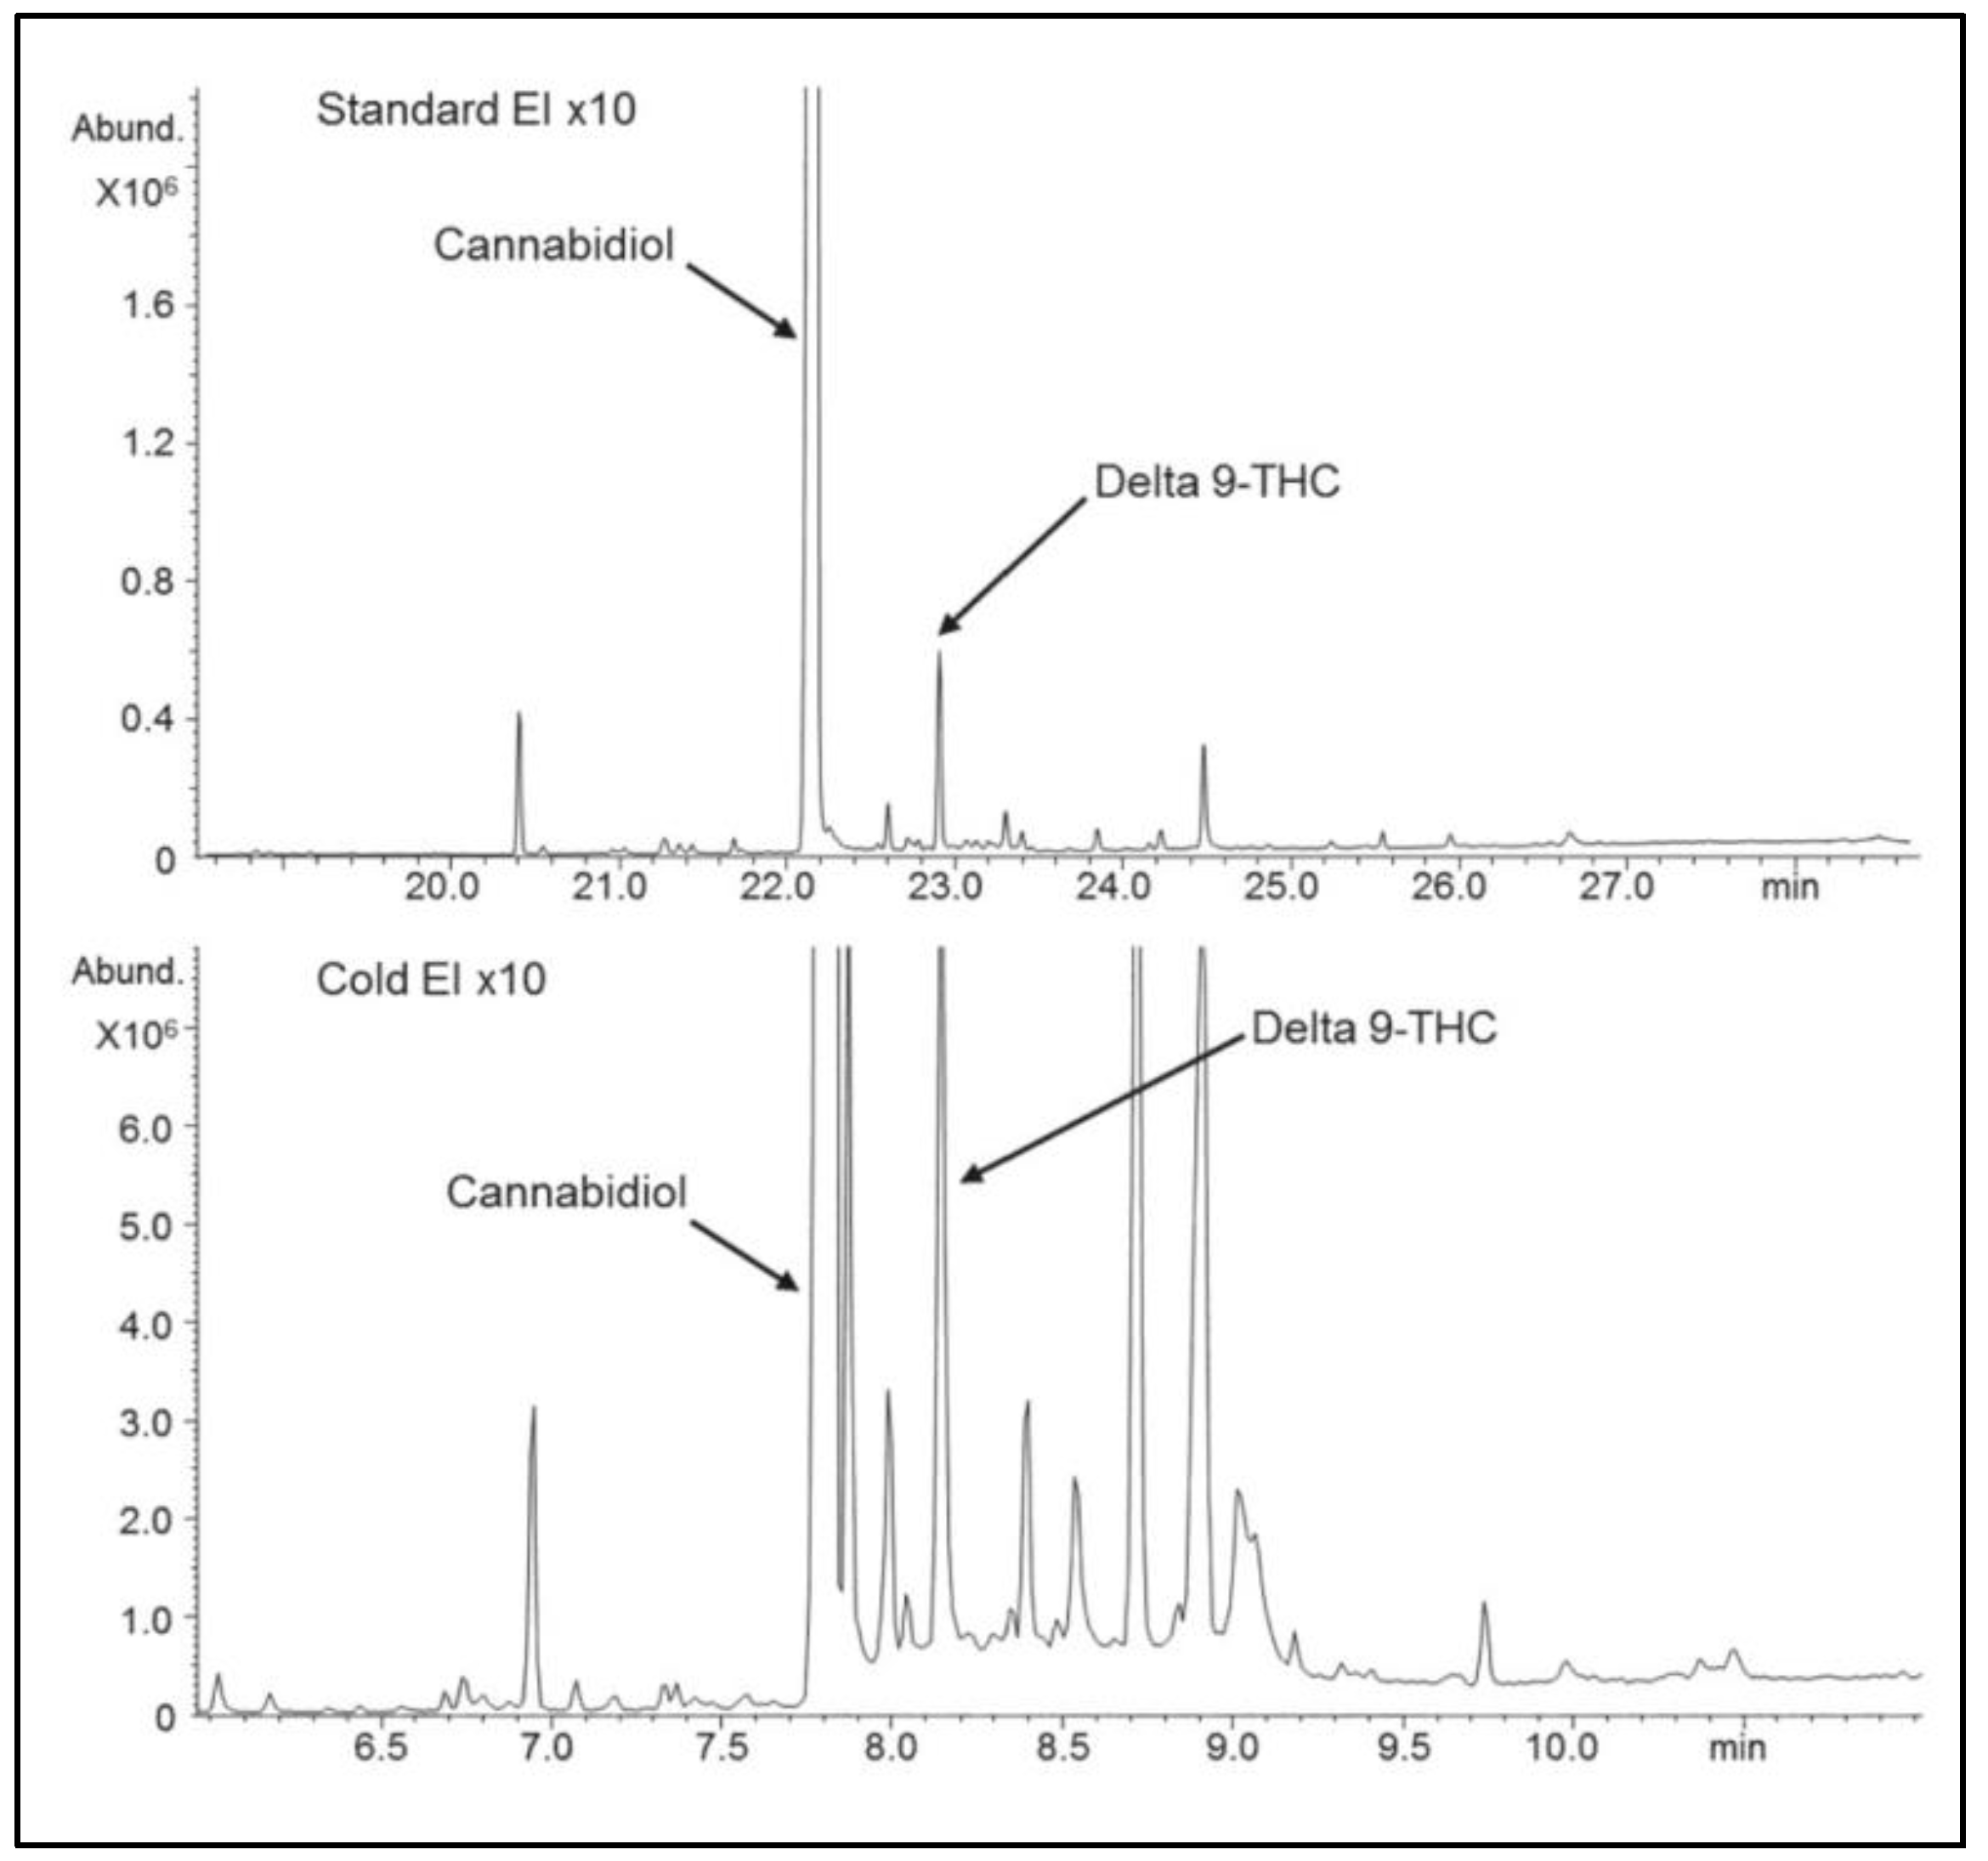
39] and for pesticides analysis, but it is avoided in the analysis of cannabinoids as such analyses require derivatization (which is tedious and not always practical) because without derivatization it is known that compounds with free one or two groups of OH tend to react with the standard EI metallic ion source surface and decompose plus they exhibit compound-dependent nonlinear response. To demonstrate the magnitude of standard EI limitations with underivatized cannabis analysis,
Figure 10 show a comparison of cannabis extract analysis by GC–MS with standard EI (upper) and Cold EI (bottom). Note the much greater number of cannabinoids observed with Cold EI. In addition, all the cannabinoid compounds’ relative abundances to CBD are greater in Cold EI than in standard EI because whereas Cold EI provides uniform response, standard EI provides nonuniform nonlinear response as cannabinoids with free OH decompose on the metallic ion source surface and the degree of such degradation depends on the compound and sample amount.
Figure 11 shows a comparison of mass spectra of the highly branched C
30H
62 squalane hydrocarbon as obtained by cold EI (upper MS), photoionization (second MS), 14 eV EI (third MS), and 70 eV standard EI (bottom MS). The identification probabilities are also included for cold EI and 70 eV standard EI. As demonstrated, neither 70 eV standard EI nor “soft EI” at 14 eV exhibits any molecular ion as their molecular ions abundances are both weaker than 0.01%. Photoionization provides a weak molecular ion (~2% relative abundance), whereas the molecular ion is the base MS peak in cold EI, and it also exhibits a clear isotopic pattern for M + 1 and M + 2. In addition, cold EI clearly (visibly) exhibits both the low mass fragment ions as well as highly amplified isomeric structural mass spectral information.
Figure 11 is not unusual, and it demonstrates how cold EI is far superior to standard EI, low eV EI, and Photoionizationin the mass spectral information provided.
Finally,
Figure 12 presents a picture of the electronic box that serves as a comprehensive controller for cold EI SMB-GCMS. In the figure, one can see the connections to the SMB-GCMS system, EI filament driver, HV lenses amplifiers, HV Anode and Cathode amplifiers, thermocouple sensor, pneumatic drivers, PWM heaters, DSC, and HV power supplies.
5. Conclusions
The design principles of a comprehensive controller for the GC-MS have been demonstrated. Testing the controller with the system showed extraordinary results, provided full interface control and improved the quality of gathered information by providing a stabilized filament emission, a programmable transfer line temperature and synchronized lens voltages.
