Abstract
D-psicose is a rare sugar, used as an alternative to the natural sweetener that provides 70% of sucrose’s sweetness, with low-calorie absorption in the human body. Considering the health-beneficial effect and high availability of D-psicose in raisins (the world’s most consumed dried fruit), it is of interest to establish a reliable analytical method to determine D-psicose content in these matrices. Herein, a new method for determining D-psicose content in raisins, using ultrasound-assisted extraction in conjunction with anion exchange chromatography with pulsed amperometric detection (UAE-HPAEC-PAD) systems, has been developed and validated. The stability of D-psicose and its precursor was priorly assessed by applying a specific ultrasound power (100 W) and pulse duty cycle (0.5 s−1), with varying extraction temperatures (10, 25, 40, 55, 70, and 85 °C) and times (5, 10, 15, 20, and 25 min). The method was validated with high linearity (R2 > 0.999), accuracy (89.78–101.06%), and precision (4.8% intra-day and 4.34% inter-day). A number of raisin products were checked during the method applicability assessment. A concentration of 520 mg kg−1 was found in a specimen of commercial raisin matrix.
1. Introduction
The rare sugar D-psicose (D-ribo-2-hexulose or D-allulose) is an epimerization product of D-fructose at a specific C3 position [1]. With the current increased number of cases of obesity, diabetes, and other sugar-related health issues, this type of sugar is considered a novel low-calorie sweetener substitute for sucrose as table sugar. D-psicose provides 70% of sucrose’s sweetness and contributes merely 0.39 kcal g−1 to the human body [2]. However, the availability of D-psicose in nature is limited. It can be extracted in small quantities from a few natural sources such as the itea plant [3].
Although D-psicose is rarely synthesized by nature, its occurrence in food can be triggered by long-term heating throughout food processing. Oshima, et al. [4] found that the variables of time and temperature positively correlate with the D-psicose content in processed foods. A higher level of D-psicose was observed in dried figs and kiwi fruits than in their raw forms. Furthermore, raisins have been clearly stated to have an even higher D-psicose content than other dried fruit products [4]. The high level of D-psicose in raisin matrices may be due to the drying step that applies high temperature and long-time processing. Raisins that are made from fresh grapes contain 6.9 to 7.6% D-fructose [5], which can be converted to D-psicose by the epimerization reaction mechanism. Additionally, as water is removed from the matrices during the drying process to reach low moisture content (14–16%), the concentration of D-psicose in the final product can be increased [6]. Hence, considering the potential of raisins as a natural source of D-psicose, it is necessary to establish a reliable analytical method to accurately determine this rare sugar in the raisins. This analytical tool may be helpful for further study, assisting the development of functional food or routine analyses in food industries with a large number of samples per day.
The current conventional extraction methods, including maceration and hot water extraction, are energy- and time-consuming. In addition, these methods result in low extraction yield [7]. Several modern extraction methods, such as subcritical water [8] or pressurized liquid extraction [9], are unsuitable for D-psicose extraction, as they use a high temperature treatment. Another alternative method, supercritical fluid extraction, applies low to moderate extraction temperatures; however, a high percentage of organic solvent must be used in the extracting fluid due to the high polarity of D-psicose [10]. Ultrasound-assisted extraction (UAE) is another approach to increase the efficiency of solid–liquid extraction at moderate temperatures, with specific satisfactory results in the recovery of sugars from vegetable samples. UAE causes less damage to the environment, since the physical treatment by the cavitation endorses the extraction, even with a lower number of sample matrices and smaller amount of solvent [11].
There are also some chromatographic problems, due to the chemical similarity between D-psicose and D-fructose. A previous study [4] built the post-column method for the combination of gel permeability chromatography–ligand exchange (GPC–LEX) and high-performance anion exchange chromatography-pulsed amperometric detection (HPAEC–PAD), to determine D-psicose in various food matrices. Those methods succeeded in avoiding the degradation of fructose due to high eluent pH in regular HPAEC systems. However, due to the combination of the two chromatographic techniques, the method was time-consuming, and had limited applicability. Surapureddi et al. [12] successfully developed a capillary electrophoresis method to separate D-psicose from other sugars based on their molecular size. However, it was susceptible to interfering with other similarly sized sugar compounds in the matrix, including D-fructose. A recent study of D-psicose analysis, using HPLC with evaporative light scattering detection (ELSD) to detect adulteration in honey, was reported by Xie et al. [13]. Nevertheless, problems appeared when specific sugar compounds could not be fully separated because of their similar polarity strength and the non-linear response of ELSD in the low-concentration analyte detection.
Based on the reasons above, a rapid yet reliable method to determine D-psicose in raisin matrices using ultrasound-assisted extraction, coupled with high-performance anion exchange chromatography-pulsed amperometric detection (UAE-HPAEC-PAD), has been studied. A similar approach has been used to extract and quantify sugar compounds in peaberry coffee [14]. The stability study of D-psicose was performed before the method validation. Finally, the validated method was applied to determine D-psicose in commercially available raisins.
2. Materials and Methods
2.1. Chemicals and Reagents
Analytical grade standards of D-psicose, D-fructose, and lactose were purchased from Sigma–Aldrich Chemical Co. (St. Louis, MO, USA). The Milli-Q system was employed to filter the ultrapure water (Millipore Corp., Bedford, MA, USA). Analytical grade reagents, including anhydrous sodium acetate and sodium hydroxide, were also supplied from Sigma–Aldrich Chemical Co.
2.2. Raisins Samples
Four commercial raisin samples comprising three different varieties were acquired at a local market for the method validation. The varieties include two Thompson seedless raisins, cultivated in Spain and Chile; a Muscat raisin from Spain; and a Sultana raisin from Turkey. The four samples were mixed and ground in a food processor (Thermomix TM31, Vorwerk International Strecker & Co., Wollerau, Switzerland) for 30 s, using the highest speed of the food processor’s settings. Henceforth, a typical joint sample was used for method development. To test the method’s applicability, those four samples were analyzed individually. Two additional samples from California (Sun-Maid Growers of California, Fresno, CA, USA) and Indonesia (PT. Trillions Naturalindo Multiboga, Bandung, Indonesia) were also included in the analysis. The ground samples were stored in a dry place at room temperature.
2.3. Extraction Method
The extraction method was adopted from the previous study [4], with a minor modification to fulfil the study’s purposes. An ultrasound probe, Sonopuls HD 4400 (Bandelin electronic, Berlin, Germany) with the aid of water bath circuit cooler, Frigiterm TFT-30 (J.P. Selecta, Barcelona, Spain) was used for the ultrasound-assisted extraction (UAE), as demonstrated in Figure 1. The sample to solvent ratio used for the whole extraction in this study was 1 g to 20 mL of water. For the specific ultrasound power and pulse duty cycle, 100 W and 0.5 s−1 were applied, respectively. To check the occurrence of epimerization of fructose to produce D-psicose by UAE, a constant extraction temperature of 50 °C with various extraction times (5, 10, 15, 20, and 25 min) was applied. By contrast, a constant extraction time of 10 min with various extraction temperatures (10, 25, 40, 55, 70, and 85 °C) was conducted to evaluate the stability of D-psicose during the extraction.
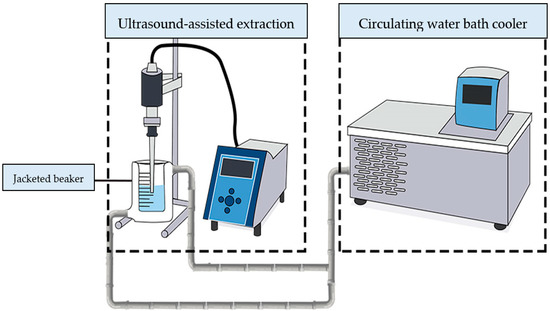
Figure 1.
Schematic of extraction system using UAE coupled with circuit water bath cooler.
2.4. HPAEC-PAD
Chromatographic analyses were conducted using high-performance anion exchange chromatography (HPAE) equipment (Metrohm 930 Compact I.C. Flex, Gallen, Switzerland). The detection system incorporated a pulsed amperometric detector (PAD) with a gold working electrode. Using an aqueous mobile phase containing 300 mM sodium hydroxide and 1 mM sodium acetate, elution was performed at a flow rate of 0.5 mL min−1. Separation of the compounds was performed in a Metrosep Carb 2–150/4.0 column (Metohm). The chromatographic analysis was processed using MagIC net®, version 3.1 (Metrohm) software. Before chromatographic analysis, all samples were diluted 1:25 with HPLC-grade water to ensure that the concentrations of the compound were included within the linear ranges of the calibration curves. The sample was priorly filtered through a 0.45 µm nylon filter to guarantee that no impurities reached the chromatographic system. The volume of the injection was fixed at 5 µL. The resulting peaks were identified by comparing the retention period of the peaks with that of reference standard compounds.
2.5. Method Validation
The validation of the proposed method involved the evaluation of linearity; accuracy; precision; the limit of detection (LOD); and the limit of quantification (LOQ), in accordance with ICH (R1) recommendations [13]. For the linearity evaluation, six standard solutions ranging from 1 to 10 mg L−1 were generated by diluting a stock solution with water. Calibration curves were established by measuring the peak area corresponding to D-psicose as a function of the concentration injected. The standard error of regression, slope, and coefficient of determination (R2) were calculated based on a triple calibration set. LOD and LOQ were subsequently determined.
A mixture of four representative blank samples (Thompson, Sultana, Malaga, Bio) was supplemented at three different concentrations to assess recovery and precision at three levels 2, 6, and 10 mg kg−1. Precision was determined by calculating the intra- and inter-day coefficients of variation (CV, %). For each level of spiking, triplicates were conducted. All the above parameters were compared with the ICH official method validation guidelines to check the acceptance [15].
2.6. Statistical Analysis
Minitab Statistical Software (Minitab, LLC., State College, PA, USA) was utilized for the stability study of fructose and psicose to run a one-way ANOVA (p = 0.05). Subsequently, a least significant difference (LSD, p = 0.05) test was conducted to check the significant differences among the means. Microsoft Office’s Analysis ToolPak was used to evaluate the linear regression of the experimental outcomes of the psicose calibration curve, and further calculate LOD and LOQ.
3. Results and Discussion
3.1. Stability Study of Psicose and Its Precursor under UAE
The stability study of psicose and its precursor (fructose) aimed to ensure that the proposed UAE, as a sample preparation step in the determination method, did not significantly alter the analyte initially presented in the sample. It must be noted that ultrasounds provide energy to the system, mainly at the interface between the liquid solvent and the solid sample. Therefore, the solvent and sample were heated to promote the epimerization reactions. The UAE process was evaluated in the range of 5 to 25 min at 50 °C, to ensure that epimerization of fructose into psicose did not occur during the extraction (Figure 2). ANOVA suggested that fructose values were not significantly different at any time (Table 1). Therefore, fructose was fully stable in the extraction conditions for up to 25 min. However, 10 min was chosen for further experiments. A 10 min extraction time of psicose was also used in various food matrices, using UAE at 20 °C [4]. These results agreed with the previous work on fructose stability behavior regarding heating temperature and time, which explained that significant fructose degradation was observed in the heating process at a range of 110–150 °C temperature for 1 to 5 h [16].
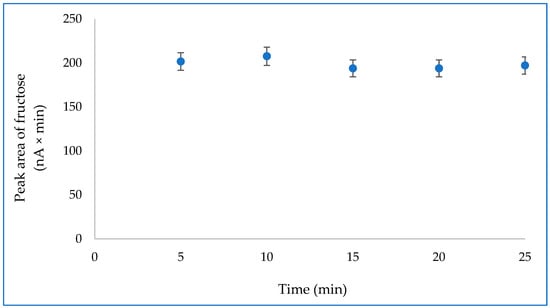
Figure 2.
Peak area of fructose (nA × min) versus extraction time (min).

Table 1.
Analysis of variance for the effect of extraction time on the fructose stability.
A similar study was performed to determine the stability of psicose during regular UAE conditions. In this case, different extraction temperatures were evaluated (10 to 85 °C) in a constant extraction time (10 min). These experiments were carried out by spiking the standard of psicose on raisins to guarantee that any effect related to the interaction between psicose and the raisin matrix could be observed. Moreover, these psicose levels were not increased due to the degradation of fructose in the samples. The results are shown in Figure 3. There were no significant differences (p < 0.05) in the extraction results due to different extraction temperatures (Table 2). These results concluded that extractions of psicose could be performed at any temperature between 10 and 85 °C without worrying about significant changes in psicose content affected by the extraction process. A specific 25 °C extraction temperature was chosen for the subsequent studies, because it provided a very low standard deviation and allowed a very fast stabilization of the extraction media. The other reported method to determine psicose also works at room temperature for the extraction procedure [4]. Some degradation reactions have also been reported, precisely the Maillard reaction for psicose extraction, which was run at temperatures around 100 °C and higher [17].
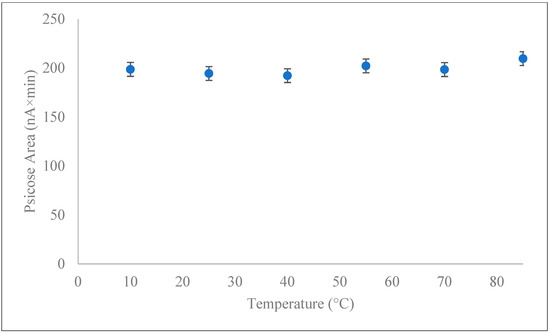
Figure 3.
Psicose peak area response versus extraction temperature.

Table 2.
Analysis of variance for the effect of extraction temperature on the psicose stability.
3.2. Method Validation
3.2.1. Selectivity
The selectivity indicates the capacity of the method to separate the target analyte in the presence of matrix interfaces [17]. Through examination of the solution of psicose standard mixed with other sugar standard compounds (fructose and lactose) that were eluted just before and after the psicose in the anion exchange chromatography systems, the absence of false positive results was investigated. As demonstrated in Figure 4A, there are no interference peaks at the expected retention time (7.9 min) for psicose. The resolution value should be calculated to conclude that the psicose peak was eluted as a single compound, and no other compounds overlap with the peak. From the resulting chromatogram, it can be seen that the mean resolution value between fructose and psicose was greater than 1.5, showing that fructose–psicose peaks were separated from each other. In contrast, the mean resolution value between psicose and lactose was lower than 1.5, indicating that psicose and lactose were not completely separated [18]. Nonetheless, in the case of natural raisin matrices that were spiked with the psicose standard (Figure 4B), it can be seen that lactose was not detected. Hence, the problems regarding partially separated peaks between psicose and lactose could be ruled out of this determination method.
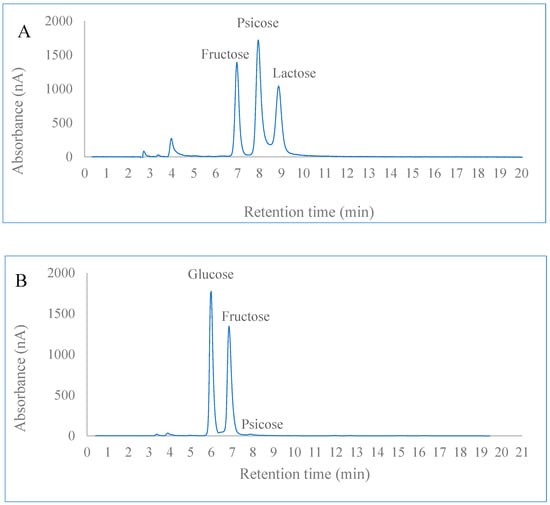
Figure 4.
The representative chromatograms of a mixture of standard compounds (fructose–psicose–lactose) (A) and extract from raisins spiked with psicose standard (B).
3.2.2. Method linearity, LOD, and LOQ
Five levels of psicose concentration (1.0, 2.5, 5.0, 7.5, and 10 mg L−1 ) in triplicate were used to assess the linearity over the concentration range. Figure 5 shows the calibration curve for psicose that resulted in a coefficient of regression (R2) of 0.9982. The limit of detection (LOD) and limit of quantification (LOQ) were determined using three and ten times, respectively, the slope, divided by the standard deviation at the origin of the calibration curve. The resulting values for LOD and LOQ were 208.6 ng kg−1 and 695 ng kg−1, respectively.
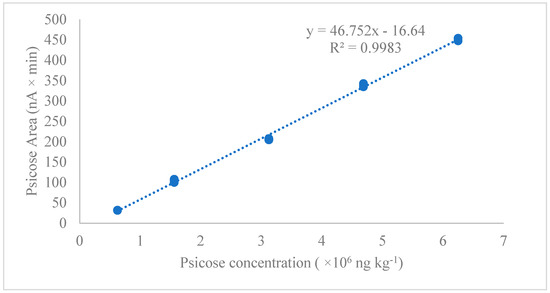
Figure 5.
HPAEC−PAD calibration curve of D-psicose.
3.2.3. Accuracy and Precision
Nine replicate samples of raisins spiked with psicose standard solution at three distinct concentrations (2, 6, and 10 mg kg−1) were analyzed for accuracy and precision. The extraction process was conducted using UAE conditions (100 W ultrasound power, 0.5 s−1 pulse duty cycle, 25 °C extraction temperature, 10 min extraction time) which have been evaluated in regard to the stability of fructose and psicose. The mean recovery recorded for each psicose standard concentration was 101.6% for 2 mg kg−1, 91.64% for 6 mg kg−1, and 89.78% for 10 mg kg−1. Meanwhile, the precision (CV, %) for intra-day was 4.80%, and for intermediate precision was 4.34%, indicating a high-precision method for psicose determination. The recovery values of the developed methods were comparable with the psicose recoveries from coffee (93.8–98.4%) and corn snacks (93.7–101.3%), which were previously reported [4] using similar extraction methods, with GPC-LEX post-column and HPLC-PAD as the determination method.
3.2.4. Real Sample Applications
After the proposed UAE-HPAEC-PAD for psicose determination in raisins had been proven to have high precision and accuracy, the method was utilized to analyze the real raisin samples to evaluate its applicability. Therefore, the method was applied to four Spanish raisin samples, one Indonesian raisin sample, and one raisin sample from the USA. Only one sample showed a level of psicose above the limit of quantification (520 mg kg−1). These results agreed with the level range of psicose previously reported [4].
4. Conclusions
The linearity, accuracy, precision, detection limit, and quantification limit of the UAE-HPAEC-PAD method to determine psicose in raisins have been evaluated following the ICH recommendations. Psicose was quantified in one specific commercial raisin sample above the limit of quantification. These results showed that the combination of ultrasound-assisted extraction and the chromatographic method allows for the reliable determination of psicose in raisins with fast sample preparation.
Author Contributions
Conceptualization, F.M.Z., M.P. and W.S.; methodology, M.P.; software, F.M.Z.; validation, M.P.; formal analysis, F.M.Z.; investigation, F.M.Z.; resources, M.P.; data curation, W.S. and M.P.; writing—original draft preparation, F.M.Z.; writing—review and editing, W.S. and M.P.; visualization, F.M.Z. and W.S.; supervision, W.S. and M.P.; project administration, W.S.; funding acquisition, W.S. and M.P. All authors have read and agreed to the published version of the manuscript.
Funding
This research was funded by an Erasmus + KA107 program in 2022.
Acknowledgments
This report forms part of the activity carried out by F.M.Z. at the University of Cadiz, Spain, under the frame of Erasmus Mundus Master in Quality in Analytical Laboratories (EMQAL) supported by the Education, Audiovisual and Culture Executive Agency (EACEA).
Conflicts of Interest
The funders had no role in the design of the study; in the collection, analyses, or interpretation of data; in the writing of the manuscript; or in the decision to publish the results.
References
- Tanaka, K.; Yamaj, M. Crysta l Structure, Solubility, and Mutarotation of the Rare Monosaccharide D-Psicose. Bull. Chem. Soc. Jpn. 2010, 1197, 1193–1197. [Google Scholar]
- Iida, T.; Hayashi, N.; Yamada, T.; Yoshikawa, Y.; Miyazato, S.; Kishimoto, Y.; Okuma, K.; Tokuda, M.; Izumori, K. Failure of d-psicose absorbed in the small intestine to metabolize into energy and its low large intestinal fermentability in humans. Metab. Clin. Exp. 2010, 59, 206–214. [Google Scholar] [CrossRef] [PubMed]
- Ayers, B.J.; Hollinshead, J.; Saville, A.W.; Nakagawa, S.; Adachi, I.; Kato, A.; Izumori, K.; Bartholomew, B.; Fleet GW, J.; Nash, R.J. Iteamine, the first alkaloid isolated from Itea virginica L. inflorescence. Phytochemistry 2014, 100, 126–131. [Google Scholar] [CrossRef] [PubMed]
- Oshima, H.; Kimura, I.; Izumori, K. Psicose contents in various food products and its origin. Food Sci. Technol. Res. 2006, 12, 137–143. [Google Scholar] [CrossRef]
- Johnson, J.M.; Conforti, F.D. Fructose. Food Technol. 2003, 53, 88–95. [Google Scholar]
- Benlloch-Tinoco, M.; Carranza-Concha, J.; Camacho, M.M.; Martínez-Navarrete, N. Chapter 22—Production of Raisins and Its Impact on Active Compounds; Academic Press: Cambridge, MA, USA, 2015; pp. 181–187. [Google Scholar] [CrossRef]
- Das, P.R.; Kim, Y.; Hong, S.J.; Eun, J.B. Profiling of volatile and non-phenolic metabolites—Amino acids, organic acids, and sugars of green tea extracts obtained by different extraction techniques. Food Chem. 2019, 296, 69–77. [Google Scholar] [CrossRef] [PubMed]
- Pattnaik, F.; Nanda, S.; Kumar, V.; Naik, S.; Dalai, A.K. Subcritical water hydrolysis of Phragmites for sugar extraction and catalytic conversion to platform chemicals. Biomass Bioenergy 2021, 145, 105965. [Google Scholar] [CrossRef]
- Herbst, G.; Hamerski, F.; Errico, M.; Corazza, M.L. Pressurized liquid extraction of brewer’s spent grain: Kinetics and crude extracts characterization. J. Ind. Eng. Chem. 2021, 102, 370–383. [Google Scholar] [CrossRef]
- Palma, M.; Taylor, L.T.; Zoecklein, B.W.; Douglas, L.S. Supercritical Fluid Extraction of Grape Glycosides. J. Agric. Food Chem. 2000, 48, 775–779. [Google Scholar] [CrossRef] [PubMed]
- Polachini, T.C.; Mulet, A.; Telis-Romero, J.; Cárcel, J.A. Influence of high-intensity ultrasound application on the kinetics of sugar release from acid suspensions of artichoke (Cynara scolymus) biomass. Chem. Eng. Process. Process Intensif. 2019, 145, 107681. [Google Scholar] [CrossRef]
- Surapureddi, S.R.K.; Kunta, R.; Kumar, G.S.S.; Sappidi, S.R.; Dadke, S. A sensitive and high throughput method for the analysis of D-Psicose by capillary electrophoresis. Food Chem. 2019, 281, 36–40. [Google Scholar] [CrossRef]
- Xie, Q.; Huang, X.; Ji, X.; Jia, G.; Sang, Y.; Cui, Z.; Zhang, J. Comprehensive investigation of psicose in Chinese honeys and the assessment of its potential as a new marker for honey adulteration detection. J. Food Compos. Anal. 2022, 108, 104444. [Google Scholar] [CrossRef]
- Setyaningsih, W.; Putro, A.W.; Fathimah, R.N.; Kurnia, K.A.; Darmawan, N.; Yulianto, B.; Krisma, P.; Carrera, C.A.; Palma, M. A microwave-based extraction method for the determination of sugar and polyols: Application to the characterization of regular and peaberry coffees. Arab. J. Chem. 2021, 15, 4–6. [Google Scholar] [CrossRef]
- ICH. ICH Topic Q2 (R1) Validation of Analytical Procedures: Text and Methodology. In Definitions; ICH: Geneva, Switzerland, 2005; Volume 2, pp. 1–15. [Google Scholar] [CrossRef]
- Woo, K.S.; Hwang, I.G.; Kim, H.Y.; Jang KIl Lee, J.; Kang, T.S.; Jeong, H.S. Thermal degradation characteristics and antioxidant activity of fructose solution with heating temperature and time. J. Med. Food 2011, 14, 167–172. [Google Scholar] [CrossRef] [PubMed]
- Emons, H. Method validation. Accredit. Qual. Assur. 2013, 18, 457–458. [Google Scholar] [CrossRef]
- Oshima, H.; Ozaki, Y.; Kitakubo, Y.; Hayakawa, S. Decrease in the d-psicose content of processed foods fortified with a rare sugar. Food Sci. Technol. Res. 2014, 20, 415–421. [Google Scholar] [CrossRef]
Publisher’s Note: MDPI stays neutral with regard to jurisdictional claims in published maps and institutional affiliations. |
© 2022 by the authors. Licensee MDPI, Basel, Switzerland. This article is an open access article distributed under the terms and conditions of the Creative Commons Attribution (CC BY) license (https://creativecommons.org/licenses/by/4.0/).