Article

Phytochemical and Biological Characterization of the Fractions of the Aqueous and Ethanolic Extracts of Parthenium hysterophorus

by
Miguel A. Alfaro Jiménez
1,
Alejandro Zugasti Cruz
1,
Sonia Y. Silva Belmares
2,
Juan A. Ascacio Valdés
3 and
Crystel A. Sierra Rivera
1,*
1
Laboratory of Immunology and Toxicology, Faculty of Chemistry, Autonomous University of Coahuila, Venustiano Carranza Blvd. and José Cárdenas Valdés Street, Saltillo 25280, Coahuila, Mexico
2
Laboratory of Bioactive Compounds, Faculty of Chemistry, Autonomous University of Coahuila, Venustiano Carranza Blvd. and José Cárdenas Valdés Street, Saltillo 25280, Coahuila, Mexico
3
Department of Food Research, Faculty of Chemistry, Autonomous University of Coahuila, Venustiano Carranza Blvd. and José Cárdenas Valdés Street, Saltillo 25280, Coahuila, Mexico
*
Author to whom correspondence should be addressed.
Separations 2022, 9(11), 359; https://doi.org/10.3390/separations9110359
Submission received: 10 October 2022 / Revised: 30 October 2022 / Accepted: 1 November 2022 / Published: 9 November 2022
(This article belongs to the Special Issue Separation, Extraction and Purification of Natural Products)

Abstract

:
In this study, the fractions of the aqueous (AE) and ethanolic (EE) crude extracts of Parthenium hysterophorus were evaluated for their phytochemical composition, cytotoxic, and antioxidant activity. The two extracts were subjected to a fractionation by vacuum liquid chromatography, obtaining seven fractions for each extract. These fractions were evaluated for the presence of phenolic compounds by reverse phase high performance liquid chromatography coupled to mass spectrometer (RP-HPLC-MS) analysis. Their cytotoxic activity was tested with a hemolysis assay. The antioxidant activity was evaluated with the Trolox equivalent antioxidant capacity (TEAC), 2,2-diphenyl-1-picrylhydrazyl (DPPH), and hydroxyl radical (–OH) scavenging assays. In addition, the effect of the fractions on the activity of the antioxidant enzymes superoxide dismutase (SOD) and catalase (CAT), from human erythrocytes, was evaluated. The phytochemical screening by RP-HPLC-MS mainly showed the presence of flavonoids and hydroxycinnamic acids. The hemolysis assay exhibited a low cytotoxic activity by the fractions of the AE, but the fractions of the EE exhibited a hemolytic effect. The fractions of the AE and EE showed significant antioxidant activity to inhibit radicals in the three radical scavenging assays. Moreover, only some fractions of the AE showed a significant increase in the activity of the SOD enzyme, while the activity of CAT exhibited a significant increase by the fractions of the two extracts. The fractions of the AE and EE of P. hysterophorus have phytochemicals with antioxidant activity to inhibit radicals and increase the activity of in vitro antioxidant enzymes.

Graphical Abstract

1. Introduction

Nowadays, oxidative stress is one of the main causes of the development of chronic diseases such as cancer, diabetes, and cardiovascular illnesses, which are responsible for 70% of mortality globally [1]. The oxidative stress is caused by an excessive formation of reactive oxygen species (ROS) in the organism that produce cytotoxic effects, inducing multiple types of damage in different organs and tissues [2]. For this reason, it is of interest to study the obtention of compounds from natural sources with antioxidant properties without producing cytotoxicity and whose consumption can contribute to the prevention of the development of chronic diseases.
For a long time, plant crude extracts have been used in traditional medicine for several diseases. These are constituted by complex mixtures of phytochemicals, also known as secondary metabolites, that can be recovered from plant material by conventional and non-conventional extraction methods [3]. The conventional extraction methods are known to be used for the preparation of plant extracts which are used for multiple purposes, including the treatment of health issues. Some of these procedures are maceration, filtration, percolation, and decoction. Among these methods, decoction has been popular in traditional medicine for the preparation of herbal medicine because it allows for obtaining water-soluble and thermostable phytochemicals from plants though the application of heat on an aqueous solution up to the boiling point. The phytochemicals that are recovered by decoction can demonstrate different biological properties, including antioxidant activity [4].
On the other hand, the group of non-conventional extraction methods is constituted by several procedures, which are famous for exhibiting major advantages compared to conventional methods, such as the obtention of higher yields, a reduction in time of extraction, and the generation of low negative effects on the environment [5]. Among the non-conventional methods, the ultrasound-assisted extraction is a procedure that consists of the application of ultrasonic waves on plant material that induces cell disruption through physical forces that are generated during a process of cavitation that contributes to the release of metabolites into the solvent in which the plant material is present [6]. Moreover, previous studies have demonstrated the plant crude extracts obtained with the use of ultrasonic extraction consist of metabolites with antioxidant properties [4]. The presence of different groups of phytochemicals has an influence on the biological activities of the crude extracts, including the antioxidant activity, due to the interactions between the metabolites which can produce additive or synergistic effects on their ability to inhibit ROS [7]. However, it has been reported that these interactions can also produce antagonistic effects, causing a decrease in the antioxidant potential of these compounds [8].
For the above, plant crude extracts can be subjected to a process of fractionation that involves the partial separation of the phytochemical components of the extracts which are recovered in various fractions by chromatographic methods [9]. Subsequently, the evaluation of the phytochemical profile and antioxidant activity of each fraction contributes to the identification of those phytochemical groups that could be responsible for producing antioxidant effects similar to or even higher than those exhibited by the total crude extract; this because of the separation of its phytochemical constituents [3].
Fractionation is a recommended method for the study of the phytochemical composition and antioxidant activity of plant extracts, especially in those obtained from plant species that are used in traditional medicine and which could be important sources of metabolites with beneficial properties for human health [10]. One of these is Parthenium hysterophorus, a plant belonging to the Asteraceae family that is native to northeast Mexico but is also distributed in several countries around the world [11,12]. The aqueous extracts obtained from P. hysterophorus by decoction are used in traditional medicine for the treatment of health issues such as wounds, fever, anemia, and inflammatory skins [13]. For this reason, the study of the biological potential of extracts obtained from the different parts of the plant, including its flowers, is of interest. Previous studies have reported that the flowers of P. hysterophorus are sources of phytochemicals, such as phenolic compounds with biological properties that include antitumor, antimicrobial, and antioxidant activity [13,14,15,16].
The previous evaluations performed by our research department exhibited that the aqueous (AE) and ethanolic (EE) crude extracts obtained from the flowers of P. hysterophorus demonstrated antioxidant activity capable of inhibiting free radicals in an in vitro model. In addition, the two crude extracts were shown to have effects on the intracellular antioxidant enzymes superoxide dismutase (SOD) and catalase (CAT) from human erythrocytes, in which the AE extract produced an increase in the antioxidant activity of SOD and CAT enzymes in some concentrations, while the EE extract did not exhibit SOD activity, but the CAT activity was increased in some concentrations [4].
Previous studies have also reported the cytotoxic and antioxidant properties of crude extracts of specimens of P. hysterophorus from India, but there is minimal information about the phytochemical composition of fractions from crude extracts of P. hysterophorus plants found in Mexico and their possible correlation with their cytotoxic effects and antioxidant activity to identify potential modifications on these properties that could be associated with the partial separation of metabolites of the crude extracts [13,15]. For this reason, we performed the fractionation of the AE and EE crude extracts from the P. hysterophorus flowers in this study to evaluate the phytochemical composition of these fractions and determine their cytotoxic and antioxidant activities.

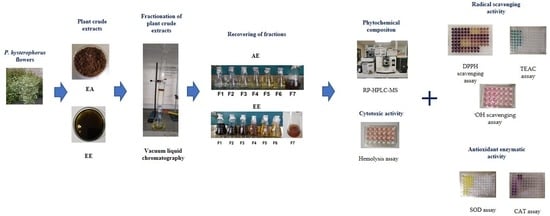
2. Materials and Methods

2.1. Plant Material

The P. hysterophorus plants were collected in Saltillo, Coahuila, Mexico at the coordinates 25°26′29.6″ N, 100°59′06.6″ W during August 2019. The plant specimen was identified taxonomically by José Ángel Villarreal Quintanilla, PhD, and specimens were preserved in the herbarium of the Antonio Narro Agrarian Autonomous University (UAAAN) with the registry number 101810. Subsequently, flowers were washed with deionized water (H2O), dried by lyophilization (Labconco FreeZone 1 Liter Benchtop Freeze Dry System, Labconco, Kansas City, MO, USA), and stored at −80 °C until use.

2.2. Preparation of the AE and EE Extracts of P. hysterophorus

The AE and EE crude extracts of P. hysterophorus flowers were obtained by the extraction methods of decoction and ultrasound assisted extraction, respectively, following the methodologies previously reported by Alfaro-Jiménez et al. (2021) [4]. The description of the extraction procedures for the AE and EE extracts is shown below.

2.2.1. AE Crude Extract

The flowers (140 g) were immersed in H2O to a proportion of 10% weight of extract/volume of solvent (w/v) in Erlenmeyer flasks which were incubated at 4 °C for 90 h. Thereafter, flasks were heated until ebullition and maintained for 15 min. Then, flasks were incubated again at 4 °C for 48 h. Subsequently, the suspension was filtered with Whatman filters No. 4 (20 µm) and concentrated to dryness by lyophilization for 72 h, obtaining the AE crude extract.

2.2.2. EE Crude Extract

Flowers (137 g) were ground and immersed in ethanol (EtOH) 96° to a proportion of 5% (w/v) in Erlenmeyer flasks which were placed in ultrasound equipment (Branson 3800, 40 kHz) for 30 min at room temperature. Then, the ethanolic suspension was filtered with Whatman filters No. 4 (20 µm) and clarified using Whatman filters GF/A (1.6 µm). The solvent was eliminated by evaporation in a rotary evaporator (BÜCHI RE 120, BUCHI, Flawil, SG, Switzerland) coupled to a recirculatory system (Lauda Alpha Ra 8, LAUDA, Lauda-Königshofen, BW, Germany) under reduced pressure (20 psi) at 45 °C, obtaining the EE crude extract.

2.3. Fractionation of the AE and EE Extracts of P. hysterophorus

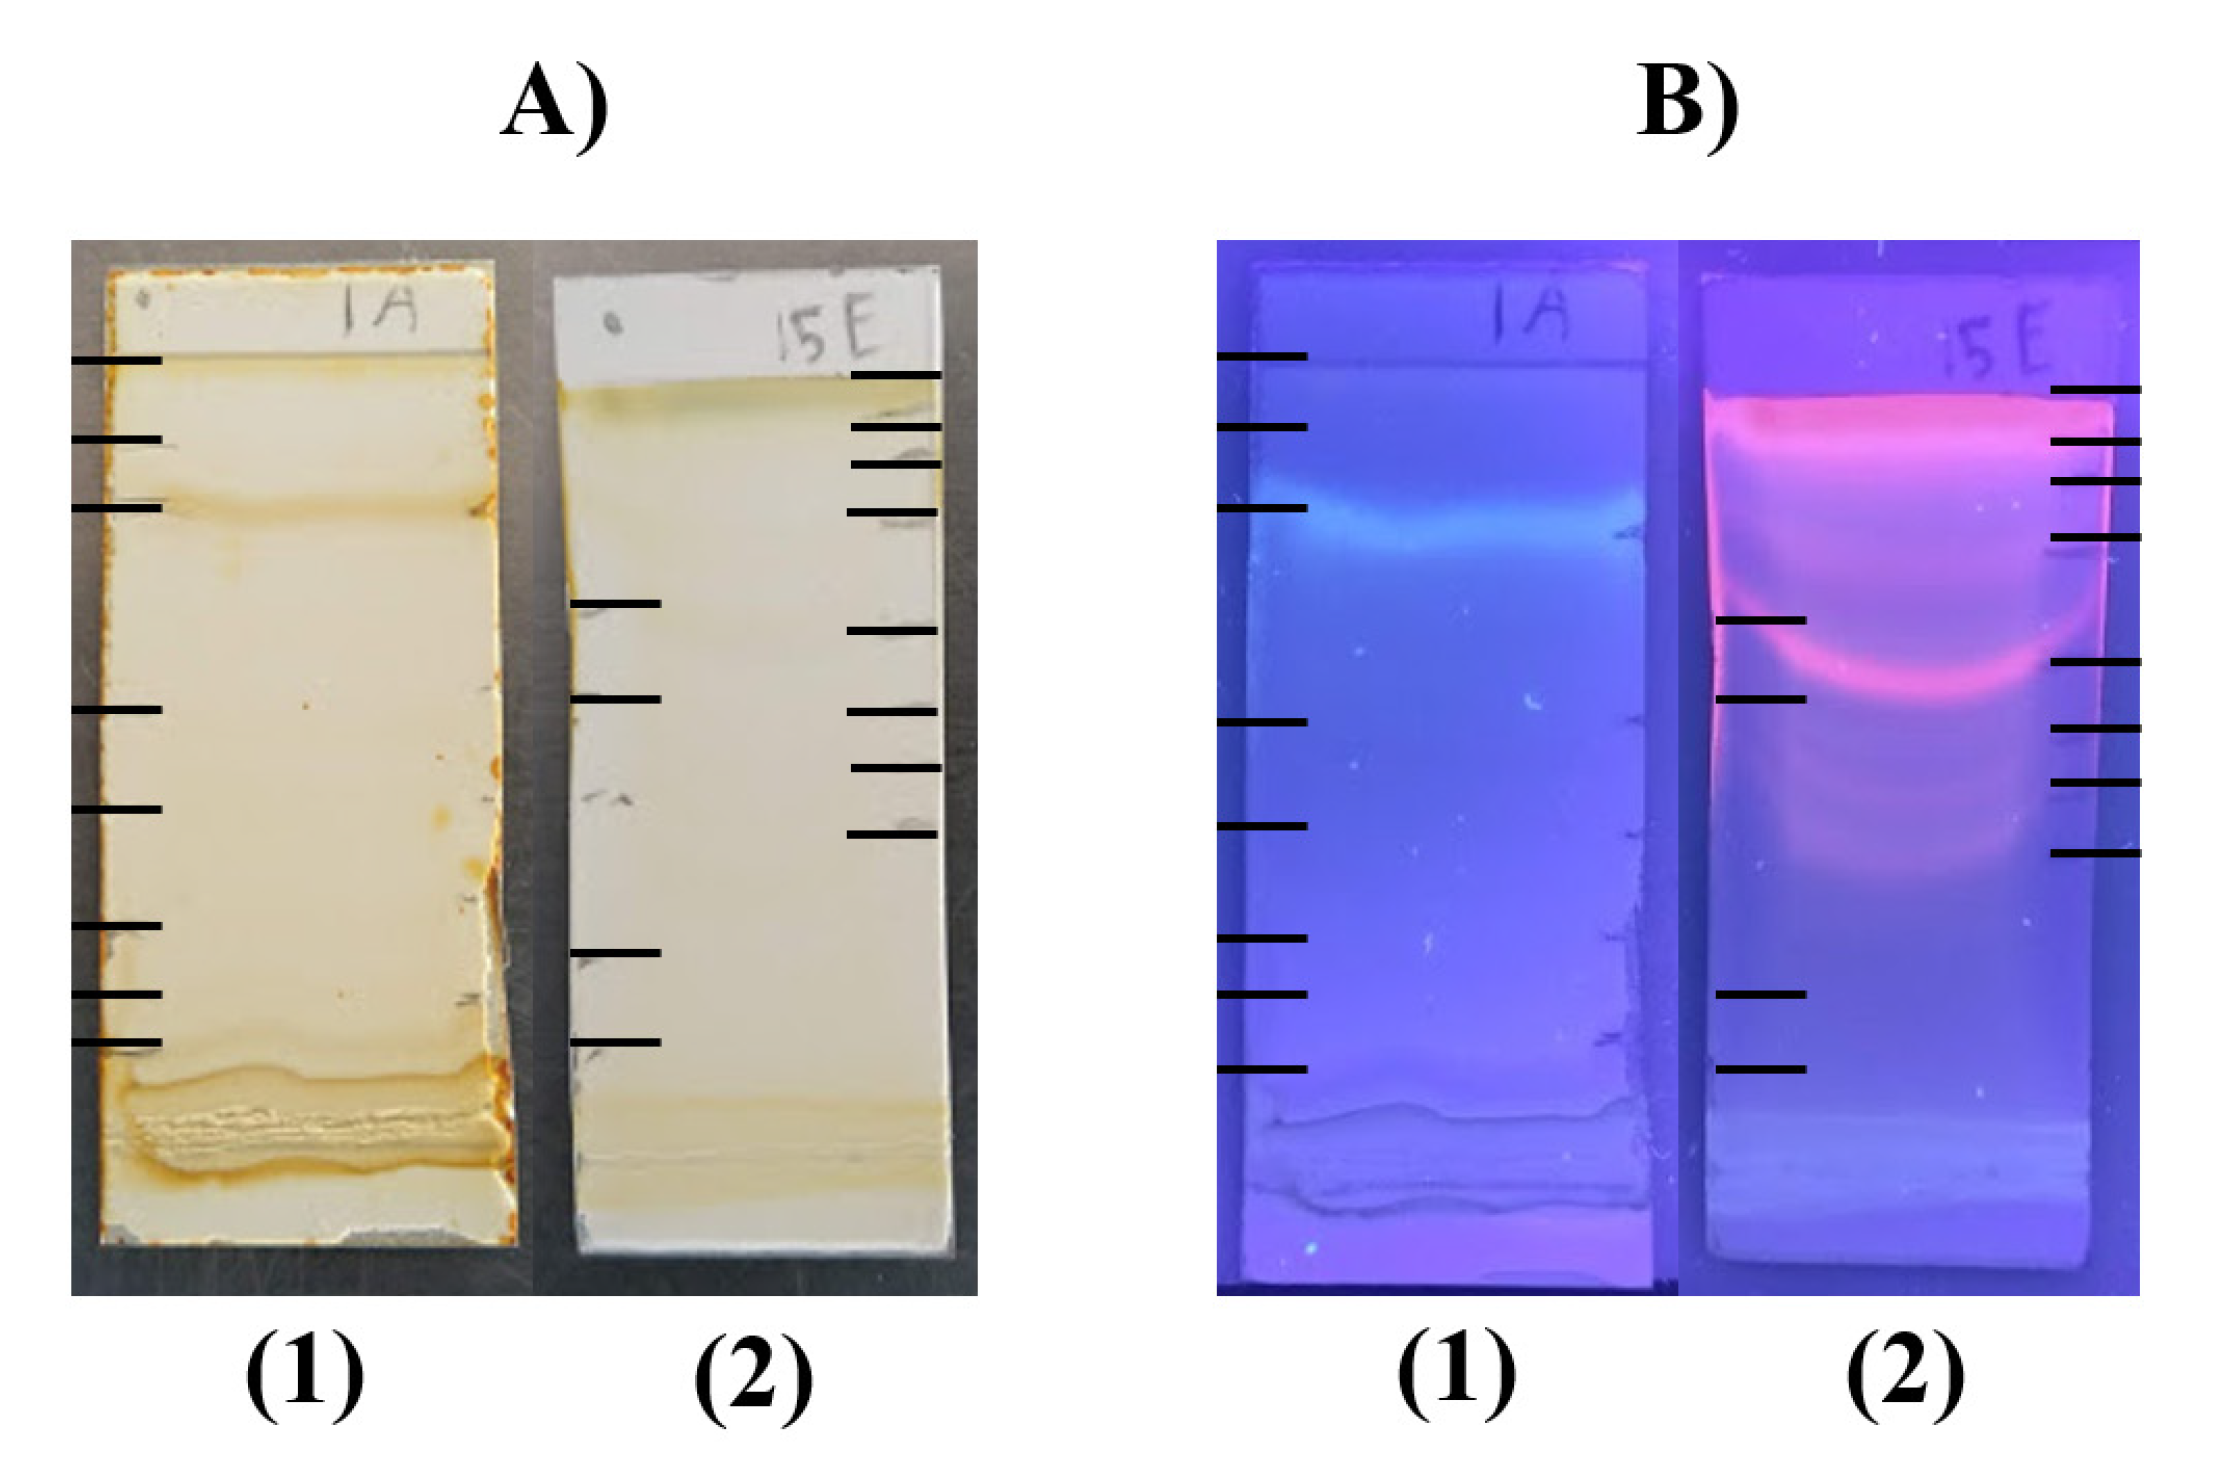
2.3.1. Selection of Mobile Phase for the Fractionation of the Crude Extracts

Firstly, an evaluation of the capacity of eighteen different combinations of solvents was performed to separate the components of each crude extract and to select those combinations with the major capacity of separation that could be used later as references to prepare the mobile phases for the fractionation of the AE and EE extracts [17]. The eighteen combinations of solvents used are shown in Table 1. This evaluation was performed using thin layer chromatography (TLC) and following the procedure previously reported by Solís-Salas et al. (2021), that is shown below [18].
In this assay, two suspensions of the AE and EE extracts (2 mg/mL) were applied on TLC plates (2 × 5 cm2) covered with silica gel 60 F254 using fine capillary tubes. Subsequently, the TLC plates were immersed in glass beakers. Each beaker contained one of the 18 different solvent combinations which was adjusted to a volume of 3 mL. Once the solvents ran up the plates, these were taken up and dried at room temperature. Finally, the TLC plates were observed under visible and ultraviolet–visible (UV/Vis) light (365 nm) to identify the sample spots produced by each solvent combination. Additionally, the retention factors (Rf) of each spot were determined with the following formula:
R f = Distance   traveled   by   spot Distance   traveled   by   solvent
The criterion of selection of the best solvent combination for each extract was based on the capacity to produce the major number of sample spots on the surfaces of the TLC plates.

2.3.2. Fractionation of the AE and EE Extracts by Vacuum Liquid Chromatography (VLC)

Once the best solvent combinations for each extract were selected, the AE and EE extracts were subjected to fractionation by VLC following the methodology reported by Solís-Salas et al. (2021), with some modifications [18]. In this procedure, the fractionation was carried out in a glass chromatographic column (4.5 cm in diameter and 12 cm in height) previously packed with silica gel 60 F₂₅₄. Subsequently, about 8 g of the AE and EE extracts was placed over the silica gel column and eluted at 20 psi negative pressure generated by a vacuum pump (Felisa FE-1500L, FELISA, St. Juan de Ocotan, Jalisco, Mexico). The gradients of elution used as mobile phases for the fractionation of the AE and EE extracts were based on the solvent combinations of ethyl acetate–methanol–deionized water (EtOAc-MetOH-H2O) and chloroform–methanol–deionized water (CHCl3-MetOH-H2O), respectively. These elution gradients were adjusted to a volume of 250 mL for each fraction and following an increasing polarity gradient (100:0:0 → 80:20:0 → 60:40:0 → 40:60:0 → 20:80:0 → 0:100:0 → 0:0:100, v/v/v). These gradients of elution are shown in Table 2. Once the fractionation was performed, a total of seven fractions for each crude extract were recovered. These fractions were collected and dried by rotatory evaporator (BüCHI RE 120, BUCHI, Flawil, SG, Switzerland) Their yield percentages (Y%) were calculated with the following formula:
Y % = Recovered   mass Initial   mass × 10
Subsequently, the fractions were subjected to another TLC test to identify similarities between their TLC separation patterns according to their Rf values. In this test, the suspensions of the AE and EE fractions (2 mg/mL) were applied on TLC plateaus covered with silica gel 60 F254 and eluted with EtOAc-MetOH-H2O (100:13.5:10) and CHCl3-MetOH-H2O (9:1:1), respectively. Then, the plateaus were dried at room temperature and exposed to iodine vapor in a TLC chamber to enhance the visualization of the spots of each fraction and determine their Rf values.

2.4. Phytochemical Identification of the Fractions of the AE and EE Extracts by Reverse-Phase High Performance Liquid Chromatography/Mass Spectrometry (RP-HPLC-MS)

The phenolic phytochemical profile of the fractions of the AE and EE extracts was evaluated by RP-HPLC-MS analysis according to Alfaro-Jiménez et al. (2021) and De León-Medina et al. (2020) [4,19]. The chromatographic analysis was carried out on a Varian HPLC system, including an autosampler (VarianProStar 410, Palo Alto, CA, USA), a ternary pump (VarianProStar 230I, Palo Alto, CA, USA), and a photo diode array (PDA) detector (VarianProStar 330, Palo Alto, CA, USA). A liquid chromatograph ion trap mass spectrometer (Varian 500-MS IT Mass Spectrometer, Palo Alto, CA, USA) equipped with an electrospray ion source was also used. Samples (5 µL) were injected onto a Denali C18 column (150 × 2.1 mm2, 3 µm, Grace, Palo Alto, CA, USA). The oven temperature was maintained at 30 °C. The eluents were formic acid (0.2%, v/v; solvent A) and acetonitrile (solvent B). The following gradient was applied: initial, 3% B; 0–5 min, 9% B linear; 5–15 min, 16% B linear; 15–45 min, 50% B linear. The run time was 65 min. The column was then washed and reconditioned. The flow rate was maintained at 0.2 mL/min, and elution was monitored at 245, 280, 320, and 550 nm. The whole effluent (0.2 mL/min) was injected into the source of the mass spectrometer, without splitting. All MS experiments were carried out in the negative mode [M-H]−1. Nitrogen was used as a nebulizing gas and helium as a damping gas. The ion source parameters were: the spray voltage was 5.0 kV and the capillary voltage and temperature were 90.0 V and 350 °C, respectively. Data were collected and processed using MS Workstation software (V 6.9, VarianProStar Palo Alto. CA, USA) Samples were first analyzed in full scan mode acquired in the m/z range 50–2000.

2.5. In Vitro Cytotoxicity Assay

The cytotoxicity activity of the fractions of the AE and EE extracts was determined with a hemolysis assay according to the methodology of Alfaro-Jiménez et al. (2021) and Zugasti et al. (2020) [4,20]. The present evaluation was approved by the Ethics Committee (approval code: 19-2021, 4 February 2021) of the Faculty of Chemistry of the Autonomous University of Coahuila. In brief, human blood samples were obtained in heparin tubes. The blood was centrifugated at 3200 rpm for 4 min at 4 °C, the plasma was discarded, and the erythrocyte pellet was washed three times with Alsever’s solution. Thereafter, an erythrocyte suspension was prepared in Alsever´s solution (1:100) and distributed in a 24-well culture plateau. Then, erythrocytes were treated with the AE and EE fractions (200–800 µg/mL). Moreover, ascorbic acid (Asc-A) and resveratrol (Resv) were employed as references at concentrations of 13.2 µg/mL and 22.8 µg/mL, respectively. Subsequently, plates were incubated (37 °C for 1 h). After incubation, cells were collected and centrifugated under 2500 rpm for 10 min, and supernatants were used to measure the absorbances of released hemoglobin at 415 nm. Two controls were employed: a negative control without treatment (C−) and a positive control (C+) constituted by erythrocytes treated with H2O to produce total hemolysis. The hemolysis percentage (Hemolysis%’) was calculated with the following formula:
H e m o l y s i s % = [ ( A t   A n ) ( A p   A n ) ] × 100
where:
At: Test sample absorbance
An: Negative control absorbance
Ap: Positive control absorbance

2.6. In Vitro Antioxidant Activity

2.6.1. Radical Scavenging Activity

The TEAC assay was performed employing the Antioxidant Assay Kit from Cayman Chemicals (Ann Arbor, MI, USA) (Item No. 709001) and following the manufacturer’s instructions. In this assay, 10 µL of the AE and EE fractions (1000 µg/mL), 10 µL metmyoglobin, and 150 µL ABTS (2,2’-azino-bis (3-ethylbenzothiazoline-6-sulfonic acid)) were added per well in a 96-well culture plateau. Then, the reaction was initiated by adding 40 µL H2O2 (441 µM). The plateau was incubated on a shaker for 5 min at 25 °C, and absorbances were measured at 750 nm in a plate reader. Asc-A and Resv (1000 µg/mL) were used as standard references. Antioxidant activity was calculated by linear regression in a Trolox standard curve (0.068–0.495 mM Trolox). Results were expressed as the antioxidant activity of a millimolar concentration of Trolox that is equivalent to the antioxidant activity of 1 mg of sample (mM/mg) [4].

2,2-Diphenyl-1-picrylhydrazyl (DPPH) Assay

The DPPH radical scavenging capacity of the fractions of the AE and EE extracts was determined according to Arituluk et al. (2016). In this assay, DPPH˙ radical solution (1 mM) was prepared in EtOH. Subsequently, 50 μL of this solution was added in a 150 μL solution of the AE and EE fractions (200–800 µg/mL). Resv and Asc-A (200–800 µg/mL) were used as standard references. The mixtures were incubated for 30 min (darkness, 25 ºC), and absorbance was measured at 517 nm [21]. The radical scavenging activity was expressed as the inhibition percentage of DPPH˙ radical (DPPH˙ Inhibition%) and calculated with the following formula:
D P P H ˙   I n h i b i t i o n % = [ ( A blank   A sample ) A blank ] × 100
where:
Ablank: Absorbance of blank
Asample: Absorbance of sample

Hydroxyl (-OH) Radical Scavenging Assay

The -OH radical scavenging capacity of the fractions of the AE and EE extracts was determined according to Ozyurek et al. (2008) [22]. In this assay, reacting mixtures constituted by 200 µL KH2PO4-KOH (100 mM), 200 µL FeCl3 (500 µM), 100 µL EDTA (1 mM), 100 µL Asc-A (1 mM), 100 µL H2O2, 100 µL AE and EE fractions (200–800 µg/mL), and 200 µL deoxyribose (15 mM) were added in assay tubes and incubated at 37 °C for 1 h. Thereafter, 1 mL of trichloroacetic acid (1% w/v) was added and tubes were centrifugated at 5000 rpm for 15 min. After centrifugation, 1 mL of thiobarbituric (2.8% w/v) was added and tubes were incubated in a water bath at 80–90 °C for 15 min. Subsequently, tubes were cooled in ice and mixtures were distributed in a 24-well culture plateau (1 mL per well). Finally, absorbances were measured at 532 nm. Asc-A and Resv (200–800 µg/mL) were used as standard references. Moreover, a blank (extract substituted with H2O) and a sample blank (extract added without deoxyribose) were employed [10]. The -OH inhibitory activity (–OH inhibition%) was determined using the following formula:
    O H     I n h i b i t i o n % = [ ( A blank ( A sample   A sample   blank ) A blank   ] × 100
where:
Ablank: Absorbance of blank
Asample: Absorbance of sample
Asample blank: Absorbance of sample blank

2.6.2. Antioxidant Enzyme Activity

Supernatants of erythrocytes previously treated with the fractions of AE, EE, and standard references for hemolysis assay were collected and employed for the following antioxidant enzymatic assays.

Superoxide Dismutase (SOD) Activity

The assay was performed using the Superoxide Dismutase Assay Kit from Cayman Chemicals (USA) (Item No. 706002) and following manufacturer’s instructions. Briefly, supernatants were diluted with sample buffer (1:100). Subsequently, 10 µL samples were added with 200 µL diluted radical detector in each well of a 96-well culture plateau. Then, the reaction was initiated by adding 20 µL of xanthine oxidase and the plateau was incubated on a shaker for 30 min at 25 °C. Absorbances were measured at 440 nm in a plate reader [10]. A standard curve of bovine erythrocyte SOD (0.005–0.050 U/mL) was performed to determine the SOD activity of samples which were calculated with the following formula:
S O D   ( U / mL ) = [ ( Sample   LR y   intercept slope ) × 0.23   mL 0.01   mL ] ×   sample   dilution
One unit is defined as the amount of SOD enzyme required to exhibit 50% dismutation of O2− radical.

Catalase (CAT) Activity

The assay was performed using a Catalase Assay Kit from Cayman Chemicals (USA) (Item No. 707002) and following the manufacturer’s instructions. For this assay, supernatants were diluted with sample buffer (1:25). Subsequently, 100 µL of sample buffer (100 mM potassium phosphate, pH 7.0), 30 µL of MetOH, and 20 µL of the sample were added per well in a 96-well culture plateau. Then, the reaction was initiated by adding 20 µL H2O2 (35.3 mM), and the plateau was incubated on a shaker for 20 min at 25 °C. Absorbances were measured at 540 nm in a plate reader [10]. A standard curve of formaldehyde (5–75 µM) was performed to determine the CAT activity of samples, which were calculated with the following formula:
CAT   ( nmol / min / mL ) = (   μ M   of   sample 20   min ) ×   sample   dilution
One unit is defined as the amount of CAT needed to produce 1.0 nmol of formaldehyde per minute at 25 °C.

2.7. Statistical Analysis

The hemolytic assay was performed in triplicate, while antioxidant assays were performed at least twice. The sample means were compared by one-way ANOVA followed by Dunnett’s Multiple Comparison Test, using the SPSS 16.0 statistical software. Differences between means at 95% confidence level (* p < 0.05) were considered statistically significant.

3. Results and Discussion

3.1. Selection of Mobile Phases by TLC Test for the Fractionation of the AE and EE Extracts

The first step for the fractionation of the AE and EE extracts consisted of a preliminary evaluation of the separation of the components of these crude extracts by different combinations of solvents in the TLC plateaus to select those with the major capacity of separation based on the number of spots on the surface of the plateaus. The results obtained in the TLC test showed that the solvent combinations EtOAc-MetOH-H2O (100:13.5:10) and CHCl3-MetOH-H2O (9:1:1) produced the major separation of the components of the AE and EE extracts, exhibiting a total of eight and twelve spots on the TLC plates, respectively. Their Rf values are shown in Table 3. The detection of the spots on the surfaces of the TLC plateaus was performed under visible and UV/Vis light (Figure 1).
It is known there are metabolites, such as aromatic compounds, that are colorless under visible light but have the capacity of absorbing UV/Vis light strongly and becoming visible [23]. For this reason, the TLC plateaus were visualized in a UV/Vis chamber to detect the presence of spots that could contain this type of metabolites. According to the results, the TLC plateaus under UV/Vis light showed bands with various fluorescent colors. The fluorescent color patterns of the bands on the surface of a TLC plateau provide a preliminary detection of the possible phytochemicals present in a plant extract. The TLC plateau of the AE showed green-blue fluorescent spots. Previous studies have reported that these colors could be associated with the presence of flavones and hydroxycinnamic acids [24]. On the other hand, the TLC plateau of the EE also exhibited some blue bands, but orange-red fluorescent bands were detected as well. These colors are mainly correlated with compounds belonged to the group of flavonoids [25]. Moreover, the multiple Rf values visualized in the TLC plates suggest the presence of different types of metabolites according to the separation patterns produced by the solvent combinations, which are determined by the differences in polarity of these compounds.

3.2. Yield Percentages of the Fractions of the AE and EE Extracts

The fractionation of the AE and EE extracts by VLC allowed for the obtention of a total of seven fractions for each crude extract. Their Y% values are shown in Table 4. Regarding the yields of the fractions of the AE, F1–F6 exhibited low percentages, with values in a range of 0.04–1.35%, while F7 had a high Y% value of 27.47%. The low yields obtained by most of the fractions could be attributed to a possible low concentration of metabolites in the AE, with similar polarities to those of the solvents EtOAc, MetOH, and their combinations which were employed as eluents for the fractions F1–F6. On the other hand, F7 showed the highest yield. The increase in the recovered plant material in this fraction could suggest that there is a prevalence of strong polar compounds in the AE that only show affinity to solvents with high polarity, such as the H2O which was employed as an eluent for obtaining this fraction.
On the other hand, the Y% values of the fractions of the EE showed a descending order (22.92–6.74%) in which the yields were reduced as the polarity of the eluents was increased. These results suggest there is a major concentration of compounds in the EE with a similar polarity to those of the CHCl3 and its combinations with MetOH, while polar metabolites with affinity to MetOH and H2O are present in lower concentrations.
It is important to mention that due to the limited amount of recovered material in the fractions F1 and F2 of the AE, these were only used for the analysis of their phytochemical composition by RP-HPLC-MS, the evaluation of their cytotoxic properties on in vitro human erythrocytes, and their effects on the activity of the antioxidant enzymes SOD and CAT obtained from these models of erythrocytes, while the study of their antioxidant activities by the three radicals scavenging assays was not performed. However, the rest of the fractions of the AE extract (F3–F7) and the seven fractions from the EE extract were subjected to the complete evaluations previously mentioned.
Once the yields of the fractions of the AE and EE were determined, their TLC separation patterns were evaluated (Figure 2). According to the results obtained, some fractions of the AE had similar Rf values, such as F3–F5 and F6–F7. However, these fractions did not show the same separation pattern due to the presence of some Rf values that were only identified in some fractions but not found in the others. In the case of the fractions of the EE extract, similar Rf values were also visualized in some of them, such as F2–F3 and F4–F5, but different Rf values were also detected. On the other hand, only the fractions F6 and F7 showed the same separation pattern (Table 5).
The evaluation of TLC separation patterns is a preliminary method commonly used to study the phytochemical profile of fractions obtained from a plant extract. This evaluation contributes to identifying similarities between the fractions associated with their phytochemical composition, due to the fact that the separation patterns on the TLC plates are determined by the polarity of the compounds that are present in the fractions. For the above, when two or more of the fractions exhibit similar Rf values, this indicates the possibility that these fractions could have a similar phytochemical composition [14,18]. Therefore, the results obtained in the evaluation of the TLC separation patterns show that those fractions of the AE and EE extracts with similar Rf values could be constituted by compounds with similar polarity.

3.3. Phytochemical Composition

The evaluation of the phytochemical composition of the fractions of the AE and EE consisted of the identification of phenolic compounds by RP-HPLC-MS analysis which are shown in Table 6 and Table 7. The results revealed the presence of a total of eighteen different metabolites distributed in the fractions of the AE. Some of these compounds were previously detected in the phytochemical analysis of the AE crude extract [4]. These phytochemicals belong to the groups of flavones (luteolin 7-O-[2-apiosyl-6-malonyl]-glucoside), hydroxycinnamic acids (caffeic acid 4-O-glucoside and its isomer form), and methoxyflavonols (isorhamnetin 3-O-rutinoside and isorhamnetin 4’-O-glucoside). Furthermore, more metabolites of these groups were also identified (luteolin 7-O-glucuronide, scutellarein, 1-caffeoylquinic acid, and 3-caffeoylquinic acid), as well as other compounds belonged to other phytochemical families such as curcuminoids (bisdemethoxycurcumin), methoxybenzaldehydes (p-anisaldehyde), and phenolic terpenes (rosmanol). According to the distribution of the phytochemicals in the fractions, F4–F6 exhibited the major number of metabolites, with a total of six compounds per fraction, while F1 and F2 only showed two to three compounds. Moreover, the hydroxycinnamic acids were the more often detected phytochemicals in the fractions, with a total of nine different compounds, of which 1-caffeoylquinic acid was the metabolite with more prevalence, being found in F4–F7 (Table 6).
On the other hand, the evaluation of the phytochemical profile of the fractions of the EE exhibited the presence of a total of eighteen metabolites. Some of these compounds were previously identified in the EE crude extract and belong to the groups of flavones (apigenin 6,8-di-C-glucoside), flavonols (quercetin), methoxyflavonols (spinacetin 3-O-glucosyl-(1->6)-[apiosyl(1->2)]-glucoside), ellagitannins (pedunculagin II), and phenolic terpenes (rosmanol) [4]. In addition, more metabolites of these groups were also identified (luteolin 7-O-[2-apiosyl-6-malonyl]-glucoside, quercetin 3-O-rhamnoside, quercetin 3-O-rhamnosyl-rhamnosyl-glucoside, 3,7-dimethylquercetin, epirosmanol, rosmadial) as well as other compounds belonging to methoxyflavones (sinensetin) and hydroxycinnamic acids (caffeic acid 4-O-glucoside, 1-caffeoylquinic acid, 3-caffeoylquinic acid, 1,3-dicaffeoylquinic acid, p-coumaric acid 4-O-glucoside, and caffeoyl tartaric acid). According to the distribution of the phytochemicals in the fractions, F4 showed the highest number of compounds (nine metabolites), followed by F3 and F5 (seven and six metabolites, respectively). Furthermore, the hydroxycinnamic acids were the group of phytochemicals most often detected, with a total of six compounds distributed in the seven fractions (Table 7).
Phenolic compounds are metabolites produced by plants which have different functions in pigmentation, pollination, and protective roles against free radicals, UV light, microorganisms, and potential herbivores [26,27]. Additionally, the phenolic compounds have demonstrated beneficial properties for human health. One of these is the antioxidant activity, which can contribute to the inhibition of the ROS produced in the organism that are involved in the development of chronic diseases [28]. According to the results of the RP-HPLC-MS analysis, the hydroxycinnamic acids were identified in most of the fractions of the AE and EE crude extracts. These phytochemicals belong to the classification of phenolic acids and include some compounds such as caffeic acid, coumaric acid, ferulic acid, chlorogenic acid, and rosmarinic acid [29,30]. Among these metabolites, some derivatives of caffeic acid and coumaric acid were detected in the fractions of the two crude extracts. Previous studies have reported that caffeic acid and coumaric acid have several beneficial biological properties, for human health that can contribute to the prevention of health issues, including the antioxidant activity to inhibit in vitro radicals [31].
On the other hand, the flavonoids were another group of phytochemicals identified in the fractions of the AE and EE crude extracts. The chemical structure of flavonoids is constituted by a flavan nucleus with 15 carbon atoms linked in 3 rings (C6-C3-C6) [32]. According to the substitution pattern of their rings, the flavonoids are divided into different classes such as flavones, flavanones, isoflavones, flavonols, flavanonols, flavan-3-ols, and anthocyanidins. The phytochemical composition of some fractions revealed the presence of compounds belonging to flavones, flavonols, and their methoxylated derivatives. These metabolites were mainly derivatives of isorhamnetin, luteolin, quercetin, and apigenin. Other authors have reported the presence of similar compounds belonging to these groups in extracts of P. hysterophorus plants from India which demonstrated antioxidant properties [33,34]. For the above, the evaluation of the phytochemical composition of the fractions of the AE and EE from P. hysterophorus performed in this study exhibits that these are sources of phenolic compounds with antioxidant potential.

3.4. Hemolytic Activity

The hemolytic activity of the fractions of the AE and EE crude extracts on human erythrocytes was evaluated as a parameter of cytotoxicity. The hemolytic activity of the fractions is shown in Table 8. The erythrocytes are known to be cell models commonly used for the evaluation of the cytotoxic effects of phytochemical compounds, since the cell damage produced by these compounds can be reflected as alterations on the stability of the cell membranes that cause the lysis of the erythrocytes and the release of hemoglobin, which can be measured by spectrophotometry [35]. The results of this study exhibited that the fractions of the AE produced low hemolysis% values, being F2 (800 µg/mL), the fraction with the highest hemolytic effect of 12.84 ± 2.55%. These results were similar to those obtained previously by the AE, in which non-hemolytic activity was produced in the same range of evaluated concentrations [4]. In addition, Asc-A (13.2 µg/mL) and Resv (22.8 µg/mL) did not produce hemolysis.
According to these results, it is possible that the presence of the phenolic compounds previously detected by RP-HPLC-MS analysis could be associated with the low cytotoxicity of the seven fractions of the AE on human erythrocytes. Previous studies have evaluated the cytotoxicity of plant extracts, finding that phenolic compounds such as flavonoids have a protective effect on cell membranes against the oxidative damage produced by free radicals and demonstrating that their antioxidant effects can contribute to preventing the cell death produced by radicals [36,37]. In addition, the hydroxycinnamic acids have also demonstrated radical scavenging activity and inhibitory effects of hemolysis [38].
On the other hand, the fractions of the EE showed an increased hemolytic activity. F2 exhibited the highest cytotoxic effect, producing a total hemolysis (100%) in the different concentrations evaluated, while the fractions F1 and F4–F7 also showed a significant hemolytic activity, with percentages in the range of 3.55 ± 0.17%–22.13 ± 1.65%. These results were similar to those reported by Hernández-Marín et al. (2018), who evaluated the hemolytic activity of a methanolic extract from the leaves and bark of Parthenium incanum on human erythrocytes, obtaining a 100% hemolysis at 1000 µg/mL [39]. Moreover, Bermúdez-Toledo et al. (2012) also evaluated the cytotoxic activity of a hydroalcoholic extract from the aerial parts of P. hysterophorus, producing 80% of hemolysis at 120 µg/mL [40]. On the other hand, Iqbal et al. (2022) evaluated the hemolytic activity of a methanolic extract from the flowers of P. hysterophorus (200 µg/mL), exhibiting a value of 97.79% hemolysis [16]. According to these authors, the hemolytic effects of these extracts from the Parthenium species could be associated with the presence of sesquiterpene lactones and saponins, which were detected previously on the AE and EE crude extracts by colorimetric tests [4]. The sesquiterpene lactones constitute a group of metabolites commonly found in plants of the Asteraceae family and which have demonstrated cytotoxic effects against different in vitro tumor cells. However, these compounds could also affect normal cells depending on their concentrations [27].
For the above, although the previous results of the colorimetric tests of the AE and EE revealed that the two crude extracts contained sesquiterpene lactones, a higher concentration of these compounds in the EE could have influenced the hemolytic effects exhibited by some of their fractions. Hussain et al. (2022) evaluated the cytotoxic activity of a methanolic leaf extract from P. hysterophorus on human erythrocytes at concentrations of 120, 160, and 200 µg/mL, obtaining hemolytic percentages of 38.45%, 59.72%, and 76.90%, respectively. The hemolytic activity of the extract was associated with the presence of metabolites such as parthenin, ambrosin, coronopilin, tetraneurin A, and hysterone D which belonged to the group of sesquiterpene lactones and are known to produce cytotoxic effects. Hence, it is possible that the presence of these metabolites on the fractions of the EE could be in major proportions compared to the fractions of the AE and be responsible for the higher hemolytic effects on the in vitro human erythrocytes. However, more studies are required to confirm the presence of these phytochemical compounds in the fractions from the two crude extracts of the flowers of P. hysterophorus [41].
On the other hand, the foam test of the EE crude extract showed the presence of saponins, which are metabolites known to be inductors of hemolysis [4]. It has been reported that saponins can increase the permeability of the cell membrane of erythrocytes, through the binding of these compounds to cholesterol molecules found on the membrane and inducing the release of hemoglobin [42]. Hence, it is possible that the fractionation of the EE produced the distribution of saponins between its fractions, causing a major concentration of these compounds on the fraction F2 due to the gradient of elution employed for this fraction. Previous studies have reported the recovery of saponins from plants using organic solvents such as MetOH and CHCl3, which were employed as eluents for the fractionation of the EE and could also support the presence of these metabolites on these fractions [43,44]. Moreover, Quillay-Dávila et al. (2017) reported the presence of saponins on a hydroalcoholic extract from the leaves of P. hysterophorus by infrared spectroscopy. The hemolytic activity of the extract (2–4 mg/mL) was evaluated on human erythrocytes and produced hemolysis in a concentration-dependent manner (10–35%). The hemolytic effect of the extract was associated with the interactions of saponins with the cell membranes of erythrocytes [45].

3.5. Antioxidant Activity

3.5.1. Radical Scavenging Activity

The antioxidant activity of the fractions of the AE and EE from P. hysterophorus was evaluated with the TEAC, DPPH, and -OH radical scavenging assays. These assays determine the capacity of a sample to inhibit radicals through the transference of protons or electrons [44]. In the TEAC assay, the results showed that the fractions F3–F7 of the AE produced a significant antioxidant activity, in the range from 0.114 ± 0.006 to 0.185 ± 0.006 mM/mg; thus, F7 has the highest antioxidant capacity. These results were higher than the antioxidant activity previously obtained by the AE (0.112 ± 0.001) [10]. However, these values were lower than the antioxidant capacity of Asc-A (0.325 ± 0.002 mM/mg) and Resv (0.197 ± 0.001 mM/mg). On the other hand, the fraction F1 of the EE did not have antioxidant activity (0 ± 0.002 mM/mg) but the fractions F2–F7 showed significant antioxidant effects. Among these fractions, F2, F3, and F7 exhibited values in a range from 0.076 ± 0.032 to 0.094 ± 0.024 mM/mg, which were lower than the antioxidant activity previously obtained by the EE (0.112 ± 0.013 mM/mg) [4]. However, the fractions F4–F6 exhibited a higher antioxidant capacity, with results in a range from 0.180 ± 0.038 to 0.195 ± 0.012 mM/mg and which were similar to the antioxidant activity of Resv (Figure 3).
On the other hand, in the DPPH assay, the fractions of the AE exhibited significant antioxidant activity in a concentration-dependent manner. The highest inhibitory effects of the DPPH˙ radical were produced by the fractions F3 IC50: 317.21 µg/mL) and F4 (IC50: 334.94 µg/mL), while fractions F5–F7 exhibited IC50 values from 412.88 to 529.98 µg/mL. These results were similar to those previously obtained by the AE crude extract, which exhibited an IC50 value of 477.51 µg/mL [4]. Moreover, some of the fractions of the EE also showed significant inhibition. Fractions F3–F7 exhibited high antioxidant effects, with fraction F3 having the highest antioxidant activity (IC50: 366.3 µg/mL. However, F1 did not produce inhibition, and F2 exhibited a maximum inhibition of 13.76 ± 2.65% (600 µg/mL). Additionally, the antioxidant activities exhibited by most of the fractions from the AE and EE were higher than the activity obtained by the Asc-A, in which the highest inhibition% was 57.32 ± 0.65% (200 µg/mL). Moreover, some fractions also produced an inhibition of the DPPH˙ radical that was similar to those obtained by Resv, in which the inhibition% values were around 90%. The results of DPPH assay are shown in Table 9.
Previous studies have also reported the antioxidant capacity of extracts from P. hys-terophorus to inhibit DPPH ˙radicals. Kumar and Pandey (2020) evaluated the antioxidant activity of seven fractions (200–800 µg/mL) obtained from the stems of P. hysterophorus using different solvents (hexane, benzene, chloroform, ethyl acetate, acetone, ethanol, and distilled water) and following an increased polarity gradient. The fractions obtained with ethyl acetate, acetone, ethanol, and water exhibited high antioxidant activity in a concentration dependent manner, obtaining inhibitory percentages of DPPH radicals higher than 60% at 800 µg/mL. The antioxidant effects of these fractions were lower than those exhibited by most of the fractions of the AE and EE extracts of P. hysterophorus flowers at the same concentration [46]. Sinha and Paul (2014) also evaluated the antioxidant activity of a methanolic leaf extract of P. hysterophorus (100 µg/mL) obtained by Soxhlet extraction, exhibiting an inhibition of 54.50% [15]. Moreover, Ahmad et al. (2018) also performed an evaluation of the antioxidant activity of an acetonic extract from the leaves of P. hysterophorus, exhibiting a similar inhibition of DPPH radical of about 40% at 100 µg/mL [12]. The antioxidant properties of these extracts were associated with their phytochemical profile, in which the presence of phenolic compounds was detected. Some of these metabolites correspond to the hydroxycinnamic acids, which have been isolated from the leaves of P. hysterophorus (200 µg/mL) and demonstrated the capacity to produce an inhibition of DPPH radical of 73.59% [47]. On the other hand, flavonoids are phenolic compounds also known to be responsible for the antioxidant capacity of plant extracts. Iqbal et al. (2022) reported the presence of flavonoids and phenolic acids on a methanolic extract from the flowers of P. hysterophorus which exhibited an inhibition of the DPPH radical of 59.73% at a concentration of 80 µg/mL. The phytochemical profile of this extract was constituted by phenolic compounds such as quercetin and p-coumaric acid [16]. Some derivatives of these metabolites were also identified in the phytochemical composition of some fractions of the EE extract and could have a correlation with their antioxidant activity.
Additionally, the -OH radical scavenging assay showed that the five fractions of the AE exhibited significant antioxidant activity. The highest significant inhibitory effects of -OH radical were produced by the fractions F3 (73.99 ± 0.60%), F4 (67.61 ± 0.30%), and F7 (64.92 ± 0.42%) at 800 µg/mL. These results were similar to those obtained previously by the AE, that showed an inhibition of this radical of 71.20 ± 0.07% at the highest concentration [4]. However, F5 (41.13 ± 0.11%) and F6 (41.57 ± 0.10%) exhibited a lower antioxidant activity at the same concentration. Moreover, Asc-A and Resv produced low percentages of inhibition compared to the results obtained by these fractions, exhibiting a maximum inhibition of 54.54 ± 0.49% and 15.32 ± 0.40%, respectively.
On the other hand, F2 and F5–F7 of the EE exhibited higher antioxidant activity compared to the maximum inhibition% value previously obtained by the EE (41.33 ± 0.09%) [4]. These fractions showed results higher than 50% since the lowest concentration (200 µg/mL) and produced an antioxidant effect higher than Asc-A and Resv . The results of -OH radical scavenging assay are shown in Table 10.
Previous studies have also reported the -OH radical scavenging activity of extracts from P. hysterophorus. Kumar et al. (2013) evaluated the antioxidant activity of the aqueous and ethanolic extracts from the flowers of P. hysterophorus (200 µg/mL) obtained by Soxhlet extraction, showing -OH radical inhibition values of 70.21% and 73.80%, respectively [14]. Ahmad et al. (2018) also evaluated the antioxidant capacity of the acetone extract from stems of P. hysterophorus (100 µg/mL) obtained by Soxhlet extraction, exhibiting an inhibition of the -OH radical of 30% [12]. Moreover, Kumar and Pandey (2020) evaluated the –OH radical scavenging activity of seven fractions (80–200 µg/mL) obtained from the stems of P. hysterophorus using seven different solvents with an increase polarity gradient. The results exhibited that the aqueous and ethanolic fractions produced percentages of inhibition of –OH radical of 80% and 89% at a concentration of 200 µg/mL, which were higher than those obtained by the fractions of the AE and EE at the same concentration. These differences between the results on antioxidant activity could be influenced by the part of the plant that was employed and the solvents required for the fractionation. It is known that these factors can have an influence on the type of metabolites recovered and the biological activity exhibited [46].
According to the results obtained in these in vitro antioxidant assays, most of the fractions from the AE and EE exhibited significant antioxidant activity. Their antioxidant properties could be associated with the presence of the phenolic compounds that were identified in the RP-HPLC-MS analysis and which belong mainly to the groups of flavonoids and hydroxycinnamic acids. Many authors have evaluated the antioxidant mechanisms of these compounds, finding that their radical scavenging activities are determined by the number and position of substituents such as hydroxyl and methoxyl groups on their carbon rings [47,48]. These groups act as donors of protons or electrons that can neutralize the instability of radicals, avoiding the progression of the free radical chain reaction [49].
Furthermore, the fractionation of the AE and EE crude extracts produced differences in the antioxidant activity between the fractions recovered from each crude extract. This could be attributed to the separation of the phytochemicals by the gradients of elution that distributed these compounds between the fractions according to their differences in polarity. For the above, the results of the RP-HPLC-MS analysis could exhibit a possible correlation between the number and type of metabolites detected in each fraction and their antioxidant activity. For the case of the fractions F3–F7 from the AE, these exhibited a total of five to seven compounds for each fraction, most of which belong to hydroxycinnamic acids. Previous studies have reported that hydroxycinnamic acids have the capacity to inhibit radicals on in vitro models [50]. Hence, the presence of these compounds could be associated with the high antioxidant activity of these fractions in the DPPH and -OH radical scavenging assays.
On the other hand, the fractions of the EE showed the presence of a wide variety of groups of metabolites, that include mainly hydroxycinnamic acids, flavones, and flavonols, of which a total of three to nine compounds for each fraction were identified. Among the seven fractions of the EE, F1 and F2 exhibited a lower number of compounds compared to the other fractions, with only four and three metabolites detected, respectively. The low number of phenolic compounds in these fractions could have a correlation with their low antioxidant activities in the TEAC and DPPH assays and also with their high hemolysis% values, suggesting that the lysis of the erythrocytes could have been influenced by a reduced antioxidant protection due to a low number of phenolic compounds detected. On the contrary, the presence of a higher number of phenolic compounds in the fractions F3–F7 could be a cause of the significant increase in their antioxidant activities and their low hemolytic effects, demonstrating possible cytoprotective effects of these compounds on the erythrocytes due to their antioxidant properties.
In addition, some fractions showed a higher antioxidant activity than the AE and EE in the in vitro antioxidant assays. These results suggest the fractionation of the two crude extracts contributed to increasing the antioxidant properties of the compounds found in some of the fractions. These effects could be associated with the obtention of a higher concentration of certain groups of metabolites with antioxidant activity in each fraction as a result of the partial separation of the phytochemical composition of each crude extract [3]. Moreover, the plant crude extracts are known to be complex mixtures of different types of metabolites that have multiple interactions with each other. These interactions could produce synergistic, but also antagonistic, effects that are reflected as a decrease in their biological properties, including the antioxidant activity [5]. Therefore, when plant extracts are subjected to fractionation, the metabolites are partially separated, and some of these antagonistic interactions disappear, increasing their antioxidant properties.

3.5.2. Antioxidant Enzyme Activity

As part of the evaluation of the antioxidant properties of the fractions of the AE and EE extracts of P. hysterophorus, the effects of these fractions on the antioxidant activity of the SOD and CAT enzymes from human erythrocytes were determined. Cells such as the erythrocytes have antioxidant mechanisms to inhibit ROS, which are based on the activity of enzymes such as SOD and CAT. The SOD enzyme produces the dismutation of the radical O2- to O2 and H2O2 [51]. Subsequently, the CAT enzyme catalyzes the conversion of H2O2 to non-cytotoxic compounds such as H2O and O2 [52,53]. Previous studies have reported that plant extracts have the capacity to increase the antioxidant activity of these enzymes [54]. Hence, it is considered important to evaluate the effects of plant extracts on the activity of the antioxidant enzymes from cell models.
In this study, the antioxidant activity of SOD from erythrocytes treated with the fractions of the AE and EE was evaluated. According to the results, seven fractions of the AE showed a significant increase in the SOD activity in most of their concentrations, compared to a negative control (9.49 ± 2.16 U/mL), with the fraction F1 (200 µg/mL) being the treatment with the highest SOD activity (650.31 ± 6.25 U/mL). Moreover, the seven fractions exhibited antioxidant enzymatic activities that were higher than those obtained by Asc-A (69.77 ± 4.99 U/mL) and Resv (53.98 ± 3.46 U/mL). Previous studies have also reported the increase in antioxidant activity of the SOD enzyme by plant extracts. Abrahim et al. (2012) reported a significant increase in the antioxidant activity of the SOD enzyme from in vitro human breast cancer cells (MCF-7 cell line) which were treated with an ethyl acetate extract from the leaves of the plant Piper betle (64 µg/mL). In addition, phenolic content was detected in this extract and was considered as a possible factor responsible for this increase in the SOD activity [55]. On the other hand, the fractions of the EE did not cause a significant increase in the SOD activity, exhibiting an absence of the activity of this enzyme (0 U/mL) in most of these treatments. The results of the effect of the fractions of the AE and EE extracts on the antioxidant activity of SOD enzyme are shown in Table 11.
Furthermore, the CAT activity of erythrocytes treated with the fractions of the two crude extracts was evaluated. Among the fractions of the AE, F1–F4 and F6 significantly increased the activity of the CAT enzyme in some of their concentrations, compared to the negative control (69.73 ± 24.10 nmol/min/mL) with F2 (800 µg/mL) being the treatment with the highest CAT activity (372.61 ± 25.76 nmol/min/mL). On the other hand, the fractions F1, F2, and F7 of the EE increased the activity of the CAT enzyme in some concentrations, with F2 (600 µg/mL) having the highest CAT activity (272.72 ± 10.80 nmol/min/mL). These results were higher than those obtained by Asc-A and Resv, which exhibited an absence of CAT activity (0 nmol/min/mL). The results of the effect of the fractions of the AE and EE extracts on the antioxidant activity of CAT enzyme are shown in Table 12.
Nowadays, it is known that phytochemicals effect the activity of antioxidant enzymes from cells exposed to these compounds. However, there is minimal information about the mechanisms by which the metabolites can cause an increase or decrease in their antioxidant enzymatic activities. According to previous studies, the presence of phenolic compounds on plant extracts has been associated with the increase in the antioxidant activity of the SOD enzyme on in vitro cell models, contributing in this way to the inhibition of O2- radicals [56]. Some authors suggest that the metabolites could produce a higher antioxidant enzymatic activity by the induction of an over-expression of the SOD and CAT enzymes on the cells [55,56]. Although the erythrocytes used in this study are cells that do not have a nucleus when they become mature and cannot synthesize new antioxidant enzymes [57], it could be possible that the metabolites found in the AE and their fractions could have complemented the antioxidant activities of the SOD and CAT enzymes through the scavenging of the O2- and H2O2 radicals on the antioxidant enzymatic assays.
Moreover, it is also possible that the presence of other components of the plant extracts and fractions, such as some minerals, could have produced these increasing effects on the activity of the two antioxidant enzymes. The activity of an enzyme can be modified by the influence of various factors. One of them is the increase in the concentration of cofactors required by the enzyme, which contributes to increasing its rate of reaction [58]. The erythrocytes possess cytosolic SOD enzymes which need the presence of the metal ions Cu2+ and Zn2+ that act as cofactors [59]. Moreover, the erythrocytes also contain cytosolic CAT enzymes in which the metal ion Fe3+ contributes to their activation [60]. A previous study reported the presence of Cu, Zn, and Fe as part of the mineral composition of a methanolic extract from the whole plant of P. hysterophorus [47]. For the above, it is probable that the fractions from the AE could also contain these metals. Therefore, when the erythrocytes were treated with the fractions, the concentration of these cofactors was increased, producing a possible increase in the activation of the SOD and CAT enzymes. However, more studies are required to demonstrate this hypothesis.
On the other hand, the fractions of the EE did not show SOD activity, but some of them, such as F1, F2, and F7, exhibited that the CAT activity was significantly increased compared to the negative control. It has been reported that some secondary metabolites have the capacity to form stable complexation with metal ions [61]. For the above, it is possible that some phytochemicals found in the fractions of the EE could have formed complexations with the metal ions Cu2+ and Zn2+, avoiding that the SOD enzyme could assemble with these cofactors, which are required for its activation. Another factor that could have contributed to the inhibition of the activity of the SOD enzyme, and for the increase in the activity of the CAT enzymes by the fractions of the EE, is a possible formation of H2O2 radicals on the erythrocytes induced by these fractions. It has been reported that H2O2 radicals at high concentrations can produce the inhibition of the SOD enzyme through oxidative damage produced on some residues of amino acids at the active site of the enzyme that produces its inactivation [62]. Moreover, it is also suggested that H2O2 radicals can reduce the enzyme-bound Cu2+ to Cu+, producing modifications in this cofactor that inactivate the SOD enzyme [63]. In addition, the formation of H2O2 could also be responsible for increasing the antioxidant activity of the CAT enzyme. When cells are exposed to higher levels of free radicals, these try to compensate by increasing their antioxidant mechanisms as a natural defense [64]. For this reason, we hypothesize that some of these fractions of the EE extract, especially F2, could have induced the formation of H2O2 radicals on the erythrocytes, causing the activity of the SOD enzyme to be inhibited, while the antioxidant activity of the CAT enzyme was increased as a defense mechanism. Moreover, the possible formation of H2O2 radicals on the erythrocytes could be supported by the previous cytotoxic effects, shown in the hemolysis assay by various fractions of the EE that include F1–F2 and F7, in which the oxidative damage produced by radicals on the cell membranes could be another cause of hemolysis.

4. Conclusions

In the present study, the fractionation of the AE and EE crude extracts from P. hysterophorus flowers allowed a total of seven fractions for each crude extract to be obtained, which exhibited different phytochemical profiles constituted by various groups of phenolic compounds such as flavones, methoxyflavones, flavonols, methoxyflavonols, hydroxycinnamic acids, and phenolic terpenes. The fractions of the AE showed low hemolysis on human erythrocytes, while the fractions of the EE produced high hemolytic effects. The antioxidant properties of most of the fractions of the AE and EE showed high radical scavenging activities, of which some of them exhibited higher antioxidant activities than the crude extracts. In addition, the fractions of the AE produced a significant increase in the activity of the antioxidant enzymes SOD and CAT, while the fractions of the EE only exhibited a significant increase in the CAT activity. Consequently, our data indicate that the fractions of the AE and EE from P. hysterophorus are sources of phenolic compounds with antioxidant potential to inhibit radicals in vitro and increase the activity of the antioxidant enzymes SOD and CAT from human erythrocytes.

Author Contributions

Conceptualization, C.A.S.R. and A.Z.C.; methodology, M.A.A.J., C.A.S.R., A.Z.C., S.Y.S.B. and J.A.A.V.; formal analysis, M.A.A.J.; investigation, M.A.A.J. and C.A.S.R.; supervision, C.A.S.R. and A.Z.C.; visualization, M.A.A.J. and C.A.S.R.; writing—original draft, M.A.A.J.; writing—review and editing, M.A.A.J., C.A.S.R., A.Z.C. and S.Y.S.B. All authors have read and agreed to the published version of the manuscript.

Funding

This research received no external funding.

Institutional Review Board Statement

This study was conducted in accordance with the Declaration of Helsink, and approved by the Ethics Committee of the Faculty of Chemistry, of the Autonomous University of Coahuila (19-2021, 4 February 2021), for studies involving human biological samples.

Informed Consent Statement

Informed consent was obtained from all subjects involved in the study.

Data Availability Statement

The data presented in this study are available in the figures.

Acknowledgments

The authors are grateful to the National Council of Science and Technology (CONACYT) for the financial of the scholarship (CVU: 999325) through the program of the Master´s Degree in Food Science and Technology of theFaculty of Chemistry of the Autonomous University of Coahuila, José Ángel Villarreal Quintanilla (UAAAN) for the plant identification and Héctor Arturo Ruiz Leza for his contribution to the revision of the manuscript.

Conflicts of Interest

The authors declare no conflict of interest.

References

  1. World Health Organization. Available online: https://www.who.int/news-room/fact-sheets/detail/noncommunicable-diseases (accessed on 22 September 2022).
  2. Ighodaro, O.M.; Akinloye, O.A. First line defense antioxidants-superoxide dismutase (SOD), catalase (CAT) and glutathione peroxidase (GPX): Their fundamental role in the entire antioxidant defense grid. Alex. Med. J. 2018, 54, 287–293. [Google Scholar]
  3. Abubakar, A.R.; Haque, M. Preparation of medicinal plants: Basic extraction and fractionation procedures for experimental purposes. J. Pharm. Bioall. Sci. 2020, 12, 1–10. [Google Scholar] [CrossRef] [PubMed]
  4. Alfaro-Jiménez, M.A.; Zugasti-Cruz, A.; Silva-Belmares, S.A.; Ascacio-Valdés, J.A.; Sierra-Rivera, C.A. Phytochemical and biological characerization of aqueous and ethanolic extracts of Parthenium hysterophorus. Pharmacog. J. 2021, 13, 1122–1133. [Google Scholar] [CrossRef]
  5. Oshiade De Silva, G.; Theekshana-Abeysundara, A.; Weroshana-Aponso, M.M. Extraction methods, qualitative and quantitative techniques for screening of phytochemicals from plants. Am. J. Essent. Oil. 2017, 5, 29–32. [Google Scholar]
  6. Rao, M.V.; Sengar, A.S.; Sunil, C.K.; Rawson, A. Ultrasonication—A green technology extraction technique for spices: A review. Trends Food Sci. Technol. 2022, 116, 975–991. [Google Scholar] [CrossRef]
  7. Liu, R.H. Health benefits of fruit and vegetables are from additive and synergistic combinations of phytochemicals. Am. J. Clin. Nutr. 2004, 78, 517–520. [Google Scholar] [CrossRef] [Green Version]
  8. Efferth, T.; Koch, E. Complex interactions between phytochemicals. The multi-target therapeutic concept of phytotherapy. Curr. Drugs Targets. 2011, 12, 122–132. [Google Scholar] [CrossRef]
  9. Coskun, O. Separation techniques: Chromatography. NCI 2016, 3, 156–160. [Google Scholar]
  10. Sierra-Rivera, C.A.; Cobos-Puc, L.E.; Rodríguez-Salazar, M.C.; Iliná, A.; Segura-Ceniceros, E.P.; Solís-Salas, L.M.; Silva-Belmares, S.Y. Applied techniques for extraction, purification, and characterization of medicinal plants active compounds. In Natural Products Chemistry, 1st ed.; Volova, T.G., Mahapatra, D.K., Khanna, S., Haghi, A.K., Eds.; CRC Press: Cleveland, OH, USA, 2021; Volume 1, pp. 155–190. [Google Scholar]
  11. Bagchi, A.; Raha, A.; Mukherjee, P. A complete review on Parthenium hysterophorus Linn. Int. J. Recent. Adv. Pharm. Res. 2016, 6, 42–49. [Google Scholar]
  12. Ahmad, J.; Bagheri, R.; Bashir, H.; Baig, M.A.; Al-Huqail, A.; Ibrahim, M.M.; Qureshi, M.I. Organ-specific phytochemical profiling and antioxidant analysis of Parthenium hysterophorus L. Biomed. Res. Int. 2018, 1, 9535232. [Google Scholar] [CrossRef] [Green Version]
  13. Kumar, S.; Mishra, A.; Pandey, A. Antioxidant mediated protective effect of Parthenium hysterophorus against oxidative damage using in vitro models. BMC Complem. Altern. M 2013, 13, 120. [Google Scholar] [CrossRef] [PubMed] [Green Version]
  14. Kumar, S.; Chashoo, G.; Saxena, A.K.; Pandey, A.K. Parthenium hysterophorus: A probable source of anticancer, antioxidant and anti-HIV agents. Biomed. Res. Int. 2013, 2013, 810734. [Google Scholar] [CrossRef] [PubMed] [Green Version]
  15. Sinha, S.N.; Paul, D. Antioxidant potentials of Parthenium hysterophorus L. leaf extracts. SRJI 2014, 3, 80–86. [Google Scholar]
  16. Iqbal, J.; Ali-Khan, A.; Aziz, T.; Ali, W.; Ahmad, S.; Rahman, S.U.; Iqbal, Z.; Dablool, A.S.; Alrunways, M.W.; Almalki, A.A.; et al. Phytochemical investigation, antioxidant properties and in vivo evaluation of the toxic effects of Parthenium hysterophorus. Molecules 2022, 27, 4189. [Google Scholar] [CrossRef] [PubMed]
  17. Wagner, H.; Bladt, S. Flavonoids drugs including Ginko biloba and Echnaceae species. In Plant Drug Analysis, 2nd ed.; Wagner, H., Bladt, S., Eds.; Springer: Berlin, Germany, 2001; Volume 1, pp. 195–245. [Google Scholar]
  18. Solís-Salas, L.M.; Sierra-Rivera, C.A.; Cobos-Puc, L.E.; Ascacio-Valdés, J.A.; Silva-Belmares, S.Y. Antibacterial potential by rupture membrane and antioxidant capacity of purified phenolic fractions of Persea americana leaf extract. Antibiotics 2021, 10, 508. [Google Scholar] [CrossRef]
  19. De León-Medina, J.C.; Sepúlveda-Torre, L.; Morlett-Chávez, J.; Meléndez-Renteira, P.; Zugasti-Cruz, A.; Ascacio-Valdés, J.; Aguilar, C.N. Solid-state fermentation with Aspergillus niger GH1 to enhance polyphenolic content and antioxidative activity of Castilla Rose (Purshia plicata). Plants 2020, 9, 1518. [Google Scholar]
  20. Zugasti, A.; Rivera, A.L.; Silva, S.Y.; Alfaro, M.A.; Sierra, C.A. Effect of sodium dichloroacetate as single agent or in combination with cisplatin in normal and human cervical cancer cell lines. Trop. J. Pharm. Res. 2020, 19, 467–474. [Google Scholar] [CrossRef]
  21. Arituluk, Z.C.; Tatli-Çankaya, I.I.T.; Gençler-Özka, N.A.M. Antioxidant activity, total phenolic and flavonoid contents of some Tanacetum L. (Asteraceae) Taxa growing in Turkey. FABAD J. Pharm. Sci. 2016, 41, 17–25. [Google Scholar]
  22. Ozyurek, M.; Bektasoglu, B.; Guclu, K.; Apak, R. Hydroxyl radical scavenging assay of phenolics and flavonoids with a modified cupric reducing antioxidant capacity (CUPRAC) method using catalase for hydrogen peroxide degradation. Anal. Chim. Acta 2008, 616, 196–206. [Google Scholar] [CrossRef]
  23. Begum, A.; Rao, K.N.V.; Dutt, R.; Sindhu, G.K.; Fathima, K.U.; Gowthami, G.; Kumar, J.V.; Naveen, B.; Shaffath, S. Phytochemical screening and thin layer chromatography of Indian Asparagus officinalis Linn. Int. J. Adv. Res. 2017, 5, 1520–1528. [Google Scholar] [CrossRef] [Green Version]
  24. Domínguez-Rodríguez, G.; Plaza, M.; Marina, M.L. High-performance thin-layer chromatography and direct analysis in real time-high resolution mass spectrometry of non-extractable polyphenols from tropical fruit peels. Food Res. Int. 2021, 147, 110455. [Google Scholar] [CrossRef] [PubMed]
  25. Gupta, P.; Patil, D.; Patil, A. Qualitative HPTLC phytochemical profiling of Careya arborea Roxb. Bark, leaves and seeds. Biotech 2019, 9, 311. [Google Scholar] [CrossRef] [PubMed]
  26. Kennedy, D.O.; Wightman, E.L. Herbal extracts and phytochemicals: Plant secondary metabolites and the enhancement of human brain function. Adv. Nutr. 2011, 2, 32–50. [Google Scholar] [CrossRef] [PubMed] [Green Version]
  27. Li, Q.; Wang, Z.; Xie, Y.; Hu, H. Antitumor activity and mechanism of costunolide and dehydrocostus lactones: Two natural sesquiterpene lactones from the Asteraceae family. Biomed. Pharm. 2020, 125, 109955. [Google Scholar] [CrossRef]
  28. Zhang, Z.; Pang, X.; Xuewu, D.; Ji, Z.; Jiang, Y. Role of peroxidase in anthocyanin degradation in litchi fruit pericarp. Food Chem. 2005, 90, 47–52. [Google Scholar] [CrossRef]
  29. Strassburg, C.; Kalthoff, S. Coffee and gastrointestinal glucoronosyltransferases. In Coffee in Health and Disease Prevention, 1st ed.; Preedy, V.R., Ed.; Academic Press: Cambridge, MA, USA, 2015; Volume 1, pp. 535–543. [Google Scholar]
  30. Vinholes, J.; Silva, B.M.; Silva, L.R. Hydroxycinnamic acids (HCAS): Structure, biological properties and health effects. In Advances in Medicine and Biology, 1st ed.; Berhardt, L.V., Ed.; Nova Science Publishers: New York, NY, USA, 2015; Volume 88, pp. 1–33. [Google Scholar]
  31. Abramovič, H. Antioxidant properties of hydroxycinnamic acid derivatives: A focus on biochemistry, physicochemical parameters, reactive species, and biomolecular interactions. In Coffee in Health and Disease Prevention, 1st ed.; Preedy, V.R., Ed.; Academic Press: Cambridge, MA, USA, 2015; Volume 1, pp. 843–852. [Google Scholar]
  32. Pietta, P.G. Flavonoids as antioxidants. J. Nat. Prod. 2000, 63, 1035–1042. [Google Scholar] [CrossRef]
  33. Dipankar, C.R.; Munan, S. Toxicology, phyochemistry, bioactive compounds and pharmacology of Parthenium hysterophorus. J. Med. Plants Stud. 2013, 1, 126–141. [Google Scholar]
  34. Padma, S.; Deepika, S. Phytochemical screening and in vitro anti-fungal investigation of Parthenium hysterophorus extracts against Alternaria alternate. Int. Res. J. Pharm. 2013, 4, 190–193. [Google Scholar]
  35. Pagano, M.; Faggio, C. The used of erythrocyte fragility to assess xenobiotic cytotoxicity. Cell Biochem. Funct. 2015, 33, 351–355. [Google Scholar] [CrossRef]
  36. De Freitas-Araújo, M.M.; Hilário, F.; Villegas, W.; Campaner-Dos Santos, L.; Lourenço Brunetti, I.; Sotomayor, C.E.; Bauab, T.M. Correlation among antioxidant, antimicrobial, hemolytic, and antiproliferative properties of Leiothrix spiralis leaves extract. IJMS 2012, 13, 9260–9277. [Google Scholar] [CrossRef]
  37. Surendra, T.V.; Roopan, S.M.; Arasu, M.V.; Al-Dhabi, N.A.; Sridharan, M. Phenolic compounds in drumstick peel for the evaluation of antibacterial, hemolytic and photocatalytic activities. J. Photochem. Photobiol. B 2016, 161, 463–471. [Google Scholar] [CrossRef] [PubMed]
  38. Magalhães, L.M.; Santos, M.; Segundo, M.A.; Reis, S.; Lima, J.L.F.C. Flow injection-based methods for fast screening of antioxidant capacity. Talanta 2009, 77, 1559–1566. [Google Scholar] [CrossRef] [PubMed]
  39. Hernández-Marín, D.A.; Guevara-Lara, F.; Rivas-Morales, C.; Verduzco-Martínez, J.A.; Galindo-Rodríguez-S, A.; Sánchez-García, E. Biological activity of Nothoscordum bivalve (L.) Britton and Parthenium incanum Kunth extracts. Indian J. Tradit. Know 2018, 17, 699–706. [Google Scholar]
  40. Bermúdez-Toledo, D.; Boffill-Cárdenas, M.; Valido-Díaz, A.; Martínez-Montalbán, C.M.; Iglesias-Rodríguez, N. In vitro photohemolytic evaluation of Parthenium hysterophorus L. Medicentro 2012, 16, 43–48. [Google Scholar]
  41. Hussain, A.; Khan, A.A.; Ali, M.; Zamani, G.T.; Iqbal, Z.; Ullah, Q.; Iqbal, J.; Shahzad, M.; Aziz, T. In Vitro and In Vivo assessment of toxic effects of Parthenium hysterophorus leaves extract. J. Chil. Chem. Soc. 2022, 67, 5484–5489. [Google Scholar] [CrossRef]
  42. Quynh-Vo, N.N.; Fukushima, E.O.; Muranaka, T. Structural and hemolytic activity relationships of triterpenoid saponins and sapogenins. J. Nat. Med. 2017, 71, 50–58. [Google Scholar]
  43. Cheok, C.Y.; Karim-Salman, H.A.; Sulaiman, R. Extraction and quantification of saponins: A review. Food Res. J. 2014, 59, 16–40. [Google Scholar] [CrossRef]
  44. Chua, L.S.; Lau, C.H.; Chew, C.Y.; Salim-Dawood, D.A. Solvent fractionation and acetone precipitation for crude saponins from Eurycoma longifolia extract. Molecules 2019, 24, 1416. [Google Scholar] [CrossRef] [Green Version]
  45. Quillay-Dávila, M.A.; Arana-Arias, Y.A.; Jaramillo-Jaramillo, C.G.; Cuenca-Buele, S.; Rojas de Astudillo, L.L.; Jaramillo-Alcívar, V. Saponin content and cicatrizing activity of Cecropia peltata and Parthenium hysterophorus. Rev. Cubana Farm. 2017, 51, 1–15. [Google Scholar]
  46. Apak, R.; Özyürek, M.; Güclu, K.; Çapanoglu, E. Antioxidant activity/capacity measurement. 1. Classification, physicochemical principles, mechanisms, and electron transfer (ET)-based assays. J. Agric. Food Chem. 2016, 64, 997–1027. [Google Scholar] [CrossRef]
  47. Panwar, R.; Sharma, A.K.; Dutt, D.; Pruthi, V. Phenolic acids from Parthenium hysterophorus: Evaluation of bioconversion potential as free radical scavengers and anticancer agents. Adv. Biosci. Biotechnol. 2015, 6, 11–17. [Google Scholar] [CrossRef] [Green Version]
  48. Kumar, S.; Pandey, A.K. Phytochemical screening, GC-MS analysis and In vitro antioxidant potential of Parthenium hysterophorus stem sequentially extracted fractions. Chem. Biol. Lett. 2020, 7, 235–241. [Google Scholar]
  49. Wu, C.; Chen, F.; Wang, X.; Kim, H.J.; He, G.; Haley-Zitlin, V.; Huang, G. Antioxidant constituents in feverfew (Tanacetum parthenium) extract and their chromatographic quantification. Food Chem. 2006, 96, 220–227. [Google Scholar] [CrossRef]
  50. Khan, R.A.; Ahmed, M.; Khan, M.R.; Yasir, M.; Muhammad, B.; Khan, R. Nutritional investigation and biological activities of Parthenium hysterophorus. AJPP 2011, 5, 2073–2078. [Google Scholar]
  51. Lee, M.T.; Lin, W.C.; Yu, B.; Lee, T.T. Antioxidant capacity of phytochemicals and their potential effects on oxidative status in animals—A review. Asian-Australas J. Anim. Sci. 2017, 30, 299–308. [Google Scholar] [CrossRef]
  52. Shang, Y.J.; Liu, B.Y.; Zhao, M.M. Details of the antioxidant mechanism of hydroxycinnamic acids. Czech J. Food Sci. 2015, 33, 210–216. [Google Scholar] [CrossRef] [Green Version]
  53. Azadmanesh, J.; Borgstahl, G.E.O. A review of the catalytic mechanism of human manganese superoxide dismutase. Antioxidants 2018, 7, 25. [Google Scholar] [CrossRef] [PubMed] [Green Version]
  54. Margis, R.; Dunand, C.; Teixeira, F.K.; Margis-Pinheiro, M. Glutathione peroxidase family—An evolutionary overview. FEBS J. 2008, 275, 3959–3970. [Google Scholar] [CrossRef]
  55. Kaushal, J.; Mehandia, S.; Singh, G.; Raina, A.; Arya, S.K. Catalase enzyme: Application in bioremediation and food industry. ISBAB 2018, 16, 192–199. [Google Scholar] [CrossRef]
  56. Abrahim, N.N.; Kanthimathi, M.S.; Abdul-Aziz, A. Piper betle shows antioxidant activities, inhibits MCF-7 cell proliferation and increases activities of catalase and superoxide dismutase. BMC Complement. Altern. Med. 2012, 12, 220. [Google Scholar] [CrossRef] [Green Version]
  57. Lee, S.E.; Hwang, H.J.; Ha, J.S.; Jeong, H.S.; Kim, J.H. Screening of medicinal plant extracts for antioxidant activity. Life Sci. 2003, 73, 167–179. [Google Scholar] [CrossRef]
  58. Farag, M.R.; Alagawany, M. Erythrocytes as a biological model for screening of xenobiotic toxicity. Chem.-Biol. Interact. 2018, 279, 73–83. [Google Scholar] [CrossRef]
  59. Ma, X.; Deng, D.; Chen, W. Inhibitors and activators of SOD, GSH-Px, and CAT. In Enzyme Inhibitors and Activators, 1st ed.; Şentürk, M., Ed.; Intech Open: Manhattan, NY, USA, 2016; Volume 1, pp. 207–224. [Google Scholar]
  60. Younus, H. Therapeutic potentials of superoxide dismutase. Int. J. Health Sci. 2018, 12, 88–93. [Google Scholar]
  61. Díaz, A. The structure of catalases. REB 2002, 22, 76–84. [Google Scholar]
  62. Xu, Y.; Xin, Y.; Diao, Y.; Lu, C.; Fu, J.; Luo, L.; Yin, Z. Synergistic effects of apigenin and paclitaxel on apoptosis of cancer cells. PLoS ONE 2011, 6, e29169. [Google Scholar] [CrossRef] [Green Version]
  63. Casano, L.M.; Gómez, L.D.; Lascano, H.R.; González, C.A.; Trippi, V.S. Inactivation and degradation of CuZn-SOD by active oxygen species in wheat chloroplasts exposed to photooxidative stress. Plan Cell Physiol. 2000, 38, 433–440. [Google Scholar] [CrossRef] [Green Version]
  64. Strycharz-Dudziak, M.; Kiełczykowska, M.; Drop, B.; Świątek, L.; Kliszczewska, E.; Musik, I.; Polz-Dacewicz, M. Total antioxidant status (TAS), superoxide dismutase (SOD), and glutathione peroxidase (GPx) in oropharyngeal cancer associated with EBV infection. Oxid. Med. Cell Longev. 2019, 2019, 5832410. [Google Scholar] [CrossRef]
Figure 1. TLC separation of the AE and EE extracts of P. hysterophorus. The TLC plates were observed under visible light (A) and UV/Vis-365 nm (B), showing that the solvent systems EtOAc-MetOH-H2O (1) and CHCl3-MetOH-H2O (2) produced the major separation of components of the AE and EE, respectively.
Separations 09 00359 g001
Figure 2. TLC separation of the fractions of the AE and EE crude extracts from P. hysterophorus. The fractions of the AE (A) and EE (B) from P. hysterophorus flowers were applied on silica gel 60 F254 plateaus and eluted with EtOAc-MetOH-H2O (100:13.5:10) and CHCl3-MetOH-H2O (9:1:1), respectively. Subsequently, the TLC plateaus were visualized in an iodine vapor chamber and the Rf values of the spots of each fraction were identified.
Separations 09 00359 g002
Figure 3. TEAC activity of the fractions of the AE and EE extracts from P. hysterophorus. * p < 0.05 as compared with negative control.
Separations 09 00359 g003
Table 1. Combinations of solvents used for TLC test of the AE and EE extracts of P. hysterophorus [17].
NumberCombinations of SolventsProportion
1Ethyl acetate–methanol–deionized water100:13.5:10
2Ethyl acetate–methanol4:6
3Hexane–chloroform–glacial acetic acid 45:45:1
4Chloroform–methanol–glacial acetic acid47.5:47.5:5
5Hexane–ethyl acetate75:25
6Dichloromethane–acetone9:1
7Dichloromethane–hexane–methanol70:25:5
8Hexane–ethyl acetate–methanol80:18:2
9Hexane–acetone70:30
10Dichlorometane–acetone–ethyl acetate–methanol–deionized water70:20:5:3:2
11Acetone–methanol–glacial acetic acid70:25:5
12Chloroform–ethyl acetate6:4
13Chloroform1
14Ethyl acetate–methanol6:2
15Chloroform–methanol–deionized water9:1:1
16Chloroform–methanol–glacial acetic acid47.5:47.5:5
17Hexane–methanol9:1
18Dichlorometane–methanol9:1
Table 2. Gradients of elution used for the fractionation of the AE and EE extracts of P. hysterophorus.
Combinations of Solvents for the AE Crude Extract
FractionProportion
EtOAcMetOHH2O
110000
280200
360400
440600
520800
601000
700100
Combinations of Solvents for the EE Crude Extract
FractionProportion
CHCl3MetOHH2O
110000
280200
360400
440600
520800
601000
700100
Table 3. Rf values of the AE and EE extracts from P. hysterophorus obtained in the TLC test.
ExtractRf Values
AEEtOAc-MetOH-H2O (100:13.5:10)
0.100.50
0.200.80
0.300.87
0.421.00
EECHCl3-MetOH-H2O (9:1:1)
0.120.65
0.250.70
0.400.80
0.450.87
0.550.95
0.601.00
Rf: retention factor; AE: aqueous crude extract; EE: ethanolic crude extract.
Table 4. Yield percentages of the fractions of the AE and EE extracts from P. hysterophorus.
Fractions of AEY%Fractions of EEY%
F10.04%F122.92%
F20.13%F216.23%
F30.50%F316.58%
F41.05%F410.80%
F51.35%F58.69%
F61.06%F66.74%
F727.47%F79.48%
Y%: yield percentage; AE: aqueous crude extract; EE: ethanolic crude extract; F: fractions.
Table 5. Rf values of the fractions of the AE and EE extracts from P. hysterophorus.
Rf Values of the Fractions of the AERf Values of the Fractions of the EE
F1F2F3F4F5F6F7F1F2F3F4F5F6F7
00000000000000
1.000.750.100.100.100.500.200.770.070.450.100.101.001.00
1.000.200.200.370.720.720.870.520.500.300.30
0.370.370.501.001.001.000.570.550.451.00
0.500.500.58 0.650.601.00
0.570.570.70 0.720.65
0.720.720.77 0.770.75
0.750.771.00 0.901.00
0.771.00 1.00
1.00
Rf: retention factor; AE: aqueous crude extract; EE: ethanolic crude extract; F: fractions.
Table 6. Phytochemicals detected in the fractions of the AE extract of P. hysterophorus by RP-HPLC-MS analysis.
No.R.T.
(min)
MassCompoundFamilyFractions of AE
F1F2F3F4F5F6F7
114.003341Caffeic acid 4-O-glucosideHydroxycinnamic acids* * **
214.6593531-Caffeoylquinic acid ****
316.981352.93-Caffeoylquinic acid * *
420.238134.9p-AnisaldehydeMethoxybenzaldehydes *
521.452337.13-p-Coumaroylquinic acidHydroxycinnamic acids *
621.521664.9Luteolin 7-O-(2-apiosyl-6-malonyl)-glucosideFlavones *
724.429340.9Caffeic acid 4-O-glucoside (isomer)Hydroxycinnamic acids *
828.328476.9Isorhamnetin 4’-O-glucosideMethoxyflavonols * *
928.43341TetramethylscutellareinMethoxyflavones *
1030.52514.91,3-Dicaffeoylquinic acidHydroxycinnamic acids *
1131.083324.9p-Coumaric acid 4-O-glucoside*
1231.378461Isorhamnetin 3-O-rutinosideMethoxyflavonols ***
1331.586284.9ScutellareinFlavones *
1432.194460.9Luteolin 7-O-glucuronide *
1534.5055151,3-Dicaffeoylquinic acidHydroxycinnamic acids * *
1636.408307BisdemethoxycurcuminCurcuminoids *
1736.461261Dihydrocaffeic acid 3-sulfateHydroxycinnamic acids**
1837.527344.9RosmanolPhenolic terpenes ***
R.T.: Retention time; EA: aqueous crude extract; F: fraction; * compound detected.
Table 7. Phytochemicals detected in the fractions of the EE extract of P. hysterophorus by RP-HPLC-MS analysis.
No.R.T.
(min)
MassCompoundFamilyFractions of EE
F1F2F3F4F5F6F7
113.97340.9Caffeic acid 4-O-glucosideHydroxycinnamic acids * * *
216.54343RosmadialPhenolic terpenes *
317.44352.91-Caffeoylquinic acidHydroxycinnamic acids * *
426.43371.1SinensetinMethoxyflavones*
530.465151,3-Dicaffeoylquinic acidHydroxycinnamic acids * **
630.51446.9Quercetin 3-O-rhamnosideFlavonols **
730.95664.9Luteolin 7-O-(2-apiosyl-6-malonyl)-glucosideFlavones *
831.21352.93-Caffeoylquinic acidHydroxycinnamic acids ***
932.90754.9Quercetin 3-O-rhamnosyl-rhamnosyl-glucosideFlavonols **
1035.8344.9RosmanolPhenolic terpenes ****
1136.90344.9Epirosmanol *
1237.61592.9Apigenin 6,8-di-C-glucosideFlavones ***
1340.82801.1Spinacetin 3-O-glucosyl-(1->6)-[apiosyl(1->2)]-glucosideMethoxyflavonols ***
1444.23329.13,7-Dimethylquercetin *
1546.49785.2Pedunculagin IIEllagitannins **
1649.11301QuercetinFlavonols*
1749.15325p-Coumaric acid 4-O-glucosideHydroxycinnamic acids**
1851.26311Caffeoyl tartaric acid*
R.T.: Retention time; EE: ethanolic crude extract; F: fraction; * compound detected.
Table 8. Hemolytic activity of the fractions of the AE and EE extracts of P. hysterophorus.
Crude ExtractConcentration

(µg/mL)
Hemolysis%
F1F2F3F4F5F6F7Asc-A
(13.2 µg/mL)
Resv
(22.8 µg/mL)
Negative
control
00 ± 0.40
AE2003.57 ± 0.10 *1.08 ± 0.721.33 ± 1.620 ± 0.060 ± 0.170.04 ± 0.200 ± 0.200.42 ± 0.170.73 ± 0.40
4003.33 ± 0.20 *5.02 ± 1.53 *0 ± 0.490 ± 0.110.45 ± 0.380.77 ± 0.210 ± 0.23
6004.70 ± 0.11 *8.62 ± 1.75 *4.14 ± 1.51 *0.37 ± 0.151.42 ± 0.360.89 ± 0.410 ± 0.30
8006.27 ± 1.15 *12.84 ± 2.55 *2.43 ± 0.17 *0.37 ± 0.062.28 ± 0.350.89 ± 0.250 ± 0.51
EE2001.01 ± 0.52100 ± 1.81 *0.12 ± 0.351.48 ± 0.358.37 ± 0.11 *13.43 ± 0.42 *0 ± 0.21
4003.55 ± 0.17 *100 ± 1.600.29 ± 0.461.06 ± 010.52 ± 0.51 *16.77 ± 1.25 *4.41 ± 0.97 *
6007.18 ± 0.06 *100 ± 2.46 *0.08 ± 0.751.44 ± 0.3510.78 ± 0.75 *15.19 ± 1.91 *8.98 ± 1.35 *
80022.13 ± 1.65 *100 ± 1.25 *0.04 ± 0.201.40 ± 0.309.33 ± 1.08 *13.17 ± 3.03 *9.23 ± 0.55 *
AE: aqueous crude extract; EE: ethanolic crude extract; F: fraction; Asc-A: ascorbic acid; Resv: resveratrol; Data is shown as mean (n = 3) values ± standard deviation; * p < 0.05 as compared with negative control.
Table 9. DPPH ˙ radical inhibitory activity of the fractions of the AE and EE extracts of P. hysterophorus.
Crude ExtractConcentration
(µg/mL)
DPPH Inhibition% %
F1F2F3F4F5F6F7Asc-AResv
Negative
control
00 ± 0.40
AE200N/EN/E38.41 ± 0.55 *31.45 ± 0.66 *20.84 ± 0.77 *15.53 ± 0.11 *10.39 ± 1.16 *57.32 ± 0.65 *83.20 ± 0.11 *
40062.90 ± 0.05 *58.92 ± 0.49 *44.83 ± 0.88 *43.72 ± 0.44 *35.21 ± 0.77 *56.09 ± 0.20 *91.94 ± 0.18 *
60088.72 ± 0.03 *82.25 ± 0.05 *76.89 ± 0.99 *70.14 ± 1.31 *58.43 ± 0.11 *55.24 ± 0.30 *93.37 ± 0.27 *
80091.65 ± 0.06 *80.65 ± 0.22 *89.16 ± 0.22 *84.63 ± 0.33 *78.93 ± 1.38 *54.69 ± 0.03 *94.08 ± 0.07 *
IC50 (µg/mL)N/EN/E317.21334.94412.88447.98529.98
EE2000 ± 1.110 ± 0.2715.48 ± 3.52 *14.07 ± 1.50 *17.68 ± 1.20 *15.21 ± 1.86 *8.22 ± 0.12 *
4000 ± 0.218.43 ± 0.27 *59.89 ± 1.11 *54.08 ± 0.24 *41.91 ± 0.42 *36.66 ± 0.12 *24.16 ± 1.71 *
6000 ± 1.1713.76 ± 2.65 *84.90 ± 0.99 *79.30 ± 1.23 *58.96 ± 0.48 *60.19 ± 0.39 *36.78 ± 0.36 *
8000 ± 0.6611.55 ± 0.51 *91.26 ± 0.18 *92.55 ± 0.09 *77.91 ± 0.69 *76.58 ± 0.04 *60.19 ± 0.21 *
IC50 (µg/mL)-2084.70366.30415.86508.40523.71723.73
N/E: Not evaluated; AE: aqueous crude extract; EE: ethanolic crude extract; F: fraction; Asc-A: ascorbic acid; Resv: resveratrol; IC50: half maximal inhibitory concentration. Data are shown as mean (n = 3) values ± standard deviation; * p < 0.05 as compared with negative control.
Table 10. -OH radical inhibitory activity of the fractions of the AE and EE extracts of P. hysterophorus.
Crude ExtractConcentration
(µg/mL)
-OH Inhibition %
F1F2F3F4F5F6F7Asc-A
(13.2 µg/mL)
Resv
(22.8 µg/mL)
Negative
control
00 ± 0.60
AE200N/EN/E61.79 ± 0.70 *59.31 ± 0.10 *40.26 ± 0.20 *38.34 ± 0.30 *39.95 ± 0.10 *35.70 ± 0.78 *11.49 ± 0.40 *
40069.62 ± 0.81 *68.35 ± 0.64 *40.79 ± 0.42 *35.32 ± 0.10 *48.25 ± 1.01 *39.64 ± 0.39 *15.32 ± 0.40 *
60070.50 ± 0.90 *68.99 ± 0.10 *42.88 ± 0.20 *41.97 ± 0.90 *57.60 ± 0.70 *50.20 ± 0.49 *12.03 ± 0.93 *
80073.99 ± 0.60 *67.61 ± 0.30 *41.13 ± 0.11 *41.57 ± 0.10 *64.92 ± 0.42 *54.54 ± 0.49 *12.90 ± 0.53 *
EE20020.36 ± 0.92 *54.33 ± 0.70 *21.57 ± 1.41 *35.99 ± 0.10 *54.17 ± 0.40 *52.76 ± 0.80 *59.91 ± 0.90 *
40024.26 ± 0.42 *57.96 ± 0.30 *21.67 ± 0.10 *39.25 ± 0.70 *58.30 ± 0.30 *58.60 ± 0.40 *64.35 ± 1.10 *
60023.79 ± 0.20 *59.54 ± 0.46 *24.40 ± 0.60 *40.22 ± 0.30 *62.03 ± 0.80 *60.42 ± 0.20 *67.07 ± 0.35 *
80025.40 ± 0.40 *65.59 ± 0.61 *27.49 ± 0.42 *45.87 ± 0.30 *65.15 ± 0.30 *64.95 ± 0.50 *67.41 ± 1.18 *
N/E: Not evaluated; AE: aqueous crude extract; EE: ethanolic crude extract; F: fraction; Asc-A: ascorbic acid; Resv: resveratrol. Data are shown as mean (n = 3) values ± standard deviation; * p < 0.05 as compared with negative control.
Table 11. Effect of the fractions of the AE and EE extracts of P. hysterophorus on the antioxidant activity of SOD enzyme from human erythrocytes.
Crude ExtractConcentration
(µg/mL)
SOD (U/mL)
F1F2F3F4F5F6F7Asc-A
(13.2 µg/mL)
Resv
(22.8 µg/mL)
Negative
control
09.49 ± 2.16
AE200650.31 ± 6.25 *144.16 ± 34.83 *191.48 ± 12.88 *0 ± 14.75190.54 ± 9.32 *203.40 ± 11.27 *143.05 ± 13.04 *69.77 ± 4.99 *53.98 ± 3.46 *
400517.78 ± 69.5 *153.60 ± 3.73 *189.75 ± 10.43 *230.94 ± 75.89 *203.22 ± 1.25 *233.30 ± 43.77 *154.24 ± 0.93 *
600547.29 ± 38.04 *173.30 ± 8.42 *190.42 ± 0 *149.68 ± 62.31 *216.34 ± 14.77 *224.96 ± 11.24 *169.51 ± 1.03 *
800465.22 ± 80.78 *166.64 ± 3.03 *207.72 ± 2.57 *217.98 ± 27.04 *217.01 ± 2.69 *242.71 ± 13.84 *169.51 ± 1.03 *
EE2000 ± 0.200.65 ± 4.127.99 ± 11.660 ± 0.180 ± 0.070 ± 3.960 ± 4.06
4000 ± 5.1716.35 ± 6.447.59 ± 2.110 ± 0.200 ± 0.210 ± 0.470 ± 3.80
6000 ± 1.281.93 ± 6.4015.43 ± 5.890 ± 3.720 ± 0.630.77 ± 1.450 ± 2.71
80010.63 ± 8.480 ± 4.285.20 ± 2.310 ± 3.781.52 ± 8.570 ± 0.96 0 ± 0.51
SOD: superoxide dismutase; AE: aqueous crude extract; EE: ethanolic crude extract; F: fraction; Asc-A: ascorbic acid; Resv: resveratrol. Data are shown as mean (n = 2) values ± standard deviation; * p < 0.05 as compared with negative control.
Table 12. Effect of the fractions of the AE and EE extracts of P. hysterophorus on the antioxidant activity of CAT enzyme from human erythrocytes.
Crude ExtractConcentration
(µg/mL)
CAT (nmol/min/mL)
F1F2F3F4F5F6F7Asc-A
(13.2 µg/mL)
Resv
(22.8 µg/mL)
Negative
control
069.73 ± 24.10
AE200118.18 ± 4.99 *84.10 ± 1.6671.76 ± 12.4655.31 ± 4.1563.54 ± 20.7751.20 ± 24.9355.90 ± 1.660 ± 3.300 ± 0.97
400146.98 ± 2.49 *88.22 ± 2.4984.10 ± 13.30112.90 ± 9.14 *77.64 ± 20.7161.78 ± 6.6531.81 ± 0.83
600108.19 ± 9.14 *125.82 ± 14.13 *102.91 ± 3.32 *119.95 ± 4.95 *69.41 ± 20.7388.22 ± 5.82 *48.26 ± 4.15
80090.57 ± 7.48 *372.61 ± 25.76 *77.05 ± 11.63109.96 ± 26.59 *60.60 ± 31.5895.86 ± 0 *55.90 ± 8.31
EE20051.79 ± 9.14258.03 ± 14.96 *0 ± 21.610 ± 3.3220.06 ± 20.7718.29 ± 18.28114.66 ± 13.30 *
40090.57 ± 0.83 *260.38 ± 4.99 *3.02 ± 4.310 ± 7.4844.15 ± 025.34 ± 8.31179.88 ± 9.14 *
60070.59 ± 7.48272.72 ± 10.80 *0 ± 8.3121.23 ± 12.4611.24 ± 1.6658.84 ± 25.76119.36 ± 1.66 *
80073.53 ± 11.63265.08 ± 51.52 *0 ± 10.8045.32 ± 48.2017.71 ± 2.4145.91 ± 22.44 134.64 ± 3.32 *
CAT: catalase; AE: aqueous crude extract; EE: ethanolic crude extract; F: fraction; Asc-A: ascorbic acid: Resv: resveratrol. Data are shown as mean (n = 3) values ± standard deviation; * p < 0.05 as compared with negative control.
Publisher’s Note: MDPI stays neutral with regard to jurisdictional claims in published maps and institutional affiliations.

