Article

Hydrophobic Natural Eutectic Solvents for the Gas Chromatographic Determination of Suspected Allergens in Fragrances by Dispersive Liquid-Liquid Microextraction

Department of Drug Science and Technology, University of Turin, 10125 Turin, Italy
*
Author to whom correspondence should be addressed.
Separations 2022, 9(10), 318; https://doi.org/10.3390/separations9100318
Submission received: 15 September 2022 / Revised: 13 October 2022 / Accepted: 17 October 2022 / Published: 19 October 2022

Abstract

:
The fragrance industry plays a key role in the global economy, producing a wide range of personal care and household products. However, some fragrance ingredients have been linked to allergic reactions in sensitive people, and their concentrations are regulated at the European level. For this reason, reliable, rapid, and sustainable analytical methods are needed to rapidly detect and quantify these compounds. Recently, a new class of hydrophobic eutectic solvents (HES) has been introduced; they consist of natural terpenoids or phenolic compounds that can be used as hydrogen bond donors (HBD) and acceptors (HBA), and they are more suitable for GC applications due to their higher volatility. In this study, a dispersive liquid–liquid microextraction (DLLME) approach is proposed for the analysis and quantification of a range of allergens in hydroalcoholic perfumes. The optimized method requires only 50 µL of a natural HES (thymol–eugenol), which is readily dispersed by vortexing in 2 mL of sample. After centrifugation, the HES rich phase is diluted in 400 µL EtOH and directly injected into the GC-FID system. The proposed method has been successfully applied in the analysis and quantification of commercial fragrances, demonstrating good enrichment of target allergens and suitability for aqueous matrices analysis.

Graphical Abstract

1. Introduction

According to the International Fragrances Association (IFRA), the ingredients used to make fragrance blends that are included in perfumes and personal and household care products can be divided into (1) functional ingredients (essential for the stability and functionality of the preparation) and (2) fragrances that impart a pleasant and distinctive odor to the final product or mask other unpleasant odors [1]. These fragrant compounds may be of natural or synthetic origin and belong to different chemical classes, mainly aldehydes, ketones, alcohols, esters, and hydrocarbons. Despite the pleasant organoleptic properties of this heterogeneous class of substances, their use has been associated with allergic reactions (e.g., skin rash, dermatitis, migraine, asthma), which may vary depending on the sensitivity of the product user and the type of cosmetics [2]. For this reason, based on the draft opinion of the Scientific Committee on Cosmetic Products and Non-Food Products, the European Union included 26 fragrances (usually listed as allergens) in Annex III of the Cosmetics Directive, 7th Amendment (2003/15/EC) [3]. Twenty-four of the listed suspected allergens are volatile chemicals and two are natural extracts derived from oak moss and tree moss [3]. The main restriction for their use in cosmetic preparations is that they must be labeled on the final product if their concentration exceeds 0.001% w/w in leave-on products and 0.01% w/w in rinse-off products. In this sense, different analytical methods have been proposed for the analysis, identification, and quantification of allergens in cosmetics. Among the most commonly used analytical platforms are gas chromatography–mass spectroscopy (GC–MS) [4,5,6], headspace (HS) GC–MS [7], and also liquid chromatography (LC) coupled with MS [4,8]. Due to the complexity of the matrix to be analyzed (e.g., cream, lotion, shampoo) and the heterogeneous chemical properties of the target analytes, sample pretreatment is usually required. Some approaches have used toxic organic solvents, such as hexane, dichloromethane, or acetone [6,7,9], or automated but expensive platforms coupled to the chromatographic system [10], in order to avoid matrix-effect and contamination problems. However, in recent years, new analytical approaches have been developed by the Green Analytical Chemistry community that promote the use of more sustainable extraction methods while maintaining good sensitivity and enrichment of the target analytes, even in the cosmetic field [11,12]. For fragrances, sample preparation is usually not required because the high ethanol content allows direct injection of the (usually diluted) samples into the GC system. Nevertheless, cosmetic companies are increasingly offering fragrances/products with low content or without alcohol to avoid skin irritation or dryness. However, these water-based products have poor compatibility with GC systems because water can lead to stationary phase degradation, peak broadening, asymmetry, and adsorption [13].
In recent years, eutectic solvents (ESs) have gained attention as extraction solvents for sample preparation because they are easy to prepare, versatile, inexpensive, and environmentally friendly [14]. In particular, ESs are formed by the combination of two or three compounds interacting through hydrogen bonds. The term “eutectic” indicates that the solvent has a lower melting point than one of the constituents, which may previously be in solid form. Applications of ESs in analytical chemistry have primarily focused on the extraction of non-volatile compounds and downstream analysis by liquid chromatography (LC) due to the low compatibility of these solvents with GC platforms [14,15]. Indeed, among the hydrogen bond donors (HBD) and acceptors (HBA) used to prepare hydrophilic ESs, many have low volatility (e.g., choline chloride, ammonium salts, amino acids, glycerol, triethylene glycol) or are sensitive to the temperature ramp used in GC methods, leading, for example, to caramelization of the sugars commonly used to prepare these solvents. In the few studies reporting the combination of ES-based extraction and GC analysis, non-volatile compounds (e.g., choline chloride, urea, glycol, citric acid) are adopted and the ES should, therefore, be removed before or during the injection step [16,17,18]. However, the introduction of hydrophobic eutectic solvents (HESs) led to a wider range of components complementary to the hydrophilic ESs that are also more suitable for GC applications [19,20]. For example, short-chain fatty acids or terpenoids have high vapor pressure and can be easily injected into a GC system [21].
To the best of the authors’ knowledge, this study is the first to use a dispersive liquid–liquid microextraction (DLLME) approach with HESs to analyze multiple allergens in hydroalcoholic fragrances, followed by GC-FID analysis. The composition of the HESs was carefully selected testing different combinations of volatile terpenoids and phenolic compounds (thymol, eugenol, carvacrol, menthol, terpinen-4-ol, anethole). The DLLME method was optimized in terms of amount of HES and salt (NaCl), vortex time, and use of ultrasound to achieve higher extraction efficiency. The proposed method was subsequently validated. A mixture of six common cosmetic allergens (neral, geranial, citronellol, geraniol, hydroxycitronellal, and linalool) was used to screen the HES and optimize the extraction method, while two commercial hydroalcoholic preparations with a high water content were analyzed under the optimal extraction conditions to test the applicability of the developed method to real samples.

2. Materials and Methods

2.1. Samples and Chemicals

Ethanol (EtOH) from Merk (Milan, Italy) and ultrapure water, with a resistivity of 18.2 MΩ·cm, obtained from a Milli-Q water purification system (Bedford, MA, USA), were used as dilution solvents.
Standard compounds used for the preparation of eutectic solvents included thymol, eugenol, terpinen-4-ol, carvacrol, menthol and anethole from Merk (Milan, Italy).
The target analytes consisted of five suspected allergens, namely citronellol, hydroxycitronellal, geraniol, linalool, and citral (a mixture of neral and geranial in a 40:60 ratio) from Merk (Milan, Italy). Stock solutions of each single compound were prepared by diluting 10.0 mg of the allergens in 1 mL of EtOH. These solutions were used to prepare a stock solution containing all the target analytes (citronellol, hydroxycitronellal, geraniol, linalool, and citral), each diluted at the concentration of 2 g/L in water, which was the main solvent in the water-based fragrances investigated in the study. Working solutions of this standard mixture were prepared by diluting the stock solution with water at different concentrations (0.1–200 mg/L) and exploited for the optimization and validation of the method.
The analyzed real samples were water-based commercial fragrance solutions, specifically one air freshener (Fragrance 1) and one perfumed body water (Fragrance 2).
Finally, NaCl (Merk, Milan, Italy) was also used to promote the salting-out effect.

2.2. Instrument Set-Up

An ultrasonic bath (Sonica ultrasonic cleaner, Soltec EP S3, Milan, Italy) working at 40 Hz, a centrifuge (model 5702 from Eppendorf, Hamburg, Germany), and a vortex mixer (ArgoLab, Modena, Italy) were used for the sample preparation.
A Shimadzu GC/FID system, consisting of a Shimadzu GC 2010 coupled to a FID (Shimadzu, Kyoto, Japan), was used to carry out the analyses. Samples were introduced through an AOC-20i autosampler (Shimadzu). The software used for data acquisition and data elaboration was GCsolution® (Shimadzu).
The analyses were carried out on a Watercol 1900 [1,11-Di(3-methylimidazolium)-3,6,9- trioxaundecane trifluoromethanesulfonate] fused silica capillary column (30 m × 0.25 mm dc, 0.20 µm df, maximum allowable operative temperature 180 °C) from Supelco (Bellefonte, PA, USA). The column was selected because it allows the direct injection of real samples and standard mixtures diluted in EtOH/water.
The GC-FID conditions were as follows: injector temperature, 180 °C; detector temperature, 180 °C; injection mode, split; split ratio, 5:1; injection volume, 1 μL. Hydrogen was used as carrier gas at the constant flow rate of 1 mL/min. The oven temperature program was from 40 °C (kept for 2 min) to 180 °C (kept for 5 min) at 2 °C/min. Allergens and the HES components elution order was determined by analyzing the respective single compounds diluted in EtOH at a concentration of 100 mg/L individually, using the same conditions described previously.

2.3. Eutectic Solvents Preparation

The HES consisted of a hydrogen bond donor (HBD) and a hydrogen bond acceptor (HBA), mixed in a specific molar ratio. Preparation of HESs carried out following the heat and stirring method. The mixture of HBD and HBA was left under stirring, through a magnetic stir bar, in a water bath at 40 °C for 30 min, in order to avoid possible degradation [22], and then cooled at room temperature. After the preparation, the vials with the HES were sealed with parafilm and stored in a desiccator to prevent the evaporation of their components or moisture absorption. The stability of the mixture was verified for one month by monitoring, at frequent intervals, the formation of crystals, a signal of instability. Table 1 shows the different combinations of HESs tested.

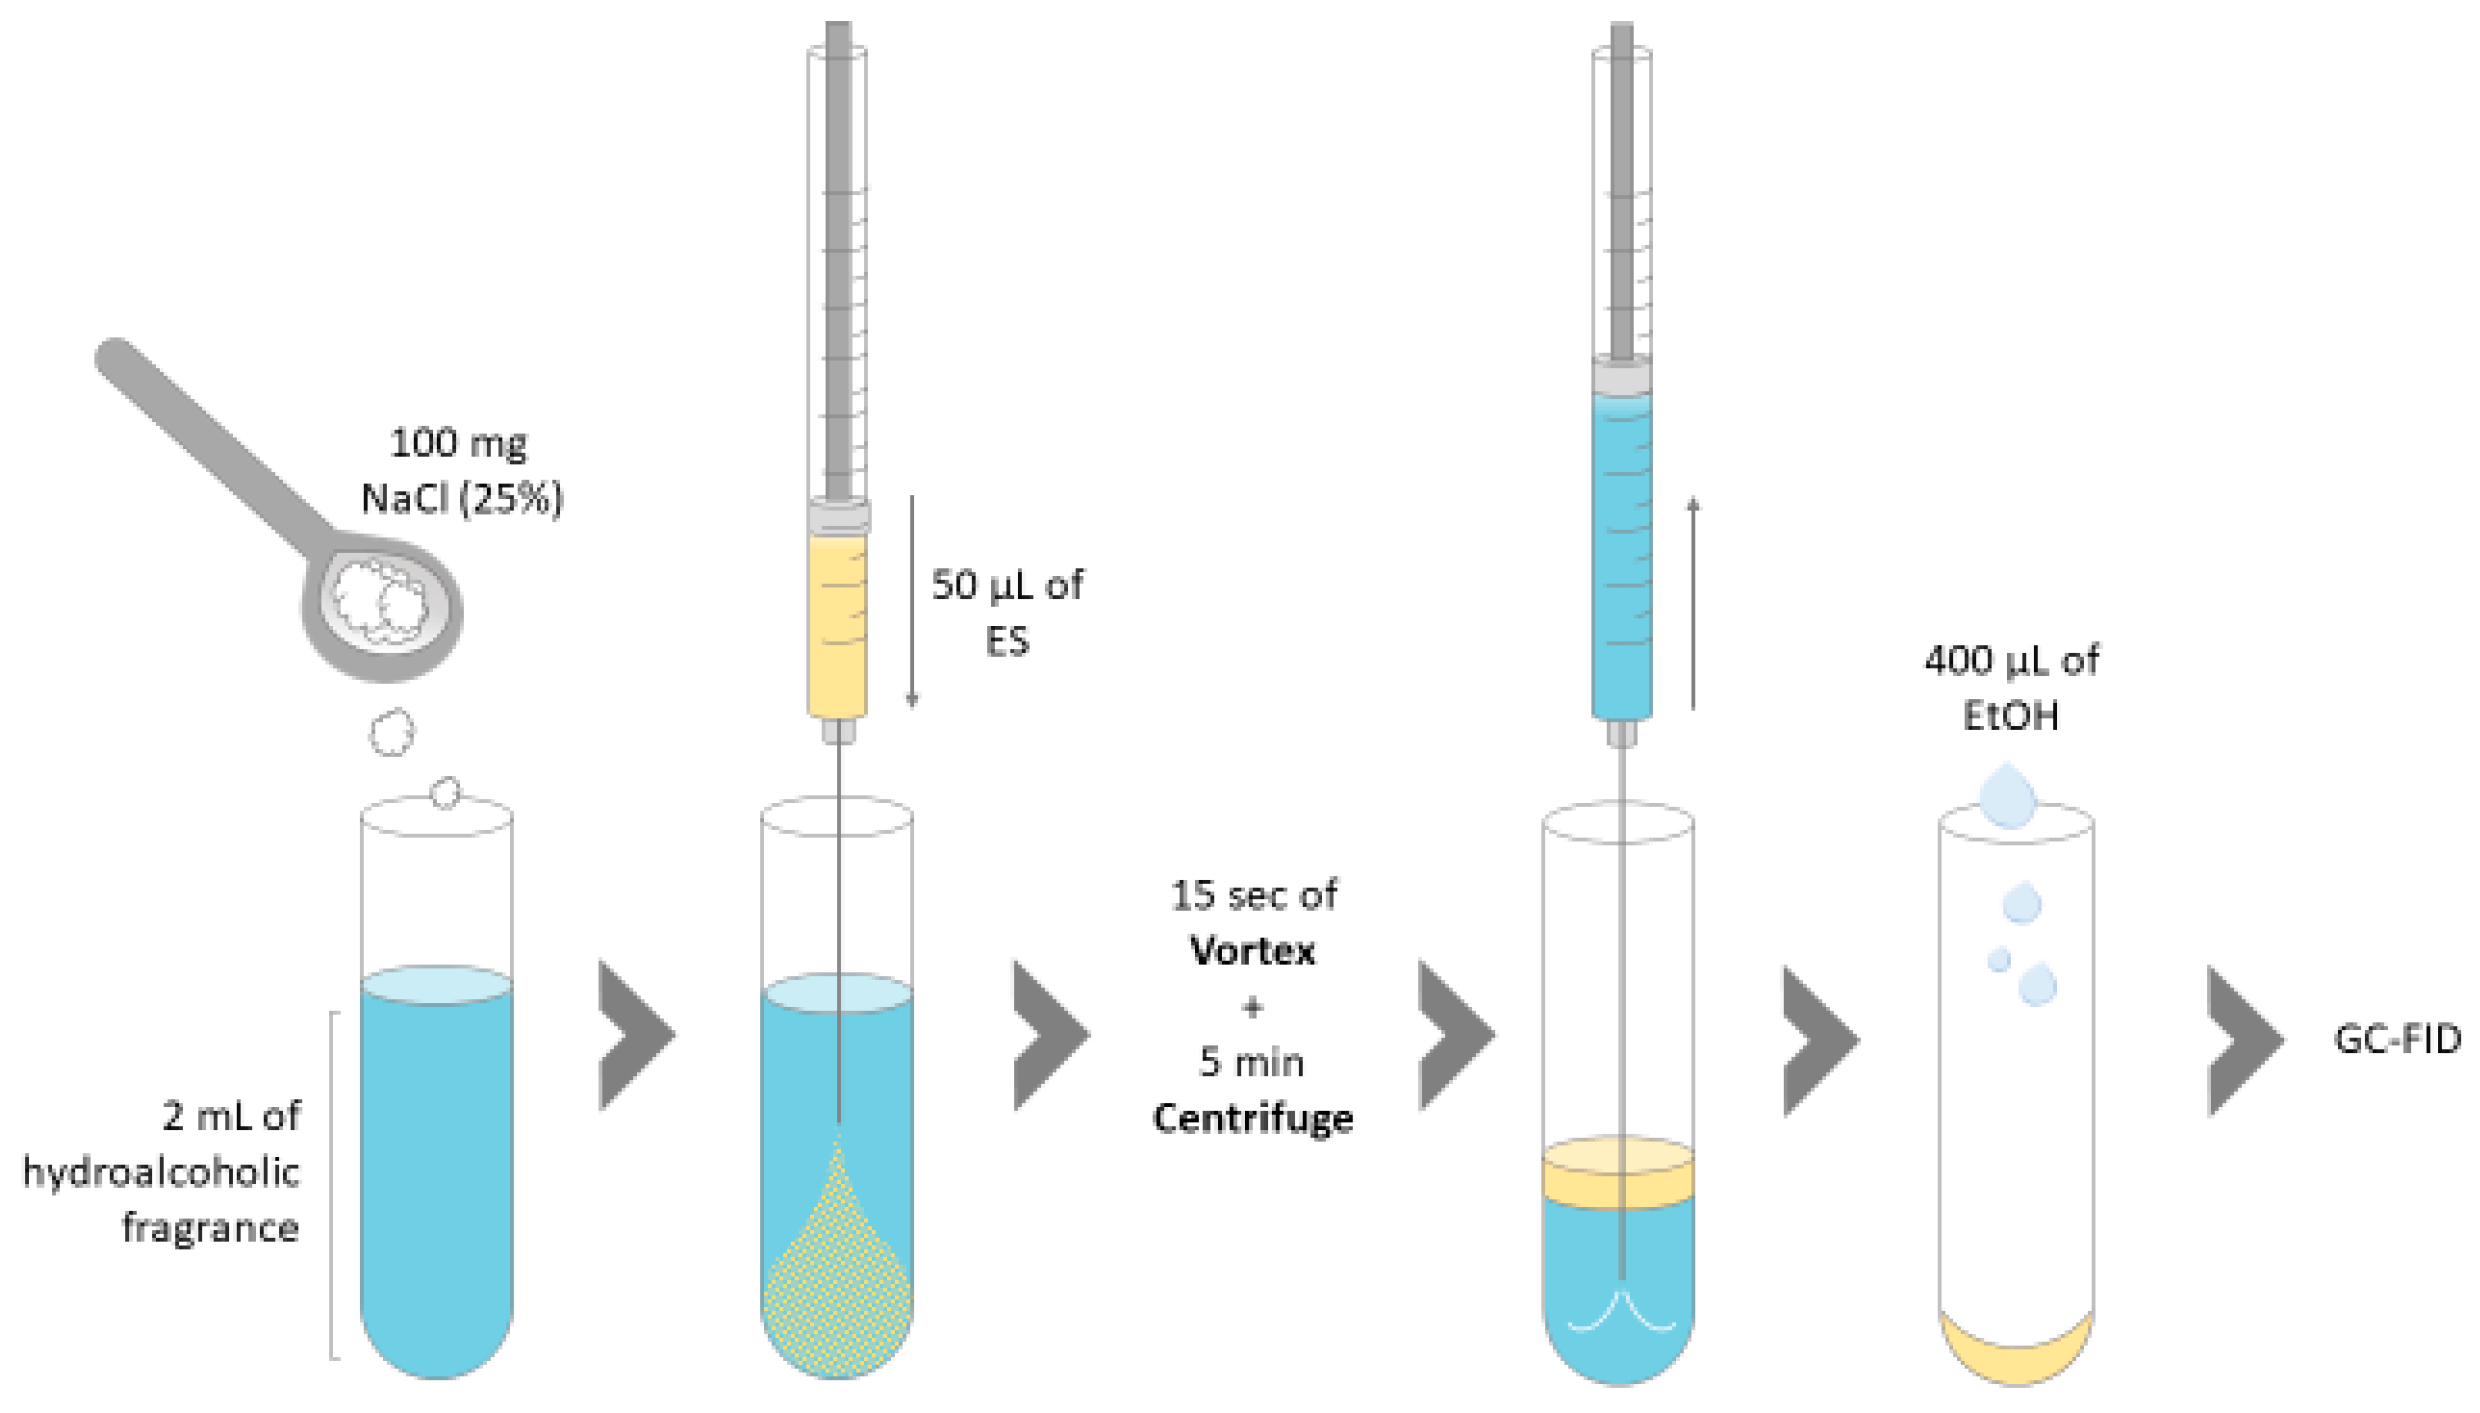
2.4. Dispersive Liquid-Liquid Microextraction with HES

In the optimized DLLME process, 2 mL of the sample of standard compounds were introduced into a 4 mL vial together with 50 μL of HES and 100 mg of NaCl. After closing the vial to avoid the volatilization of the target analytes, the suspension was mixed with the aid of a vortex for 15 s and then centrifuged for 5 min at 4500 rpm. As will be discussed in Section 3.2.1, the introduction of a 5 min ultrasound step has been evaluated without improving the efficiency of the extraction. The two phases formed (HES above and water below) were separated by removing the aqueous phase through a syringe. The HES was then diluted in 400 μL of EtOH and vortexed for 10 s to facilitate the solubilization. Thus, the solution was transferred to a 1.5 mL vial and directly injected into the GC-FID system. The same procedure was applied to real samples under study, with a previous dilution in Milli-Q water at 1:5 ratio. Three independent extractions were carried out for all samples. The DLLME method was compared with the analysis of the same samples directly injected without any pre-treatment (with the exception of the real samples that were diluted in MilliQ water in a 1:5 ratio).

2.5. Statistical Analysis

All extractions were repeated three times and each extraction was analyzed three times to monitor the analytical performance of the instrument. Then, ANOVA statistical analysis was carried out with SPSS 15.0 (IBM Corporation, Armonk, NY, USA) software. Excel software (Microsoft Office, v.2016) was employed for the remaining calculations.

3. Results and Discussion

3.1. Screening of Different Hydrophobic Eutectic Solvents

The key features that a HES must have in order to be used for the DLLME of aqueous samples and subsequent GC analysis include the following: (i) its hydrophobicity and liquid nature at the extraction temperature (usually room temperature) to allow HES liquid–liquid dispersion in aqueous solutions, and (ii) the volatility of HBD and HBA, which allows the direct injection of the solvent and its elution by GC-FID. Volatile terpenoids and phenylpropanoids are good candidates for the preparation of natural HESs with these characteristics. However, the choice of the appropriate HBA/HBD combination should take in consideration the absence of the two components of the HES in the sample and the possible interference of their elution with the sample compounds. Therefore, different combinations of HBD and HBA were tested in a 1:1 molar ratio, as shown in Table 1. The applicability of the tested eutectic solvents was evaluated by comparing the elution behavior of the components of the HES with that of a mixture of six common cosmetic allergens (neral, geranial, citronellal, geraniol, hydroxycitronellal, and linalool), which were used as target compounds for the following evaluations.
Of the combinations tested, the best results were obtained with thymol–eugenol and thymol–carvacrol, since no co-elutions were observed and the retention time of the two components of the HESs was higher than that of the target analytes, so they did not affect their chromatographic behavior. The thymol–eugenol combination (see Figure S1) was finally selected, because eugenol can be isolated from clove essential oils with a relatively high yield [23], making its use more sustainable than that of carvacrol.

3.2. Optimization of the Dispersive Liquid-Liquid Microextraction Method

The optimization of DLLME conditions, illustrated in Figure 1, was performed using the reference standard mixture (see Section 2.1) prepared at a concentration of 100 mg/L.
The aim of the optimization step was not only to improve the extraction performance of the method, but also to minimize the extraction time and solvent consumption, as well as to increase the sample throughput and simplify the procedure to obtain an environmentally friendly sample preparation method [24].
The use of ultrasound, the ionic strength, the extraction time, and the amount of HES were the parameters considered in the optimization of the extraction method. The extraction efficiency was evaluated by comparing the peak areas of the target analytes. The results of each step of the optimization procedure are described in the following sections and shown in Figure 2.

3.2.1. Ultrasound Step

Ultrasound (US) is often used to assist extraction with HESs to enhance the transfer of analytes from the matrix to the eutectic solvent, resulting in a reduction in extraction time and energy consumption [14]. In the analysis of plant matrices, US, together with HES, was also found to be fundamental for cell wall disruption and subsequent release of target analytes [19].
In the analysis of fragrance samples, the release of analytes from a solid matrix is not required, but ultrasound can improve the efficiency of extraction. The addition of an ultrasound step after the HES dispersion (promoted by vortexing) was, therefore, evaluated by comparing the peak areas of target analytes extracted for 30 s with 100 µL HES with or without the addition of a five minutes ultrasound step.
The results (reported in Figure 2a) showed no statistical differences between the two conditions and, therefore, the use of US was excluded, reducing the number of steps in the procedure and the total extraction time.

3.2.2. Ionic Strength

The effect of ionic strength on extraction efficiency was evaluated by adding different amounts of NaCl. Indeed, the addition of salt to the HES-assisted DLLME process may be beneficial not only because of the well-known salting-out effect, but also because it could reduce the (low) solubility of HBA and HBD in water, promoting a more complete and easier recovery of the hydrophobic solvent.
The NaCl concentration was selected based on the saturation of the salt in the hydroalcoholic solution in which the target analytes were dissolved. Saturation was determined experimentally at 20% m/v, and extractions were, therefore, carried out without the addition of salt, at the saturation concentration (20% m/v), and at two intermediate concentrations (10% m/v and 5% m/v).
Figure 2b shows the results obtained with different NaCl concentrations in the sample solution. A significant improvement in the extraction efficiency is observed when salt is added for all compounds, with the only exception being hydroxycitronellal. Conversely, the comparison between the three salt concentrations shows no significant differences except for the two citral isomers (neral and geranial), for which significantly higher peak areas were obtained for the 5% NaCl concentration. This amount of salt was, therefore, selected for the following experiments.

3.2.3. HES Volume Effect

The volume of the HES was optimized by testing different volumes of the solvent (50, 100 and 200 µL) as the extraction phase. The results are summarized in Figure 2c and show significantly higher peak areas obtained with the lower volume of the HES, indicating complete extraction of the target analytes even when using only 50 µL of HES. The exhaustivity of the extraction was also checked by injecting the discharged water phase; the resulting chromatogram showed none of the target analytes, but only a very small amount of the two components of the HES, which are only very slightly dissolved in the sample solution (Figure S1). At the same time, the absence of carryover effects in the GC system due to the injection of high amounts of thymol and eugenol was verified with a blank run after the injection of the enriched-HES; no signal from the HBA and HBD was observed (data not shown). Therefore, a volume of 50 µL of HES was chosen for all subsequent extractions.

3.2.4. Extraction Time Effect

In DLLME, the extraction process is often assisted by vortexing to promote the formation and dispersion of small microdroplets that increase the contact area between the two phases (sample and HES) and facilitate the fast partitioning of analytes into the eutectic solvent. In this study, the time of vortex-assisted extraction was varied to determine if this parameter affected the extraction efficiency. Three extraction times were tested (15, 30, and 60 s), and the results (see Figure 2d) show no differences between the three conditions. Therefore, an extraction time of 15 s was chosen for the following experiments to speed up the extraction process and to increase the comfort of the operator.
In summary, the optimized method (Figure 1) requires only 50 μL of HES and a small amount of NaCl and EtOH, consists of four extraction steps, and takes less than 10 min, resulting in an extremely environmentally friendly approach. This consideration is confirmed by the greenness score calculated with the AGREEprep metric tool [25], which is 0.75/1 (Figure S2).

3.3. Analytical Performance for the HES-Based DLLME Method

Table 2 summarizes the analytical figures of merit obtained with the optimized HES-based DLLME GC-FID method for the determination of the target suspected allergens and with the direct injection of the same samples.
The coefficients of determination (R2) of the calibration curves obtained by DLLME were higher than 0.99 for all target analytes, with the sole exception of citronellol (R2 = 0.9863), indicating good linearity in the extraction. The limits of detection (LOD) and quantification (LOQ) were determined experimentally by decreasing the concentration of analytes subjected to extraction until a signal-to-noise ratio (S/N) of 3 and 10, respectively, was achieved. The values of LOD and LOQ were 0.2 mg/L and 0.5 mg/L, respectively, for all compounds, showing the good sensitivity of the method. These values are well below the limits set by the regulation for the indication on the labels of cosmetic products (0.001% w/w in leave-on products and 0.01% w/w in rinse-off products). Repeatability was estimated using three independent extractions at each concentration level. Table 2 shows the %RSD values obtained at 1 mg/L, which are below 10% with the sole exception of citronellol (16.4%).
Finally, the enrichment factors (EFs), defined as the ratio of the slopes of the calibration curves with and without the enrichment procedure, were determined. They ranged between 3 and 4 for all target analytes, indicating a significant improvement in the sensitivity of the proposed microextraction procedure. Indeed, the direct injection method showed good linearity but higher LOD and LOQ values than the proposed approach.

3.4. Analysis of Real Samples and Comparison with Direct Injection

Two commercial water-based fragrances were then analyzed using the proposed HES -based DLLME GC-FID method, and the detected target analytes were quantified to evaluate the suitability of the proposed method for real-world applications. The results are summarized in Table 3.
Four of the investigated suspected allergens (linalool, citronellol, geraniol, hydroxycitronellal) were found in Fragrance 1, while two of them were found in Fragrance 2 (linalool and citronellol). The concentration of the target analytes ranged from 300 to 500 mg/L in Fragrance 1, while Fragrance 2 had a high amount of linalool (above the calibration range) and only 22 mg/L of citronellol. The method showed very good precision with a relative standard deviation of less than 10% for three independent extractions for all compounds in both samples. Finally, to investigate the accuracy of the method, the concentrations obtained were compared to those determined by direct injection to calculate the relative recoveries for each analyte. As shown in Table 3, good relative recoveries (%RR) were obtained (85.2–107.3%), proving that there is no significant matrix effect. Figure 3 shows the comparison between the GC-FID profiles of Fragrance 1 submitted to the DLLME (a) and directly injected (b), and of the 100 mg/L reference mixture extracted with the proposed method (c).

3.5. Comparison with Previously Reported Methods

Table 4 provides a comparison between the proposed method and some other representative sample preparation methods described in the literature for the determination of allergen suspected substances in cosmetic samples.
It is worth noting that the guidelines of the International Fragrances Association (IFRA) [1] and many other studied, such as those by Liu et al. [10] and David et al. [6], do not suggest enriching the target analytes, but rather the dilution of the fragrances to make them compatible with the downstream analytical platform. Indeed, to apply this approach to the analyses of matrices containing non-volatile components, David et al. introduced a PDMS foam inside a programmed temperature vaporization inlet [6] to trap the interfering components. In general, the sensitivity of the methods that require the dilution of the samples is limited (although within the values required by the regulations) or very sophisticated instruments are required. Regarding the analysis of fragrances, their direct injection without dilution is usually avoided, especially in GC, because they contain a discrete amount of water that is known to be poorly compatible with conventional stationary GC phases [13]. Moreover, the possibility to enrich the analytes with a proper extraction method can be advantageous to detect these compounds at lower concentrations. However, few studies report selective extraction of the suspected allergens from the cosmetic matrix: they either exploit the volatility of the target analytes [5,6,9] or use liquid–liquid extraction [7,26] or matrix-solid phase dispersion [4]. However, these methods are not exhaustive [5] or require the consumption of a considerable amount of toxic solvents [4,6,7] or electrical energy [6,9]. Pérez-Outeiral et al. proposed a very interesting ultrasound-assisted emulsification microextraction approach that adopts only 50 µL of 2-dodecanol and which is able to obtain a very high enrichment of the analytes [26]. However, in the latter case, the sensitivity of the method is affected by the adoption of a HPLC analytical platform that is commonly not the first choice for the analyses of allergens that are volatile and more compatible with GC analysis. The DLLME protocol proposed in this study, based on HES, makes it possible to achieve similar or lower detection limits compared to the previously mentioned methods, consuming only a few µL of a natural-based solvent and using sensitive and very common equipment with low power consumption, thus, meeting the requirements of the Green Analytical Chemistry movement.

4. Conclusions

In the present study, an environmentally friendly and sustainable method for the enrichment of volatiles from aqueous solutions by DLLME with natural HESs and their determination by GC-FID is proposed. For the first time, natural volatiles (monoterpenoids and phenolics) are used as the extraction phase for the enrichment of other natural volatiles without using harmful co-solvents, and the extraction is followed by direct GC-FID analysis of the HES-rich phase.
The HES-based DLLME GC-FID approach has been applied for the determination of a set of suspected allergens in water-based fragrances. The method was optimized and validated; it showed good extraction performance and a more than 3-fold enrichment compared to the direct injection of the samples, which also requires the use of dedicated water-compatible columns. The most critical step was the selection of the components of the HES, since HBA and HBD should not be present in the sample under investigation and should not interfere with the elution of other sample components.
Future developments will be directed towards expanding the number of target analytes and applying the method to more complex cosmetic matrices. The possibility of combining the HES-based DLLME approach with GC–MS analysis will also be explored to take advantage of the selectivity of the MS detector to improve the sensitivity of the method and to resolve potential co-elutions.

Supplementary Materials

The following supporting information can be downloaded at: https://www.mdpi.com/article/10.3390/separations9100318/s1, Figure S1: GC-FID profiles of (a) HES based DLLME of the investigated suspected allergens, (b) direct injection of the allergens mixture and (c) water phase resulting after the extraction.; Figure S2: pictogram and report obtained with AGREEprep metric tool for the proposed HES based DLLME method

Author Contributions

Conceptualization, C.C., G.B. and G.M.; validation, A.M., B.S. and P.R.; investigation, G.B.; data curation, C.C., G.B and G.M.; writing—original draft preparation, C.C., G.B. and G.M.; writing—review and editing, C.C., A.M., B.S. and P.R.; supervision, C.C. and P.R.; project administration, C.C. All authors have read and agreed to the published version of the manuscript.

Funding

This research was funded by the ‘Ricerca Locale’ (Ex60%2021) project of the University of Turin, (Italy).

Data Availability Statement

The data presented in this study are available on request from the corresponding authors. The data are not publicly available because all data elaborations reported in the manuscript.

Acknowledgments

This article is based upon work from the Sample Preparation Study Group and Network supported by the Division of Analytical Chemistry of the European Chemical Society.

Conflicts of Interest

The authors declare no conflict of interest.

References

  1. International Fragrance Association (IFRA). Available online: https://ifrafragrance.org/priorities/ingredients/ifra-transparency-list (accessed on 14 September 2022).
  2. Bickers, D.R.; Calow, P.; Greim, H.A.; Hanifin, J.M.; Rogers, A.E.; Saurat, J.-H.; Glenn Sipes, I.; Smith, R.L.; Tagami, H. The safety assessment of fragrance materials. Regul. Toxicol. Pharmacol. 2003, 37, 218–273. [Google Scholar] [CrossRef]
  3. European Union, Directive 2003/15/EC of the European Parlaiment and of The Council of 27 February 2003. Available online: https://eur-lex.europa.eu/legal-content/IT/TXT/?uri=CELEX:32003L0015 (accessed on 14 September 2022).
  4. Sanchez-Prado, L.; Lamas, J.P.; Alvarez-Rivera, G.; Lores, M.; Garcia-Jares, C.; Llompart, M. Determination of suspected fragrance allergens in cosmetics by matrix solid-phase dispersion gas chromatography–mass spectrometry analysis. J. Chromatogr. A 2011, 1218, 5055–5062. [Google Scholar] [CrossRef] [PubMed]
  5. Chen, Y.; Begnaud, F.; Chaintreau, A.; Pawliszyn, J. Quantification of perfume compounds in shampoo using solid-phase microextraction. Flavour Fragr. J. 2006, 21, 822–832. [Google Scholar] [CrossRef]
  6. David, F.; Devos, C.; Joulain, D.; Chaintreau, A.; Sandra, P. Determination of suspected allergens in non-volatile matrices using PTV injection with automated liner exchange and GC-MS. J. Sep. Sci. 2006, 29, 1587–1594. [Google Scholar] [CrossRef] [PubMed]
  7. Desmedt, B.; Canfyn, M.; Pype, M.; Baudewyns, S.; Hanot, V.; Courselle, P.; De Beer, J.O.; Rogiers, V.; De Paepe, K.; Deconinck, E. HS–GC–MS method for the analysis of fragrance allergens in complex cosmetic matrices. Talanta 2015, 131, 444–451. [Google Scholar] [CrossRef]
  8. Cooper, J.; Jones, M.; Duban, S. Fast Analysis of Cosmetic Allergens Using UltraPerformance Convergence Chromatography (UPC2) with MS Detection- Application Note. Available online: https://www.waters.com/waters/library.htm?cid=511436&lid=134878656 (accessed on 14 September 2022).
  9. Devos, C.; Ochiai, N.; Sasamoto, K.; Sandra, P.; David, F. Full evaporation dynamic headspace in combination with selectable one-dimensional/two-dimensional gas chromatography–mass spectrometry for the determination of suspected fragrance allergens in cosmetic products. J. Chromatogr. A 2012, 1255, 207–215. [Google Scholar] [CrossRef]
  10. Liu, Q.; Zenobi, R. Rapid analysis of fragrance allergens by dielectric barrier discharge ionization mass spectrometry. Rapid Commun. Mass Spectrom. 2021, 35, e9021. [Google Scholar] [CrossRef]
  11. Celeiro, M.; Garcia-Jares, C.; Llompart, M.; Lores, M. Recent Advances in Sample Preparation for Cosmetics and Personal Care Products Analysis. Molecules 2021, 26, 4900. [Google Scholar] [CrossRef]
  12. Schettino, L.; Peris-Pastor, G.; Benedé, J.L.; Chisvert, A. A comprehensive review on the use of microextraction techniques in the analysis of cosmetic products. Adv. Sample Prep. 2022, 3, 100024. [Google Scholar] [CrossRef]
  13. Kuhn, E.R. Water injections in GC—How wet can you get? LC-GC N. Am. 2002, 20, 474–478. [Google Scholar]
  14. Mastellone, G.; Marengo, A.; Sgorbini, B.; Rubiolo, P.; Cagliero, C. New phases for analytical scale extraction from plants: Current and future trends. TrAC Trends Anal. Chem. 2021, 141, 116288. [Google Scholar] [CrossRef]
  15. Ivanović, M.; Islamčević Razboršek, M.; Kolar, M. Innovative Extraction Techniques Using Deep Eutectic Solvents and Analytical Methods for the Isolation and Characterization of Natural Bioactive Compounds from Plant Material. Plants 2020, 9, 1428. [Google Scholar] [CrossRef] [PubMed]
  16. Davoodi, R.; Nodehi, R.N.; Rastkari, N.; Zinatizadeh, A.A.; Mahvi, A.H.; Fattahi, N. Solid-phase extraction followed by deep eutectic solvent based dispersive liquid–liquid microextraction and GC-MS detection of the estrogenic compounds in wastewater samples. New J. Chem. 2020, 44, 9844–9851. [Google Scholar] [CrossRef]
  17. Nie, J.; Yu, G.; Song, Z.; Wang, X.; Li, Z.; She, Y.; Lee, M. Microwave-assisted deep eutectic solvent extraction coupled with headspace solid-phase microextraction followed by GC-MS for the analysis of volatile compounds from tobacco. Anal. Methods 2017, 9, 856–863. [Google Scholar] [CrossRef]
  18. Makoś, P.; Fernandes, A.; Przyjazny, A.; Boczkaj, G. Sample preparation procedure using extraction and derivatization of carboxylic acids from aqueous samples by means of deep eutectic solvents for gas chromatographic-mass spectrometric analysis. J. Chromatogr. A 2018, 1555, 10–19. [Google Scholar] [CrossRef] [PubMed]
  19. Mastellone, G.; Marengo, A.; Sgorbini, B.; Rubiolo, P.; Cagliero, C. Development of a dispersive solid-liquid microextraction method using natural eutectic solvents for a greener extraction of phytochemicals from fiber-type Cannabis sp. Ind. Crops Prod. 2022, 187, 115476. [Google Scholar] [CrossRef]
  20. Boateng, I.D. A Critical Review of Emerging Hydrophobic Deep Eutectic Solvents’ Applications in Food Chemistry: Trends and Opportunities. J. Agric. Food Chem. 2022, 70, 11860–11879. [Google Scholar] [CrossRef] [PubMed]
  21. Makoś, P.; Przyjazny, A.; Boczkaj, G. Hydrophobic deep eutectic solvents as “green” extraction media for polycyclic aromatic hydrocarbons in aqueous samples. J. Chromatogr. A 2018, 1570, 28–37. [Google Scholar] [CrossRef] [PubMed]
  22. Farooq, M.Q.; Abbasi, N.M.; Anderson, J.L. Deep eutectic solvents in separations: Methods of preparation, polarity, and applications in extractions and capillary electrochromatography. J. Chromatogr. A 2020, 1633, 461613. [Google Scholar] [CrossRef]
  23. European Pharmacopoeia, 10th ed. Available online: https://www.edqm.eu/en/web/edqm/european-pharmacopoeia-ph-eur-10th-edition- (accessed on 14 September 2022).
  24. López-Lorente, Á.I.; Pena-Pereira, F.; Pedersen-Bjergaard, S.; Zuin, V.G.; Ozkan, S.A.; Psillakis, E. The ten principles of green sample preparation. TrAC Trends Anal. Chem. 2022, 148, 116530. [Google Scholar] [CrossRef]
  25. Wojnowski, W.; Tobiszewski, M.; Pena-Pereira, F.; Psillakis, E. AGREEprep—Analytical greenness metric for sample preparation. TrAC Trends Anal. Chem. 2022, 149, 116553. [Google Scholar] [CrossRef]
  26. Pérez-Outeiral, J.; Millán, E.; Garcia-Arrona, R. Ultrasound-assisted emulsification microextraction coupled with high-performance liquid chromatography for the simultaneous determination of fragrance allergens in cosmetics and water. J. Sep. Sci. 2015, 38, 1561–1569. [Google Scholar] [CrossRef] [PubMed]
Figure 1. Scheme of the optimized HES-based DLLME method.
Separations 09 00318 g001
Figure 2. Comparison of the extraction performance (in term of peaks area) of the target analytes obtained by varying the (a) ultrasound step, (b) ionic strength, (c) HES volume, and (d) extraction time. Different letters indicate significant differences at p < 0.05 for each compound (Tukey range test).
Separations 09 00318 g002
Figure 3. GC/FID profiles of (A) HES-based DLLME of Fragrance 1, (B) direct injection of Fragrance 1 and (C) HES-based DLLME of the reference mixture at 100 mg/L. Here, (1) linalool, (2) neral, (3) citronellol, (4) geranial, (5) geraniol, and (6) hydroxycitronellal; (a) thymol, and (b) eugenol.
Separations 09 00318 g003
Table 1. List of the natural DESs prepared in this study. All HESs were prepared with the heat and stirring method.
HBA aHBD bMolar Ratio
ThymolCarvacrol1:1
ThymolEugenol1:1
Terpinen-4-olMenthol1:1
AnetholeMenthol1:1
ThymolCumarine1:1
a Hydrogen bond donor; b hydrogen bond acceptor.
Table 2. Analytical figures of merit for the target suspected cosmetic allergens using the HES-based DLLME GC-FID method and direct injection GC-FID analysis.
NeralGeranialCitronellolGeraniolHydroxycitronellalLinalool
HES-based DLLME method
Investigated linear range (mg/L)0.5–800.5–1200.5–2000.5–2000.5–2000.5–200
Calibration equationy = 4304.5x + 3980.8y = 4710.2x + 4577.4y = 5537.8x − 9534.2y = 5618.7x + 3673.4y = 3588.3x − 6788.9y = 6383.8x − 7117.3
Linearity (R2)0.9940.9970.9860.9940.9960.996
LOD (mg/L)0.20.20.20.20.20.2
LOQ (mg/L)0.50.50.50.50.50.5
Repeatability 1 mg/L (% RSD), n = 37.54.616.47.22.53.6
Enrichment factor a3.23.73.53.53.03.9
Direct injection
Investigated linear range (mg/L)2–802–1202–2002–2002–2002–200
Calibration equationy = 1343x + 46.441y = 1284.1x + 881.02y = 1577.5x + 165.08y = 1597.9x + 475.17y = 1174.9x − 868.18y = 1633x + 453.01
Linearity (R2)0.9980.9970.9970.9950.9950.997
LOD (mg/L)111111
LOQ (mg/L)222222
a Calculated as a slope ratio between calibration curves with and without DLLME.
Table 3. Quantification results for the target analytes in two commercial fragrances measured by DLLME and expressed as mg/L (±SD), with precision data and % relative recovery (%RR) calculated on the basis of the concentrations obtained by direct injection.
CompoundConcentration Measured by DLLME (mg/L)Precision (% RSD), n = 3Relative Recovery (% RR)
Fragrance 1
Linalool475 ± 51.185.2
Citronellol390 ± 236.486.4
Geraniol326 ± 61.7n.c. a
Hydroxycitronellal389 ± 103.184.1
Fragrance 2
Linalool1256 ± 94 b7.7107.3
Citronellol22 ± 27.5100.6
a Not calculable for a co-elution in the direct injection mode; b Estimated because the values were outside the calibration range.
Table 4. Comparison of the proposed HES-based DLLME and other representative methods developed for the determination of suspected allergens in fragrances.
SampleExtraction MethodSolvent/SorbentVolume of SolventAnalytical PlatformLODLOQ aReference
Fragrances- bMethyl pivalateSeveral hundreds of mLGC-MS/FID-2 mg/L[1]
Cosmetic matricesLLEHexane10 mLHS c-GC-MS-8 mg/L[7]
Cosmetic matricesMSPD dHexane/acetone 1:1 Florisil® e (2 g)5 mLGC-MS0.02–1 mg/Kg0.05–2.5 mg/kg[4]
Cosmetic matrices- bDichloromethane10 mLPTV f-GC-MS with liner packed with PDMS g foam 5 mg/kg[6]
Cosmetic matricesFEDHS h--GC-MS-10 mg/L[9]
ShampooHS-SPME iPDMS, PA j-GC-MS0.001–3.0 mg/L-[5]
Cosmetics and waterUSAEME k2-dodecanol50 µLHPLC-DAD0.001–0.154 mg/L0.004–0.463 mg/L[26]
Perfumes- bMeOH-DBDI l-MS0.0001–0.01 mg/L0.001–0.05 mg/L[10]
Hydroalcoholic fragrancesDLLMENatural HES50 µLGC-FID0.1 mg/L0.5 mg/LThis work
a LOQ or lower concentration analyzed, b No sample preparation, direct dilution of the sample (at least 10X for [1] and [6] and 100X for [10]), c headspace, d matrix solid-phase dispersion, e white, hard powdered magnesium silica gel, f programmed temperature vaporization inlet, g polydimethylsiloxane, h full evaporation dynamic headspace, i solid-phase microextraction, j polyacrylate, k ultrasound-assisted emulsification microextraction, and l dielectric barrier discharge ionization.
Publisher’s Note: MDPI stays neutral with regard to jurisdictional claims in published maps and institutional affiliations.

