Article

Development of a Simple High-Performance Liquid Chromatography-Based Method to Quantify Synergistic Compounds and Their Composition in Dried Leaf Extracts of Piper Sarmentosum Roxb.

by
Rayudika Aprilia Patindra Purba
1,*,
Siwaporn Paengkoum
2 and
Pramote Paengkoum
1,*
1
Institute of Agricultural Technology, School of Animal Technology and Innovation, Suranaree University of Technology, Nakhon Ratchasima 30000, Thailand
2
Program in Agriculture, Faculty of Science and Technology, Nakhon Ratchasima Rajabhat University, Nakhon Ratchasima 30000, Thailand
*
Authors to whom correspondence should be addressed.
Separations 2021, 8(9), 152; https://doi.org/10.3390/separations8090152
Submission received: 29 July 2021 / Revised: 3 September 2021 / Accepted: 8 September 2021 / Published: 13 September 2021

Abstract

:
There is a growing demand to enhance pharmaceutical and food safety using synergistic compounds from Piper sarmentosum Roxb., such as polyphenols and water-soluble vitamins. However, information on standardized analytical methods to identify and quantify these compounds of interest is limited. A reversed-phase high-performance liquid chromatography with diode-array detection (HPLC-DAD)-based method was developed to simultaneously detect and quantify the amounts of tannin, flavonoid, cinnamic acid, essential oil, and vitamins extracted from P. sarmentosum leaves using methanol, chloroform, and hexane. Commercially and non-commercially-cultivated P. sarmentosum leaves were subjected to seven different drying treatments (shade; sun; air oven at 40 °C, 60 °C, 80 °C, and 100 °C; and freeze-drying) for three consecutive months. Most compounds were detected most efficiently at a detection wavelength of 272 nm. The developed method displayed good detection limits (LOD, 0.026–0.789 µg/mL; LOQ, 0.078–2.392 µg/mL), linearity (R2 > 0.999), precision (%RSD, <1.00), and excellent accuracy (96–102%). All P. sarmentosum leaf extracts were simultaneously tested and analytically compared without time-consuming fractionation. Methanolic plant extracts showed better peak area and retention time splits compared to chloroformic and hexanoic extracts. Differences in synergistic compound composition were dependent on the type of drying treatment but not on cultivation site and time of sampling. Flavonoid was identified as the dominant phytochemical component in P. sarmentosum leaves, followed by the essential oil, cinnamic acid, ascorbic acid, and tannin. Overall, we present a simple and reproducible chromatographic method that can be applied to identify different plant compounds.

Graphical Abstract

1. Introduction

Herbal remedies, due to their cost-effectiveness and reduced harmful side effects, have become popular worldwide. Piper sarmentosum Robx. (Piperaceae), a low-growing perennial herb, has a long history of use as a source of potential herbal medicines and traditional cuisines. The plant is cultivated in America (Panama and North America), China (especially in southeast coastal areas), and Southeast Asian countries [1,2]. The whole plants, or specific parts of P. sarmentosum, such as roots, dry aerial parts, fruits, and leaves, have been used for medicine and human nutrition. Its edible leaves possess an aromatic odor and pungent taste. Over the past three decades, P. sarmentosum has gained increasing research interest to assess its medicinal value in treating human health issues [2]. Furthermore, numerous studies have reported that P. sarmentosum leaves exhibit pharmacological effects, including [3], antitubercular agents [4] and hypoglycemic, antimalarial [5], antimicrobial [6,7], antineoplastic [8], antioxidant [9], neuromuscular blocking [10], antiatherosclerosis [11], and anti-inflammation [12] activities. Several bioactive compounds, including essential oils, steroids, lignans, and flavonoids, have been isolated from P. sarmentosum [2]. The latter has gained increased consumer interest, as the functional hydroxyl group of flavonoids in P. sarmentosum leaves improves the flavor and esthetic quality of the food product. Additionally, it does not impart toxic effects, unlike the synthetic food additives used in food processes [2]. Furthermore, the functional properties of P. sarmentosum as an antimicrobial agent have also been explored in livestock; it modulates the mitigation of ruminal methanogenesis and therefore has the potential to reduce the greenhouse gas emissions [13]. Concurrently, it has been shown that in Piper plants, polyphenols, including quercetin, eugenol, syringic acid, and gallic acid, are physiologically active compounds that increase its antioxidant capacity by shifting antioxidant mechanisms and inhibiting the propagation of lipid peroxidation [14,15,16]. Along with carbohydrate, protein, and fat sources in animal feed, oligomers and polymers of polyphenols are degraded by similar intermediate metabolites in the animal gut, absorbed by cells, and synthesized to animal-derived products, such as milk and meat [16,17,18]. Though a host of nutritional aspects have been widely reviewed, particularly in regard to flavonoids, essential oils, cinnamic acids, and tannins in some perennial plants assessed as alternative feeding resources to cultivated crops and various agro-industry by-products [19,20,21,22,23,24], the studies exploring the influences of P. sarmentosum-derived supplements on animal physiological states are limited due to inconsistencies in the determination of its chemical constituents.
The antimicrobial and antioxidant properties of flavonoids that impact the diets of humans and animals are affected by other water-soluble phenolic compounds and vitamins, such as tannin and ascorbic acid, respectively [25]. Notably, oligomers and polymers of flavonoids are condensed tannins (especially flavanols), while gallic acids are hydrolysable tannins. In addition, regarding the hypoglycemic action shown earlier, P. sarmentosum may interact with gallic acid and ascorbic acid in a model of fructose-mediated protein glycation and oxidation [3,26]. Despite the valuable dietary and therapeutic benefits of P. sarmentosum leaves, the nutritional and pharmacological studies investigating the active components and the type of solvent systems used to prepare or assay various extracts of P. sarmentosum are limited. Therefore, it is necessary to conduct and develop new approaches to quantify these bioactive compounds and their interactions [2,27]. The term “synergistic compounds” originates from the exhibition of synergistic interactions by P. sarmentosum with many bioactive compounds or multiple constituents that can have multiple targets and exert synergistic therapeutic efficacies as mentioned above. Furthermore, a previous study has shown and validated that pre-column high-performance liquid chromatography (HPLC) spiking methods directly detect essential oil, water-soluble phenolic compounds, and water-soluble vitamins in different solvent extracts of P. betle leaves [28]. In that study, the compositions of bioactive compounds extracted using different solvents from powdered P. betle leaves dried in a conventional oven were quantified by a bioanalytical method which employed a reversed-phase HPLC with a diode-array detection (DAD) system. The method successfully identified the chromatograms of tannin (gallic acid), cinnamic acid (caffeic acid, syringic acid, p-coumaric acid, sinapic acid, and ferulic acid), flavonoids (catechin, rutin, myricetin, quercetin, apigenin, and kaempferol), ascorbic acid, and eugenol. Regardless of the improved chromatogram performance, the extrapolation of the current chromatographic condition including the mobile phase, flow rate, injection volume, column temperature, detection wavelength, and minimal analysis time per run to practice is inconsistent, due to a current lack of studies addressing the practical relevance of developed the gradient eluent for the varied flow rate of Piper plant extract. In addition, the drying process used to preserve the plant material is important and can affect the quality and quantity of the plant extract [29]. For example, it has been reported that flavonoid, phenolic, and ascorbic acid contents are altered by different drying treatments, such as sun, shade, oven temperatures of 60 °C, 80 °C, and 100 °C, microwave, and freeze-drying [30]. Therefore, the selection of drying methods should be carefully considered to ensure that the precision and selectivity of the proposed analytical method are sufficient to detect significant changes in the tested plant material. To our best knowledge, a method to quantify tannin, cinnamic acid, flavonoid, vitamin, and essential oil in P. sarmentosum leaves has not been completely devised. In addition, the sample preparation method has not been evaluated. Therefore, this study aimed to develop a simple and reproducible HPLC method for simultaneous identification and quantification of major bioactive compounds and their composition in different solvent extracts of P. sarmentosum leaves subjected to different drying methods. This method was expected to reduce fractional extraction time and adjust the flow rate on the HPLC system. Various drying treatments, i.e., shade drying, sun drying, hot air oven (40, 60, 80, 100 °C), and freeze-drying were tested to confirm the changes in the composition of tannin, cinnamic acid, flavonoid, vitamin, and essential oils in P. sarmentosum leaves. The findings demonstrate that the reversed-phase HPLC-DAD method we developed is efficient for simultaneous identification and quantification of 14 major bioactive compounds (Figure 1), including tannin (gallic acid), flavonoid (catechin, rutin, myricetin, quercetin, apigenin, and kaempferol), cinnamic acid (caffeic, syringic, p-coumaric, ferulic, and sinapic acids), essential oil (eugenol), and vitamin C (ascorbic acid) in methanolic, chloroformic, and hexanoic extracts of P. sarmentosum leaves derived from different cultivation sites and sampling times.

2. Materials and Methods

2.1. Chemicals and Reagents

HPLC-grade solvents, including glacial acetic acid, acetonitrile, methanol, chloroform, and hexane used in the extraction process, were purchased from Labscan (Bangkok, Thailand); the purities of the solvents were above 99%. Tannin (gallic acid), flavonoids (catechin, rutin, myricetin, quercetin, apigenin, and kaempferol), cinnamic acid (caffeic, syringic, p-coumaric, ferulic, and sinapic acid), and essential oil (eugenol) were purchased from Sigma Chemical (purity: >99%, St. Louis, MO, USA). Ascorbic acid, used as a vitamin standard, was purchased from Carlo Erba (purity: >99%, Strada Rivoltana, France). Water for preparation, extraction, and liquid chromatography was prepared using a Milli-Q water purification system (Millipore, Illkirch-Graffenstaden, France).

2.2. Standard Stock Solution, Calibration Standard, and Sample Preparation for Quality Control

The standard stock solution (1 mg/mL) was prepared by dissolving 1 mg each of the external standard of tannin (gallic acid), flavonoid (catechin, rutin, myricetin, quercetin, apigenin, and kaempferol), cinnamic acid (caffeic, syringic, p-coumaric, ferulic, and sinapic acids), essential oil (eugenol), and vitamin (ascorbic acid) in 0.5 mL HPLC-grade methanol. An accurately weighed 1 mg sample of each standard, weighed using a Sartorius QUINTIX224-1S balance (GmbH & Co. KG, Gottingen, Germany), was gently added into a 2 mL safe-lock Eppendorf tube (tare was used to exclude the tube’s weight) in identical calibrated time. The balance was capable of measuring to the nearest 0.0001 g or 0.1 mg. The standard solutions were then sonicated with the following settings—low (L) power output, 15 min ON/5 s OFF pulses, and 4 °C water bath with floating ice. The standard stock solutions were subsequently adjusted to 1 mL with the mobile phase solution (1:9, HPLC-grade acetonitrile: 1% acetic acid) and vortexed for 60 s. From these standard stock solutions, a working solution containing adequate concentrations or dilutions of either single analyte or all the analytes (14 compounds) in HPLC-grade methanol was freshly prepared when needed.
Calibration standards at six concentrations (5, 10, 20, 30, 40, and 60 µg/mL) of tannin, flavonoid, cinnamic acid, essential oil, and vitamin was obtained by appropriate dilutions of working stock solution in the mobile phase (1:9, HPLC-grade acetonitrile: 1% acetic acid).
Quality control samples were prepared in the mobile phase (1:9, HPLC-grade acetonitrile: 1% acetic acid) at three concentrations (20, 40, and 60 µg/mL). All solutions were stored in 2 mL Autosampler HPLC Vials Pres lit Caps in the dark at 4 °C.

2.3. Chromatographic Conditions

Liquid chromatography was performed using an HPLC system (Agilent Technologies 1260 Infinity, Santa Clara, CA, USA). The HPLC system included four solvent delivery system quaternary pumps (61311 B), a DAD (DAD 61315D), a 10 mm flow cell, and an automatic sample injection valve equipped with a 100 µL loop. Data integrity and chromatography data analysis were performed using an Agilent OpenLAB CDS 1.8.1 system manager.
The chromatographic separation was achieved using a reversed-phase Zorbax SB-C18 column (3.5 µm particle size, i.d. 4.6 mm × 250 mm, Agilent Technologies, Santa Clara, CA, USA) operated at 28 °C for 65 min. The mobile phase was comprised of HPLC-grade acetonitrile and 1% acetic acid (1:9). A flow rate of 0.9 mL/min using a binary gradient consisting of (A) acetonitrile and (B) 1% acetic acid was employed to achieve chromatographic separation. The gradient elution system was as follows: 10–40% A (0–28 min), 40–60% A (28–39 min), 60–90% A (39–50 min), and 90–10% (50–65 min). The injected volume was maintained at 20 μL. The absorption of analyzed and quantified compounds was investigated using a photodiode array UV detector set at 272, 280, and 310 nm. In this study, 14 standards of tannin, flavonoid, cinnamic acid, essential oil, and ascorbic acid were successfully combined and used for analysis within 65 min. A preliminary injection of 20 μL of working solution containing adequate concentrations or dilutions of a single analyte of each standard (14 standards; n = 5) was conducted to compare their retention time, and their identification was confirmed by the standard addition method. Once each standard was successfully recognized, a subsequent injection of 20 μL of calibration standards (5, 10, 20, 30, 40, and 60 µg/mL) of each standard (n = 20) was performed. The identified tannin, flavonoid, cinnamic acid, essential oil, and ascorbic acid were quantified according to the respective standard calibration curves (hereafter referred to as external standard calibration curves).
Tannin, flavonoid, cinnamic acid, essential oil, and ascorbic acid in commercial and non-commercial P. sarmentosum leaves from all regions of Thailand (except Bangkok), were identified by comparing their retention times, spiked performance, and UV–VIS spectra with those received by injection of the standard solution under similar conditions. The overlapping area of each compound was revised by performing manual integration of the peak area. Peak area was used for quantitation purposes (dilution included), using a respective external standard calibration curve. Values were reported as mg/g on dry weight basis.

2.4. Plant Material

Plant samples were divided in two groups: commercial P. sarmentosum leaves (CSL) and non-commercial P. sarmentosum leaves (NSL). CSL were purchased from local markets in Northern (Chiang Rai), Western (Phetchaburi), Eastern (Prachinburi), and Southern (Songkhla), Thailand. CSL were kept in cooled bags while being transported to the laboratory. NSL were cultivated at two different sites: the Suranaree University of Technology Organic Farm (14°52′48″ N, 102°00′54″ E at an elevation of 243 m above sea level) and the mini garden near the Goat and Sheep Research Center (14°52′48.3″ N, 102°00′17.8″ E at an elevation of 243 m above sea level), Nakhon Ratchasima (Northeastern), Thailand. CSL and NSL samples were collected freshly for three consecutive months (April–July 2019). After separating the flowers, leaves were rinsed, blanched with steam at 90 °C for 1 min, and kept at −20 °C until further analysis.

2.5. Drying Method and Color Measurement

CSL and NSL samples were dried using one of the following methods: shade temperature, sun drying, hot air drying, and freeze-drying. Shade drying was conducted using a tray with a layer thickness of approximately 0.2 cm and leaves were dried in the shade at ambient laboratory conditions (26 °C for 96 h). Sun drying was performed using a tray of similar layer thickness and dried in direct sunlight at temperatures between 30 °C and 36 °C for 8 h. Hot air drying was conducted in a hot air convection oven (Memmert GmbH + Co. KG, ULM600, Schwabach, Germany) at four different drying temperatures (40, 60, 80, and 100 °C). Freeze-drying was performed using a Lyophilizer (GAMMA 2–16 LSC, CHRiST, Osterode am Harz, Germany). The plant samples were frozen in −80 °C for 24 h and dried under a vacuum with the condenser temperature set at −15 °C for 24 h.
The color of the plant samples was measured by a Chroma Meter (CR 300, Minolta Corp., Osaka, Japan) before and after drying. Color was expressed in CIE L* (whiteness or brightness), a* (redness/greenness), and b* (yellowness/blueness) coordinates, standard illuminant D65 and 2° observer optical position. Ten replicate measurements were obtained and averaged. The color brightness, L* values ranged from zero (black) to 100 (white). The values of the chromaticity coordinates a* and b* were determined according to Arslan and Özcan [31] guidelines.

2.6. Plant Sample Preparation

The dried leaves were homogenized and powdered using a Retsch mill (Retsch SM 100 mill, Haan, Germany) with a mesh size of 1 mm. Leaf powders were filled in sealed plastic bags and kept in a vacuum desiccator at 25 °C with 34% humidity until further use.
A Soxhlet extraction apparatus was employed to extract tannin, flavonoid, cinnamic acid, essential oil, and vitamin assayed in methanol, chloroform, and hexane. Briefly, for methanol extraction, 5 g of dried leaf powder was extracted with 20 mL methanol using the Soxhlet apparatus for 3–4 h, and then plant extracts (PE) were collected. These Soxhlet procedures were repeated three times, and all PEs were combined. The collected PE was subsequently evaporated using a Rotavapor (Buchi R300, Flawil, Switzerland). The PE was filtered through a 0.45 μm Polyvinylidene difluoride (PVDF) syringe filter (Merck, Germany) and decanted into a volumetry flask. The volume of collected PE was made up to 10 mL with the respective solvents used, and it was stored at −20 °C for subsequent liquid chromatography analysis. PEs using the chloroform and hexane were extracted following the same procedures. For extraction from fresh material, fresh leaves were chopped into small pieces and milled into a semi-paste with a kitchen blender (Le Cuisson SX-999, Guangdong, China). The extraction, filtration, and collection steps were the same as those of dried material extraction. On the working day, collected PEs were evaporated to obtain a dry residue. One milligram of dry residue was dissolved in 0.5 mL of the mobile phase solution (1:9, HPLC-grade acetonitrile:1% acetic acid), vortexed for 60 s, filtered through a 0.45 μm Polyvinylidene difluoride (PVDF) syringe filter, and 20 μL (n = 20) injected into the HPLC-DAD system. The remaining dry residue was prepared to determine the dry weight (n = 5) [32].

2.7. Method Validation

Method validation was assessed based on the International Council for Harmonisation of Technical Requirements for Pharmaceuticals for Human Use guidelines, including the effectiveness, LOD (limit of detection), LOQ (limit of quantification), linearity, precision, and accuracy. These parameters were validated in the absorbed UV–VIS detection wavelength at 272, 280, and 310 nm.
The effectiveness of the HPLC method was confirmed by examining the detection of the standard peak after the calibration standard was diluted using gradient eluent. Acetonitrile and 1% acetic acid resolved well in this study, showing separated peaks identifying the 14 synergistic compounds. The LOD and LOQ were calculated from the calibration curve according to Equations (1) and (2).
LOD =   standard   deviation   of   calibration   curve   angular   coefficient   in   linear   regression   ×   3.3
LOQ = standard   deviation   of   calibration   curve   angular   coefficient   in   linear   regression   ×   10
Linearity was obtained after receiving a peak of external standard at six concentrations (5, 10, 20, 30, 40, and 60 µg/mL), injected 20 times simultaneously at an automatic sample injection valve temperature of 19–20 ± 1.0 °C. Appropriate dilutions of these standard stock solutions were included, and the means of these received peak areas were averaged to obtain a plotted linear regression.
To assess the repeatability and reproducibility of the developed method, precision was evaluated using intra- and inter-day variability measurements. Intra- and inter-day precision values were expressed as the percentage of relative standard deviation (%RSD) of retention time and peak area. The precision evaluation was run at intermediate concentrations (20, 40, and 60 µg/mL) for 10 consecutive runs.
To determine the accuracy of the developed method, a recovery experiment was performed. However, it is acknowledged that the estimation of the recovery is only an approximation due to the lack of a blank matrix. To improve the accuracy of the method, three concentrations (20, 40, and 60 µg/mL) of the 14 synergistic compounds identified in the extracts were prepared and added to P. sarmentosum extracts (PEs) and incubated at room temperature (26–27 °C) for 24 h. Then, the samples were prepared as described in “Plant Sample Preparation”. The extracts were then analyzed using the HPLC-DAD method as described, and each run was repeated 10 times. Accuracy was expressed as the percentage of recovery (%R) from the average value of the spiked samples, calculated using following the equation:
% R = ( amount   of   standard   detected )   ( amount   of   nominal   standard   added )   ×   100

2.8. Statistical Analysis

Cluster analysis (color measurement and drying method) and calculation of total tannin, flavonoid, cinnamic acid, essential oil, and vitamin in plant samples cultivated in two sites and sampled at three different times were processed with a completely randomized design with repeated measures, using GraphPad Prism 9.0 (GraphPad Software, Inc., San Diego, CA, USA). Akaike’s information criterion of the mixed effects model of GraphPad Prism was used to fit the covariance structure of the compound symmetry. Data were checked for normal distribution using the Kolmogorov–Smirnov test. Least-square means were reported, and significance was declared by Tukey’s honestly significant difference (HSD) at p < 0.05 [33].

3. Results and Discussion

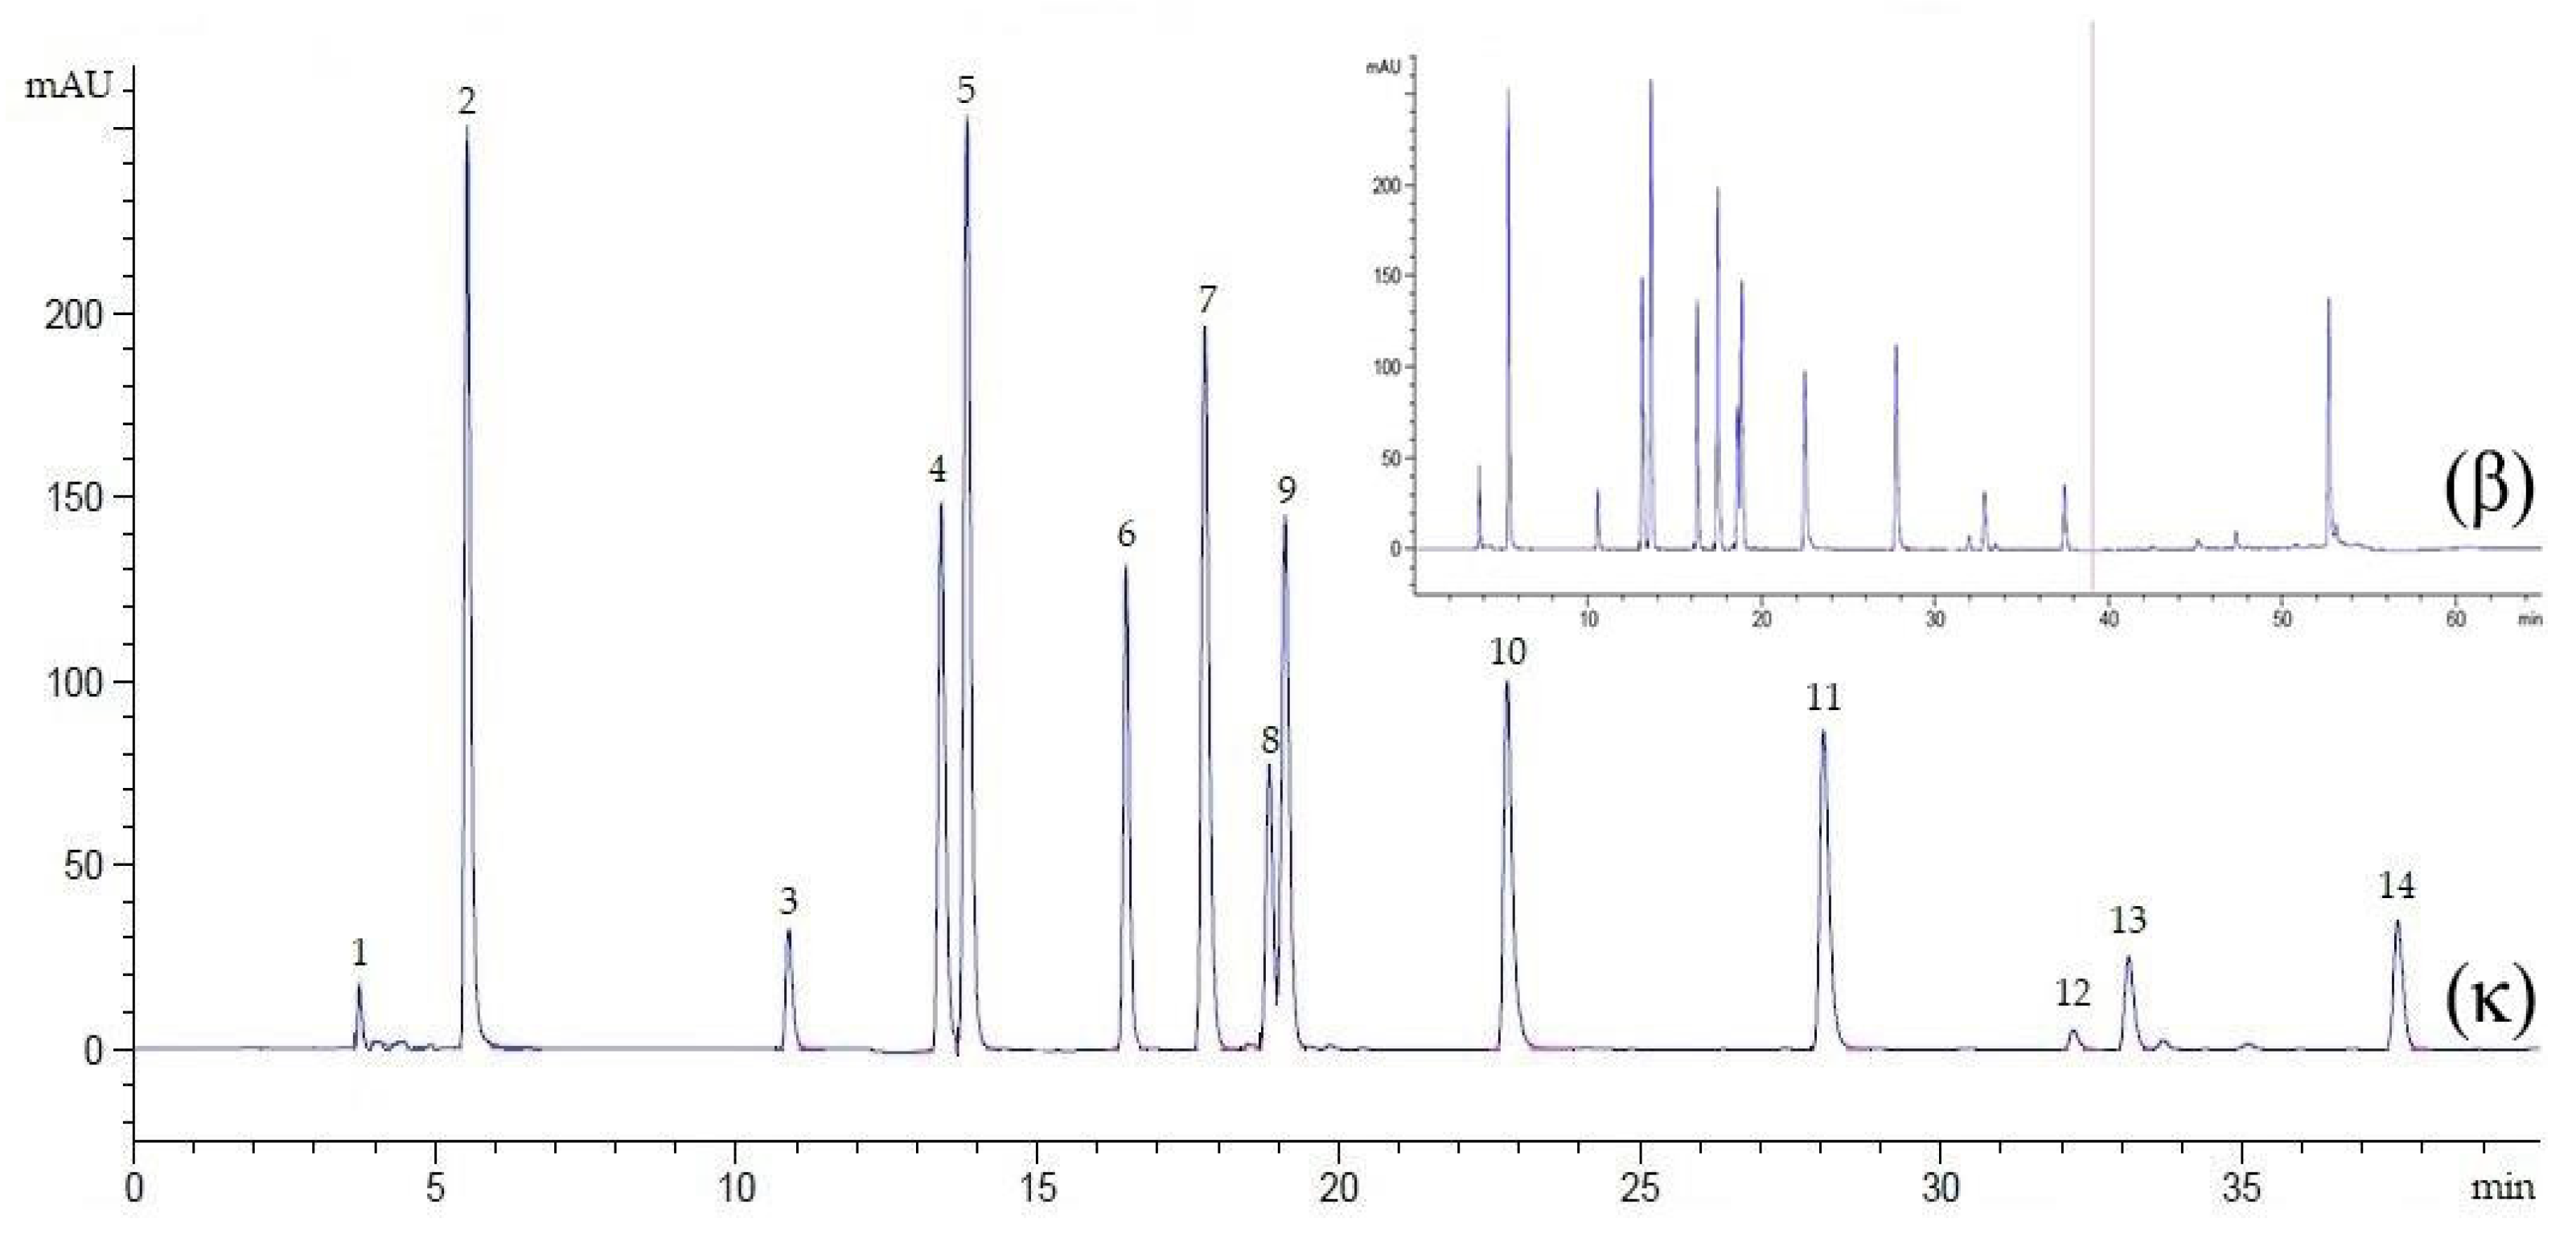
3.1. Optimization of Chromatographic Condition

In reversed-phase liquid chromatography, optimization of clear separation by setting the conditions of the gradient elution is crucial because each separated compound elutes from the column at a different mobile phase composition [34]. In this study, the chromatographic conditions were optimized, including the mobile phase, flow rate, injection volume, column temperature, detection wavelength, and minimal analysis time per run. Regarding the use of a suitable mobile phase solution (1:9, HPLC-grade acetonitrile: 1% acetic acid), this study identified the peaks in all three detection wavelengths (272, 280, and 310 nm). However, the well-separated peaks of the external standards of tannin, flavonoid, cinnamic acid, essential oil, and ascorbic acid were only depicted with an improved gradient time at 272 nm (Figure 2). This indicated that the gradient eluent using acetonitrile was suitable for applications requiring low UV detection wavelengths. This inference is supported by previous studies, which have reported that though methanol and acetonitrile are commonly used for modifying reversed-phase chromatography, acetonitrile is more favorable as it performs at a lower UV cut-off than methanol [28,35]. Taken together, it can be inferred that shorter analyte retention can be achieved from acetonitrile interference. Of note, in previous studies, combinations of acetonitrile and acetic acid have been used, which suggests that using acetic acid provides the most efficient separation for phenolic compounds in a shorter run time (45–60 min) [28,36]. In this study, the total chromatographic run time was determined by injecting the standard solution containing all external standards. The chromatogram revealed that the complete separation of all the biomolecules studied here was achieved at 39 min. The gradient time was assigned to use two and three segments for removing co-elution among the compounds. The first gradient step (0–40% in acetonitrile) allowed the elution of ascorbic acid, cinnamic acid, and some flavonoids (including quercetin). The second gradient step (0–60% in acetonitrile) allowed the elution of the remaining flavonoids (apigenin and kaempferol) and eugenol as the last compound of interest. The time required to detect the last compound was achieved at 39 min, indicating that the third gradient step was arbitrarily set for 11 min (39–50 min). The run was continued for an additional 15 min to restore the column and prepare for a new chromatographic run (conditioning step). In general, re-equilibration could be made shorter than 15 min by increasing the flow rate during equilibration; however, this is dependent on the column dimension used. Relative to a previous study [36], wherein three segments in gradient steps were used to determine quercetin after running the gradient elution system in solvent (50–100%) B (consisting of 20% of acetic acid and 80% acetonitrile) for 45 min, in the current method, the distinct peak and good resolution of quercetin were detected in a shorter time (27.64–28.49 min) wherein the gradient eluent system was run in solvent (40–60%) A (acetonitrile without mixed by acetic acid). It was thus verified that using acetic acid as a weak eluting solvent at the start of the chromatographic run and gradually increasing proportions of acetonitrile as a strong eluting solvent over the course of the separation allows improved resolution of the poorly retained solutes at the beginning of the separation, while the more strongly retained solutes are eluted within a shorter time [37]. Overall, the achievement of distinct resolution of the compounds confirmed the simplicity of the developed method for the determination of the above-mentioned compounds.

3.2. HPLC Method Validation

To obtain consistent, reliable, and accurate data, the external influences, including the performances and limitations of the current method, were assessed and validated. The first HPLC method validation parameters, including calibration curve, selectivity, linearity, and limit of detection (LOD) and quantification (LOQ), are shown in Table 1. The calibration curves were obtained by constructing six points of peak detection for each compound. Calibration curves were linear over the studied concentration range. The coefficients of determination (R2) of all compounds were >0.9992, suggesting a proper fit of the tannin, flavonoid, cinnamic acid, essential oil, and ascorbic acid curves to the model, within the range in previous investigations [38]. Furthermore, the LOD and LOQ were within the acceptable range, with LOD values ranging from 0.026 to 0.789 μg/mL and LOQ values ranging from 0.078 to 2.392 μg/mL (Table 1). These values are higher than those obtained by other researchers for tannin, flavonoid, cinnamic acid, essential oil, and ascorbic acid in Piper plants [28], but within the range observed in other polyphenol studies [39]. The present LOD and LOQ are established against the previous report [28]. The flow rate of the mobile phase from 0.7 to 0.9 mL/min increasing LOD from 10 to 1000 times is improbable, because the dilution rate of the sample by the mobile phase flow is only 2.14 times greater. The reason for such a large difference remains unclear, and further observation is required. Therefore, it appears that a lower flow rate in the HPLC system may be more conducive to linearity and sensitivity. Taken together, these results indicate that the developed method satisfied the linearity and sensitivity criteria to analyze these compounds in P. sarmentosum leaves.
Other method validation, precision, and accuracy parameters are summarized in Table 2. The intra- and inter-day precisions of this methodology were determined based on the retention time and the average concentrations (10 consecutive runs) of external tannin, flavonoid, cinnamic acid, essential oil, and ascorbic acid standards, and expressed as the percentage of relative standard deviation (%RSD) of retention time and spiking peak area at three selected concentrations of the standards (20, 40, and 60 μg/mL). The average retention time and concentration values obtained in this study were below 1% and 2%, respectively. These results suggest the developed method is sufficiently reliable and highly precise for the analysis of tannin, flavonoids, cinnamic acid, essential oil, and ascorbic acid in P. sarmentosum leaves. The %RSD values obtained here agree with those of other studies that have validated the analytical methodology for simultaneous detection of phytochemicals and micronutrients [28,36,40]. Furthermore, the accuracy of this methodology was expressed as the recovery of standard compounds added to the pre-analyzed sample or before extraction. The recovery of tannin, flavonoids, cinnamic acid, essential oil, and ascorbic acid from P. sarmentosum leaves ranged from 97.28 to 101.55%, 97.15 to 101.40%, and 96.27 to 101.16% relative to those of 20, 40, and 60 μg/mL standards, respectively (Table 2). These values were consistent with those reported in other studies in which these compounds were quantified by spiking P. betle leaf extracts [28] and other polyphenols [36,39] with external standards. These values suggested that the external standards in P. sarmentosum leaves behaved similarly to those in the P. betle leaves, which showed a range of recovery between 96% to 102%, indicating that the current method is acceptable for the quantitation of these compounds, particularly in the study of other Piper plants.

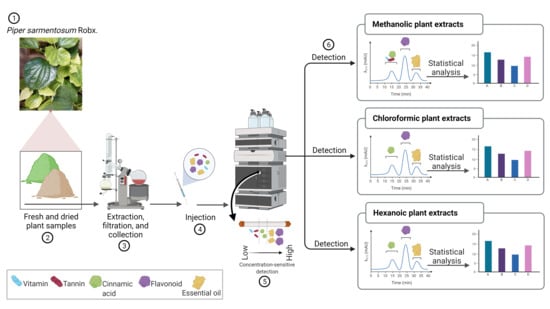
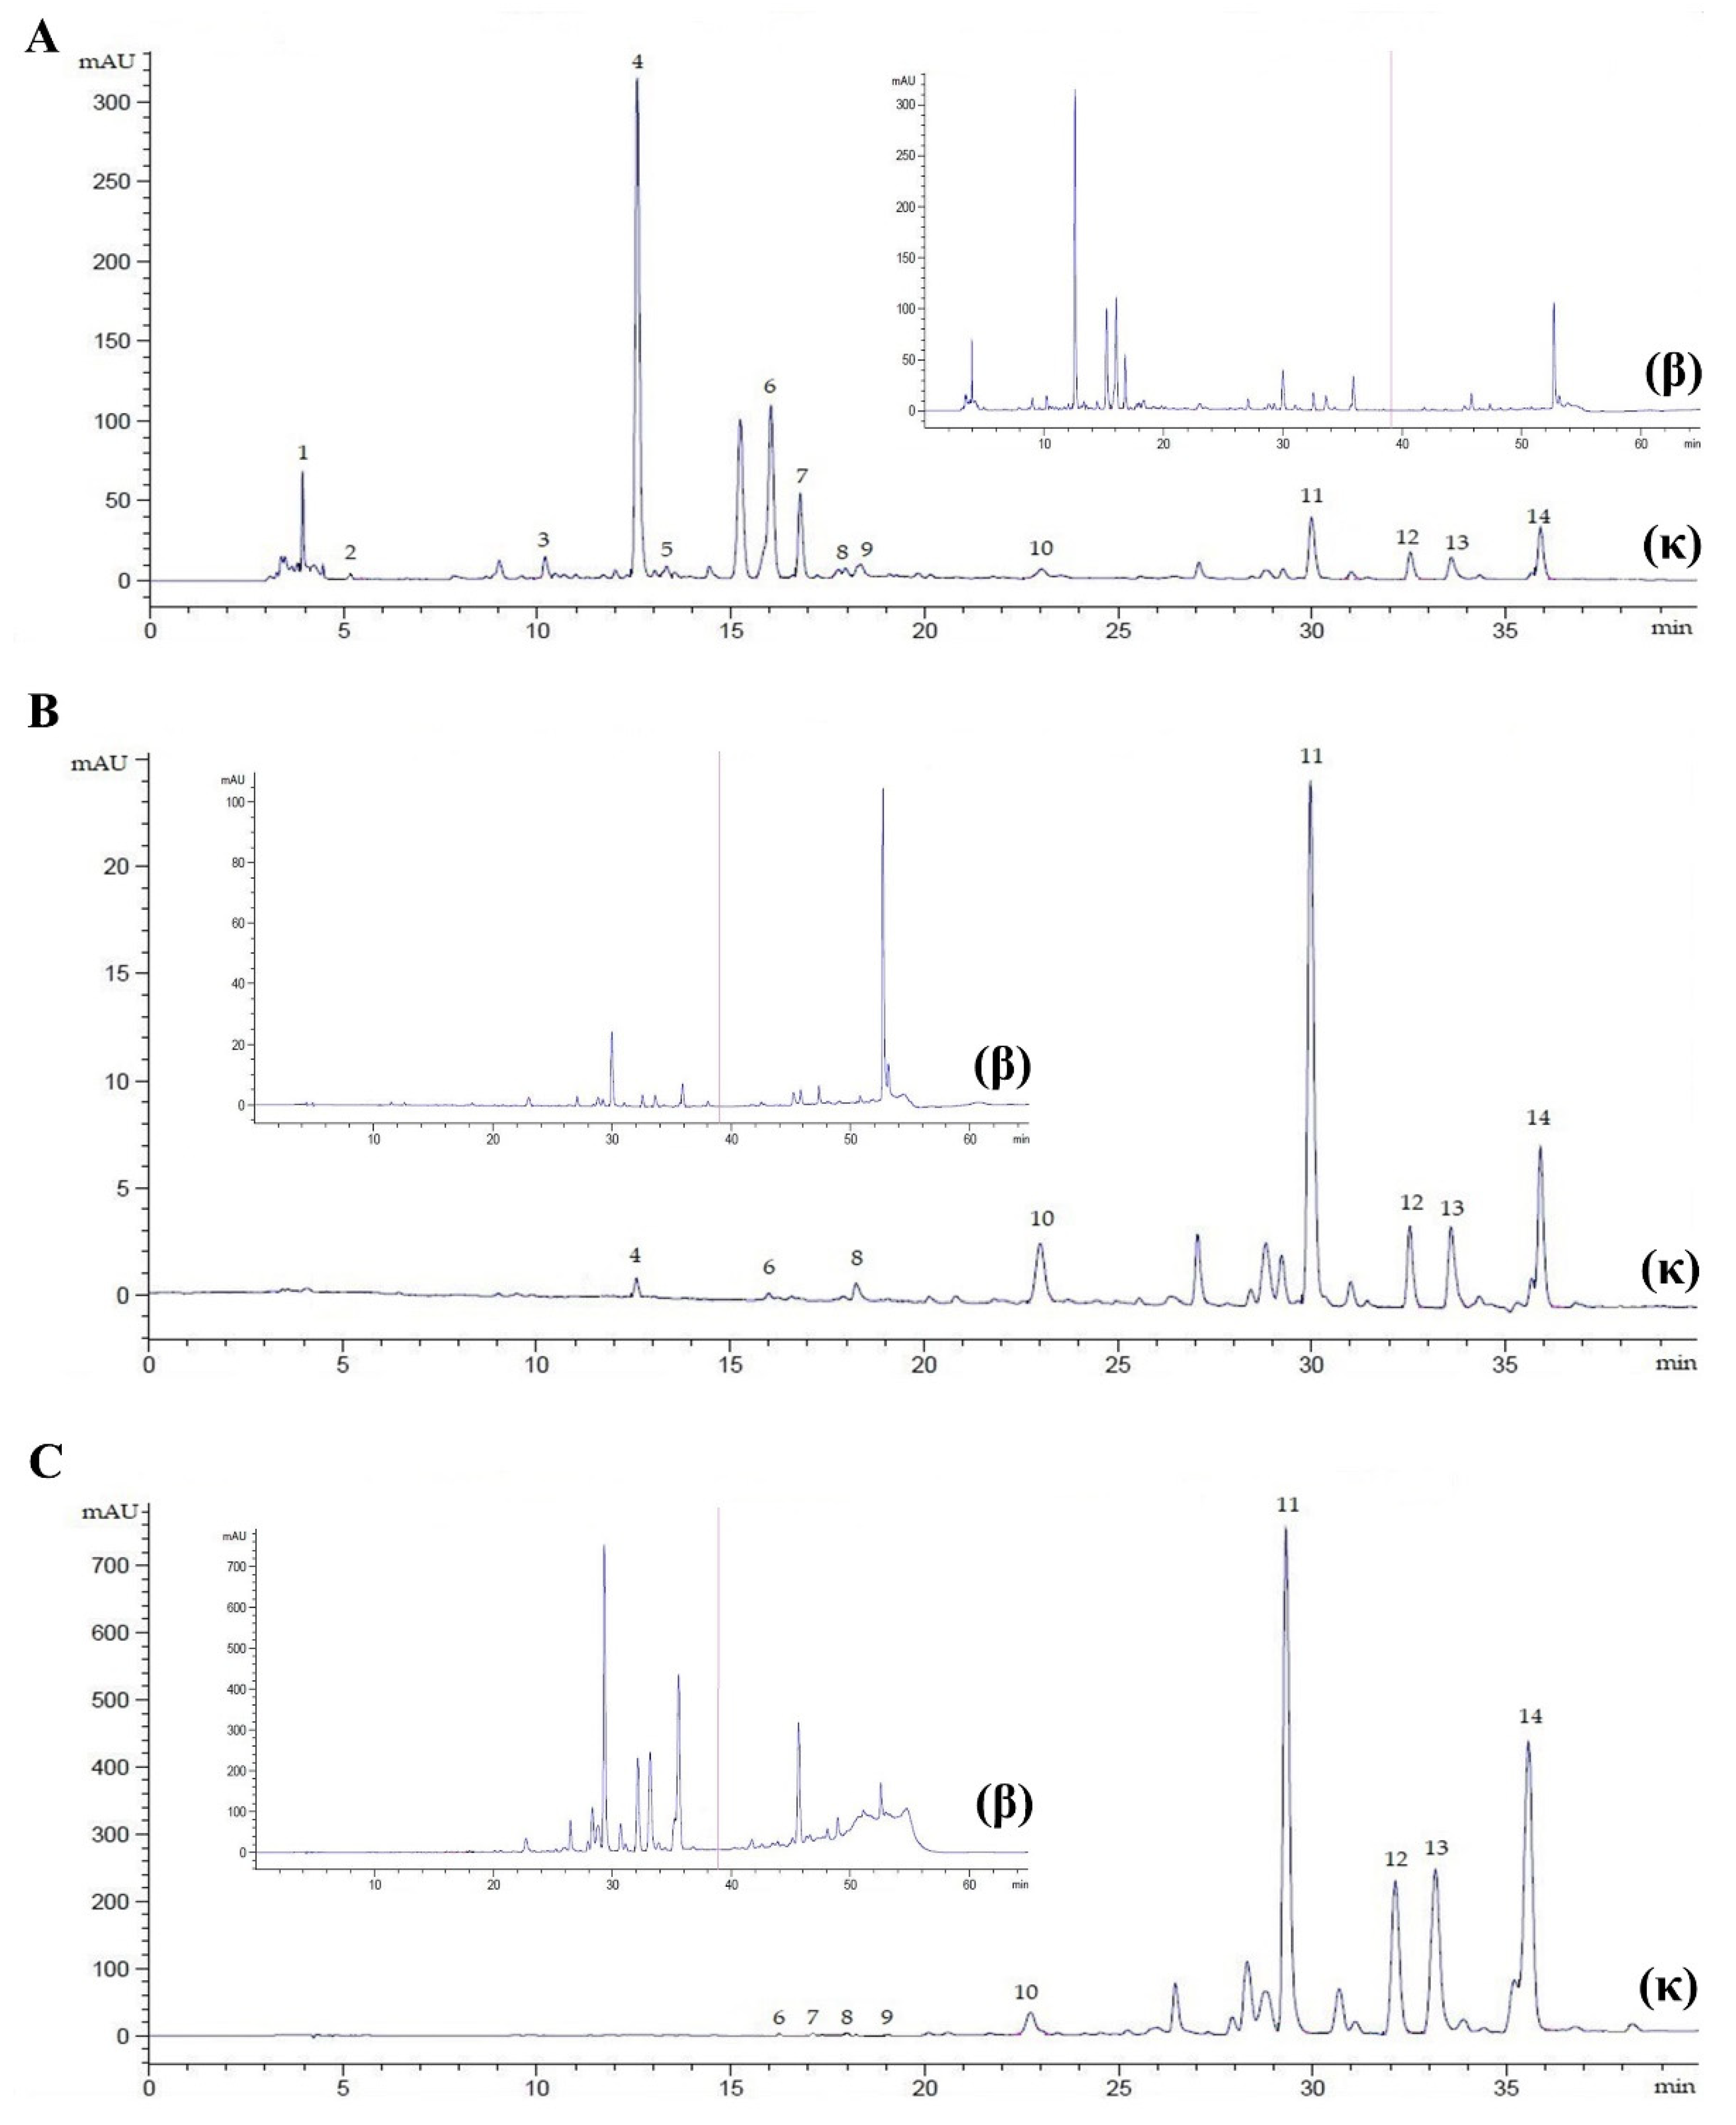
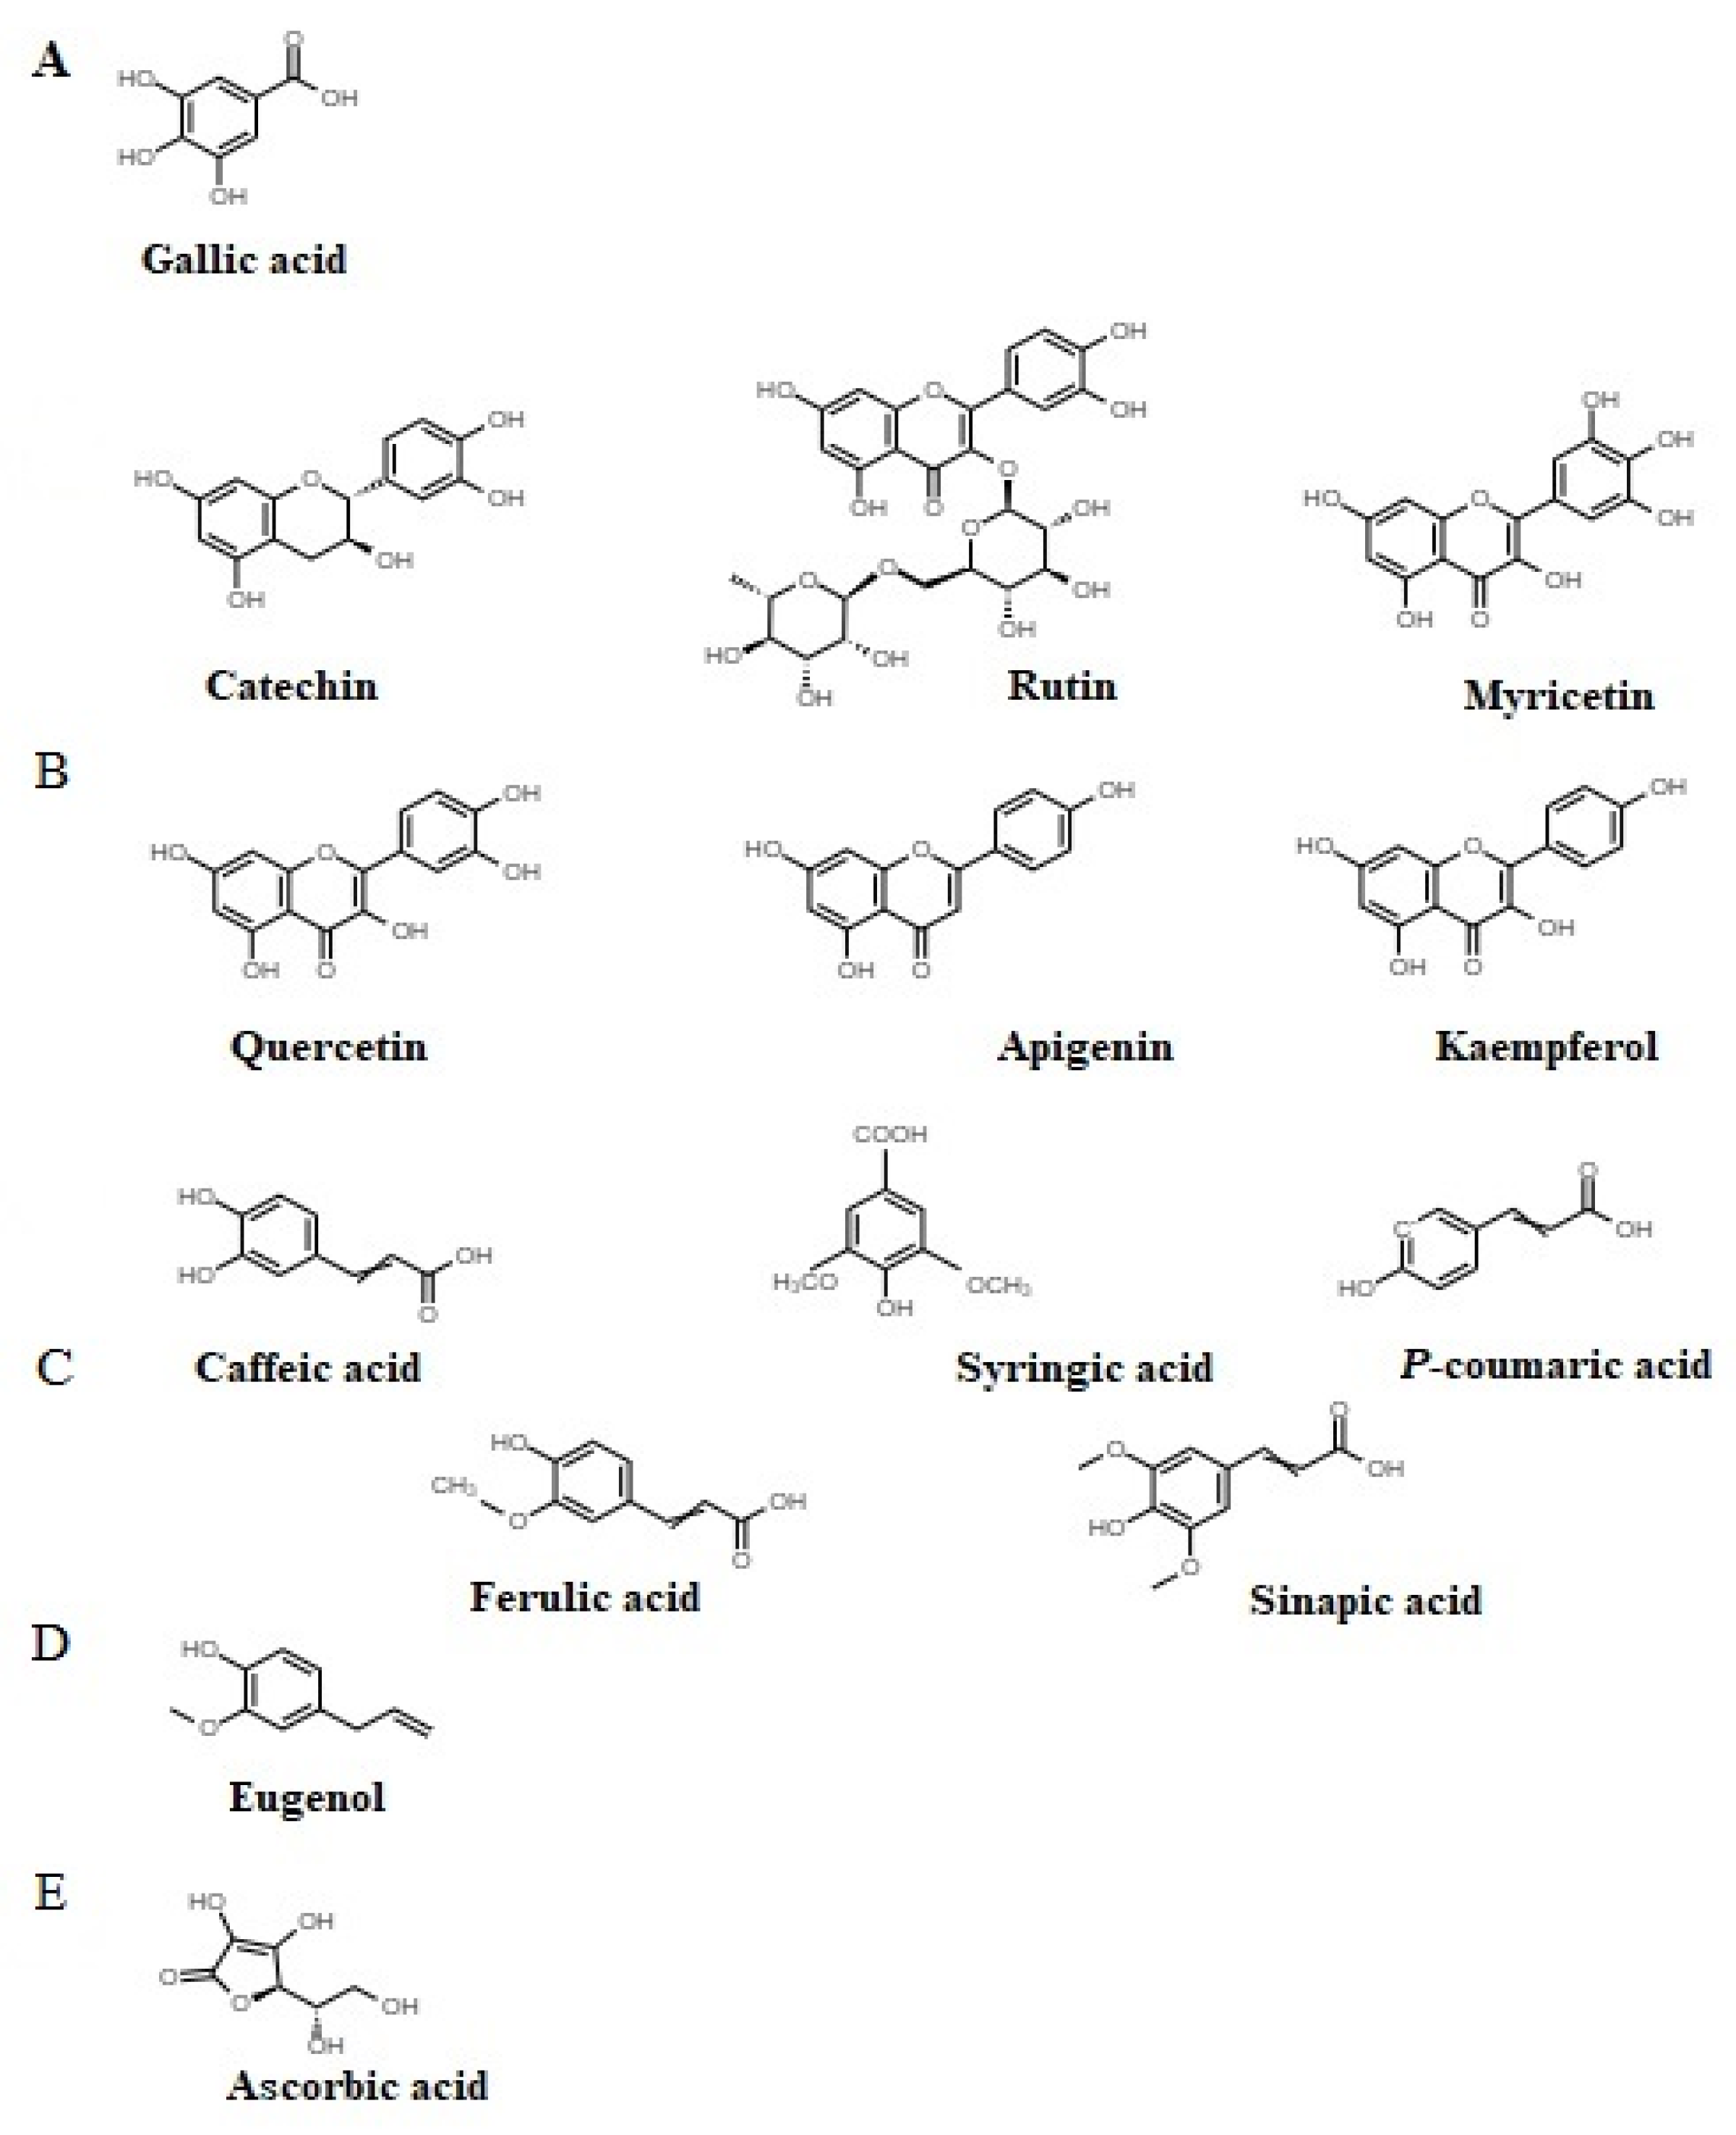
3.3. Selection of Extraction Procedure and Method Applicability: Identification and Quantification of Tannin, Flavonoids, Cinnamic Acid, Essential Oil, and Ascorbic Acid

Many sophisticated techniques, including maceration, supercritical fluid extraction, subcritical water extraction, ultrasound-assisted extraction, and Soxhlet extraction, have been reported as means of investigating the chemical constituents of P. sarmentosum. It has been reported that extraction yield and susceptibility in reversed-phase liquid chromatography are not only dependent on the extraction method but also on the solvent used for extraction [41]. In the present method, Soxhlet extraction was employed to extract P. sarmentosum in methanolic, chloroformic, and hexanoic solvents. We found that methanolic plant extract (PE) improved the resolution of the separated peak area and the consistency of detected retention time, compared to the chloroformic and hexanoic extracts (Figure 3). These chromatograms indicate that polar solvents used in plant extraction could have a key role in the recovery of phytochemicals from plant matrices. Although this study did not observe the efficiency of yield extraction, as shown in previous studies, it could be concluded that methanol is the most effective solvent for the extraction of low-molecular-weight phytochemical constituents compared with ethanol, chloroform, dichloromethane, acetone, and hexane [23,28,42,43]. Phytochemical constituents of P. sarmentosum leaves have complex polarity, covering both polar and non-polar compounds. Methanol is commonly used as an organic eluent with polar and non-polar substances. In addition, methanol has a boiling point lower than hexane, which is slightly higher than chloroform. However, chloroform is a non-polar solvent. Therefore, the lower boiling point and wide polarity of methanol could impart powerful attractions for individual bioactive molecules of P. sarmentosum leaves, enabling easier elution of the phytochemicals to methanol than the other solvents used.
This study determined that methanolic plant extracts (PEs), both in commercial P. sarmentosum leaves (CSL) and non-commercial P. sarmentosum leaves (NSL), had the highest contents of fourteen synergistic compounds compared to the chloroformic and hexanoic extracts (Table 3). Despite the difference in cultivation sites and times of sampling, the total contents of tannin, flavonoids, cinnamic acid, essential oil, and vitamin C in CLS and NSL were found to be similar (p > 0.05, Table 4). This result was similar to those of previous studies [3,6,8] and consistent with the type of solvent used. In the present study, flavonoids were identified as the dominant phytochemicals in P. sarmentosum leaves, followed by essential oil, cinnamic acid, ascorbic acid, and tannin. Apigenin was the most abundant naturally occurring phytochemical among the flavonoids (44.48%), followed by kaempferol (27.50%), and quercetin (12.11%). Over the last decades, only one study quantifying apigenin, kaempferol, and quercetin under simultaneous chromatogram sample detection has been reported [44]. Our results showed a higher concentration of apigenin, but a lower concentration of quercetin compared with that observed earlier, where the signal at the retention time of kaempferol in the previous study was below the detection limit. The probable reason for these differences could be the sampling scheme. Aside from the difference of cultivar location, in this study we only extracted and estimated apigenin, kaempferol, and quercetin contents in leaves, whereas Miean and Mohamed [44] analyzed the whole plant. In addition, we used a column separation with a smaller particle detection (3.5 μm particle size) than that used by Miean and Mohamed [44]. Column length defines the performance of column back pressure, and particle size of the stationary phase plays a substantial role in separation efficiency. A smaller particle column improved the speed and resolution in the HPLC technique [45]. Optimal separation by setting small particles is an acceptable alternative for developing chromatographic performance; thereby, small particles could be used to run fast and ultra-fast analyses to give lower plate height values, and accordingly higher efficiency [46]. This occurs due to the low mass transfer resistance at higher linear velocities, and over a wider range of linear velocities [47]. However, a higher column efficiency might be perpetuated with short columns and a high flow rate [48]. Using smaller particle stationary phases in this study benefited the boost speed and PE chromatographic performance. Therefore, our method enhanced precision and accuracy in determining flavonoids by using smaller particle sizes in column separation; however, the above effect was dependent on the target site of sampling plant material.
In contrast, our results differed from prior findings [49], where flavonoids amurensin (an acyl-substituted flavonoid glucoside), hesperidin, and didymin were identified after methanolic PEs of P. sarmentosum leaves were subjected to a liquid chromatography—mass spectrometry (LCMS) UHPLC system. The aglycone forms (myricetin, quercetin, apigenin, kaempferol) of these are usually found in intact tissues in the glycosylated form. As mentioned above, the series of extractions in the present study emphasized the extraction of the aglycones, especially with chloroform and hexane, but the methanol extracts contained more of the glycosylated forms. As shown in Figure 3A, we acknowledge that one large peak at retention time 15.2 min was not identified. The data reported here, together with those from the previous report [49], suggest that this large peak at retention time 15.2 min could be amurensin. It need not be stated that the current study does not provide an external standard of amurensin, and future studies are required to test the hypothesis of whether amurensin could be simultaneously determined in a distinct peak together with other aglycone forms (myricetin, quercetin, apigenin, kaempferol).
Some of the major phytochemical constituents in Piper plants are the essential oils, and in P. sarmentosum, they are constituted from monoterpenes, sesquiterpenes, phenylpropanoids, alkane, diterpenoids, and terpenoid [2]. Other substances that have been identified in these aromatic and volatile oils include sarmentosine, sarmentine, piperine, and pellitorine [49,50]. Our results suggested that P. sarmentosum leaves have a terpenoid group, likely eugenol, in all solvent extracts. Its content was highest in the hexane extract, followed by the methanol chloroform extract, which agreed with earlier reports [51,52]. To date, our study was the first investigation to quantify eugenol from P. sarmentosum leaves using the liquid chromatographic principle. Previously, only a single study has reported the eugenol content of P. sarmentosum leaves using a gas chromatography approach [53]. However, we could not compare the results due to the differences in basal samples and calculation methods. Our sample used crude extracts assayed in a variety of solvents, and determined eugenol content based on the obtained calculation using the respective external standard calibration curves, whereas Chieng et al. [53] had formed basal sampling as oil-extracted shift, and determined eugenol content by comparing the Kovats retention indices obtained in their study with literature values. These results suggest that the present methodology is more robust for determining complex plant matrices. Based on these results, it can be inferred that the method of our investigation could be reproduced to determine essential oil in P. sarmentosum leaves with distinct peaks and excellent resolution.
Furthermore, the content of cinnamic acid in P. sarmentosum leaves was comparable to that of the essential oils (Table 3). The P. sarmentosum leaves contained 0.24 mg/g caffeic acid, 0.02 mg/g syringic acid, 0.08 mg/g p-coumaric, 0.05 mg/g sinapic acid, and 0.03 mg/g ferulic acid. Our results showed that caffeic acid was richer in the methanolic assay than in the chloroformic and hexanoic assays. In an earlier study, caffeic acid in P. sarmentosum leaves was identified and quantified by HPLC with the absorbance wavelength set at 280 nm. The samples were extracted using methanol following maceration; however, the maceration time was not mentioned clearly [54]. Nevertheless, caffeic acid failed to be determined during the chromatogram period. It can be inferred that extraction procedures such as maceration or Soxhlet extraction may lead to a failure of caffeic acid detection. This could be attributed to the chromatographic performance; the signal at its retention time was probably below the detection limit. It could be concluded that the absorbance wavelength set at 280 nm was slightly too high to detect the caffeic acid signal, which agrees with the present finding. Among the three different wavelengths of 272, 280, and 310 nm, the photodiode array UV detector was most efficient at 272 nm. Thus, a more appropriate measuring instrument to reliably detect caffeic acid would be one with an absorbance wavelength of 272 nm. Furthermore, our method was able to achieve more precision and accuracy when determining cinnamic acid and caffeic acid in P. sarmentosum leaves.
Interestingly, gallic acid and ascorbic acid were found in methanolic extracts. However, these compounds were minor naturally occurring phytochemicals in P. sarmentosum leaves (Table 3). As gallic acid is an antioxidant and hypoglycemic agent, P. sarmentosum may interact with it along with ascorbic acid in a model of fructose-mediated protein glycation and oxidation [26]. Our findings provide compelling evidence that P. sarmentosum contains an abundance of hydrolysable tannin (gallic acid) and vitamin C (ascorbic acid), while earlier studies have rarely determined these compounds. It is speculated that P. sarmentosum leaves containing ascorbic acid could function as a promotor to exert antioxidant activity. In this study, ascorbic acid was determined in the methanolic assay (0.38 mg/g), as reported by previous studies [3,55]. Furthermore, few studies have reported determining the tannin content of P. sarmentosum leaves using either liquid chromatography or a conventional AOAC technique. For instance, Chanwitheesuk et al. [3], using the Folin–Denis reagent, estimated the total tannin content to be 17.7% of total phenolic content. More recently, Rahman et al. [54] employed an HPLC method with a flow rate of 1.0 mL/min through the HPLC analytical column (5 μm particle size) using eluent consisting of 1% trifluoroacetic acid and methanol for 80 min, and the estimated gallic acid concentration was 0.02 mg/g assayed in methanol. Our method yielded a higher concentration (~7-fold) of gallic acid (0.14 mg/g) and required a lower flow rate (0.9 mL/min) and a shorter run time (65 min). Herein, despite using a smaller particle stationary phase (3.5 μm particle size) and acetonitrile as an eluent, the chromatogram performance improved; the findings suggest that the gradient eluent plays a key role in the efficiency of gallic acid detection and the enhanced content of gallic acid. Studies have shown the influence of gradient elution using increased acetonitrile and flow rate modification [56,57]. Increasing flow rate can lead to faster elution of analytes, whereas decreasing flow rate results in better resolution and improved concentration-sensitive detection. Therefore, the findings obtained in this study represent a suitable technique for optimization of separation by optimizing the conditions of gradient elution.

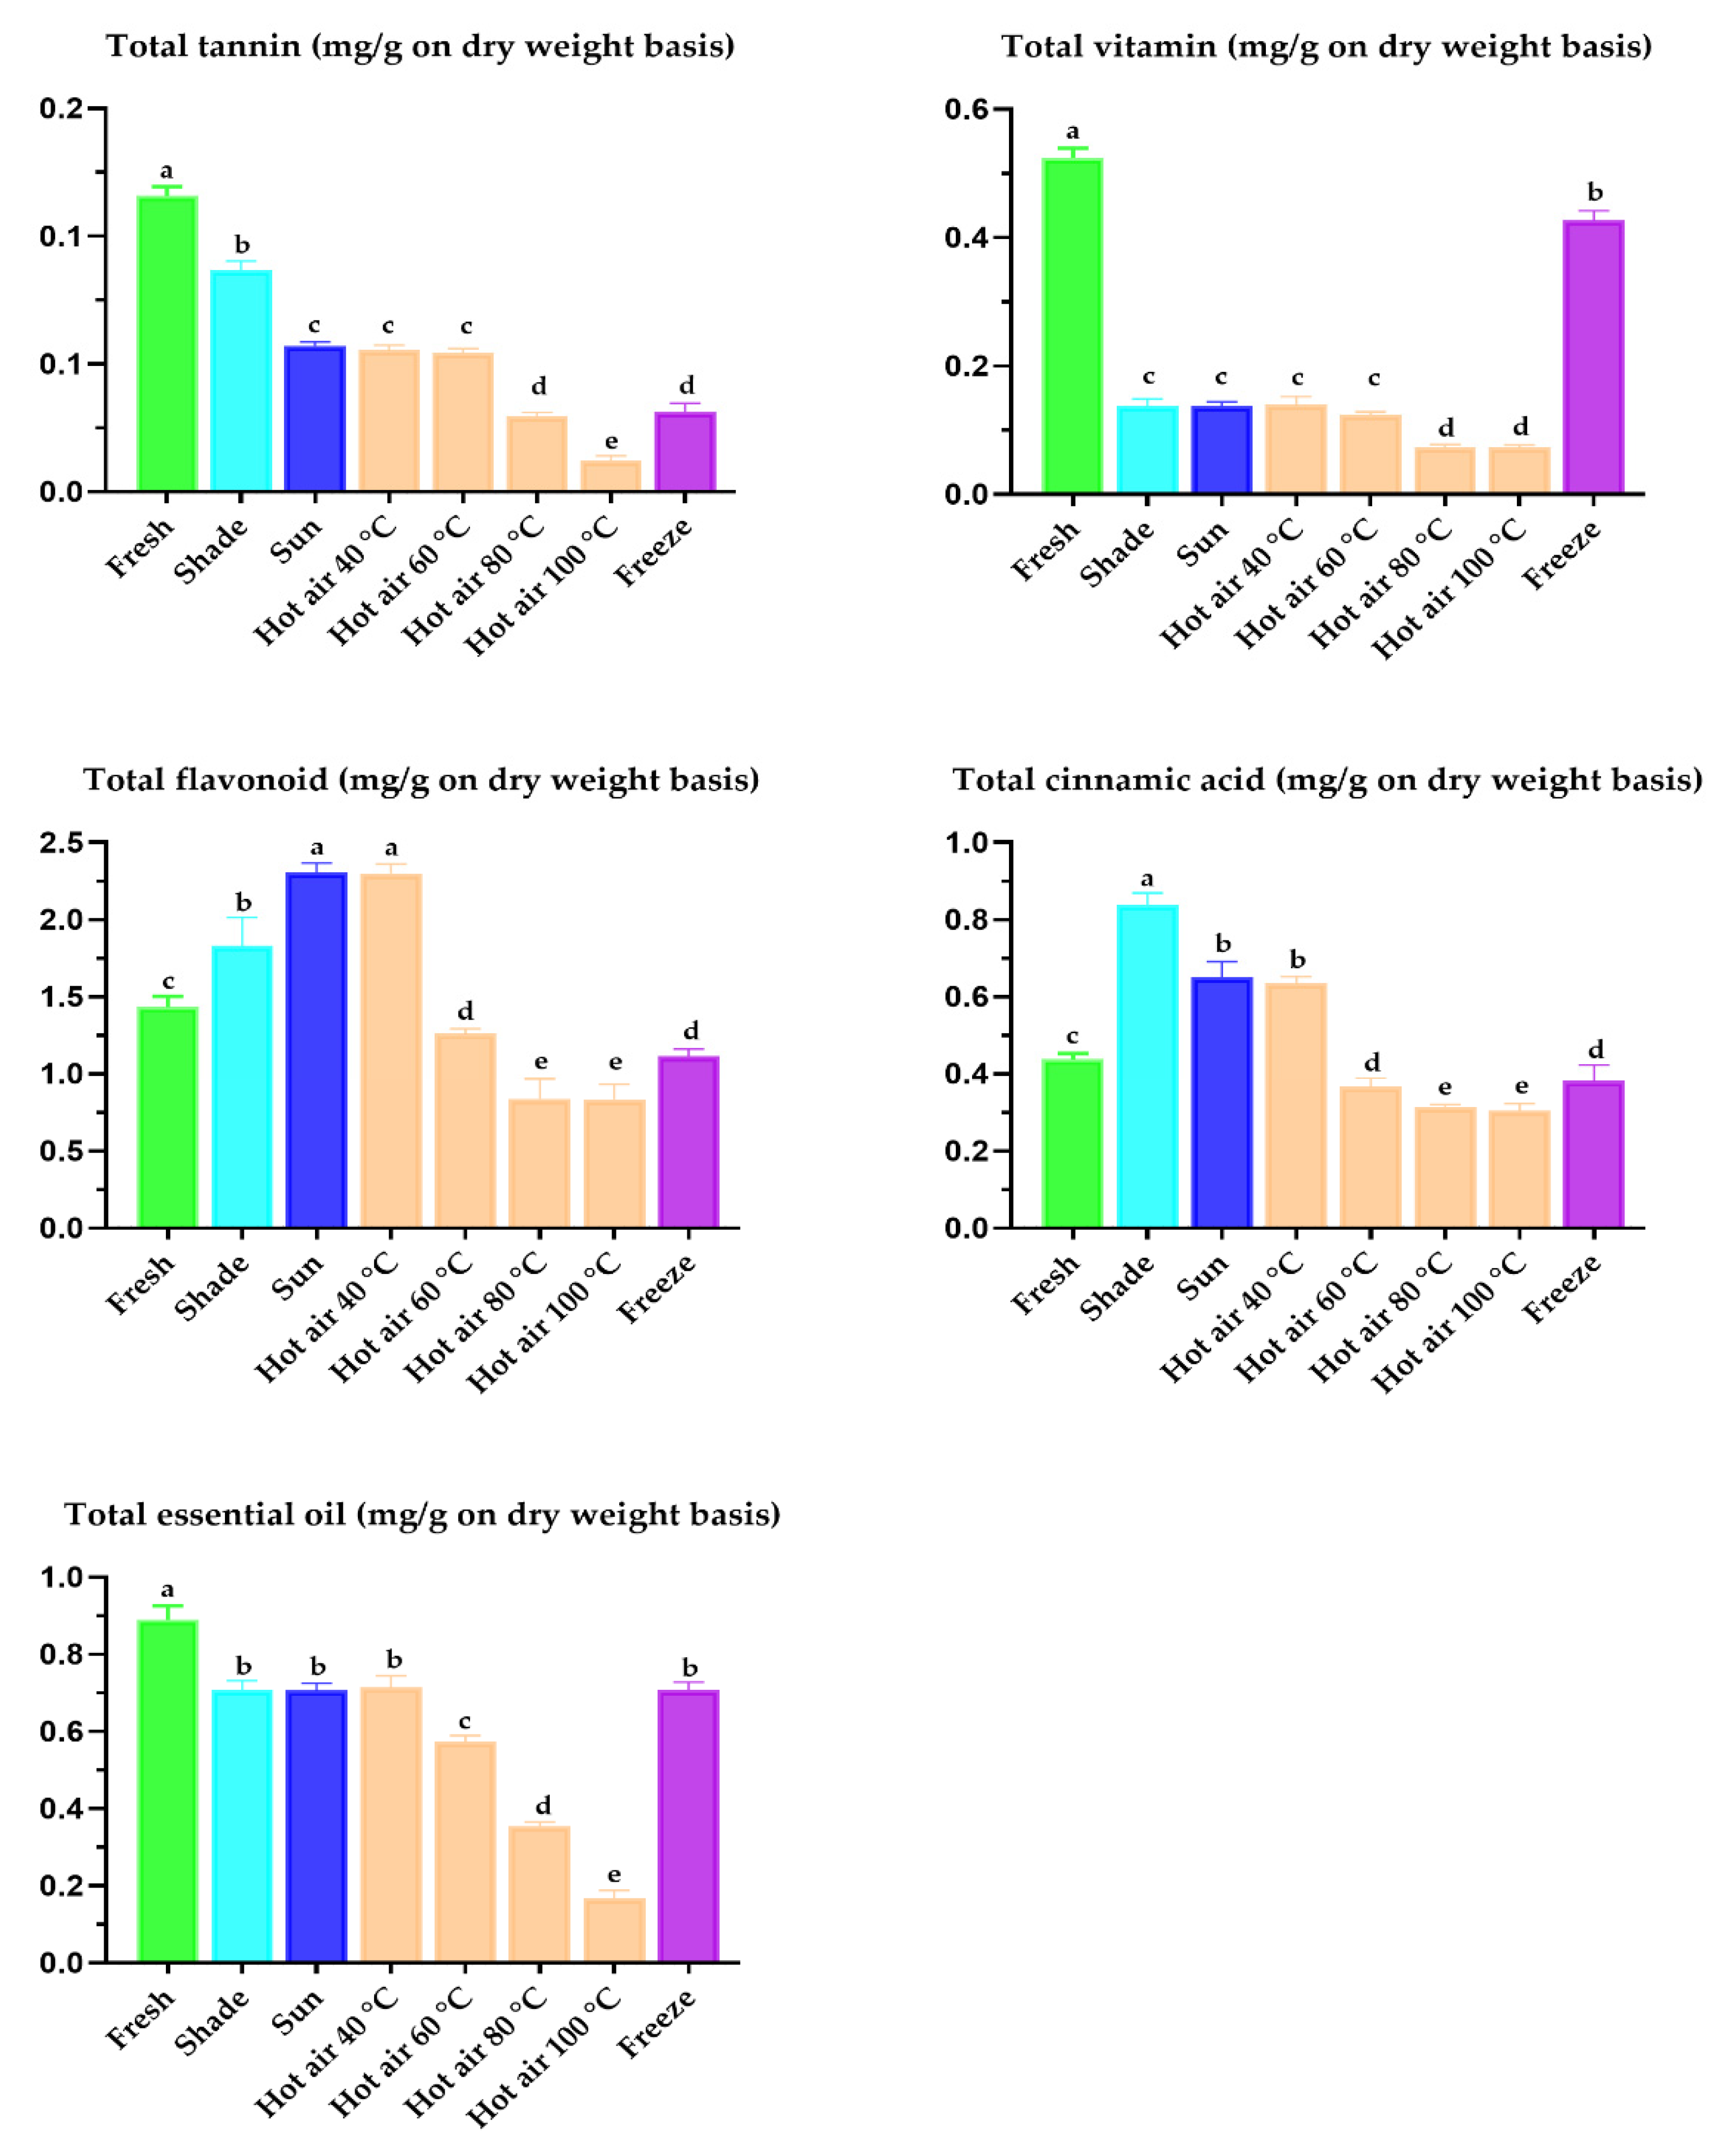
3.4. Effect of Drying Methods on Leaf Color Characteristics and Tannin, Flavonoid, Cinnamic Acid, Essential Oil, and Vitamin Contents

To the best of our knowledge, the current data shows for the first time that the type of drying treatment applied to P. sarmentosum leaves influences their color characteristics. Compared to P. betle leaves, the differences in color characteristics of P. sarmentosum leaves, as indicated by the Hunter L*, a*, and b* values, agreed with the results (excluding those of freeze-drying) reported by Rayaguru et al. [58]. The whiteness or brightness/darkness value (L*) and yellowness value (b*) of the fresh P. sarmentosum leaves did not change after shade drying, but decreased in leaves treated by sun and hot air oven drying at the temperatures tested in this study (p < 0.001; Table 5). However, the greenness values (a*) of fresh P. sarmentosum leaves were found to be different compared to those of leaves treated by shade, sun, hot air oven, and freeze-drying. The L*, a*, and b* values of leaves treated by freeze-drying were the highest among all drying treatments. The second highest values were observed in leaves treated by sun and hot air oven drying at 40 °C (p < 0.001; Table 5), indicating strong potential in the two drying methods. This notion is substantiated by the fact that, given the same duration of drying time, color deterioration was highest when the temperature rate of the drying method increased. The decreasing − a* (+ value) of fresh P. sarmentosum leaves after the drying treatments was indicative of a more efficient Maillard reaction [30,58]. It thus appears that the effect of freeze-drying on the color characteristics of leaves can be extrapolated to other drying conditions.
Processing methods, including the treatment of plant material by different drying treatments are acknowledged to have variable effects on antioxidant activity and phytochemical composition [29,44]. Quantitative evaluation of total tannin, vitamins, flavonoids, cinnamic acid, and essential oil in dried P. sarmentosum leaves using the developed HPLC method showed that the flavonoid content in P. sarmentosum leaves was the highest, followed by that of essential oil, cinnamic acid, ascorbic acid, and tannin (p < 0.001; Figure 4). Among the tested drying treatments, shade-, sun-, and 40 °C hot air oven-drying of fresh P. sarmentosum leaves significantly increased the chromatographic detection of flavonoids, cinnamic acid, and tannins. Freeze-drying and sun- or 40 °C hot air oven-drying improved the efficiency of the chromatographic detection of essential oils and vitamins. This finding was consistent with previous findings that the highest amounts of total tannin, vitamins, flavonoids, cinnamic acid, and essential oil were observed at drying temperatures below 50 °C [3,30,44]. Therefore, our results corroborate these previous reports. A possible explanation for these results is that low temperature during drying may protect the bioactive properties in plant material by preventing excessive breakdown of cellular constituents, a process that can result in decomposition, or in the combination of components previously bound with the other plant substances, such as cell wall macromolecules [59]. Notably, we optimized and developed the HPLC method to detect and quantify 14 synergistic compounds in leaves dried at various temperatures (from −80 to 100 °C). Therefore, this analytical method for simultaneously detecting phytochemicals and micronutrients can be applied to the determination of synergistic compounds in other plants.

4. Conclusions

We developed and validated a simple workup and HPLC-DAD-based method for the simultaneous identification and quantification of one tannin, six flavonoids, five cinnamic acids, one essential oil, and one vitamin compound in P. sarmentosum leaves. This method exhibited low detection limits, better precisions and accuracy, and good recoveries (96–102%) of tannins, flavonoids, cinnamic acid, essential oils, and ascorbic acid in P. sarmentosum leaves. A remarkable advantage of the proposed method is that plant extracts could be simultaneously tested without the time-consuming fractionation of sample preparation steps. The standard and plant-extract chromatograms showed good separations of the compounds under similar conditions. In addition, drying P. sarmentosum leaves using shade, sun, hot air oven (40, 60, 80, 100 °C), and freeze-drying altered the phytochemical and synergistic compound compositions, but did not reduce the resolution retention times of the detected peaks. The most abundant synergistic compounds in P. sarmentosum leaves were flavonoids, followed by essential oil, cinnamic acid, ascorbic acid, and tannin. Differences in cultivation sites and sampling times of P. sarmentosum leaves did not affect the synergistic compound composition. Overall, this method can determine the amounts of tannin, flavonoid, cinnamic acid, essential oil, and ascorbic acid extracted using polar and nonpolar solvents. The method described in this study could be developed for further applications, especially in industrial manufacturing quality control for plant phytochemicals present in nutritional and medicinal plants.

Author Contributions

Conceptualization, R.A.P.P.; methodology, R.A.P.P., S.P., and P.P.; formal analysis, R.A.P.P.; investigation, R.A.P.P.; resources, R.A.P.P., S.P., and P.P.; data curation, R.A.P.P., S.P., and P.P.; writing—original draft preparation, R.A.P.P.; writing—review and editing, R.A.P.P., S.P., and P.P.; visualization, R.AP.P.; supervision, S.P. and P.P.; project administration, R.A.P.P., S.P., and P.P.; funding acquisition, R.A.P.P., S.P., and P.P. All authors have read and agreed to the published version of the manuscript.

Funding

This research was funded by Suranaree University of Technology (SUT), Nakhon Ratchasima Rajabhat University (NRRU), and by Thailand Science Research and Innovation (TSRI).

Institutional Review Board Statement

Not applicable.

Informed Consent Statement

Not applicable.

Data Availability Statement

All data is contained within the article.

Acknowledgments

Authors are truly grateful to all staffs of the Centre of Scientific and Technological Equipment and SUT Organic Farm, Suranaree University of Technology, to Emeritus Nantakorn Boonkerd and to Aphakorn Longtonglang for use of the research facilities and materials. Authors extend their heartfelt thanks to Janjira Wongwiwattana for her assistance with systematic analysis and calculation. Rayudika Aprilia Patindra Purba gratefully acknowledges the Institute of Research and Development grant (Contract No. Full-time 61/02/2021) as a full-time Doctoral Researcher conducting research at Suranaree University of Technology. Graphical abstract was created with BioRender.com (license number FH22XXWC4R).

Conflicts of Interest

The authors declare no conflict of interest.

References

  1. Englberger, K. Invasive Weeds of Pohnpei: A Guide for Identification and Public Awareness; Conservation Society of Pohnpei (CSP): Kolonia, Federated States of Micronesia, 2009; p. 29. [Google Scholar]
  2. Sun, X.; Chen, W.; Dai, W.; Xin, H.; Rahmand, K.; Wang, Y.; Zhang, J.; Zhang, S.; Xu, L.; Han, T. Piper sarmentosum Roxb.: A review on its botany, traditional uses, phytochemistry, and pharmacological activities. J. Ethnopharmacol. 2020, 263, 112897. [Google Scholar] [CrossRef]
  3. Chanwitheesuk, A.; Teerawutgulrag, A.; Rakariyatham, N. Screening of antioxidant activity and antioxidant compounds of some edible plants of Thailand. Food Chem. 2005, 92, 491–497. [Google Scholar] [CrossRef]
  4. Rukachaisirikul, T.; Siriwattanakit, P.; Sukcharoenphol, K.; Wongvein, C.; Ruttanaweang, P.; Wongwattanavuch, P.; Suksamrarn, A. Chemical constituents and bioactivity of Piper sarmentosum. J. Ethnopharmacol. 2004, 93, 173–176. [Google Scholar] [CrossRef] [PubMed]
  5. Rahman, N.N.N.A.; Furuta, T.; Kojima, S.; Takane, K.; Mohd, M.A. Antimalarial activity of extracts of Malaysian medicinal plants. J. Ethnopharmacol. 1999, 64, 249–254. [Google Scholar] [CrossRef]
  6. Chanprapai, P.; Chavasiri, W. Antimicrobial activity from Piper sarmentosum Roxb. against rice pathogenic bacteria and fungi. J. Integr. Agric. 2017, 16, 2513–2524. [Google Scholar] [CrossRef] [Green Version]
  7. Purba, R.A.P.; Yuangklang, C.; Paengkoum, S.; Paengkoum, P. Piper oil decreases in vitro methane production with shifting ruminal fermentation in a variety of diets. Int. J. Agric. Biol. 2021, 25, 231–240. [Google Scholar]
  8. Ariffin, S.H.Z.; Omar, W.H.A.W.; Ariffin, Z.Z.; Safian, M.F.; Senafi, S.; Wahab, R.M.A. Intrinsic anticarcinogenic effects of Piper sarmentosum ethanolic extract on a human hepatoma cell line. Cancer Cell. Int. 2009, 9, 6. [Google Scholar] [CrossRef] [Green Version]
  9. Ismail, S.M.; Hui, C.K.; Aminuddin, A.; Ugusman, A. Piper sarmentosum as an Antioxidant: A Systematic Review. Sains. Malays. 2018, 47, 2359–2368. [Google Scholar] [CrossRef]
  10. Ridtitid, W.; Rattanaprom, W.; Thaina, P.; Chittrakarn, S.; Sunbhanich, M. Neuromuscular blocking activity of methanolic extract of Piper sarmentosum leaves in the rat phrenic nerve-hemidiaphragm preparation. J. Ethnopharmacol. 1998, 61, 135–142. [Google Scholar] [CrossRef]
  11. Amran, A.A.; Zakaria, Z.; Othman, F.; Das, S.; Raj, S.; Nordin, N.A.M.M. Aqueous extract of Piper sarmentosum decreases atherosclerotic lesions in high cholesterolemic experimental rabbits. Lipids Health Dis. 2010, 9, 44. [Google Scholar] [CrossRef] [Green Version]
  12. Zakaria, Z.A.; Patahuddin, H.; Mohamad, A.S.; Israf, D.A.; Sulaiman, M.R. In vivo anti-nociceptive and anti-inflammatory activities of the aqueous extract of the leaves of Piper sarmentosum. J. Ethnopharmacol. 2010, 128, 42–48. [Google Scholar] [CrossRef] [PubMed]
  13. Cherdthong, A.; Khonkhaeng, B.; Foiklang, S.; Wanapat, M.; Gunun, N.; Gunun, P.; Chanjula, P.; Polyorach, S. Effects of supplementation of Piper sarmentosum leaf powder on feed efficiency, rumen ecology and rumen protozoal concentration in thai native beef cattle. Animals 2019, 9, 130. [Google Scholar] [CrossRef] [PubMed] [Green Version]
  14. Purba, R.A.P.; Paengkoum, S.; Yuangklang, C.; Paengkoum, P. Flavonoids and their aromatic derivatives in Piper betle powder promote in vitro methane mitigation in a variety of diets. Cienc. Agrotec. 2020, 44, e012420. [Google Scholar] [CrossRef]
  15. Purba, R.A.P.; Yuangklang, C.; Paengkoum, P. Enhanced conjugated linoleic acid and biogas production after ruminal fermentation with Piper betle L. supplementation. Ciênc. Rural 2020, 50, e20191001. [Google Scholar] [CrossRef]
  16. Purba, R.A.P.; Yuangklang, C.; Paengkoum, S.; Paengkoum, P. Milk fatty acid composition, rumen microbial population and animal performance in response to diets rich in linoleic acid supplemented with Piper betle leaves in Saanen goats. Anim. Prod. Sci. 2020. [Google Scholar] [CrossRef]
  17. McSweeney, C.S.; Palmer, B.; McNeill, D.M.; Krause, D.O. Microbial interactions with tannins: Nutritional consequences for ruminants. Anim. Feed Sci. Tech. 2001, 91, 83–93. [Google Scholar] [CrossRef]
  18. Paengkoum, S.; Tatsapong, P.; Taethaisong, N.; Sorasak, T.; Purba, R.A.P.; Paengkoum, P. Empirical evaluation and prediction of protein requirements for maintenance and growth of 18–24 months old thai swamp buffaloes. Animals 2021, 11, 1405. [Google Scholar] [CrossRef]
  19. Vasta, V.; Daghio, M.; Cappucci, A.; Buccioni, A.; Serra, A.; Viti, C.; Mele, M. Invited review: Plant polyphenols and rumen microbiota responsible for fatty acid biohydrogenation, fiber digestion, and methane emission: Experimental evidence and methodological approaches. J. Dairy Sci. 2019, 102, 3781–3804. [Google Scholar] [CrossRef]
  20. Olagaray, K.E.; Bradford, B.J. Plant flavonoids to improve productivity of ruminants—A review. Anim. Feed Sci. Tech. 2019, 251, 21–36. [Google Scholar] [CrossRef]
  21. Purba, R.A.P.; Paengkoum, P.; Paengkoum, S. The links between supplementary tannin levels and conjugated linoleic acid (CLA) formation in ruminants: A systematic review and meta-analysis. PLoS ONE 2020, 15, e0216187. [Google Scholar] [CrossRef] [PubMed] [Green Version]
  22. Newbold, C.J.; Ramos-Morales, E. Review: Ruminal microbiome and microbial metabolome: Effects of diet and ruminant host. Animal 2020, 14, s78–s86. [Google Scholar] [CrossRef] [Green Version]
  23. Paengkoum, S.; Petlum, A.; Purba, R.A.P.; Paengkoum, P. Protein-binding affinity of various condensed tannin molecular weights from tropical leaf peel. J. Appl. Pharm. Sci. 2021, 11, 114–120. [Google Scholar]
  24. Vorlaphim, T.; Paengkoum, P.; Purba, R.A.P.; Yuangklang, C.; Paengkoum, S.; Schonewille, J.T. Treatment of rice stubble with Pleurotus ostreatus and urea improves the growth performance in slow-growing goats. Animals 2021, 11, 1053. [Google Scholar] [CrossRef]
  25. Gulcin, İ. Antioxidants and antioxidant methods: An updated overview. Arch. Toxicol. 2020, 94, 651–715. [Google Scholar] [CrossRef] [Green Version]
  26. Adisakwattana, S.; Thilavech, T.; Sompong, W.; Pasukamonset, P. Interaction between ascorbic acid and gallic acid in a model of fructose-mediated protein glycation and oxidation. Electron. J. Biotechnol. 2017, 27, 32–36. [Google Scholar] [CrossRef]
  27. Salehi, B.; Zakaria, Z.A.; Gyawali, R.; Ibrahim, S.A.; Rajkovic, J.; Shinwari, Z.K.; Khan, T.; Sharifi-Rad, J.; Ozleyen, A.; Turkdonmez, E.; et al. Piper Species: A Comprehensive Review on Their Phytochemistry, Biological Activities and Applications. Molecules 2019, 24, 1364. [Google Scholar] [CrossRef] [PubMed] [Green Version]
  28. Purba, R.A.P.; Paengkoum, P. Bioanalytical HPLC method of Piper betle L. for quantifying phenolic compound, water-soluble vitamin, and essential oil in five different solvent extracts. J. Appl. Pharm. Sci. 2019, 9, 33–39. [Google Scholar]
  29. Silva, G.V.D.; Machado, B.A.S.; Oliveira, W.P.D.; Silva, C.F.G.D.; Quadros, C.P.D.; Druzian, J.I.; Ferreira, E.D.S.; Umsza-Guez, M.A. Effect of drying methods on bioactive compounds and antioxidant capacity in grape skin residues from the new hybrid variety “BRS Magna”. Molecules 2020, 25, 3701. [Google Scholar] [CrossRef] [PubMed]
  30. Roshanak, S.; Rahimmalek, M.; Goli, S.A. Evaluation of seven different drying treatments in respect to total flavonoid, phenolic, vitamin C content, chlorophyll, antioxidant activity and color of green tea (Camellia sinensis or C. assamica) leaves. J. Food Sci. Technol. 2016, 53, 721–729. [Google Scholar] [CrossRef] [Green Version]
  31. Arslan, D.; Özcan, M.M. Evaluation of drying methods with respect to drying kinetics, mineral content and colour characteristics of rosemary leaves. Energy Convers. Manag. 2008, 49, 1258–1264. [Google Scholar] [CrossRef]
  32. AOAC. Official Methods of Analysis; AOAC International Suite 500: Gaitherburg, MD, USA, 2005. [Google Scholar]
  33. Kaps, M.; Lamberson, W.R. Biostatistics for Animal Science; CABI: Oxfordshire, UK, 2004. [Google Scholar]
  34. Poole, C.F.; Lenca, N. Chapter 4—Reversed-phase liquid chromatography. In Liquid Chromatography, 2nd ed.; Fanali, S., Haddad, P.R., Poole, C.F., Riekkola, M.-L., Eds.; Elsevier: Amsterdam, The Netherlands, 2017; pp. 91–123. [Google Scholar] [CrossRef]
  35. Tache, F.; Udrescu, S.; Albu, F.; Micăle, F.; Medvedovici, A. Greening pharmaceutical applications of liquid chromatography through using propylene carbonate—Ethanol mixtures instead of acetonitrile as organic modifier in the mobile phases. J. Pharm. Biomed. 2013, 75, 230–238. [Google Scholar] [CrossRef] [PubMed]
  36. Burin, V.M.; Arcari, S.G.; Bordignon, L.; Marilde, T.; Costa, L.L.F. Determination of some phenolic compounds in red wine by RP-HPLC: Method development and validation. J. Chromatogr. Sci. 2011, 49, 647–651. [Google Scholar] [CrossRef]
  37. Robards, K.; Haddad, P.R.; Jackson, P.E. Principles and Practice of Modern Chromatographic Methods; Academic Press: New York, NY, USA, 1994. [Google Scholar]
  38. Kruse, H.P.; Snyder, R.; Kirkland, J.J.; Glajch, J.L. Practical HPLC Method Development. Mol. Nutr. Food Res. 1997, 41, 380. [Google Scholar]
  39. Kumar, N.; Bhandari, P.; Singh, B.; Gupta, A.P.; Kaul, V.K. Reversed phase-HPLC for rapid determination of polyphenols in flowers of rose species. J. Sep. Sci. 2008, 31, 262–267. [Google Scholar] [CrossRef]
  40. Kim, J.; Um, M.; Yang, H.; Kim, I.; Lee, C.; Kim, Y.; Yoon, M.; Kim, Y.; Kim, J.; Cho, S. Method development and validation for dieckol in the standardization of phlorotannin preparations. Fish. Aquat. Sci. 2016, 19, 3. [Google Scholar] [CrossRef] [Green Version]
  41. Do, Q.D.; Angkawijaya, A.E.; Tran-Nguyen, P.L.; Huynh, L.H.; Soetaredjo, F.E.; Ismadji, S.; Ju, Y.H. Effect of extraction solvent on total phenol content, total flavonoid content, and antioxidant activity of Limnophila aromatica. J. Food Drug Anal. 2014, 22, 296–302. [Google Scholar] [CrossRef] [Green Version]
  42. Truong, D.H.; Nguyen, D.H.; Ta, N.T.A.; Bui, A.V.; Do, T.H.; Nguyen, H.C. Evaluation of the use of different solvents for phytochemical constituents, antioxidants, and in vitro anti-inflammatory activities of Severinia buxifolia. J. Food Qual. 2019, 2019, 8178294. [Google Scholar] [CrossRef] [Green Version]
  43. Babbar, N.; Oberoi, H.S.; Sandhu, S.K.; Bhargav, V.K. Influence of different solvents in extraction of phenolic compounds from vegetable residues and their evaluation as natural sources of antioxidants. J. Food Sci. Technol. 2014, 51, 2568–2575. [Google Scholar] [CrossRef] [PubMed] [Green Version]
  44. Miean, K.H.; Mohamed, S. Flavonoid (myricetin, quercetin, kaempferol, luteolin, and apigenin) content of edible tropical plants. J. Agric. Food Chem. 2001, 49, 3106–3112. [Google Scholar] [CrossRef] [PubMed]
  45. Biba, M.; Regalado, E.L.; Wu, N.; Welch, C.J. Effect of particle size on the speed and resolution of chiral separations using supercritical fluid chromatography. J. Chromatogr. A 2014, 1363, 250–256. [Google Scholar] [CrossRef]
  46. Yang, X.; Ma, L.; Carr, P.W. High temperature fast chromatography of proteins using a silica-based stationary phase with greatly enhanced low pH stability. J. Chromatogr. A 2005, 1079, 213–220. [Google Scholar] [CrossRef]
  47. Nguyen, D.T.T.; Guillarme, D.; Rudaz, S.; Veuthey, J.L. Fast analysis in liquid chromatography using small particle size and high pressure. J. Sep. Sci. 2006, 29, 1836–1848. [Google Scholar] [CrossRef]
  48. Poppe, H. Some reflections on speed and efficiency of modern chromatographic methods. J. Chromatogr. A 1997, 778, 3–21. [Google Scholar] [CrossRef]
  49. Bactiar, C.F.; Fahami, N.A.M. LC-MS analysis of phytocomponents in the methanol extract of Piper sarmentosum leaves. Pharmacogn. Mag. 2019, 11, 1071–1076. [Google Scholar] [CrossRef] [Green Version]
  50. Feng, G.; Chen, M.; Ye, H.C.; Zhang, Z.K.; Li, H.; Chen, L.L.; Chen, X.L.; Yan, C.; Zhang, J. Herbicidal activities of compounds isolated from the medicinal plant Piper sarmentosum. Ind. Crops Prod. 2019, 132, 41–47. [Google Scholar] [CrossRef]
  51. Canbay, H.S. Effectiveness of liquid-liquid extraction, solid phase extraction, and headspace technique for determination of some volatile water-soluble compounds of rose aromatic water. Int. J. Anal. Chem. 2017, 2017, 4870671. [Google Scholar] [CrossRef]
  52. Geng, Y.; Liu, J.; Lv, R.; Yuan, J.; Lin, Y.; Wang, X. An efficient method for extraction, separation and purification of eugenol from Eugenia caryophyllata by supercritical fluid extraction and high-speed counter-current chromatography. Sep. Purif. Technol. 2007, 57, 237–241. [Google Scholar] [CrossRef]
  53. Chieng, T.C.; Assim, Z.B.; Fasihuddin, B.A. Toxicity and antitermite activities of the essential oils from Piper sarmentosum. Malays. J. Anal. Sci. 2008, 12, 234–239. [Google Scholar]
  54. Rahman, S.F.S.A.; Sijam, K.; Omar, D.; Wahab, M.Z.A. Identification of phenolic compounds and evaluation of antibacterial properties of Piper sarmentosum Roxb. against rice pathogenic bacteria. Malays. J. Microbiol. 2016, 12, 475–484. [Google Scholar]
  55. Ahmad, S.; Hakiman, M.; Maziah, M. Antioxidant activities, flavonoids, ascorbic acid and phenolic content of Malaysian vegetables. J. Med. Plant. Res. 2010, 4, 881–890. [Google Scholar]
  56. Cabo-Calvet, E.; Ortiz-Bolsico, C.; Baeza-Baeza, J.J.; García-Alvarez-Coque, M.C. Description of the retention and peak profile for chromolith columns in isocratic and gradient elution using mobile phase composition and flow rate as factors. Separations 2014, 1, 194–210. [Google Scholar] [CrossRef] [Green Version]
  57. Reschke, B.R.; Timperman, A.T. A study of electrospray ionization emitters with differing geometries with respect to flow rate and electrospray voltage. J. Am. Soc. Mass Spectrom. 2011, 22, 2115–2124. [Google Scholar] [CrossRef] [PubMed] [Green Version]
  58. Rayaguru, K.; Routray, W.; Mohanty, S.N. Mathematical modeling and quality parameters of air-dried betel leaf (Piper betle L.). J. Food Process. Preserv. 2011, 35, 394–401. [Google Scholar] [CrossRef]
  59. Multari, S.; Marsol-Vall, A.; Keskitalo, M.; Yang, B.; Suomela, J.K. Effects of different drying temperatures on the content of phenolic compounds and carotenoids in quinoa seeds (Chenopodium quinoa) from Finland. J. Food Compos. Anal. 2018, 72, 75–82. [Google Scholar] [CrossRef]
Figure 1. Chemical structures of tannin (A), flavonoid (B), cinnamic acid (C), essential oil (D), and vitamin C (E).
Separations 08 00152 g001
Figure 2. Chromatogram of an external standard mixture at λ = 272 nm, flow rate 0.9 mL/min, for 40 min (κ) and 65 min (β). Peak 1, ascorbic acid; 2, gallic acid; 3, catechin; 4, caffeic acid; 5, syringic acid; 6, rutin; 7, p-coumaric acid; 8, sinapic acid; 9, ferulic acid; 10, myricetin; 11, quercetin; 12, apigenin; 13, kaempferol; 14, eugenol.
Separations 08 00152 g002
Figure 3. Chromatogram of P. sarmentosum leaves at λ = 272 nm, flow rate 0.9 mL/min, for 40 min (κ) and 65 min (β). (A), methanolic extract (20× dilution); (B), chloroformic extract (20× dilution); (C), hexanoic extract (5× dilution). Peak 1, ascorbic acid; 2, gallic acid; 3, catechin; 4, caffeic acid; 5, syringic acid; 6, rutin; 7, p-coumaric acid; 8, sinapic acid; 9, ferulic acid; 10, myricetin; 11, quercetin; 12, apigenin; 13, kaempferol; 14, eugenol.
Separations 08 00152 g003
Figure 4. Total tannin, total vitamin, total flavonoid, total cinnamic acid, and total essential oil of dried P. sarmentosum leaves as estimated by using the present developed HPLC method. Data reported as least-squares means ± SEM (n = 20). a–e A different superscript indicates a significantly different mean (p < 0.05).
Separations 08 00152 g004
Table 1. Calibration curve, selectivity, linearity, and limit of detection (LOD) and quantification (LOQ) parameters.
Organic CompoundLinearity Range (µg/mL)Regression EquationLOD
(µg/mL)
LOQ
(µg/mL)
Coefficient of Determination (R2)
Ascorbic acid5–60y = 2.4924x + 12.33880.5311.6090.9997
Gallic acid 5–60y = 12.9818x + 2.23620.0260.0780.9995
Catechin5–60y = 2.9286x + 0.63890.3851.1660.9998
Caffeic acid5–60y = 4.8257x + 1.25900.1630.4940.9996
Syringic acid5–60y = 5.4006x + 4.72970.1170.3530.9997
Rutin5–60y = 4.4610x + 6.62430.1680.5090.9998
P-coumaric acid5–60y = 8.7897x + 5.65610.0430.1310.9995
Sinapic acid5–60y = 2.9304x + 3.76970.3881.1750.9995
Ferulic acid5–60y = 6.4391x + 10.03230.0800.2430.9997
Myricetin5–60y = 6.4988x + 7.72780.0790.2400.9997
Quercetin5–60y = 9.4149x − 29.65970.0370.1130.9992
Apigenin5–60y = 5.6536x + 11.01480.1030.3130.9994
Kaempferol5–60y = 2.0474x − 6.12110.7892.3920.9993
Eugenol5–60y = 4.2751x − 11.89160.1870.5670.9994
Table 2. Intra- and inter-day precision and accuracy (n = 10, mean value ± %RSD).
Organic CompoundNominal
Concentration (µg/mL)
Intra-Day PrecisionInter-Day PrecisionRecovery (%)
Retention Time (min)Detected
Concentration (µg/mL)
Retention Time (min)Detected
Concentration (µg/mL)
Ascorbic acid20 3.74 ± 0.3620.28 ± 1.113.76 ± 0.0819.99 ± 0.04100.67 ± 1.07
403.74 ± 0.2040.18 ± 0.393.75 ± 0.2139.83 ± 0.17100.01 ± 0.53
603.75 ± 0.3958.69 ± 1.503.76 ± 0.1057.89 ± 1.4196.57 ± 1.58
Gallic acid205.54 ± 0.0919.64 ± 1.255.54 ± 0.1419.27 ± 0.3597.28 ± 1.33
405.54 ± 0.1239.59 ± 1.225.55 ± 0.2138.67 ± 0.1297.83 ± 1.48
605.54 ± 0.1058.52 ± 1.635.55 ± 0.1257.00 ± 0.2296.27 ± 1.77
Catechin2010.87 ± 0.0719.91 ± 0.6810.98 ± 0.1319.70 ± 0.5999.02 ± 0.82
4010.87 ± 0.1739.38 ± 1.6411.00 ± 0.1138.34 ± 0.1897.15 ± 1.79
6010.88 ± 0.1658.80 ± 0.9711.01 ± 0.1958.00 ± 0.2097.33 ± 0.98
Caffeic acid2013.37 ± 0.2019.98 ± 0.7813.43 ± 0.3319.76 ± 0.3599.35 ± 0.82
4013.39 ± 0.2839.85 ± 0.9313.47 ± 0.1039.18 ± 0.2998.79 ± 1.10
6013.46 ± 0.2659.70 ± 0.6713.48 ± 0.1958.39 ± 0.4298.41 ± 1.26
Syringic acid2013.97 ± 0.3220.22 ± 1.2014.08 ± 0.2619.64 ± 0.8199.65 ± 1.82
4013.97 ± 0.1140.51 ± 1.6614.12 ± 0.3739.25 ± 1.3699.70 ± 1.92
6013.97 ± 0.0859.82 ± 1.6214.10 ± 0.4358.92 ± 0.7098.95 ± 1.01
Rutin2016.47 ± 0.1120.34 ± 0.9916.72 ± 0.4019.85 ± 0.98100.49 ± 1.57
4016.47 ± 0.1640.18 ± 0.3716.71 ± 0.9839.61 ± 1.0799.74 ± 1.06
6016.47 ± 0.2460.04 ± 0.2016.73 ± 0.4459.75 ± 0.4099.82 ± 0.39
P-coumaric acid2017.79 ± 0.6320.15 ± 0.7417.92 ± 0.9319.94 ± 0.95100.22 ± 1.00
4017.78 ± 0.2440.07 ± 0.5117.92 ± 0.9539.81 ± 0.6099.85 ± 0.63
6017.77 ± 0.4859.92 ± 0.3517.94 ± 0.8259.61 ± 0.5299.61 ± 0.50
Sinapic acid2018.86 ± 0.5220.28 ± 0.6019.08 ± 0.1620.05 ± 0.76100.83 ± 0.88
4018.82 ± 0.4840.44 ± 0.4019.15 ± 0.4540.21 ± 0.66100.81 ± 0.61
6018.87 ± 0.7060.81 ± 0.3419.14 ± 0.5960.56 ± 0.31101.14 ± 0.38
Ferulic acid2019.19 ± 0.9320.47 ± 0.6819.24 ± 0.3420.15 ± 0.44101.55 ± 0.97
4019.26 ± 0.9540.68 ± 0.1819.27 ± 0.3940.44 ± 0.31101.40 ± 0.39
6018.89 ± 0.5060.80 ± 0.2119.25 ± 0.8660.60 ± 0.12101.16 ± 0.23
Myricetin2022.80 ± 0.4319.96 ± 0.9023.23 ± 0.8119.79 ± 0.9299.38 ± 0.99
4022.80 ± 0.5939.93 ± 0.6723.28 ± 0.6439.51 ± 0.9699.30 ± 0.97
6022.80 ± 0.6859.61 ± 0.5523.28 ± 0.7859.29 ± 0.5499.08 ± 0.60
Quercetin2027.64 ± 0.5220.08 ± 0.5229.26 ± 0.7819.86 ± 0.7199.83 ± 0.82
4028.04 ± 0.1139.91 ± 0.5929.38 ± 0.8839.45 ± 0.4699.20 ± 0.78
6028.49 ± 0.8659.36 ± 0.8529.37 ± 0.7058.72 ± 0.5998.40 ± 0.91
Apigenin2032.58 ± 0.5520.01 ± 0.9832.71 ± 0.8519.81 ± 1.3899.56 ± 1.28
4032.31 ± 0.9340.04 ± 0.3232.74 ± 0.7839.55 ± 1.0399.48 ± 0.97
6032.28 ± 0.6259.89 ± 0.2732.73 ± 0.9758.95 ± 0.9599.03 ± 1.06
Kaempferol2033.19 ± 0.4219.91 ± 0.3733.46 ± 0.6519.77 ± 0.4299.21 ± 0.53
4033.19 ± 0.5339.89 ± 0.1933.46 ± 0.5739.78 ± 0.1999.59 ± 0.23
6033.18 ± 0.2759.53 ± 0.7733.49 ± 0.6858.58 ± 0.7298.43 ± 1.10
Eugenol2037.03 ± 0.0519.95 ± 0.1637.55 ± 0.7219.87 ± 0.2399.55 ± 0.28
4036.22 ± 0.7839.74 ± 0.2237.31 ± 0.8939.59 ± 0.2999.16 ± 0.31
6036.06 ± 0.6560.09 ± 0.1137.12 ± 0.9660.10 ± 0.21100.15 ± 0.16
Table 3. Identification and quantification of fourteen synergistic compounds in a variety of solvent extracts of commercial P. sarmentosum leaves (CSL) and non-commercial P. sarmentosum leaves (NSL).
Organic CompoundWavelength Detection
(nm)
Concentration (mg/g on Dry Weight Basis) a
MethanolChloroformHexaneAverage
CSL
Ascorbic acid272, 280, 3100.38 ± 0.12ndnd0.13 ± 0.04
Gallic acid 272, 280, 3100.12 ± 0.03ndnd0.04 ± 0.01
Catechin272, 280, 3100.20 ± 0.10ndnd0.07 ± 0.03
Caffeic acid272, 280, 3100.65 ± 0.270.04 ± 0.01nd0.23 ± 0.09
Syringic acid272, 280, 3100.06 ± 0.03ndnd0.02 ± 0.01
Rutin272, 280, 3100.49 ± 0.150.04 ± 0.020.04 ± 0.020.19 ± 0.05
P-coumaric acid272, 280, 3100.25 ± 0.07nd0.03 ± 0.010.09 ± 0.02
Sinapic acid272, 280, 3100.10 ± 0.070.04 ± 0.020.02 ± 0.010.05 ± 0.03
Ferulic acid272, 280, 3100.06 ± 0.03nd0.02 ± 0.010.03 ± 0.01
Myricetin272, 280, 3100.08 ± 0.050.05 ± 0.020.05 ± 0.020.06 ± 0.02
Quercetin272, 280, 3100.20 ± 0.120.17 ± 0.090.50 ± 0.260.29 ± 0.09
Apigenin272, 280, 3100.55 ± 0.210.14 ± 0.082.53 ± 0.501.07 ± 0.18
Kaempferol272, 280, 3100.22 ± 0.070.11 ± 0.061.47 ± 0.960.60 ± 0.33
Eugenol272, 280, 3100.37 ± 0.150.19 ± 0.091.53 ± 0.470.70 ± 0.17
NSL
Ascorbic acid272, 280, 3100.37 ± 0.06ndnd0.12 ± 0.02
Gallic acid 272, 280, 3100.16 ± 0.03ndnd0.05 ± 0.01
Catechin272, 280, 3100.20 ± 0.05ndnd0.07 ± 0.02
Caffeic acid272, 280, 3100.74 ± 0.150.04 ± 0.01nd0.26 ± 0.05
Syringic acid272, 280, 3100.06 ± 0.02ndnd0.02 ± 0.01
Rutin272, 280, 3100.51 ± 0.070.03 ± 0.020.04 ± 0.020.19 ± 0.03
P-coumaric acid272, 280, 3100.15 ± 0.11nd0.03 ± 0.010.06 ± 0.04
Sinapic acid272, 280, 3100.09 ± 0.070.04 ± 0.020.02 ± 0.010.05 ± 0.03
Ferulic acid272, 280, 3100.06 ± 0.02nd0.02 ± 0.010.03 ± 0.01
Myricetin272, 280, 3100.07 ± 0.050.05 ± 0.020.05 ± 0.030.06 ± 0.02
Quercetin272, 280, 3100.19 ± 0.090.17 ± 0.080.50 ± 0.300.29 ± 0.11
Apigenin272, 280, 3100.42 ± 0.200.15 ± 0.072.53 ± 0.381.03 ± 0.14
Kaempferol272, 280, 3100.22 ± 0.060.11 ± 0.051.77 ± 0.900.70 ± 0.32
Eugenol272, 280, 3100.36 ± 0.090.18 ± 0.111.61 ± 0.280.72 ± 0.11
a Data are presented as mean ± SD (each solvent, n = 20); nd: non-detectable.
Table 4. Total contents of tannin, flavonoids, cinnamic acid, essential oil, and vitamins in commercial P. sarmentosum leaves (CSL) and non-commercial P. sarmentosum leaves (NSL).
Organic CompoundCSLNSLSEMp Value 1
Cultivated SiteSampling TimeInteraction
Tannin0.050.040.0070.0620.6720.595
Flavonoid2.392.340.0390.0910.1590.075
Cinnamic acid0.680.650.0180.0510.3230.951
Essential oil0.720.700.0140.1100.9310.832
Vitamin0.120.130.0030.1310.5260.939
1 p Value: effect of cultivated site (CSL versus NSL), effect of sampling time (April–July), and their interaction (cultivated site × sampling time).
Table 5. Effect of different drying methods on the color characteristics of Piper sarmentosum Roxb. leaves.
Color CharacteristicsDrying MethodSEMp Value
FreshShadeSunHot Air 40 °CHot Air 60 °CHot Air 80 °CHot Air 100 °CFreeze
L*30.56 a30.94 a28.59 b28.39 b25.03 c22.52 d17.64 e27.13 b0.308<0.001
a*−6.34 b−2.96 c−2.82 c−2.76 c−1.36 d−1.27 d−1.10 d−7.50 a0.049<0.001
b*15.09 a15.14 a14.26 b14.07 b13.98 b13.02 c13.00 c14.87 a0.118<0.001
a–e Means in the same row with a different superscript letter differ significantly (p < 0.05).
Publisher’s Note: MDPI stays neutral with regard to jurisdictional claims in published maps and institutional affiliations.

