
Advanced Analytical Approaches for the Analysis of Polyphenols in Plants Matrices—A Review


 ,
,  ,
,
Abstract

1. Introduction
2. Extraction
2.1. Conventional Methods
2.2. Advanced Methods
2.2.1. Ultrasound-Assisted Extraction (UAE)
2.2.2. Microwave-Assisted Extraction (MAE)
2.2.3. Accelerated Solvent Extraction (ASE)
2.2.4. Supercritical Fluids Extraction (SFE)
2.2.5. Enzyme-Assisted Extraction
2.2.6. Extraction with Ionic Liquids (ILs)
2.3. Modeling the Extraction Process by Response Surface Methodology (SRM)
3. Extract Hydrolysis and Purification
4. Analytical Detection Techniques
4.1. Liquid Chromatography with Ultraviolet/Visible (UV/Vis)-Based Detection: HPLC Fingerprint with Chemometric Analysis
4.2. Liquid Chromatography–Mass Spectrometry Analytical Methods
4.2.1. Liquid Chromatography (LC) Tandem Low-Resolution Mass Spectrometry
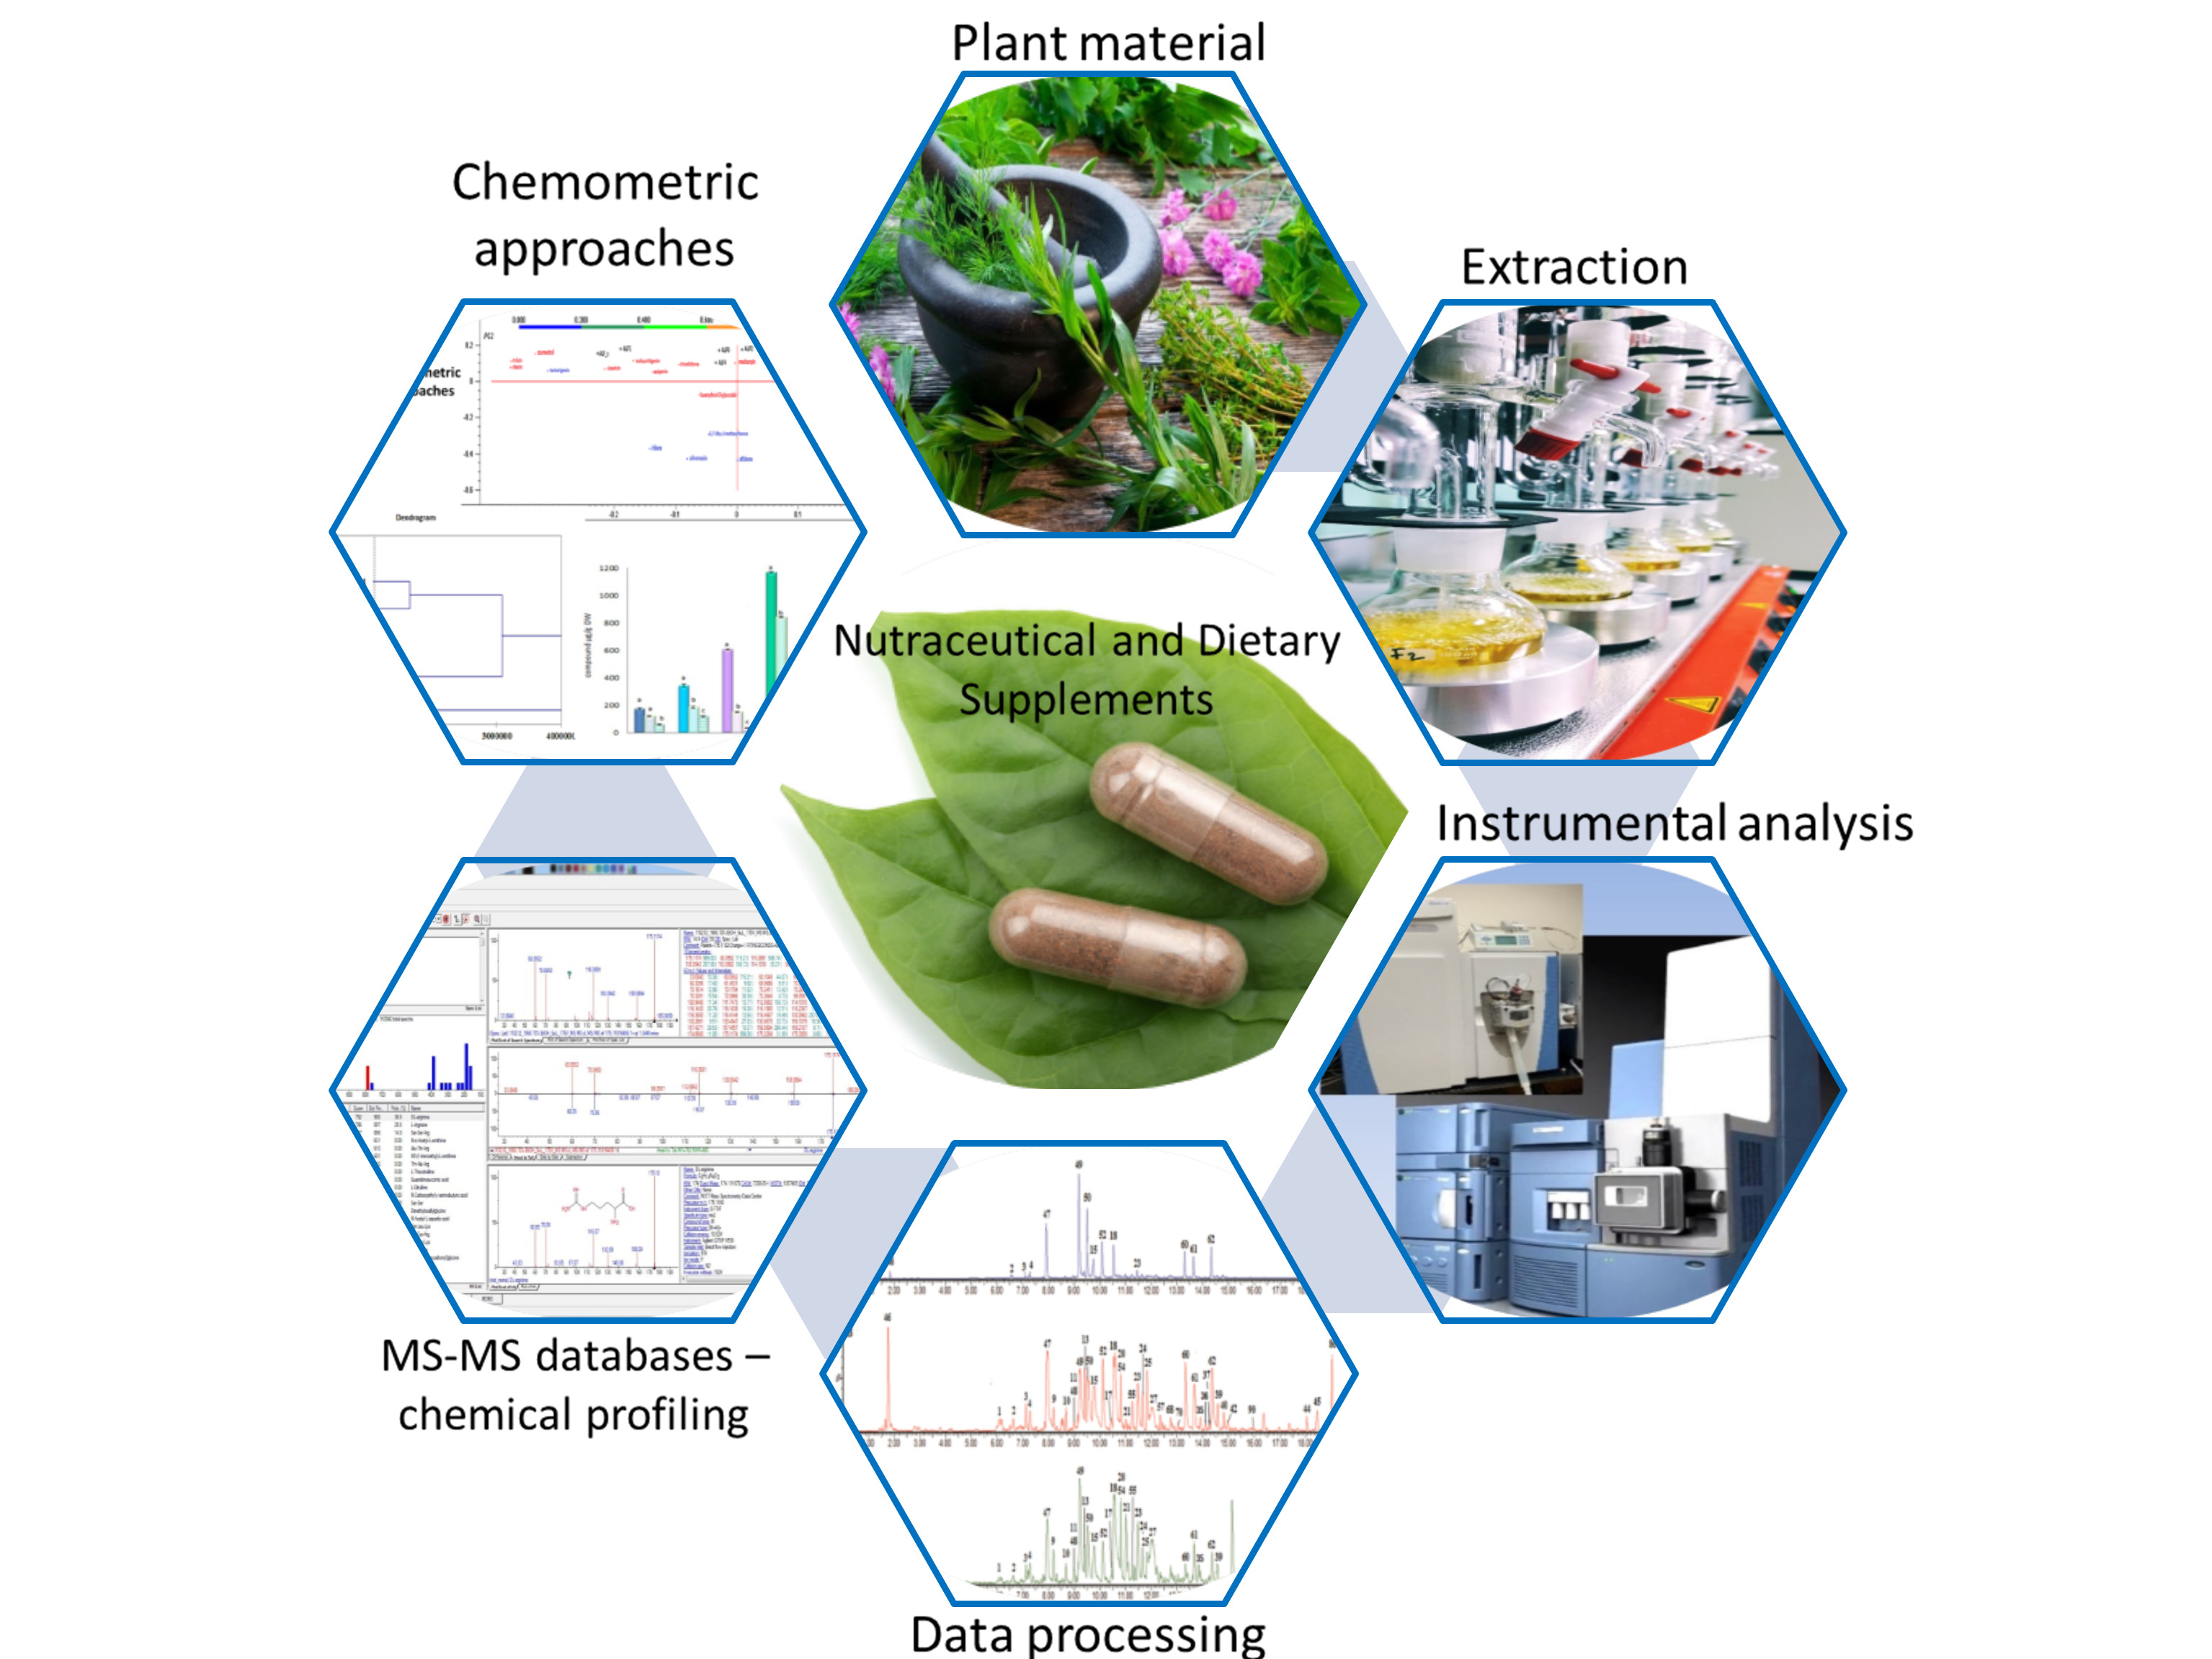
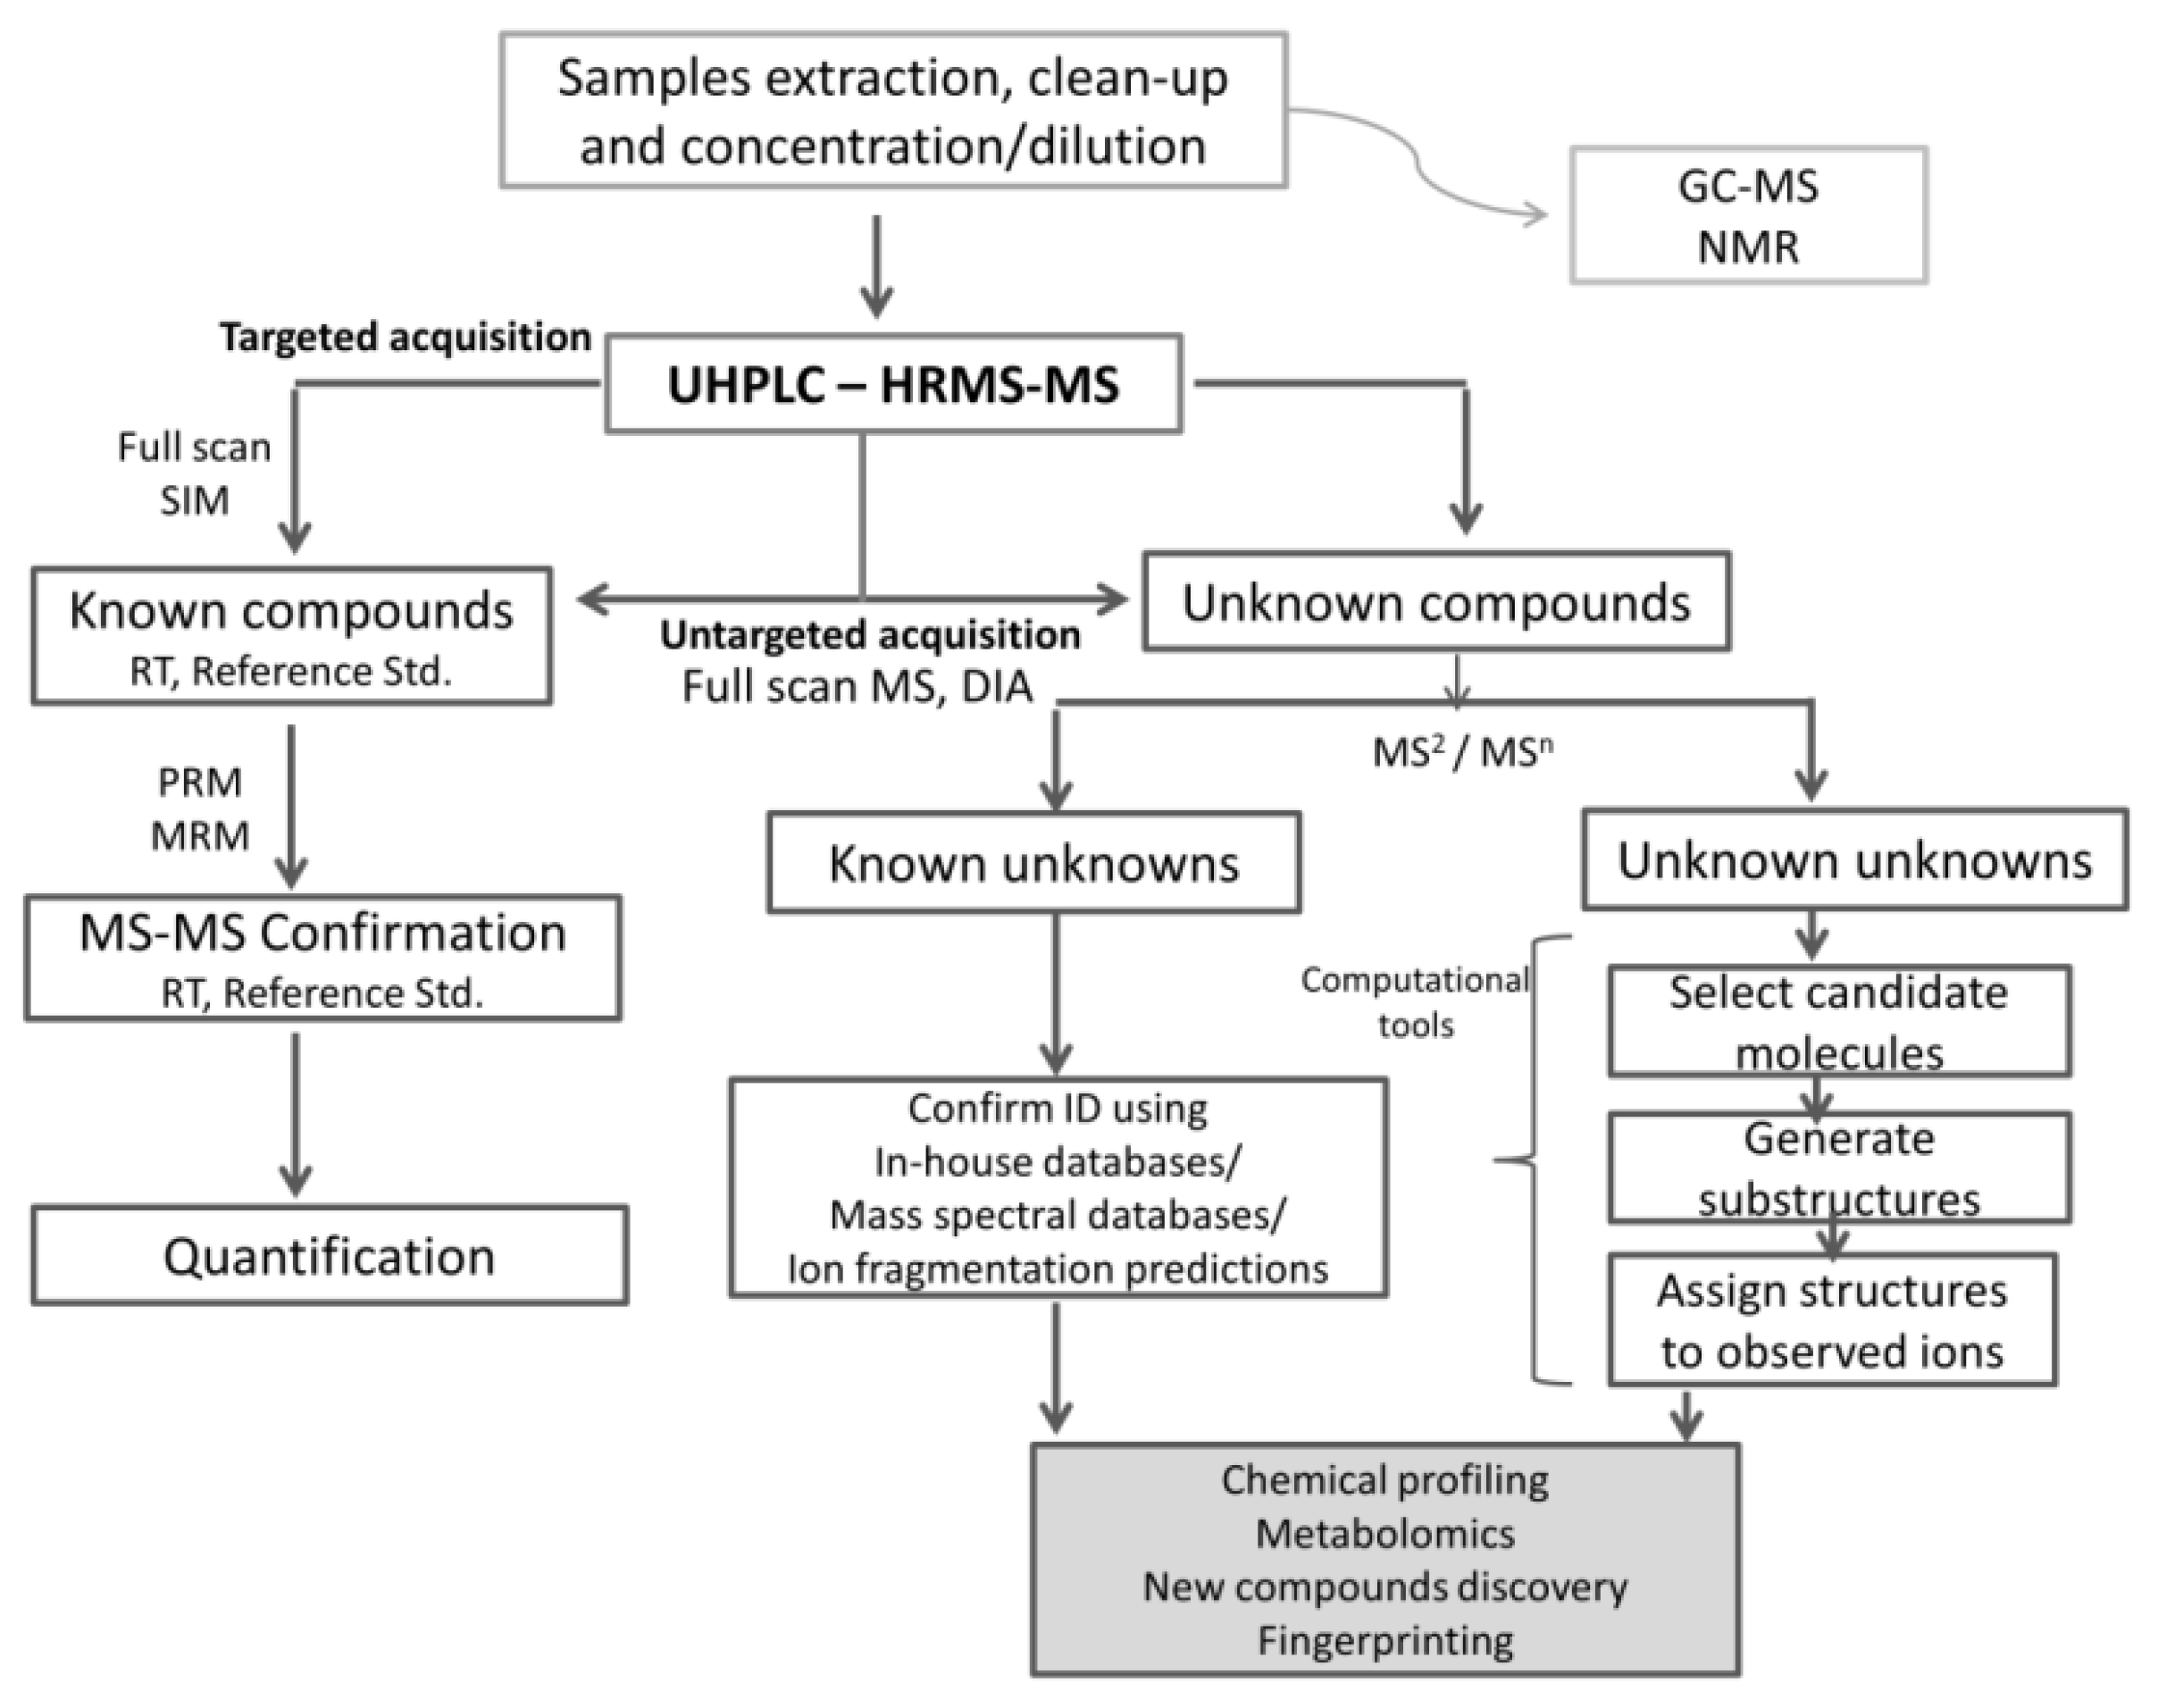
4.2.2. Non-Targeted High-Resolution Mass Spectrometry Use in “Chemical Profiling”

| Plant Material | Extraction | Hyphenated Technique Used | Instrumental Methodology (HPLC Condition, Ionization, Acquisition Mode) | Selected Polyphenols | Ref. |
|---|---|---|---|---|---|
| Flowers, leaves, and stalks of alfalfa (Medicago sativa L.) and goldenrod (Solidago virgaurea L.); flowers, leaves, stalks, and roots of phacelia (Phacelia tanacetifolia Benth.); buckwheat (Fagopyrum esculentum); licorice root (Glycyrrhiza glabra); and lavender flower (Lavandula spica L.) | solid–liquid extraction (SLE) consecutively using H2O; mixture H2O/EtOH (1:1; v/v), mixture H2O/MeOH (1:1; v/v), and finally NeOH shaking for 5 h; SPE purification using a C18 column | UHPLC-MS/MS | Zorbax Eclipse XDB-C18 column (50 × 2.1 mm, 1.8 μm); mobile phase: 0.1% v/v formic acid in water and ACN; ESI ionization source in negative mode, acquisition in selected reactions monitoring mode, SRM | 3-(4-hydroxyphenyl) propionic acid, 4-hydroxybenzoic acid, and 3,4-dihydroxybenzoic acid, quercetin, rutin, glabridin, and naringenin | [23] |
| Edible lotus (Nelumbo nucifera) rhizome knot | Enzymatic hydrolysis with cellulose and pectinase, at 62 °C, pH 4, 90 min followed by ultrafiltration | HPLC–QqQ-MS/MS | ZORBAX Eclipse XDB-C18 column (150 mm × 4.6 mm, 5 μm; mobile phase: aqueous 0.4% acetic acid, and acetonitrile; ESI in negative ion mode Acquisition in MRM mode | chlorogenic acid, B-type procyanidin dimer, (+)-catechin, B-type procyanidin dimer, (−)-epicatechin, propyl gallate, caffeic acid, (−)-epicatechin-3-gallate, and rutin | [43] |
| Trifolium pratense L. (Red Clover), dried leaves | MAE, 300 W, with MeOH at 70 °C | HPLC-ESI-MS/MS | Zorbax Eclipse XDB-C18 50 mm × 4.6 mm × 1.8 μm column; mobile phase: 0.05% aqueous formic acid and MeOH; ESI ionisation source in negative mode, acquisition in SRM | 43 phenolic including: genistein, daidzein, p-hydroxy-benzoic acid, caffeic acids, kaempferol 3-O-glucoside, quercetin 3-O-glucoside, hyperoside | [87] |
| Heartwood samples of Dalbergia odorifera (medicinal herbs in TCM); | UAE with 70% methanol (v/v) for 45 min | UHPLC–QqQ-MS/MS and UHPLC-Q/TOF-MS/MS | Acquity HSS T3 column (100 mm × 2.1 mm, 1.8 µm); mobile phase: ACNand water containing 0.05% formic acid ESI negative ion mode. Acquisition in MRM mode for QqQ analysis. | 17 flavonoids including: daidzein, dalbergin, 30-hydroxydaidein, liquiritigenin, isoliquiritigenin, alpinetin, butein, naringenin, butin, prunetin, eriodictyol, tectorigenin, pinocembrin, formononetin, genistein, sativanone | [88] |
| Green, black and oolong tea (Camellia sinensis) | Extraction at high temperature (80 °C) for 3 min with mild stirring | HPLC–QqQ-MS/MS | Capcell Pak C18 MGIII (2.0 mm × 100 mm, 3 m) column; ESI in positive and negative ion mode. Acquisition in MRM mode. | gallocatechin, epigallocatechin, catechin, epigallocatechin gallate, epicatechin, gallocatechin gallate, epicatechin gallate, catechin gallate, theaflavin, theaflavin-3-gallate, theaflavin-3′-gallate; theaflavin-3,3′-digallate. | [89] |
| Sour Guava (Psidium friedrichsthalianum Nied) lyophilized whole fruits | UAE of lyophilized fruits with acetone:water (7:3). The extract was submitted to successive partitions with ethyl ether, ethyl acetate, and N-butanol. | UPLC-ESI/QqQ-MS/MS | UPLC BEH C18-column (2.1 × 100 mm, 1.7 µm); mobile phase water/formic acid (99.9:0.1, v/v), and ACN/formic acid (99.9:0.1, v/v) ESI ionization source in negative mode. Acquisition in MRM | 22 phenolic compounds including several hydroxybenzoic, phenylacetic, and hydroxycinnamic acid derivatives | [90] |
| Barks of Connarus var. angustifolius, and leaves of Cecropia obtusa, Cecropia palmata and Mansoa alliacea; dried samples | UAE in 70% hydroethanolic, butanol/ethyl acetate, 4 h Butanol and ethyl acetate were evaporated at 40 °C | HPLC-ESI/QqQ-MS/MS | SB-C18 Rapid Resolution HD column (2.1 × 50 mm, 1.8 μm; mobile phase 0.1% acetic acid in water and ACN; ESI ionization source in negative mode Acquisition in MRM | gallic acid, catechin, caffeic acid, rutin, ferulic acid, quercitrin and resveratrol | [96] |
4.3. Analysis of Phenolic Compounds in Plants by GC-MS Using Derivatization Techniques
4.4. Metabolomic Analysis of Polyphenolc Using Nuclear Magnetic Resonance Spectroscopy
5. Conclusions
Author Contributions
Funding
Institutional Review Board Statement
Informed Consent Statement
Data Availability Statement
Conflicts of Interest
References
- Sun, Z.; Zuo, L.; Sun, T.; Tang, J.; Ding, D.; Zhou, L.; Kang, J.; Zhang, X. Chemical Profiling and Quantification of XueBiJing Injection, a Systematic Quality Control Strategy Using UHPLC-Q Exactive Hybrid Quadrupole-Orbitrap High-Resolution Mass Spectrometry. Sci. Rep. 2017, 7, 16921. [Google Scholar] [CrossRef]
- Pardo-Mates, N.; Vera, A.; Barbosa, S.; Hidalgo-Serrano, M.; Núñez, O.; Saurina, J.; Hernández-Cassou, S.; Puignou, L. Characterization, Classification and Authentication of Fruit-Based Extracts by Means of HPLC-UV Chromatographic Fingerprints, Polyphenolic Profiles and Chemometric Methods. Food Chem. 2017, 221, 29–38. [Google Scholar] [CrossRef]
- Baranowska, I.; Bajkacz, S. A New UHPLC-MS/MS Method for the Determination of Flavonoids in Supplements and DPPH-UHPLC-UV Method for the Evaluation of the Radical Scavenging Activity of Flavonoids. Food Chem. 2018, 256, 333–341. [Google Scholar] [CrossRef]
- Chen, L.-R.; Ko, N.-Y.; Chen, K.-H. Isoflavone Supplements for Menopausal Women: A Systematic Review. Nutrients 2019, 11, 2649. [Google Scholar] [CrossRef]
- Minatel, I.O.; Borges, C.V.; Ferreira, M.I.; Gomez, H.A.G.; Chen, C.-Y.O.; Lima, G.P.P. Phenolic Compounds: Functional Properties, Impact of Processing and Bioavailability. In Phenolic Compounds: Biological Activity; IntechOpen: London, UK, 2017; pp. 1–24. ISBN 978-953-51-2960-8. [Google Scholar] [CrossRef]
- Fraga, C.G.; Croft, K.D.; Kennedy, D.O.; Tomás-Barberán, F.A. The Effects of Polyphenols and Other Bioactives on Human Health. Food Funct. 2019, 10, 514–528. [Google Scholar] [CrossRef]
- Šatínský, D.; Jägerová, K.; Havlíková, L.; Solich, P. A New and Fast HPLC Method for Determination of Rutin, Troxerutin, Diosmin and Hesperidin in Food Supplements Using Fused-Core Column Technology. Food Anal. Methods 2013, 6, 1353–1360. [Google Scholar] [CrossRef]
- Bidlack, W.R.; Omaye, S.T.; Meskin, M.S.; Topham, D.K.W. Phytochemicals as Bioactive Agents; CRC Press: Boca Raton, FL, USA, 2000; ISBN 978-1-56676-788-0. [Google Scholar]
- Veeresham, C. Natural Products Derived from Plants as a Source of Drugs. J. Adv. Pharm. Technol. Res. 2012, 3, 200–201. Available online: https://www.japtr.org/article.asp?issn=2231-4040;year=2012;volume=3;issue=4;spage=200;epage=201;aulast=Veeresham (accessed on 5 April 2021). [CrossRef] [PubMed]
- Tomás-Barberán, F.A.; González-Sarrías, A.; García-Villalba, R. Dietary Polyphenols: Metabolism and Health Effects; John Wiley & Sons: Hoboken, NJ, USA, 2020; ISBN 978-1-119-56371-6. [Google Scholar]
- Kim, H.-S.; Quon, M.J.; Kim, J. New Insights into the Mechanisms of Polyphenols beyond Antioxidant Properties; Lessons from the Green Tea Polyphenol, Epigallocatechin 3-Gallate. Redox Biol. 2014, 2, 187–195. [Google Scholar] [CrossRef]
- Li, A.-N.; Li, S.; Zhang, Y.-J.; Xu, X.-R.; Chen, Y.-M.; Li, H.-B. Resources and Biological Activities of Natural Polyphenols. Nutrients 2014, 6, 6020–6047. [Google Scholar] [CrossRef]
- Granado-Lorencio, F.; Hernández-Alvarez, E. Functional Foods and Health Effects: A Nutritional Biochemistry Perspective. Curr. Med. Chem. 2016, 23, 2929–2957. [Google Scholar] [CrossRef]
- Sarian, M.N.; Ahmed, Q.U.; Mat So’ad, S.Z.; Alhassan, A.M.; Murugesu, S.; Perumal, V.; Syed Mohamad, S.N.A.; Khatib, A.; Latip, J. Antioxidant and Antidiabetic Effects of Flavonoids: A Structure-Activity Relationship Based Study. BioMed Res. Int. 2017, 2017, 8386065. [Google Scholar] [CrossRef]
- Goszcz, K.; Duthie, G.G.; Stewart, D.; Leslie, S.J.; Megson, I.L. Bioactive Polyphenols and Cardiovascular Disease: Chemical Antagonists, Pharmacological Agents or Xenobiotics That Drive an Adaptive Response? Br. J. Pharmacol. 2017, 174, 1209–1225. [Google Scholar] [CrossRef] [PubMed]
- Plaza, M.; Domínguez-Rodríguez, G.; Castro-Puyana, M.; Marina, M.L. 6—Polyphenols analysis and related challenges. In Polyphenols: Properties, Recovery, and Applications; Galanakis, C.M., Ed.; Woodhead Publishing: Cambridge, UK, 2018; pp. 177–232. ISBN 978-0-12-813572-3. [Google Scholar]
- European Pharmacopoeia (Ph. Eur.) 10th Edition|EDQM—European Directorate for the Quality of Medicines. Available online: https://www.edqm.eu/en/european-pharmacopoeia-ph-eur-10th-edition (accessed on 5 April 2021).
- Vural, N.; Cavuldak, Ö.A.; Anlı, R.E. Multi Response Optimisation of Polyphenol Extraction Conditions from Grape Seeds by Using Ultrasound Assisted Extraction (UAE). Sep. Sci. Technol. 2018, 53, 1540–1551. [Google Scholar] [CrossRef]
- Oreopoulou, A.; Tsimogiannis, D.; Oreopoulou, V. Chapter 15—Extraction of Polyphenols From Aromatic and Medicinal Plants: An Overview of the Methods and the Effect of Extraction Parameters. In Polyphenols in Plants, 2nd ed.; Watson, R.R., Ed.; Academic Press: Cambridge, MA, USA, 2019; pp. 243–259. ISBN 978-0-12-813768-0. [Google Scholar]
- López-Fernández, O.; Domínguez, R.; Pateiro, M.; Munekata, P.E.S.; Rocchetti, G.; Lorenzo, J.M. Determination of Polyphenols Using Liquid Chromatography–Tandem Mass Spectrometry Technique (LC–MS/MS): A Review. Antioxidants 2020, 9, 479. [Google Scholar] [CrossRef]
- Zhong, L.; Liu, Y.; Xiong, B.; Chen, L.; Zhang, Y.; Li, C. Optimization of Ultrasound-Assisted Extraction of Total Flavonoids from Dendranthema Indicum Var. Aromaticum by Response Surface Methodology. J. Anal. Methods Chem. 2019, 2019, e1648782. [Google Scholar] [CrossRef]
- Vallverdú-Queralt, A.; Regueiro, J.; Alvarenga, J.F.R.; Martinez-Huelamo, M.; Leal, L.N.; Lamuela-Raventos, R.M.; Vallverdú-Queralt, A.; Regueiro, J.; Alvarenga, J.F.R.; Martinez-Huelamo, M.; et al. Characterization of the Phenolic and Antioxidant Profiles of Selected Culinary Herbs and Spices: Caraway, Turmeric, Dill, Marjoram and Nutmeg. Food Sci. Technol. 2015, 35, 189–195. [Google Scholar] [CrossRef]
- Bajkacz, S.; Baranowska, I.; Buszewski, B.; Kowalski, B.; Ligor, M. Determination of Flavonoids and Phenolic Acids in Plant Materials Using SLE-SPE-UHPLC-MS/MS Method. Food Anal. Methods 2018, 11, 3563–3575. [Google Scholar] [CrossRef]
- Phenolics in Foods: Extraction, Analysis and Measurements|IntechOpen. Available online: https://www.intechopen.com/books/phenolic-compounds-natural-sources-importance-and-applications/phenolics-in-foods-extraction-analysis-and-measurements (accessed on 5 April 2021).
- Ameer, K.; Shahbaz, H.M.; Kwon, J.-H. Green Extraction Methods for Polyphenols from Plant Matrices and Their Byproducts: A Review. Compr. Rev. Food Sci. Food Saf. 2017, 16, 295–315. [Google Scholar] [CrossRef]
- Machado, A.P.D.F.; Pasquel-Reátegui, J.L.; Barbero, G.F.; Martínez, J. Pressurized Liquid Extraction of Bioactive Compounds from Blackberry (Rubus fruticosus L.) Residues: A Comparison with Conventional Methods. Food Res. Int. 2015, 77, 675–683. [Google Scholar] [CrossRef]
- Dahmoune, F.; Nayak, B.; Moussi, K.; Remini, H.; Madani, K. Optimization of Microwave-Assisted Extraction of Polyphenols from Myrtus communis L. Leaves. Food Chem. 2015, 166, 585–595. [Google Scholar] [CrossRef]
- Lovrić, V.; Putnik, P.; Bursać Kovačević, D.; Jukić, M.; Dragović-Uzelac, V. Effect of Microwave-Assisted Extraction on the Phenolic Compounds and Antioxidant Capacity of Blackthorn Flowers. Food Technol. Biotechnol. 2017, 55, 243–250. [Google Scholar] [CrossRef] [PubMed]
- Filip, S.; Pavlić, B.; Vidović, S.; Vladić, J.; Zeković, Z. Optimization of Microwave-Assisted Extraction of Polyphenolic Compounds from Ocimum Basilicum by Response Surface Methodology. Food Anal. Methods 2017, 10, 2270–2280. [Google Scholar] [CrossRef]
- Vázquez-Espinosa, M.; Espada-Bellido, E.; González de Peredo, A.V.; Ferreiro-González, M.; Carrera, C.; Palma, M.; Barroso, C.G.; Barbero, G.F. Optimization of Microwave-Assisted Extraction for the Recovery of Bioactive Compounds from the Chilean Superfruit (Aristotelia chilensis (Mol.) Stuntz). Agronomy 2018, 8, 240. [Google Scholar] [CrossRef]
- Kazemi, M.; Khodaiyan, F.; Labbafi, M.; Saeid Hosseini, S.; Hojjati, M. Pistachio Green Hull Pectin: Optimization of Microwave-Assisted Extraction and Evaluation of Its Physicochemical, Structural and Functional Properties. Food Chem. 2019, 271, 663–672. [Google Scholar] [CrossRef] [PubMed]
- Chaves, J.; Souza, M.; Silva, L.; Lachos Perez, D.; Torres Mayanga, P.; Machado, A.; Forster-Carneiro, T.; Vázquez Espinosa, M.; Velasco González de Peredo, A.; Barbero, G.; et al. Extraction of Flavonoids From Natural Sources Using Modern Techniques. Front. Chem. 2020, 8, 507887. [Google Scholar] [CrossRef] [PubMed]
- Calinescu, I.; Lavric, V.; Asofiei, I.; Gavrila, A.I.; Trifan, A.; Ighigeanu, D.; Martin, D.; Matei, C. Microwave Assisted Extraction of Polyphenols Using a Coaxial Antenna and a Cooling System. Chem. Eng. Process. Process. Intensif. 2017, 122, 373–379. [Google Scholar] [CrossRef]
- Cai, Z.; Qu, Z.; Lan, Y.; Zhao, S.; Ma, X.; Wan, Q.; Jing, P.; Li, P. Conventional, Ultrasound-Assisted, and Accelerated-Solvent Extractions of Anthocyanins from Purple Sweet Potatoes. Food Chem. 2016, 197, 266–272. [Google Scholar] [CrossRef]
- Viganó, J.; Brumer, I.Z.; Braga, P.A.D.C.; da Silva, J.K.; Maróstica Júnior, M.R.; Reyes Reyes, F.G.; Martínez, J. Pressurized Liquids Extraction as an Alternative Process to Readily Obtain Bioactive Compounds from Passion Fruit Rinds. Food Bioprod. Process. 2016, 100, 382–390. [Google Scholar] [CrossRef]
- Barrales, F.M.; Silveira, P.; Barbosa, P.D.P.M.; Ruviaro, A.R.; Paulino, B.N.; Pastore, G.M.; Macedo, G.A.; Martinez, J. Recovery of Phenolic Compounds from Citrus By-Products Using Pressurized Liquids—An Application to Orange Peel. Food Bioprod. Process. 2018, 112, 9–21. [Google Scholar] [CrossRef]
- Dobrinčić, A.; Repajić, M.; Garofulić, I.E.; Tuđen, L.; Dragović-Uzelac, V.; Levaj, B. Comparison of Different Extraction Methods for the Recovery of Olive Leaves Polyphenols. Processes 2020, 8, 1008. [Google Scholar] [CrossRef]
- Garcia-Mendoza, M.D.P.; Espinosa-Pardo, F.A.; Baseggio, A.M.; Barbero, G.F.; Maróstica Junior, M.R.; Rostagno, M.A.; Martínez, J. Extraction of Phenolic Compounds and Anthocyanins from Juçara (Euterpe edulis Mart.) Residues Using Pressurized Liquids and Supercritical Fluids. J. Supercrit. Fluids 2017, 119, 9–16. [Google Scholar] [CrossRef]
- Lachos-Perez, D.; Baseggio, A.M.; Torres-Mayanga, P.C.; Ávila, P.F.; Tompsett, G.A.; Marostica, M.; Goldbeck, R.; Timko, M.T.; Rostagno, M.; Martinez, J.; et al. Sequential Subcritical Water Process Applied to Orange Peel for the Recovery Flavanones and Sugars. J. Supercrit. Fluids 2020, 160, 104789. [Google Scholar] [CrossRef]
- Da Silva, R.P.F.F.; Rocha-Santos, T.A.P.; Duarte, A.C. Supercritical Fluid Extraction of Bioactive Compounds. TrAC Trends Anal. Chem. 2016, 76, 40–51. [Google Scholar] [CrossRef]
- King, J.W. Modern Supercritical Fluid Technology for Food Applications. Annu. Rev. Food Sci. Technol. 2014, 5, 215–238. [Google Scholar] [CrossRef]
- Cvjetko Bubalo, M.; Vidović, S.; Radojčić Redovniković, I.; Jokić, S. New Perspective in Extraction of Plant Biologically Active Compounds by Green Solvents. Food Bioprod. Process. 2018, 109, 52–73. [Google Scholar] [CrossRef]
- Zhu, Z.; Li, S.; He, J.; Thirumdas, R.; Montesano, D.; Barba, F.J. Enzyme-Assisted Extraction of Polyphenol from Edible Lotus (Nelumbo nucifera) Rhizome Knot: Ultra-Filtration Performance and HPLC-MS2 Profile. Food Res. Int. 2018, 111, 291–298. [Google Scholar] [CrossRef] [PubMed]
- De Franco, E.P.D.; Contesini, F.J.; da Silva, B.L.; Fernandes, A.M.A.P.; Leme, C.W.; Cirino, J.P.G.; Campos, P.R.B.; Carvalho, P.D.O. Enzyme-Assisted Modification of Flavonoids from Matricaria Chamomilla: Antioxidant Activity and Inhibitory Effect on Digestive Enzymes. J. Enzym. Inhib. Med. Chem. 2020, 35, 42–49. [Google Scholar] [CrossRef] [PubMed]
- Gligor, O.; Mocan, A.; Moldovan, C.; Locatelli, M.; Crișan, G.; Ferreira, I.C.F.R. Enzyme-Assisted Extractions of Polyphenols—A Comprehensive Review. Trends Food Sci. Technol. 2019, 88, 302–315. [Google Scholar] [CrossRef]
- Domínguez-Rodríguez, G.; Marina, M.L.; Plaza, M. Strategies for the Extraction and Analysis of Non-Extractable Polyphenols from Plants. J. Chromatogr. A 2017, 1514, 1–15. [Google Scholar] [CrossRef]
- Swer, T.L.; Mukhim, C.; Bashir, K.; Chauhan, K. Optimization of Enzyme Aided Extraction of Anthocyanins from Prunus nepalensis L. LWT 2018, 91, 382–390. [Google Scholar] [CrossRef]
- Xiao, J.; Chen, G.; Li, N. Ionic Liquid Solutions as a Green Tool for the Extraction and Isolation of Natural Products. Molecules 2018, 23, 1765. [Google Scholar] [CrossRef]
- Zhang, J.; Zong, A.; Xu, T.; Zhan, P.; Liu, L.; Qiu, B.; Liu, W.; Jia, M.; Du, F.; Tian, H. A Novel Method: Ionic Liquid-Based Ultrasound-Assisted Extraction of Polyphenols from Chinese Purple Yam. Nat. Prod. Res. 2018, 32, 863–866. [Google Scholar] [CrossRef]
- Magiera, S.; Sobik, A. Ionic Liquid-Based Ultrasound-Assisted Extraction Coupled with Liquid Chromatography to Determine Isoflavones in Soy Foods. J. Food Compos. Anal. 2017, 57, 94–101. [Google Scholar] [CrossRef]
- Sun, Y.; Li, W.; Wang, J. Ionic Liquid Based Ultrasonic Assisted Extraction of Isoflavones from Iris Tectorum Maxim and Subsequently Separation and Purification by High-Speed Counter-Current Chromatography. J. Chromatogr. B 2011, 879, 975–980. [Google Scholar] [CrossRef] [PubMed]
- Wang, M.; Wang, J.; Zhou, Y.; Zhang, M.; Xia, Q.; Chen, D.Y. Ecofriendly Mechanochemical Extraction of Bioactive Compounds from Plants with Deep Eutectic Solvents. ACS Sustain. Chem. Eng. 2017, 5, 6297–6303. [Google Scholar] [CrossRef]
- Izadiyan, P.; Hemmateenejad, B. Multi-Response Optimization of Factors Affecting Ultrasonic Assisted Extraction from Iranian Basil Using Central Composite Design. Food Chem. 2016, 190, 864–870. [Google Scholar] [CrossRef]
- Fumic, B.; Jug, M.; Koncic, M.Z. Multi-Response Optimization of Ultrasound-Assisted Extraction of Bioactive Components from Medicago sativa L. Croat. Chem. Acta 2017, 90, 481–492. [Google Scholar] [CrossRef]
- Skrypnik, L.; Novikova, A. Response Surface Modeling and Optimization of Polyphenols Extraction from Apple Pomace Based on Nonionic Emulsifiers. Agronomy 2020, 10, 92. [Google Scholar] [CrossRef]
- Rodrigues, S.; Fernandes, F.A.N.; de Brito, E.S.; Sousa, A.D.; Narain, N. Ultrasound Extraction of Phenolics and Anthocyanins from Jabuticaba Peel. Ind. Crops Prod. 2015, 69, 400–407. [Google Scholar] [CrossRef]
- Collison, M.W. Determination of Total Soy Isoflavones in Dietary Supplements, Supplement Ingredients, and Soy Foods by High-Performance Liquid Chromatography with Ultraviolet Detection: Collaborative Study. J. AOAC Int. 2008, 91, 489–500. [Google Scholar] [CrossRef]
- Köseoğlu Yılmaz, P.; Kolak, U. SPE-HPLC Determination of Chlorogenic and Phenolic Acids in Coffee. J. Chromatogr. Sci. 2017, 55, 712–718. [Google Scholar] [CrossRef] [PubMed]
- Ruiz, A.; Sanhueza, M.; Gómez, F.; Tereucán, G.; Valenzuela, T.; García, S.; Cornejo, P.; Hermosín-Gutiérrez, I. Changes in the Content of Anthocyanins, Flavonols, and Antioxidant Activity in Fragaria Ananassa Var. Camarosa Fruits under Traditional and Organic Fertilization. J. Sci. Food Agric. 2019, 99, 2404–2410. [Google Scholar] [CrossRef] [PubMed]
- Ding, M.; Bai, Y.; Li, J.; Yang, X.; Wang, H.; Gao, X.; Chang, Y. A Diol-Based-Matrix Solid-Phase Dispersion Method for the Simultaneous Extraction and Determination of 13 Compounds From Angelicae Pubescentis Radix by Ultra High-Performance Liquid Chromatography. Front. Pharmacol. 2019, 10, 227. [Google Scholar] [CrossRef]
- Senes, C.E.R.; Nicácio, A.E.; Rodrigues, C.A.; Manin, L.P.; Maldaner, L.; Visentainer, J.V. Evaluation of Dispersive Solid-Phase Extraction (d-SPE) as a Clean-up Step for Phenolic Compound Determination of Myrciaria Cauliflora Peel. Food Anal. Methods 2020, 13, 155–165. [Google Scholar] [CrossRef]
- Aguiar, J.; Gonçalves, J.L.; Alves, V.L.; Câmara, J.S. Chemical Fingerprint of Free Polyphenols and Antioxidant Activity in Dietary Fruits and Vegetables Using a Non-Targeted Approach Based on QuEChERS Ultrasound-Assisted Extraction Combined with UHPLC-PDA. Antioxidants 2020, 9, 305. [Google Scholar] [CrossRef] [PubMed]
- Nicácio, A.E.; Rodrigues, C.A.; Jardim, I.C.S.F.; Visentainer, J.V.; Maldaner, L. Modified QuEChERS Method for Phenolic Compounds Determination in Mustard Greens (Brassica juncea) Using UHPLC-MS/MS. Arab. J. Chem. 2020, 13, 4681–4690. [Google Scholar] [CrossRef]
- Gleichenhagen, M.; Schieber, A. Current Challenges in Polyphenol Analytical Chemistry. Curr. Opin. Food Sci. 2016, 7, 43–49. [Google Scholar] [CrossRef]
- Fotovvat, M.; Radjabian, T.; Saboora, A. HPLC Fingerprint of Important Phenolic Compounds in Some Salvia L. Species from Iran. Rec. Nat. Prod. 2018, 13. [Google Scholar] [CrossRef]
- Lei, Y.; Wang, Y.; Sun, Z.; Lin, M.; Cai, X.; Huang, D.; Luo, K.; Tan, S.; Zhang, Y.; Yan, J.; et al. Quantitative Analysis of Multicomponents by Single Marker Combined with HPLC Fingerprint Qualitative Analyses for Comprehensive Evaluation of Aurantii Fructus. J. Sep. Sci. 2020, 43, 1382–1392. [Google Scholar] [CrossRef]
- Yang, F.; Chu, T.; Zhang, Y.; Liu, X.; Sun, G.; Chen, Z. Quality Assessment of Licorice (Glycyrrhiza glabra L.) from Different Sources by Multiple Fingerprint Profiles Combined with Quantitative Analysis, Antioxidant Activity and Chemometric Methods. Food Chem. 2020, 324, 126854. [Google Scholar] [CrossRef]
- FDA. Guidance for Industry Botanical Drug Products; Center for Drug Evaluation and Research (CDER); Food and Drug Administration: Silver Spring, MD, USA, 2016; p. 34.
- SFDA State Drug Administration of China. Requirements for Studying Fingerprint of Traditional Chinese Medicine Injection (Draft). Chin. Tradit. Pat. Med. 2000, 22, 671–675. [Google Scholar]
- WHO. WHO Traditional Medicine Strategy 2002–2005; WHO: Geneva, Switzerland, 2002. [Google Scholar]
- Yu, S.; Zhu, L.; Xiao, Z.; Shen, J.; Li, J.; Lai, H.; Li, J.; Chen, H.; Zhao, Z.; Yi, T. Rapid Fingerprint Analysis of Flos Carthami by Ultra-Performance Liquid Chromatography and Similarity Evaluation. J. Chromatogr. Sci. 2016, 54, 1619–1624. [Google Scholar] [CrossRef] [PubMed]
- Viapiana, A.; Struck-Lewicka, W.; Konieczynski, P.; Wesolowski, M.; Kaliszan, R. An Approach Based on HPLC-Fingerprint and Chemometrics to Quality Consistency Evaluation of Matricaria chamomilla L. Commercial Samples. Front. Plant Sci. 2016, 7, 1561. [Google Scholar] [CrossRef] [PubMed]
- Hawrył, A.; Hawrył, M.; Waksmundzka-Hajnos, M. Liquid Chromatography Fingerprint Analysis and Antioxidant Activity of Selected Lavender Species with Chemometric Calculations. PLoS ONE 2019, 14, e0218974. [Google Scholar] [CrossRef] [PubMed]
- Bansal, A.; Chhabra, V.; Rawal, R.K.; Sharma, S. Chemometrics: A New Scenario in Herbal Drug Standardization. J. Pharm. Anal. 2014, 4, 223–233. [Google Scholar] [CrossRef]
- Li, J.; He, X.; Li, M.; Zhao, W.; Liu, L.; Kong, X. Chemical Fingerprint and Quantitative Analysis for Quality Control of Polyphenols Extracted from Pomegranate Peel by HPLC. Food Chem. 2015, 176, 7–11. [Google Scholar] [CrossRef]
- Liu, D.; Mei, Q.; Long, W.; Wan, X.; Wan, D.; Wang, L. HPLC Fingerprint Analysis and Content Determination of Extract with Anticancer Activities of Sedi Linearis Herba. Pharmacogn. J. 2017, 9, 128–134. [Google Scholar] [CrossRef]
- Pan, H.-B.; Zhang, D.; Li, B.; Wu, Y.-Y.; Tu, Y.-Y. A Rapid UPLC Method for Simultaneous Analysis of Caffeine and 13 Index Polyphenols in Black Tea. J. Chromatogr. Sci. 2017, 55, 495–496. [Google Scholar] [CrossRef]
- Viapiana, A.; Wesolowski, M. HPLC Fingerprint Combined with Quantitation of Phenolic Compounds and Chemometrics as an Efficient Strategy for Quality Consistency Evaluation of Sambucus Nigra Berries. Nat. Prod. Commun. 2016, 11, 1449–1454. [Google Scholar] [CrossRef]
- Li, W.; Zhang, X.; Chen, R.; Li, Y.; Miao, J.; Liu, G.; Lan, Y.; Chen, Y.; Cao, Y. HPLC Fingerprint Analysis of Phyllanthus Emblica Ethanol Extract and Their Antioxidant and Anti-Inflammatory Properties. J. Ethnopharmacol. 2020, 254, 112740. [Google Scholar] [CrossRef]
- Barreira, J.C.M.; Visnevschi-Necrasov, T.; Nunes, E.; Cunha, S.C.; Pereira, G.; Oliveira, M.B.P.P. Medicago Spp. as Potential Sources of Bioactive Isoflavones: Characterization According to Phylogenetic and Phenologic Factors. Phytochemistry 2015, 116, 230–238. [Google Scholar] [CrossRef] [PubMed]
- Ojo, O.A.; Ojo, A.B.; Ajiboye, B.O.; Olaiya, O.; Okesola, M.A.; Boligon, A.A.; de Campos, M.M.A.; Oyinloye, B.E.; Kappo, A.P. HPLC-DAD Fingerprinting Analysis, Antioxidant Activities of Tithonia diversifolia (Hemsl.) A. Gray Leaves and Its Inhibition of Key Enzymes Linked to Alzheimer’s Disease. Toxicol. Rep. 2018, 5, 585–592. [Google Scholar] [CrossRef] [PubMed]
- Wu, L.; Wu, W.; Cai, Y.; Li, C.; Wang, L. HPLC Fingerprinting-Based Multivariate Analysis of Phenolic Compounds in Mango Leaves Varieties: Correlation to Their Antioxidant Activity and in Silico α-Glucoidase Inhibitory Ability. J. Pharm. Biomed. Anal. 2020, 191, 113616. [Google Scholar] [CrossRef] [PubMed]
- Cacciola, F.; Farnetti, S.; Dugo, P.; Marriott, P.J.; Mondello, L. Comprehensive Two-Dimensional Liquid Chromatography for Polyphenol Analysis in Foodstuffs. J. Sep. Sci. 2017, 40, 7–24. [Google Scholar] [CrossRef] [PubMed]
- Llorent-Martínez, E.J.; Molina-García, L.; Ruiz-Medina, A.; Ortega-Barrales, P. Quantitation of Selected Polyphenols in Plant-Based Food Supplements by Liquid Chromatography–Ion Trap Mass Spectrometry. Food Anal. Methods 2014, 7, 2177–2183. [Google Scholar] [CrossRef]
- Huang, F.-Q.; Dong, X.; Yin, X.; Fan, Y.; Fan, Y.; Mao, C.; Zhou, W. A Mass Spectrometry Database for Identification of Saponins in Plants. J. Chromatogr. A 2020, 1625, 461296. [Google Scholar] [CrossRef]
- Kang, J.; Hick, L.A.; Price, W.E. A Fragmentation Study of Isoflavones in Negative Electrospray Ionization by MSn Ion Trap Mass Spectrometry and Triple Quadrupole Mass Spectrometry. Rapid Commun. Mass Spectrom. 2007, 21, 857–868. [Google Scholar] [CrossRef]
- Vlaisavljević, S.; Kaurinović, B.; Popović, M.; Vasiljević, S. Profile of Phenolic Compounds in Trifolium Pratense L. Extracts at Different Growth Stages and Their Biological Activities. Int. J. Food Prop. 2017, 20, 3090–3101. [Google Scholar] [CrossRef]
- Zhao, X.; Zhang, S.; Liu, D.; Yang, M.; Wei, J. Analysis of Flavonoids in Dalbergia Odorifera by Ultra-Performance Liquid Chromatography with Tandem Mass Spectrometry. Molecules 2020, 25, 389. [Google Scholar] [CrossRef]
- Tao, W.; Zhou, Z.; Zhao, B.; Wei, T. Simultaneous Determination of Eight Catechins and Four Theaflavins in Green, Black and Oolong Tea Using New HPLC-MS-MS Method. J. Pharm. Biomed. Anal. 2016, 131, 140–145. [Google Scholar] [CrossRef]
- Cuadrado-Silva, C.T.; Pozo-Bayón, M.Á.; Osorio, C. Targeted Metabolomic Analysis of Polyphenols with Antioxidant Activity in Sour Guava (Psidium friedrichsthalianum Nied.) Fruit. Molecules 2016, 22, 11. [Google Scholar] [CrossRef] [PubMed]
- Gao, X.; Wang, N.; Jia, J.; Wang, P.; Zhang, A.; Qin, X. Chemical Profliling of Dingkun Dan by Ultra High Performance Liquid Chromatography Q Exactive Orbitrap High Resolution Mass Spectrometry. J. Pharm. Biomed. Anal. 2020, 177, 112732. [Google Scholar] [CrossRef]
- Demarque, D.P.; Crotti, A.E.M.; Vessecchi, R.; Lopes, J.L.C.; Lopes, N.P. Fragmentation Reactions Using Electrospray Ionization Mass Spectrometry: An Important Tool for the Structural Elucidation and Characterization of Synthetic and Natural Products. Nat. Prod. Rep. 2016, 33, 432–455. [Google Scholar] [CrossRef] [PubMed]
- Schmidt, J. Negative Ion Electrospray High-Resolution Tandem Mass Spectrometry of Polyphenols. J. Mass Spectrom. 2016, 51, 33–43. [Google Scholar] [CrossRef]
- March, R.E.; Miao, X.-S.; Metcalfe, C.D.; Stobiecki, M.; Marczak, L. A Fragmentation Study of an Isoflavone Glycoside, Genistein-7-O-Glucoside, Using Electrospray Quadrupole Time-of-Flight Mass Spectrometry at High Mass Resolution. Int. J. Mass Spectrom. 2004, 232, 171–183. [Google Scholar] [CrossRef]
- Fabre, N.; Rustan, I.; de Hoffmann, E.; Quetin-Leclercq, J. Determination of Flavone, Flavonol, and Flavanone Aglycones by Negative Ion Liquid Chromatography Electrospray Ion Trap Mass Spectrometry. J. Am. Soc. Mass Spectrom. 2001, 12, 707–715. [Google Scholar] [CrossRef]
- Pires, F.B.; Dolwitsch, C.B.; Dal Prá, V.; Faccin, H.; Monego, D.L.; de Carvalho, L.M.; Viana, C.; Lameira, O.; Lima, F.O.; Bressan, L.; et al. Qualitative and Quantitative Analysis of the Phenolic Content of Connarus Var. Angustifolius, Cecropia Obtusa, Cecropia Palmata and Mansoa Alliacea Based on HPLC-DAD and UHPLC-ESI-MS/MS. Rev. Bras. Farmacogn. 2017, 27, 426–433. [Google Scholar] [CrossRef]
- Marczak, Ł.; Znajdek-Awiżeń, P.; Bylka, W. The Use of Mass Spectrometric Techniques to Differentiate Isobaric and Isomeric Flavonoid Conjugates from Axyris Amaranthoides. Molecules 2016, 21, 1229. [Google Scholar] [CrossRef] [PubMed]
- Frański, R.; Gierczyk, B.; Kozik, T.; Popenda, Ł.; Beszterda, M. Signals of Diagnostic Ions in the Product Ion Spectra of [M − H]− Ions of Methoxylated Flavonoids. Rapid Commun. Mass Spectrom. 2019, 33, 125–132. [Google Scholar] [CrossRef]
- Sun, Y.; Li, L.; Liao, M.; Su, M.; Wan, C.; Zhang, L.; Zhang, H. A Systematic Data Acquisition and Mining Strategy for Chemical Profiling of Aster tataricus Rhizoma (Ziwan) by UHPLC-Q-TOF-MS and the Corresponding Anti-Depressive Activity Screening. J. Pharm. Biomed. Anal. 2018, 154, 216–226. [Google Scholar] [CrossRef]
- Simirgiotis, M.J.; Quispe, C.; Mocan, A.; Villatoro, J.M.; Areche, C.; Bórquez, J.; Sepúlveda, B.; Echiburu-Chau, C. UHPLC High Resolution Orbitrap Metabolomic Fingerprinting of the Unique Species Ophryosporus Triangularis Meyen from the Atacama Desert, Northern Chile. Rev. Bras. Farmacogn. 2017, 27, 179–187. [Google Scholar] [CrossRef]
- López-Gutiérrez, N.; Romero-González, R.; Plaza-Bolaños, P.; Martínez Vidal, J.L.; Garrido Frenich, A. Identification and Quantification of Phytochemicals in Nutraceutical Products from Green Tea by UHPLC-Orbitrap-MS. Food Chem. 2015, 173, 607–618. [Google Scholar] [CrossRef]
- Lee, Y.H.; Kim, B.; Kim, S.; Kim, M.-S.; Kim, H.; Hwang, S.-R.; Kim, K.; Lee, J.H. Characterization of Metabolite Profiles from the Leaves of Green Perilla (Perilla frutescens) by Ultra High Performance Liquid Chromatography Coupled with Electrospray Ionization Quadrupole Time-of-Flight Mass Spectrometry and Screening for Their Antioxidant Properties. J. Food Drug Anal. 2017, 25, 776–788. [Google Scholar] [CrossRef]
- Abdulla, R.; Mansur, S.; Lai, H.; Ubul, A.; Sun, G.; Huang, G.; Aisa, H.A. Qualitative Analysis of Polyphenols in Macroporous Resin Pretreated Pomegranate Husk Extract by HPLC-QTOF-MS. Phytochem. Anal. PCA 2017, 28, 465–473. [Google Scholar] [CrossRef] [PubMed]
- Rocchetti, G.; Chiodelli, G.; Giuberti, G.; Ghisoni, S.; Baccolo, G.; Blasi, F.; Montesano, D.; Trevisan, M.; Lucini, L. UHPLC-ESI-QTOF-MS Profile of Polyphenols in Goji Berries (Lycium barbarum L.) and Its Dynamics during in Vitro Gastrointestinal Digestion and Fermentation. J. Funct. Foods 2018, 40, 564–572. [Google Scholar] [CrossRef]
- Wang, Z.; Qu, Y.; Wang, L.; Zhang, X.; Xiao, H. Ultra-High Performance Liquid Chromatography with Linear Ion Trap-Orbitrap Hybrid Mass Spectrometry Combined with a Systematic Strategy Based on Fragment Ions for the Rapid Separation and Characterization of Components in Stellera Chamaejasme Extracts. J. Sep. Sci. 2016, 39, 1379–1388. [Google Scholar] [CrossRef] [PubMed]
- Ben Said, R.; Hamed, A.I.; Mahalel, U.A.; Al-Ayed, A.S.; Kowalczyk, M.; Moldoch, J.; Oleszek, W.; Stochmal, A. Tentative Characterization of Polyphenolic Compounds in the Male Flowers of Phoenix Dactylifera by Liquid Chromatography Coupled with Mass Spectrometry and DFT. Int. J. Mol. Sci. 2017, 18, 512. [Google Scholar] [CrossRef]
- Ben Haj Yahia, I.; Zaouali, Y.; Ciavatta, M.L.; Ligresti, A.; Jaouadi, R.; Boussaid, M.; Cutignano, A. Polyphenolic Profiling, Quantitative Assessment and Biological Activities of Tunisian Native Mentha rotundifolia (L.) Huds. Molecules 2019, 24, 2351. [Google Scholar] [CrossRef] [PubMed]
- Ma, X.; Guo, X.; Song, Y.; Qiao, L.; Wang, W.; Zhao, M.; Tu, P.; Jiang, Y. An Integrated Strategy for Global Qualitative and Quantitative Profiling of Traditional Chinese Medicine Formulas: Baoyuan Decoction as a Case. Sci. Rep. 2016, 6, 38379. [Google Scholar] [CrossRef]
- Kang, K.B.; Woo, S.; Ernst, M.; van der Hooft, J.J.J.; Nothias, L.-F.; da Silva, R.R.; Dorrestein, P.C.; Sung, S.H.; Lee, M. Assessing Specialized Metabolite Diversity of Alnus Species by a Digitized LC–MS/MS Data Analysis Workflow. Phytochemistry 2020, 173, 112292. [Google Scholar] [CrossRef]
- Chiriac, E.R.; Chiţescu, C.L.; Borda, D.; Lupoae, M.; Gird, C.E.; Geană, E.-I.; Blaga, G.-V.; Boscencu, R. Comparison of the Polyphenolic Profile of Medicago Sativa L. and Trifolium Pratense L. Sprouts in Different Germination Stages Using the UHPLC-Q Exactive Hybrid Quadrupole Orbitrap High-Resolution Mass Spectrometry. Molecules 2020, 25, 2321. [Google Scholar] [CrossRef]
- D’Urso, G.; Montoro, P.; Piacente, S. Detection and Comparison of Phenolic Compounds in Different Extracts of Black Currant Leaves by Liquid Chromatography Coupled with High-Resolution ESI-LTQ-Orbitrap MS and High-Sensitivity ESI-Qtrap MS. J. Pharm. Biomed. Anal. 2020, 179, 112926. [Google Scholar] [CrossRef] [PubMed]
- Heras, R.M.-L.; Quifer-Rada, P.; Andrés, A.; Lamuela-Raventós, R. Polyphenolic Profile of Persimmon Leaves by High Resolution Mass Spectrometry (LC-ESI-LTQ-Orbitrap-MS). J. Funct. Foods 2016, 23, 370–377. [Google Scholar] [CrossRef]
- Simirgiotis, M.J.; Quispe, C.; Areche, C.; Sepúlveda, B. Phenolic Compounds in Chilean Mistletoe (Quintral, Tristerix Tetrandus) Analyzed by UHPLC-Q/Orbitrap/MS/MS and Its Antioxidant Properties. Molecules 2016, 21, 245. [Google Scholar] [CrossRef] [PubMed]
- Zhou, J.; Li, Y.; Chen, X.; Zhong, L.; Yin, Y. Development of Data-Independent Acquisition Workflows for Metabolomic Analysis on a Quadrupole-Orbitrap Platform. Talanta 2017, 164, 128–136. [Google Scholar] [CrossRef]
- Xu, L.; Liu, Y.; Wu, H.; Wu, H.; Liu, X.; Zhou, A. Rapid Identification of Chemical Profile in Gandou Decoction by UPLC-Q-TOF-MSE Coupled with Novel Informatics UNIFI Platform. J. Pharm. Anal. 2020, 10, 35–48. [Google Scholar] [CrossRef]
- Guo, X.; Long, P.; Meng, Q.; Ho, C.-T.; Zhang, L. An Emerging Strategy for Evaluating the Grades of Keemun Black Tea by Combinatory Liquid Chromatography-Orbitrap Mass Spectrometry-Based Untargeted Metabolomics and Inhibition Effects on α-Glucosidase and α-Amylase. Food Chem. 2018, 246, 74–81. [Google Scholar] [CrossRef] [PubMed]
- Ahmad, N.; Zuo, Y.; Lu, X.; Anwar, F.; Hameed, S. Characterization of Free and Conjugated Phenolic Compounds in Fruits of Selected Wild Plants. Food Chem. 2016, 190, 80–89. [Google Scholar] [CrossRef] [PubMed]
- Marsol-Vall, A.; Balcells, M.; Eras, J.; Canela-Garayoa, R. Injection-Port Derivatization Coupled to GC-MS/MS for the Analysis of Glycosylated and Non-Glycosylated Polyphenols in Fruit Samples. Food Chem. 2016, 204, 210–217. [Google Scholar] [CrossRef]
- Pakkirisamy, M.; Kalakandan, S.; Ravichandran, K.; Ravichandran, K. Phytochemical Screening, GC-MS, FT-IR Analysis of Methanolic Extract of Curcuma Caesia Roxb (Black Turmeric). Pharmacogn. J. 2017, 9, 952–956. [Google Scholar] [CrossRef]
- Sharma, S.; Saxena, D.C.; Riar, C.S. Using Combined Optimization, GC-MS and Analytical Technique to Analyze the Germination Effect on Phenolics, Dietary Fibers, Minerals and GABA Contents of Kodo Millet (Paspalum scrobiculatum). Food Chem. 2017, 233, 20–28. [Google Scholar] [CrossRef] [PubMed]
- Sagbo, I.J.; Orock, A.E.; Kola, E.; Otang-Mbeng, W. Phytochemical Screening and Gas Chromatography-Mass Spectrometry Analysis of Ethanol Extract of Scambiosa columbabria L. Pharmacogn. Res. 2020, 12, 35. [Google Scholar] [CrossRef]
- Rohloff, J. Analysis of Phenolic and Cyclic Compounds in Plants Using Derivatization Techniques in Combination with GC-MS-Based Metabolite Profiling. Molecules 2015, 20, 3431–3462. [Google Scholar] [CrossRef] [PubMed]
- Da Silva, F.M.A.; Hanna, A.C.S.; de Souza, A.A.; da Silva Filho, F.A.; Canhoto, O.M.F.; Magalhães, A.; Benevides, P.J.C.; de Azevedo, M.B.M.; Siani, A.C.; Pohlit, A.M.; et al. Integrative Analysis Based on HPLC-DAD-MS/MS and NMR of Bertholletia Excelsa Bark Biomass Residues:Determination of Ellagic Acid Derivatives. J. Braz. Chem. Soc. 2019, 30, 830–836. [Google Scholar] [CrossRef]
- Der Kooy, F.V.; Venkataya, B.; Pearson, J.L.; Torres, A.; Li, C.G.; Chang, D. Sensitivity of NMR-Based Metabolomics in Drug Discovery from Medicinal Plants. Eur. J. Med. Plants 2015, 191–203. [Google Scholar] [CrossRef]
- Valli, M.; Russo, H.M.; Pilon, A.C.; Pinto, M.E.F.; Dias, N.B.; Freire, R.T.; Castro-Gamboa, I.; Bolzani, V.D.S. Computational Methods for NMR and MS for Structure Elucidation II: Database Resources and Advanced Methods. Phys. Sci. Rev. 2019, 4. [Google Scholar] [CrossRef]


| Plant Material | Extraction | HPLC Condition | Characteristic Fingerprint Peaks | Chemometric Analysis Approach | Ref. |
|---|---|---|---|---|---|
| Cranberry (Vaccinium macrocarpon)-based products (fresh and dried fruits, juice) | Lyophilized samples were extracted with an acetone:water:hydrochloric acid (70:29.9:0.1 v/v/v) solution by UAE for 10 min | Kinetex C18 (100 4.6 mm i.d., 2.6 µm particle size) column; mobile phase: 0.1% formic acid in water (v/v) and MeOH; flow rate of 1 mL/min; monitoring wavelength range: 190–550 nm | gallic acid, homogentisic acid, protocatechuic acid, protocatechualdehyde, (+) catechin hydrate, gentilic acid, p-salicilic acid, chlorogenic acid, vanillic acid, (−) epicatechin, syringic acid, syringaldehyde, ethyl gallate, p-coumaric acid, ferulic acid, resveratrol and quercitrin | Partial least square regression and PCA | [2] |
| 27 Salvia L. Species, leaf and root | Maceration in MeOH (2 × 10 mL for 24 h) followed by solvents removal on rotary evaporator under vacuum at 40 °C to dryness | RP C18 Eurospher-100 column, (5 µm particle, 125 mm × 4 mm); mobile phase: 0.2% (v/v) glacial acetic acid in water and ACN; flow rate of 1 mL/min; monitoring wavelength: 280 nm | rosmarinic acid, carnosic acid, caffeic acid, salvianolic acids A and B | PCA | [65] |
| Aurantii Fructus, dried mature and imature fruits of Citrus aurantium L. (medicinal herbs in TCM); | UAE (200 W) with MEOH for 45 min | Symmetry C18 column (250 × 4.6 mm, 5 μm); mobile phase: ACN and 0.1% aqueous phosphoric acid; flow rate of 1 mL/min; monitoring wavelength range: 285–324 nm | eriocitrin, neoeriocitrin, narirutin, naringin, hesperidin, neohesperidin, meranzin, poncirin, naringenin, nobiletin, tangeretin and auraptene | Quantitative analysis of multiple components by single marker (QAMS); similarity analysis; standard method difference; HCA | [66] |
| Licorice root (Liquiritiae radix) -Glycyrrhiza glabra L. | UAE with 80% MeOH-water, 120 W, 40 KHZ, 20 min | Cosmosil column (5C18-MS-II, 5 µm, 4.6 × 250 mm), at 35 °C; mobile phase: 5 mmol/L sodium heptane sulfonate solution phosphoric acid (499:1, v/v) and ACN-MeOH (9:1, v/v); flow rate of 1 mL/min; monitoring wavelengths: 203 nm, 220 nm, 250 nm, 280 nm and 344 nm | glycyrrhizic acid, liquiritigenin, isoliquiritigenin, isoliquiritin, liquiritin apioside, isoliquiritin apioside and glabridin | Geometric linear quantified fingerprint method (GLQFM) and PCA | [67] |
| Flos Carthami, the dried flower of Carthamus tinctorius L.; (medicinal herbs in TCM) | UAE with 50% MeOH, 270 W, 30 min | C18 column (4.6 mm × 250 mm, 5 μm); mobile phase: 0.1% formic acid in water and ACN | guanosine, hydroxysafflor yellow A, anhydrosafflor yellow B, kaempferol 3-O-β-rutinoside, rutin, quercetin, kaempferol | Similarity Evaluation System for Chromatographic Fingerprint of Traditional Chinese Medicine (Version 2004 A) | [71] |
| Chamomile—Matricaria chamomilla L., commercial samples | UAE with MeOH:water mixture (80:20, v/v) at 35 °C for 30 min, three times repeated | Hypersil Gold C18 column (250 × 4.6 mm; 5 μm) at 35 °C; mobile phase: 0.05% TFA in ACN and 0.05% TFA in water; flow rate of 1 mL/min; monitoring wavelength: 254 nm | gallic acid, caffeic acid, syringic acid, p-coumaric acid, ferulic acid, rutin, myricetin, quercetin and kaempferol | ANOVA, PCA, hierarchical cluster analysis (HCA) | [72] |
| Seven species of Lavandulae flos | UAE with xylen (1:30) under reflux for 4 h followed by solvents removal on a rotary evaporator under vacuum to dryness | Kinetex RP18 column (5 μm, 150 × 4.6 mm); mobile phase: MeOHwater–0.1% formic acid (gradient 5–100% (v/v) of MEOH) at 30 °C; flow rate of 1 mL/min; monitoring wavelength: 280 nm | apigenin, myricetin, luteolin, luteolin 7-glucoside, chlorogenic acid, caffeic acid, ferulic acid | Cluster analysis using SpecAlign program (Pearson correlation coefficient, r, and Euclidean) and PCA | [73] |
| Pomegranate (Punica granatum L.), dried peel | UAE of the dried samples with 60% ethanol, 26 min | Zorbax SB-C18 column (5 μm, 4.6 mm × 250 mm); mobile phase: glacial acetic acid (99:1, v/v; pH 3.0) and MeOH flow rate of 1 mL/min; monitoring wavelength: 280 nm | gallic acid, punicalagin, catechin, chlorogenic acid, caffeic acid, epicatechin, rutin, and ellagic acid | Similarity Evaluation System for Chromatographic; Fingerprint of Traditional Chinese Medicine (Version 2004A) software | [75] |
| Sedi linearis Herba, dried whole herb | UAE of the dried samples with 70% methanol, 60 min | BDS Hypersil C18 column (4.6 m × 250 mm, 5 μm), 30 °C; Mobile phase: ACN and 0.1% acetic acid solution; flow rate of 1 mL/min; monitoring wavelength: 265 nm | hyperoside, isoquercetin and astragalin | - | [76] |
| Black tea samples | Enzymatic extraction using immobilized polyphenol oxidase followed by fractionating using a Mitsubishi SP-207 resin chromatography with an elution gradient of 20%, 30%, 40%, 50% and 70% aqueous ethanol | C18 column; mobile phase: water: ACN: glacial acetic acid (73.5/26/0.5, v/v/v); flow rate of 5 mL/min | caffeine, (−) epigallocatechin gallate, (−) epigallocatechin, (−) epicatechin gallate, (−) epicatechin, (+) gallocatechin gallate, (+) gallocatechin, (+) catechin gallate, (+) catechin, theaflavin, theaflavin 3-monogallate, theaflavin 3′-monogallate and theaflavin 3,3′-digallate | - | [77] |
| Raw elderberry (Sambucus nigra L.) | UAE of the dried samples with 80% methanol, 45 min | C18 column, 35 °C, mobile phase: MeOH and acetic acid in water (1.0%, v/v); flow rate of 1 mL/min; monitoring wavelength: 285 nm | gallic acid, chlorogenic acid, caffeic acid, syringic acid, pcoumaric acid, ferulic acid, rutin, myricetin, quercetin kaempferol and quercetin 3-glucoside | HCA and PCA | [78] |
| Phyllanthus emblica, dried fruits | Fruit powder was extracted in 70% ethanol (1:8) at 50 °C using a magnetic stirrer | DiKMA C18 column (250 mm × 4.6 mm × 5 μm); mobile phase: 0.2% formic acid in water and methanol; flow rate of 1 mL/min; Monitoring wavelength: 273 nm | gallic acid, corilagin, ellagic acid, quercetin | Similarity Evaluation System for Chromatographic Fingerprints of Traditional Chinese Medicine (Version, 2004A) and HCA | [79] |
| Medicago spp. in different phenologic stages: vegetative elongation, late bud and late flower; dried leaves | MSPD extraction using C18 column. Elution with methanol: H2O (9:1, v/v) | Luna 5 U C18 column (5 μm, 150 × 4.60 mm) at 40 °C; mobile phase: acetonitrile and acetic acid in water (1.0%, v/v); flow rate of 1 mL/min; monitoring wavelength: 254 nm | puerarin, daidzin, genistin, daidzein, glycitein, genistein, pratensein, formononetin, irilone, prunetin and biochanin A | generalized linear model (GLM) and linear discriminant analysis (LDA) | [80] |
| Tithonia diversifolia, dried leaves | Maceration in 80% acetone for 72 h; evaporate to dryness at 40 °C | C18 column (5 µm, 4.6 mm × 250 mm); mobile phase: water/acetic acid, 98:2% v/v and methanol/water/acetic acid, 70:28:2% v/v; flow rate 0.6 mL/min; monitoring wavelengths: 254, 327, 366 | gallic acid, chlorogenic acid, caffeic acid and p-coumaric acid, and apigenin | analysis of variance model and Tukey’s test | [81] |
| lyophilized leaves of ten mango varieties | UAE with 70% ethanol, 320 W for 30 min; evaporate to dryness by vacuum rotary evaporator at 30 °C | C18 column (250 mm × 4.6 mm, 5 μm); mobile phase: 0.1% (v/v) formic acid in water and 0.1% (v/v) formic acid in acetonitrile; flow rate: 0.8 mL/min; all wavelengths scanning detection from 200 to 600 nm | neomangiferin, galic acid, 5-caffeoylquinic acid, 3-chlorogenic acid, mangiferin, 4-hydroxybenzoic acid, sinpic acid, isoquercitrin, quercetin | similarity analysis, PCA, HCA, discriminant analysis | [82] |
| Plant Material | Extraction | Hyphenated Technique Used | Instrumental Methodology (LC Condition, Ionization, Acquisition Mode) | Data Processing Approach Used for Tentatively Identification | Ref. |
|---|---|---|---|---|---|
| Ground dried culinary herbs and spices: dill (Anethum graveolens), marjoram (Origanum majorana), turmeric (Curcuma longa), caraway (Carum carvi), and nutmeg (Myristica fragans) | UAE with 5 mL of 50% ethanol in 0.1% formic acid in ultrapure water; 5 min | UHPLC- LTQ Orbitrap MS | Atlantis T3 C18 (100 × 2.1 mm, 3 µm) column; mobile phase; 1% formic acid in water and 0.1% formic acid in ACN. Full scan MS mode at 60,000 FWHM and MS/MS mode with the Orbitrap at 30,000 FWHM DDA scan. | In-house database Comparison with HR-MS data found in literature PCA, HCA | [22] |
| Dingkun Dan (traditional Chinese medicine prescription) | Ultrasonic extraction with MeOH, 30 min | UHPLC-Q/Orbitrap –HRMS/MS | Acquity T3 (2.1 × 100 mm, 1.8 μm) column; mobile phase: 0.1% formic acid in water (A) and 0.1% formic acid in MeOH. HESI II ionization source in positive and negative mode; collision energy: 25–60 V. Data-dependent acquisition (DDA). | In-house database Searching in Chemspider; Pubchem. | [91] |
| Aster tataricus rhizoma | UAE with MeOH for 30 min | UHPLC-Q-TOF-MS | Poroshell 120 EC-C18 column (100 mm × 2.1 mm, 2.6 µm); mobile phase: water + 0.1% formic acid and ACN + 0.1% formic acid. ESI source in both positive and negative ion mode. DDA and DIA acquisition methods. Multiple mass defect filter (MMDF) and dynamic background subtraction (DBS) by AB Sciex software | Searching for reported metabolites; in-house database. Searching in Chemspider database using MasterViewTM1.0. Product ions strategy (KPIs). Clog P (calculated by Chemdraw Ultra 12.0 software)—used for distinguishing isomers. | [99] |
| Ophryosporus triangularis Meyen, dried aerial parts (leaves and stems) and flowers | UAE with MeOH, 30 min | UHPLC-Q- Orbitrap HRMS/MS | Acclaim UHPLC C18 column, (150 mm × 4.6 mm ID, 2.5 µm); mobile phases: 1% formic aqueous solution and ACN; HESI negative ionization mode; full scan at 70,000 FWHM followed by targeted MS/MS at 17,500 FWHM; collision energy (HCD cell)–30 kv | In-house database comparison with HR-MS data found in literature | [100] |
| Dried leaves of green perilla (Perilla frutescens) | Extraction with MeOH by shaking for 8 h at ambient temperature | LC- TOF-MS/MS | Poroshell 120 EC-C18, 150 × 2.1 mm, I.D., 4 mm; mobile phase: 0.1% formic acid in water and MeOH; ESI source in negative ion mode; resolution of 2700; collision energy 10 eV. | The analyst TF software (version 1.7); identification of the compounds by comparison with previous studies. Tentatively characterized by fragmentation pathway identification. | [102] |
| Goji berries (Lycium barbarum L.) | Extraction in 1% formic acid in 80:20 methanol/water solution by centrifugation at 25,000 rpm/3 min | UHPLC-ESI-QTOF-MS | Zorbax eclipse plus C18 column (50 × 2.1 mm, 1.8 μm); mobile phase: water and MeOH ESI ionisation source in positive; full scan MS2 (30,000 FWHM); mass accuracy ≤ 5 | Profinder B.07 software. Phenol-Explorer 3.6 database | [104] |
| Stellera chamaejasme extracts | reflux with MeOH for 30 min at 50 °C. | UHPLC–LTQ-Orbitrap MSn | Agilent Zorbax Ecipse Plus C18 column (100 × 3.0 mm, 1.8 µm) at 50 °C; mobile phase water with 0.5% FA and ACN; HESI in positive and negative mode DDA, MSn scan (four ions for MS2 and one ion for MS3); resolution of MS2–60,000 and MS3–30,000; collision energy: MS2–30 V and MS3–35 V. | SciFinder database (https://scifinder.cas.org) for chemical formula annotation; comparison with HR-MS data found in literature | [105] |
| The male flowers of date palm (Phoenix dactylifera) | Soxhlet extraction with 80% MeOH for 6 h at 50 °C, fractionation in a C18 column | HPLC-ESI-ITMS | Symmetry C18 column (5 µm, 2.1 mm × 150 mm; mobile phase: ACN containing 0.03% (v/v) formic acid and water containing 0.03% (v/v) formic acid; ESI ion source in negative ion mode full-scan followed by MS-MS | Density functional theory (DFT) study | [106] |
| Mentha rotundifolia (L.) Huds, aerial parts | maceration in MeOH for 24 h at room temperature | UHPLC-ESI-Q- Orbitrap- HRMS/MS | Kromasil RP-18 column (250 mm 10 mm); mobile phase: water/ACN 75:25, 0.25% FA and ACN, 0.25% FA; HESI ionization source in negative mode; full MS followed by DDA scan | In-house database, confirmation by NMR approaches | [107] |
| Baoyuan decoction (traditional Chinese medicine formula) | reflux with water for 1.5 h | UHPLC–Q-TOF-MS/MS | Cortecs UPLC C18 column (1.6 μm, 2.1 × 100 mm; mobile phase: 0.05% aqueous formic acid and ACN containing 0.05% formic acid; ESI ionization in negative mode; DIA | UNIFI software. In-house database | [108] |
| The bark, twigs, leaves, and fruits of Alnus japonica, Alnus hirsuta and Alnus hirsuta var. sibirica | UAE with MeOH (1:10 g DW/g), 60 °C, 60 min, at 60 kHz | UHPLC–Q-TOF-MS/MS | Acquity BEH C18 (100 × 2.1 mm 1.7 μm) column; mobile phase: H2O and MeCN, both of which were acidified with 0.1% formic acid; ESI ionization mode in negative ion; DDA (full MS followed by MS/MS scans for the three most intense ion). | Spectral preprocessing using MZmine; in silico annotation with network; annotation propagation GNPS molecular networking; integration of annotation data using MolNetEnhancer | [109] |
| Medicago sativa L. and Trifolium pratense L. dried sprouts | UAE with 70% ethanol (1:10 g DW/g), 60 °C, 60 min, at 60kHz | UHPLC-Q- Orbitrap HRMS/MS | Accucore U-HPLC Column C18 (150 × 2.1 mm, 2.6 μm); mobile phase: water containing 500 μL/L−1 formic acid (pH 2.5) and MeOH; HESI ionization in negative mode; DIA (Full scan 70,000 FWHM, MS/MS 35,000 FWHM). Normalized collision energy: 30, 60 and 80 NCE | Chemspider database; NORMAN MassBank, mzCloudeTM Advanced Mass Spectral Database; in silico fragmentation with ACDLabs MS Fragmenter 2019.2.1 software | [110] |
| Blackcurrant (Ribes nigrum L.) leaves | UAE with ethanol/water (1:1), 20 °C, 60 min | ESI-LTQ-Orbitrap MS | Kinetex Evo C18 5 μm column; mobile phase: water + 0.1% formic acid and ACN + 0.1% formic acid. ESI source in negative ion mode. DDA | MZmine; PCA. | [111] |
| Persimmon leaves (Chinese traditional medicine) | UAE with methanol/water (80:20, v/v) | LC-ESI-LTQ- Orbitrap-MS | Atlantis T3 column 2.1 × 100 mm, 3 m; mobile phase water/0.1% formic acid and ACN; ESI source in both positive and negative ion mode; DDA approach-full scan at 30,000 FWHM and MS/MS at 15,000 FWHM; Collision energy (HCD cell)–35 kv | Identification by generating the molecular formula using accurate mass (C = 30, H = 100, O = 15), and matching with the isotopic pattern. Searching in polyphenol database: (http://phenol-explorer.eu/). Confirmation by comparison with HR-MS data in literature and databases | [112] |
| Flowers and leaves of Chilean Mistletoe (Quintral, Tristerix tetrandus) | Lyophilized flowers and leaves were defatted thrice with N-hexane (1:10) and then extracted by UAE with 0.1% HCl in MeOH (1:10) for 60 min. Purification with XAD-7 column. | UHPLC–Q/Orbitrap/HRMS/MS | UHPLC C18 Column, Acclaim, 150 mm × 4.6 mm ID, 5 µm. Mobile phase: 0.1% aqueous formic acid and ACN 0.1% formic acid. HESI II ionization source in positive and negative mode. Full scan MS (70,000 FWHM) acquisition followed by targeted MS/MS analysis (17,500 FWHM). Collision energy: 30 kv. Mass accuracy ≤ 5 | Trace Finder 3.2 software | [113] |
Publisher’s Note: MDPI stays neutral with regard to jurisdictional claims in published maps and institutional affiliations. |
© 2021 by the authors. Licensee MDPI, Basel, Switzerland. This article is an open access article distributed under the terms and conditions of the Creative Commons Attribution (CC BY) license (https://creativecommons.org/licenses/by/4.0/).
Share and Cite
Chiriac, E.R.; Chiţescu, C.L.; Geană, E.-I.; Gird, C.E.; Socoteanu, R.P.; Boscencu, R. Advanced Analytical Approaches for the Analysis of Polyphenols in Plants Matrices—A Review. Separations 2021, 8, 65. https://doi.org/10.3390/separations8050065
Chiriac ER, Chiţescu CL, Geană E-I, Gird CE, Socoteanu RP, Boscencu R. Advanced Analytical Approaches for the Analysis of Polyphenols in Plants Matrices—A Review. Separations. 2021; 8(5):65. https://doi.org/10.3390/separations8050065
Chicago/Turabian StyleChiriac, Elena Roxana, Carmen Lidia Chiţescu, Elisabeta-Irina Geană, Cerasela Elena Gird, Radu Petre Socoteanu, and Rica Boscencu. 2021. "Advanced Analytical Approaches for the Analysis of Polyphenols in Plants Matrices—A Review" Separations 8, no. 5: 65. https://doi.org/10.3390/separations8050065
APA StyleChiriac, E. R., Chiţescu, C. L., Geană, E.-I., Gird, C. E., Socoteanu, R. P., & Boscencu, R. (2021). Advanced Analytical Approaches for the Analysis of Polyphenols in Plants Matrices—A Review. Separations, 8(5), 65. https://doi.org/10.3390/separations8050065