Abstract
A canister-based sampling method along with preconcentrator-Gas chromatography-Mass Spectrometry (GC-MS) analysis was applied to ethylene oxide (EtO or EO) and 75 other volatile organic compounds (VOCs) in ambient air. Ambient air can contain a large variety of VOCs, and thorough analysis requires non-discriminatory sampling and a chromatographic method capable of resolving a complex mixture. Canister collection of whole air samples allows for the collection of a wide range of volatile compounds, while the simultaneous analysis of ethylene oxide and other VOCs allows for faster throughput than separate methods. The method presented is based on US EPA Method TO-15A and allows for the detection of EtO from 18 to 2500 pptv. The method has an average accuracy of 104% and precision of 13% relative standard deviation (RSD), with an instrument run time of 32 min. In addition, a link between canister cleanliness and ethylene oxide growth is observed, and potential mechanisms and cleaning strategies are addressed.
1. Introduction
Ethylene oxide (EO or EtO) is a commonly used intermediate in chemical manufacturing, with 20 million tons produced worldwide in 2009 [1]. It acts as a precursor to many products such as plastics, glycols, and ethers [2]. It is also used as a sterilant for medical items [3,4], as it is a very strong disinfectant and leaves no residue, making it a good alternative for steam cleaning on items that may be sensitive to heat. EtO is directly emitted to the air from the aforementioned sources and 174,455 pounds were released into the air in the United States (US) in 2019 [5]. EtO also results from secondary reactions in the atmosphere. Consequently, the United States Environmental Protection Agency (EPA) has used modeling under its Integrated Risk Information System (IRIS) program to estimate EtO at ambient concentrations of 0.0044 µg/m3 to 0.144 µg/m3 [6]. Measured background concentrations of ambient air range from 0.06 µg/m3 [7] to as high as 0.397 µg/m3 (33 pptv to 217 pptv) at some National Air Toxics Trends Stations (NATTS) [8]. EtO exposure causes several acute symptoms, including irritation of mucous membranes, nausea, headache, drowsiness, weakness, and vomiting [9]. In addition, in 2016 the US (EPA) classified EtO as a human carcinogen based on a review of previous studies linking EtO exposure and cancer [6].
Due to EtO’s hazardous nature, methods for personal air monitoring of workers potentially exposed to EtO have been implemented by several agencies, such as The US Occupational Safety and Health Administration (OSHA) [2], National Institute for Occupational Safety and Health (NIOSH) [10], and the German Social Accident Insurance [11]. These methods rely on the adsorption of EtO into glass sampling tubes containing carbon coated with hydrobromic acid (HBr). The EtO reacts with HBr to form 2-bromoethanol [12,13], which can then be extracted and further derivatized to heptafluorobutyrylimidazole (HFBI) and analyzed by gas chromatography (GC) using an electron capture detector (ECD). Methods using a fiber packed needle [14] or solid phase microextraction (SPME) fibers [15,16] performing on-fiber HBr derivatization have also been developed. In addition, portable GC analysis using direct injection of medical workplace air [17], headspace analysis of medical devices [18], charcoal adsorption [19], and conversion to ethylene glycol using sulfuric acid [20] have also been developed.
While the methods developed for personal and workplace air monitoring serve their purpose, they are only suitable for the single target analysis of EtO. With the classification of EtO as a carcinogen, the EPA has started to include EtO in its NATTS monitoring [7]. These stations focus on ambient air in both urban and rural areas of the US, with some stations downwind of EtO emitting facilities and others far removed from emitters. The NATTS testing is focused on a broad range of volatile compounds, which requires sampling and analysis that is less targeted than the HBr derivatization approach.
In this paper we cover a sampling and analysis approach for EtO based on US EPA Method TO-15A [21], using canister sampling followed by preconcentration-GC-MS. The goal of this manuscript is to provide a method suitable for testing EtO at pptv levels, while simultaneously evaluating other common contaminants in ambient air. US EPA Method TO-15 had not seen a revision since 1999; however, it was recently revised to TO-15A in September 2019. The method was revised to address many of the long-standing and common issues associated with TO-15. Some of those short-comings, which are relevant to the current manuscript, include but are not limited to: Relatively long GC run times on non-ideal GC phases and/or column dimensions; a lack of guidance/discussion on proper canister humidity levels, canister fill gases, canister hold times; and how many of the aforementioned variables can result in significant biases for VOC sampling with canisters. The current study will demonstrate that canister humidity and fill gas are especially critical for EtO. A link between the growth of EtO in canisters and overall canister cleanliness, coupled with the use of humid air as a fill gas, is shown in this paper, affecting canister hold times. Potential cleaning strategies are discussed to mitigate these issues and allow for more confidence in low level EtO quantitation.
2. Materials and Methods
2.1. Reagents and Supplies
A 99.5% purity EtO standard was purchased from Sigma-Aldrich (Sigma-Aldrich Corp., St. Louis, MO, USA). The internal standard used was the TO-14A GC-MS Internal Standard/Tuning Mix (Restek Corporation, Bellefonte, PA, USA). Unless otherwise noted, all standards and blanks were made in 6L SilcoCan air canisters (Restek Corporation, Bellefonte, PA, USA) using zero air humidified to 50% relative humidity (RH) using deionized water, matching the suggested fill gas and humidification levels suggested in TO-15A [21].
The analysis was performed using an Agilent 7890B GC/5977A MS (Agilent Technologies, Santa Clara, CA, USA) using a 60 m × 0.25 mm × 1.4 µm Rxi-624Sil MS GC column (Restek Corporation, Bellefonte, PA, USA). The preconcentrator used was a Markes Unity 2 using an EPA TO-15/TO-17 air toxics cold trap, a Kori-xr water removal unit and a CIA Advantage autosampler (Markes International Ltd., Liantrisant, United Kingdom). MSD Chemstation software version F.01.00.1903 (Agilent Technologies, Santa Clara, CA, USA) was used for GC-MS control and data processing.
2.2. Preconcentration
The initial preconcentrator parameters were based on settings used for a previous TO-15 study [22]. Optimum temperatures for the flow path, focusing trap, and water removal trap were investigated.
To ensure that there was no breakthrough of EtO in the preconcentrator trap, standards were injected at volumes of 25, 100, 200, 400, and 600 mL at both 538 and 2688 pptv. The EtO response was plotted for linearity, with attention paid to any loss in response at higher volumes that may have indicated the breakthrough volume of the focusing trap had been reached.
2.3. GC-MS Settings
Initial investigations showed that the separation of EtO from interferences was difficult at ambient temperatures, so cryogenic cooling using liquid nitrogen was used to allow lower GC oven temperatures. Two different column phases were investigated: The Rtx-VMS and the Rxi-624Sil MS. The Restek Pro EZGC Chromatogram Modeler was used to generate initial oven temperature ramp rates and column flow rates, with modifications then made to improve critical coelutions.
Optimization of the MS parameters was done to ensure that sufficient scan speed was allowed to properly define all chromatographic peaks. Selected ion monitoring (SIM) was used for the quantitation of EtO to ensure that the desired detection limits were obtained, with the dwell time selected to allow for sufficient signal to noise (S/N) ratio while maintaining enough data points across the peak to properly define it.
2.4. Method Validation
To validate that the method was fit for purpose the instrument was calibrated, a method detection limit (MDL) study was performed, and the instrument was evaluated for precision and accuracy. All standards were prepared in 50% RH air using 6L SilcoCans using gas tight syringes.
Method TO-15A requires that the method detection limit (MDL) be determined following the guidance provided in the US EPA Code of Federal Regulations Part 136 Appendix B [23], using the standard deviation (SD) of seven replicates near the anticipated detection limit. The SD was then multiplied by the student T value for 99% confidence (3.143) to determine the MDL. The limit of quantitation (LOQ) was taken as three times the MDL.
The precision and accuracy of the method were measured by analyzing 4 separate standard preparations in different canisters. The average recovery and relative standard deviation of the replicates was calculated. All calibrations and quantitative work were done using internal standards.
2.5. EtO Stability
To evaluate the stability and holding time of EtO in canisters, 4 standard replicates were analyzed periodically over the course of approximately 2 weeks. The amount deviated from the original value was calculated. Blank canisters were also evaluated for blank contamination and stability. Lightly used canisters from multiple manufacturers were used, as well as canisters that were contaminated from heavy field use to determine the effect of canister contamination on EtO background. Blanks were evaluated with both humid and dry air, as well as an inert gas (helium) to determine the effects of air and humidity on canister blanks.
3. Results
3.1. Preconcentrator Settings
The final optimized preconcentrator parameters are shown in Table 1.

Table 1.
Preconcentrator settings.
Optimization of the preconcentrator settings found that the focusing trap temperatures had a large effect on the EtO response. Table 2 shows the difference between 0 °C and −30 °C using standards at 538 pptv and 2688 pptv, with the lower temperature showing a response over 150% of the original value. Other preconcentrator settings were optimized (results not shown); however, these parameters did not have as large effect on EtO when adjusted within reasonable ranges.
Table 2.
EtO response vs. focusing trap temperature. 1 sample for each data point.
Figure 1 shows the graph of the EtO linearity study, showing good linearity up to a 600 mL injection. However, 400 mL was chosen as the nominal injection volume, because it provided the best balance of sample load time and targeted sensitivity. Future researchers may wish to extend the sample volume to 600 mL or more if the desired sensitivity is not achieved at 400 mL.
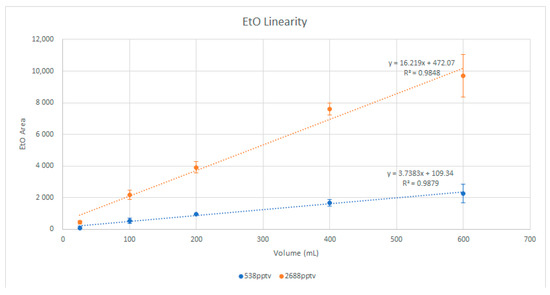
Figure 1.
EtO injection linearity.
3.2. GC-MS Parameters
Table 3 Shows the GC-MS parameters used for the analysis. It was found that cryogenic cooling combined with the 60 m × 0.25 × 1.4 µm 624Sil MS column allowed for the separation of EtO from interferences while also allowing for resolution of the TO-15A compounds.
Table 3.
Gas chromatography-Mass Spectrometry (GC-MS) parameters.
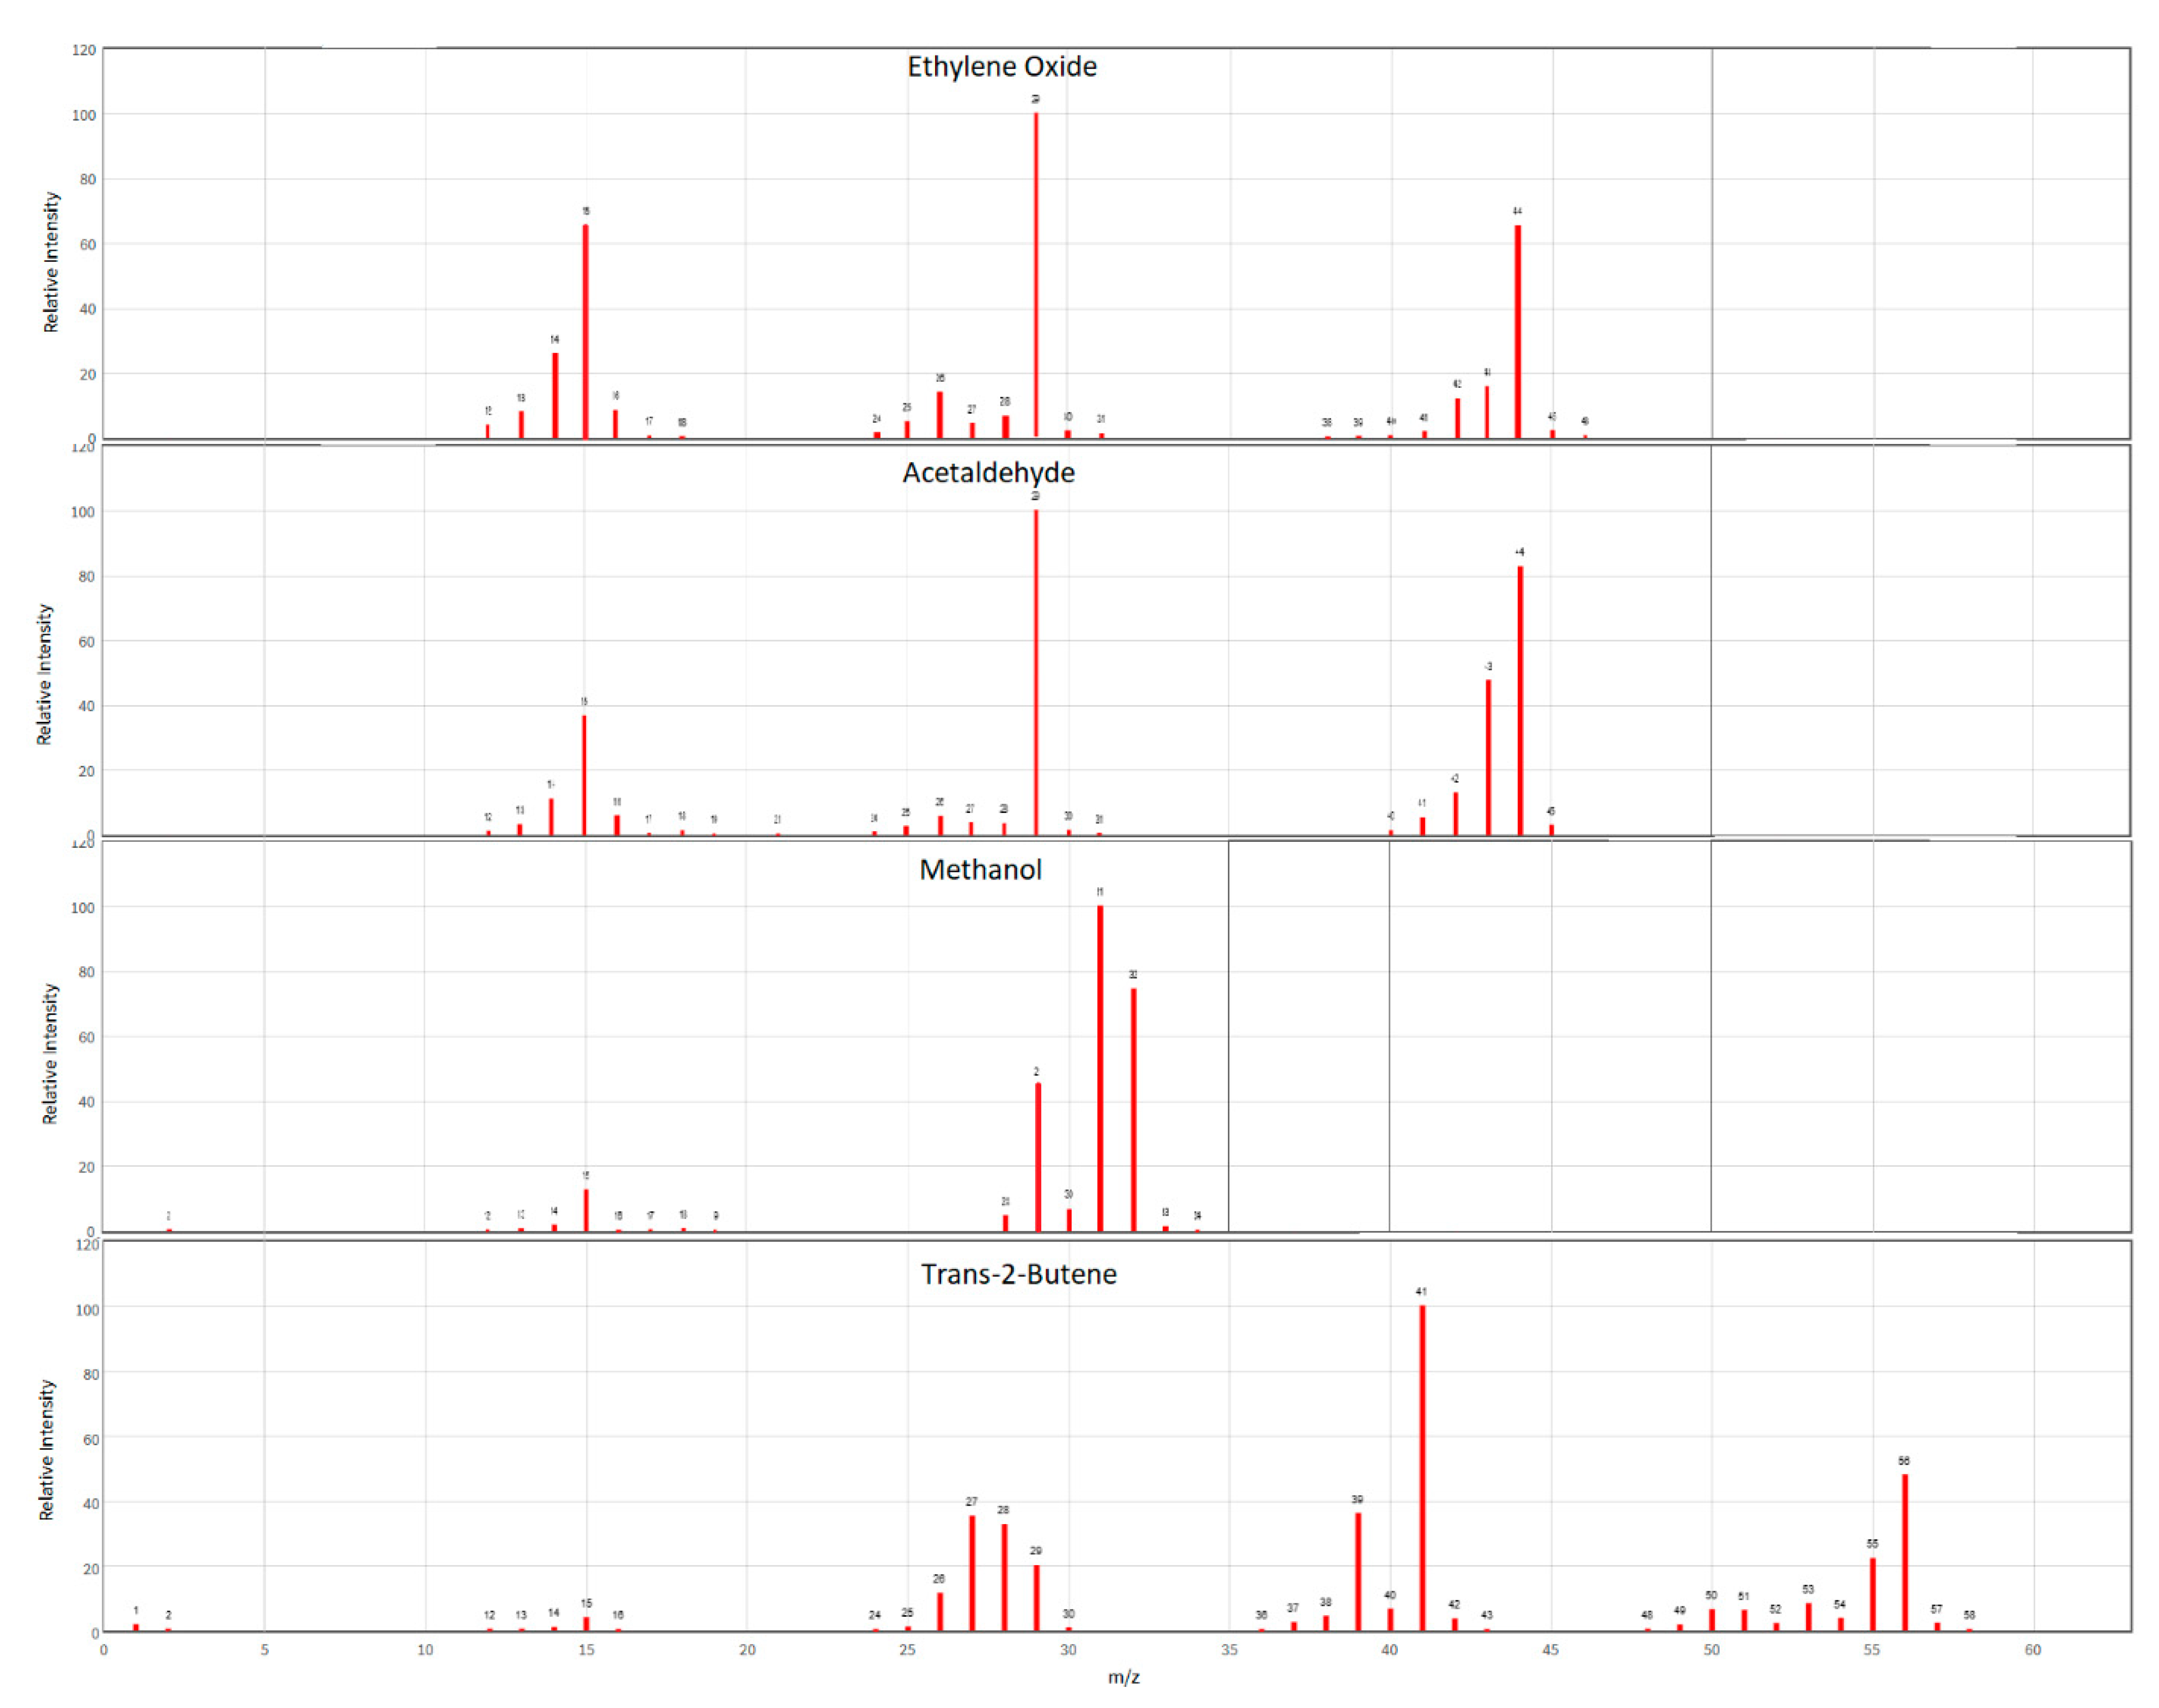
The key coelutions of concern for EtO include methanol (MeOH), acetaldehyde, and trans-2-butene. Individual and/or mixes of the aforementioned certified standards were analyzed to verify the final GC-MS method avoided these coelutions. As seen in Figure A1 these compounds share ions produced in the mass spec with EtO, and so required that they be fully chromatographically resolved for accurate identification and quantitation.
MeOH proved to be the most difficult coelution. MeOH is commonly used as a solvent for the production of volatile standards, so it is almost ubiquitous in volatile analytical systems. The Rtx-VMS column was unable to provide separation for EtO and MeOH at ambient or sub-ambient temperatures. Initial testing using the Rxi-624Sil MS column at ambient starting temperatures failed to fully resolve the MeOH/EtO coelution, but it was able to separate the pair at lower temperatures using cryogenic cooling. Figure 2 shows that cryogenic cooling of the GC column down to 0 °C is required, as the EtO peak coelutes with MeOH at 10 °C. Other starting temperatures and hold times were used, but not shown.
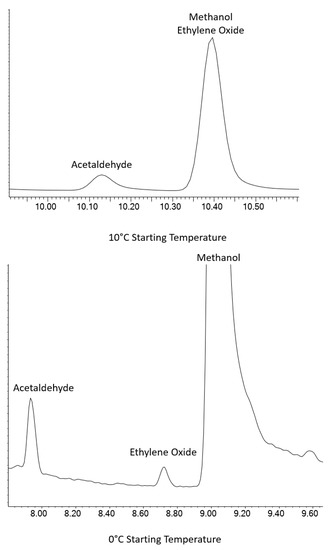
Figure 2.
EtO separation from MeOH at 10 °C (top) and 0 °C (bottom) using an Rxi-624Sil MS column.
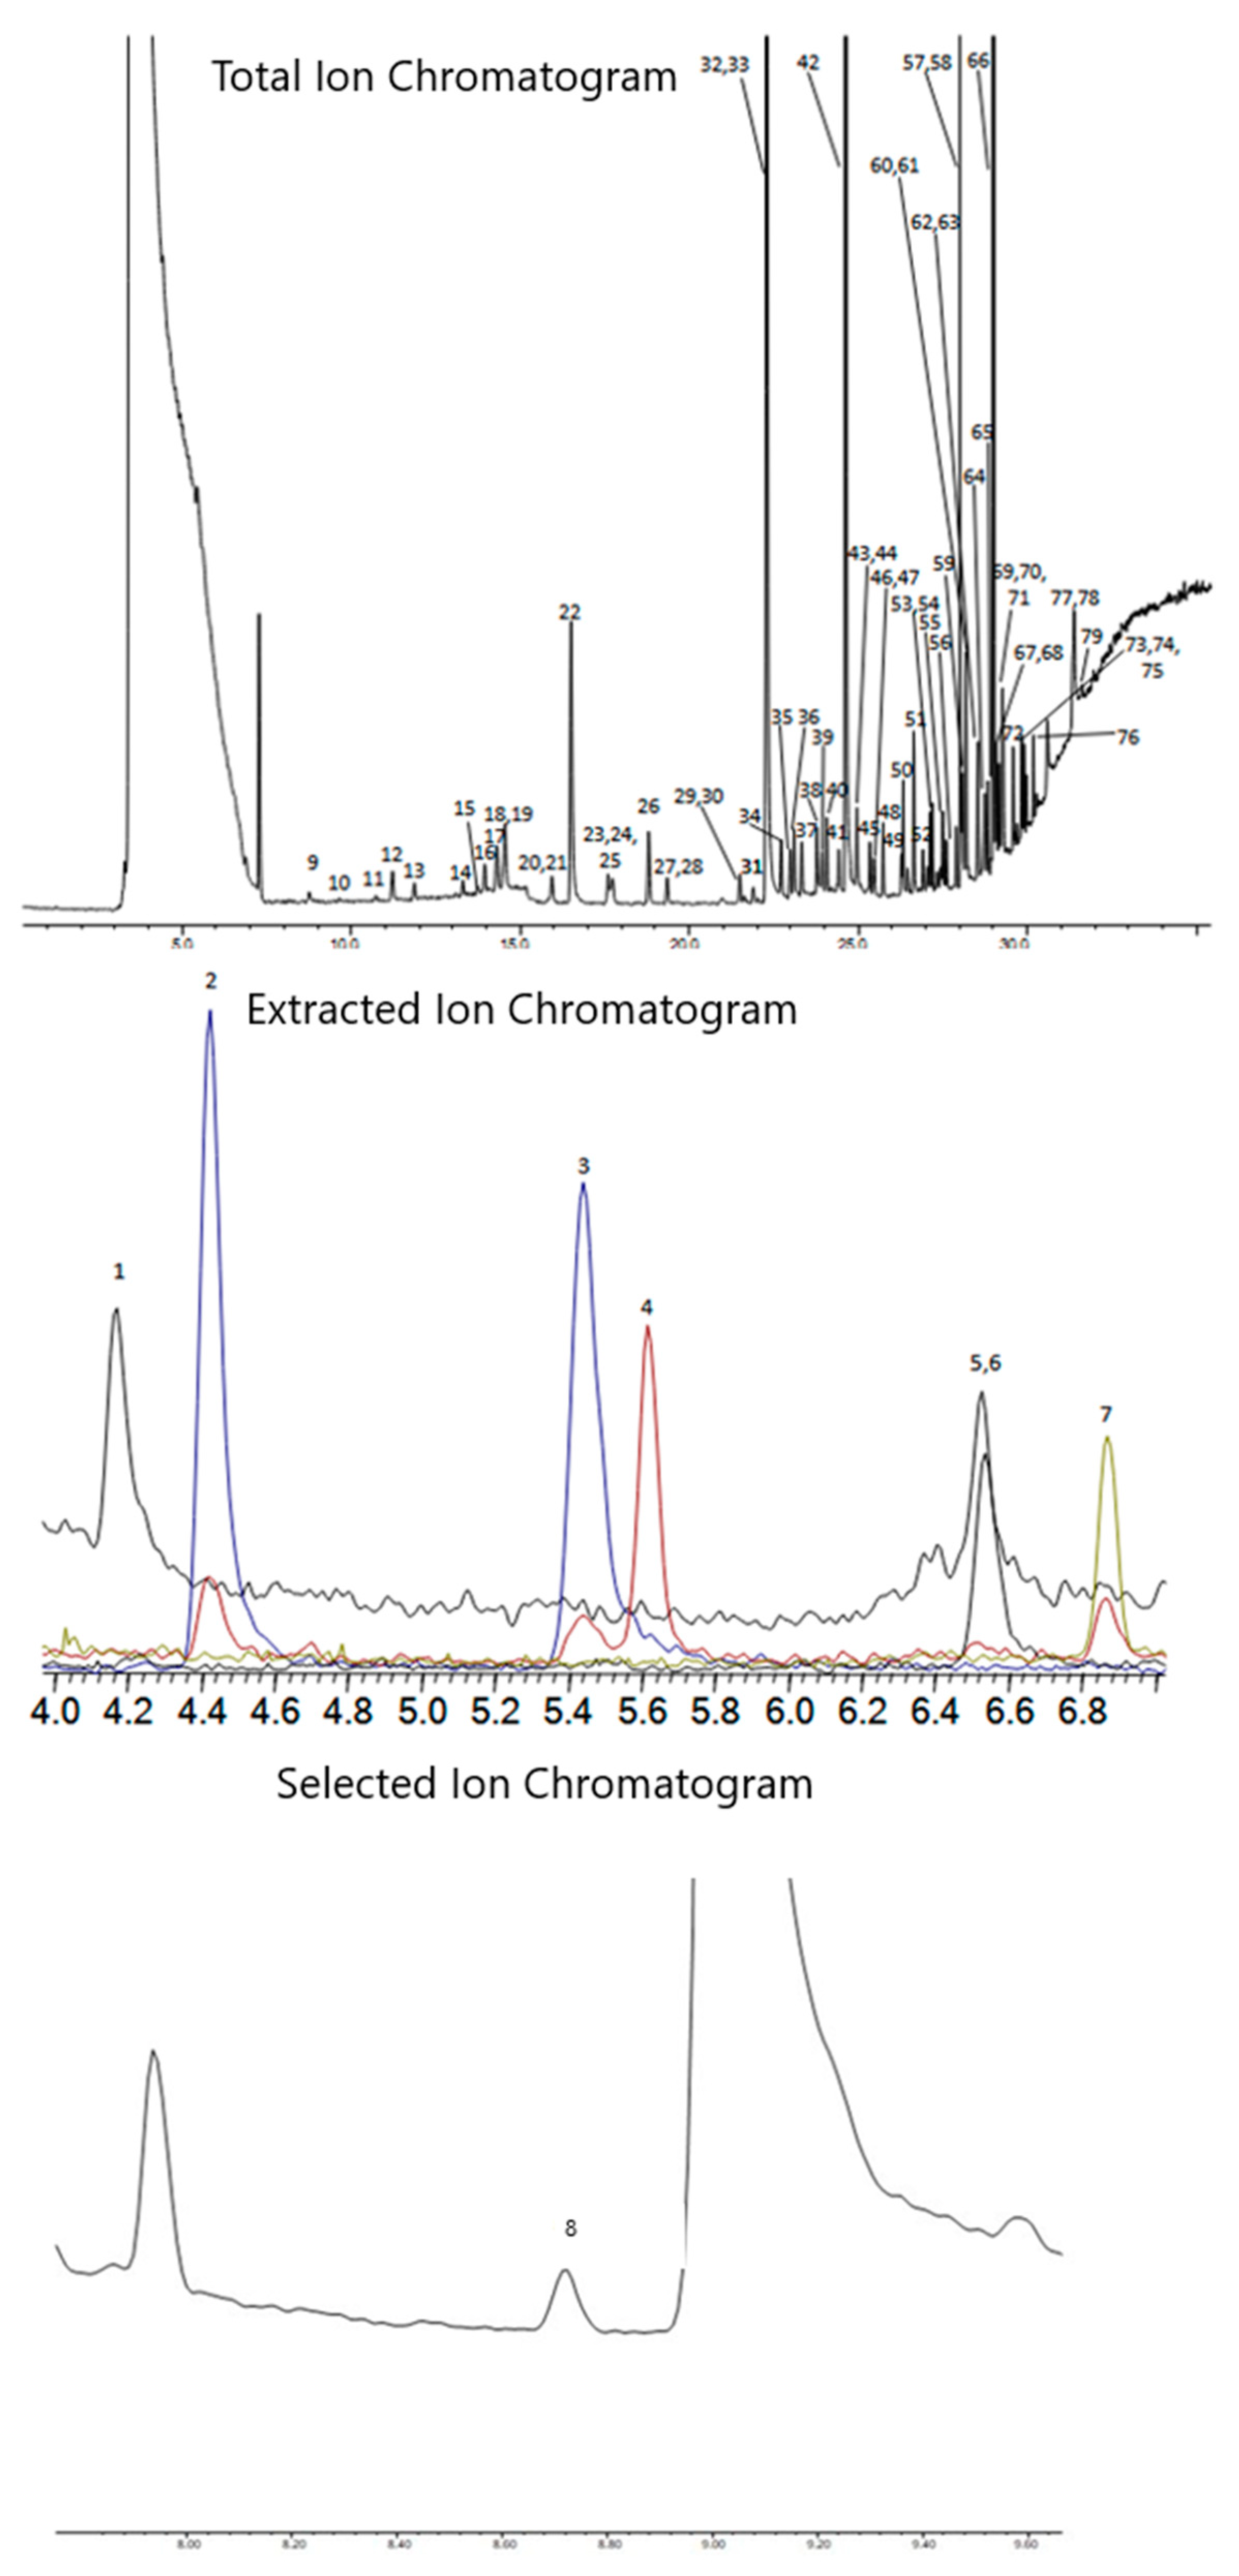
Once the chromatography for EtO was resolved, the GC parameters needed to separate the rest of the TO-15A compounds were generated using the Restek Pro EZGC Chromatogram Modeler, with minor changes to the oven ramp made to optimize the real-world separations. Other column phases were not investigated, as the Pro EZGC Modeler showed that the Rtx-VMS and Rxi-624Sil MS provided the most efficient separation for the TO-15 compounds. Figure 3 and Table 4 show the chromatography of the method, as well as the retention times and peak IDs of all compounds.
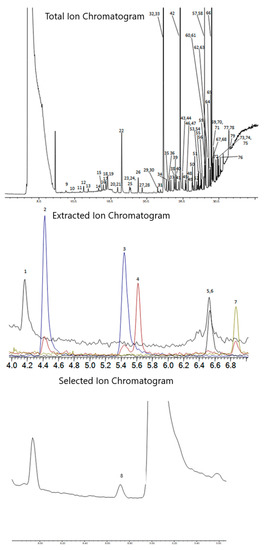
Figure 3.
Combined TO-15A and EtO chromatograms. TO-15A compounds at 200 pptv, EtO at 50 pptv, and internal standards at 5000 pptv. Top chromatogram is the Total Ion Chromatogram (TIC), second trace is the Extracted Ion Chromatograms (EIC) for compounds 1–7 (m/z 41, 85, 135, 50, 43, 65, and 54), and the bottom trace is the Selected Ion Monitoring (SIM) trace for EtO (m/z 29).
Table 4.
Peak names, retention times, and target m/z used for quantitation for TO-15A and EtO method. Compounds marked with * are internal standards or tuning compounds.
When including cool down time for the GC and optimizing the sample overlap feature in the preconcentrator, the total cycle time for the analysis can be under 40 min. In contrast, the example TO-15A parameters given in the method give a minimum run time of 25 min, not including cool down [21]. While EtO elutes early, ambient air samples will potentially have later eluting compounds present that will require the GC program to reach elevated temperatures to eliminate buildup of non-target analytes at the head of the column or on column, extending the method far beyond the 8.7 min required to elute EtO. Furthermore, separate methods will require additional quality control samples to be run, taking up instrument time that could be used to run samples. Increased instrument downtime due to maintenance could also be expected, due to the higher volume of samples run. Given the expected cycle times of the individual methods, the loss of instrument time due to extra quality controls, and potential for extra maintenance resulting from increased sample volume it is unlikely that separate methods will improve upon the cycle time of the current combined method.
As shown in Figure 4, the use of SIM greatly improves the S/N of EtO at low levels, with the S/N at 34 pptv being 5.9. However, full scan data can be useful for monitoring samples for unknowns, as well as system cleanliness. The Agilent 5977A mass spectrometer is capable of simultaneous SIM and full scan acquisition, allowing for low level SIM quantitation when needed for sensitivity and full scan data for higher level quantitation and identification of unknowns. For this method, SIM was only applied to EtO, but SIM parameters could be generated for all compounds if needed to reach the desired detection limits.
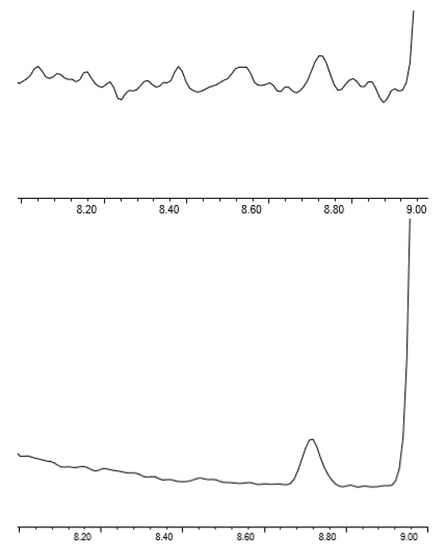
Figure 4.
Scan (top) vs. SIM (bottom) acquisition for EtO at 34 pptv.
3.3. Method Validation
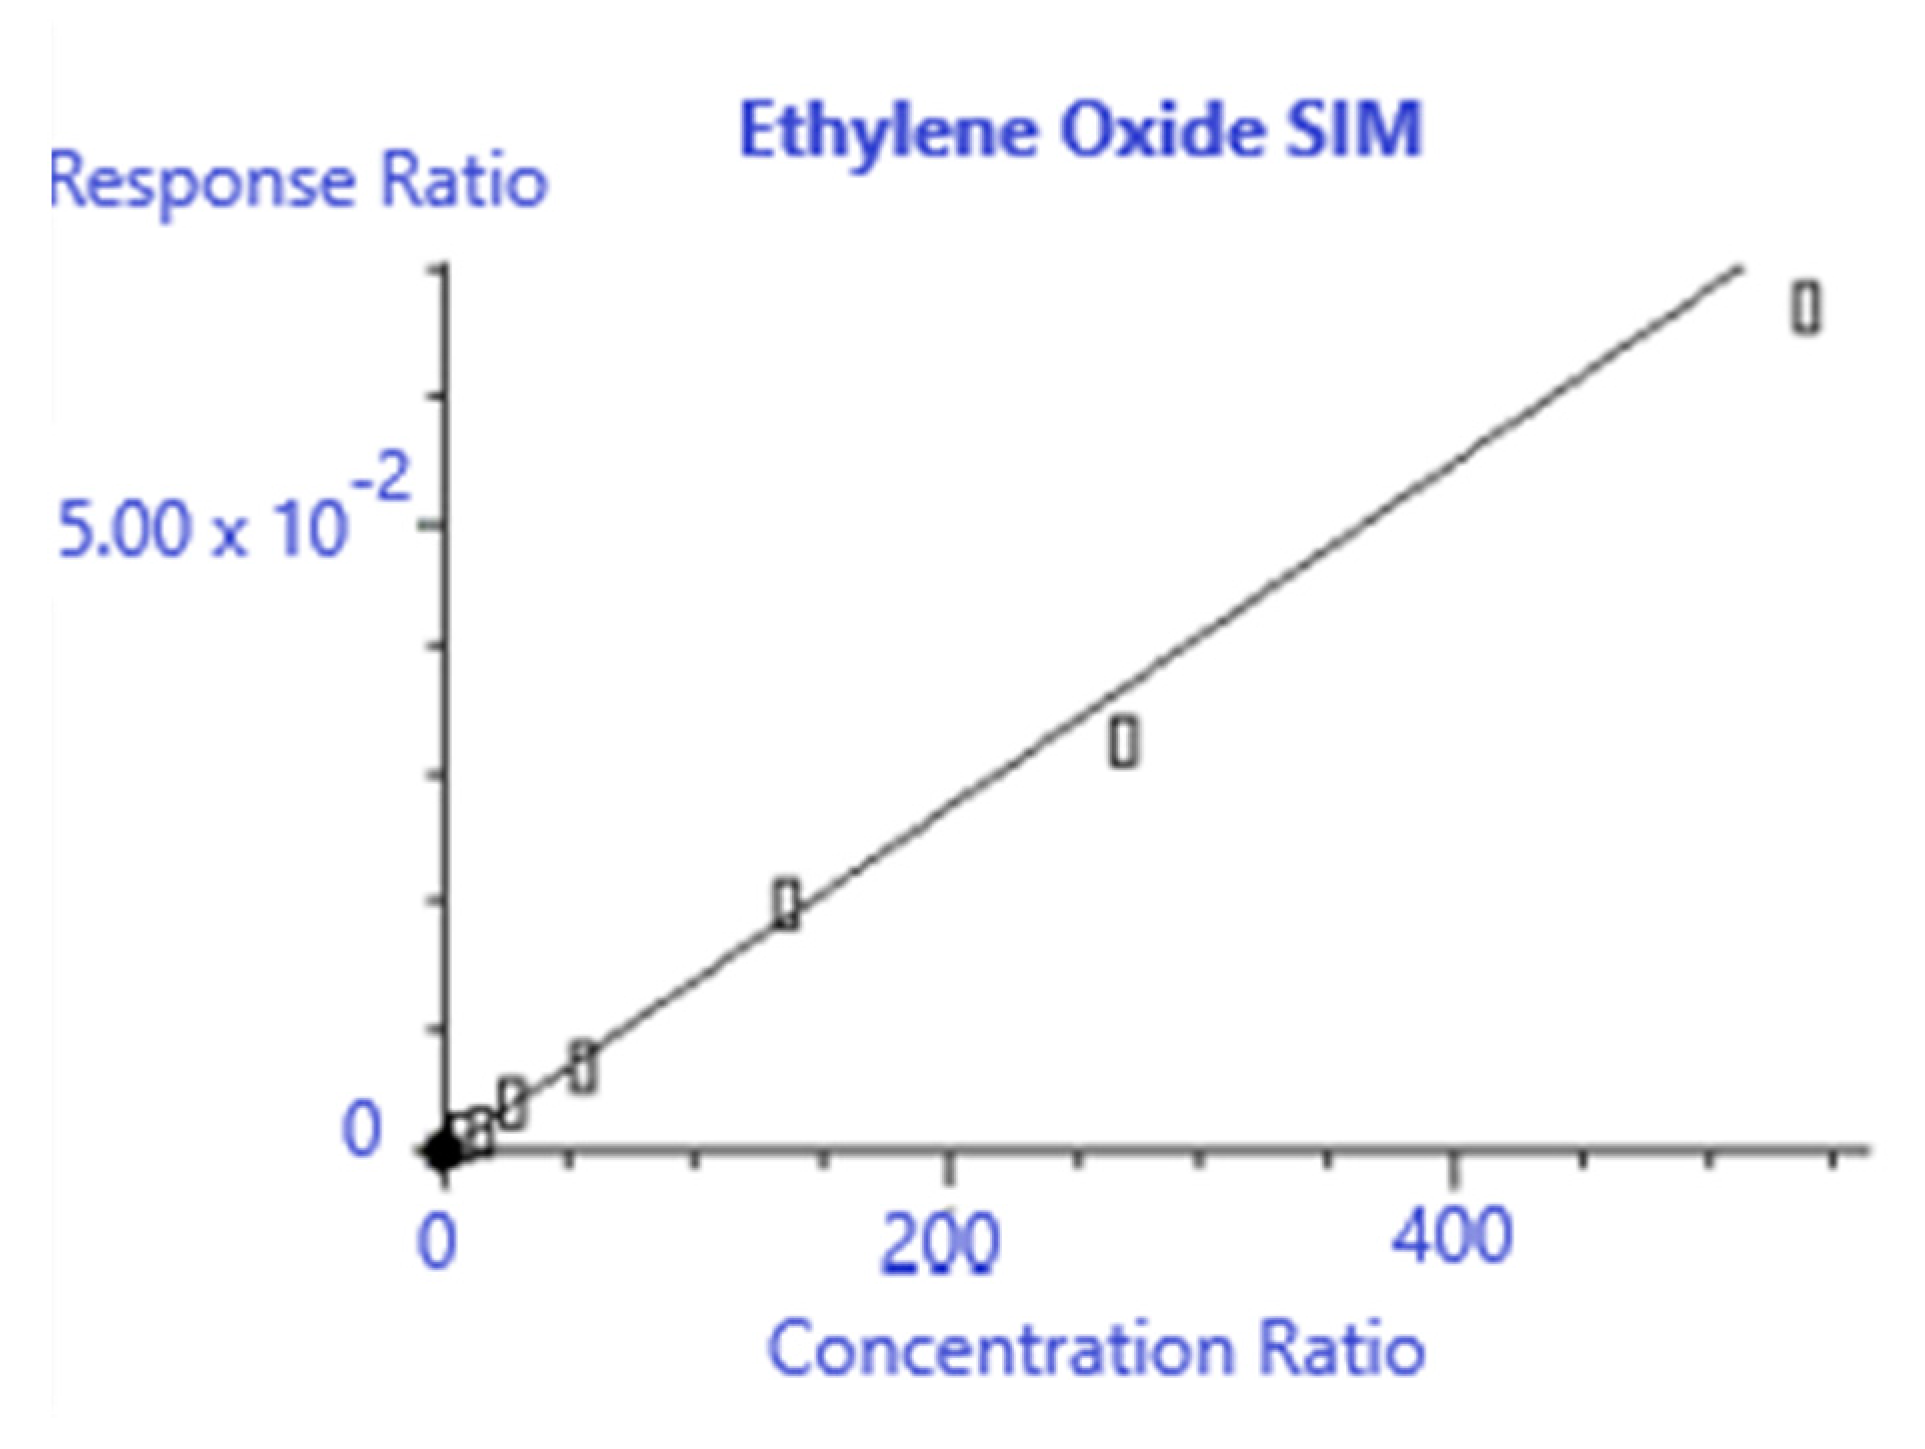
Given the injection volume linearity shown in Figure 1 it was decided to make two standards at 538 pptv and 2688 pptv EtO and use different injection volumes to construct the calibration curve to reduce the variability associated with standard preparation. A nominal volume of 400 mL was assumed to reach the desired detection limits. Table 5 shows the responses for the bromochloromethane internal standard and EtO for each calibration point, and Figure 5 shows the calibration generated from the MSD Chemstation software.
Table 5.
Internal standard and EtO calibration responses.

Figure 5.
Ethylene oxide calibration results.
Method TO-15A requires that the relative response factor calibration, such as the one used here, have a %RSD of ≤30% [21]. Figure 6 shows the calibration results, with a %RSD of 12.784%, well within the limits required by TO-15A. In addition, the calculated concentration of each calibration point must be within ±30% of the true value of the standard. Table 6 shows the calculated recovery for the calibration points used, which meet the TO-15A criteria of ±30%.
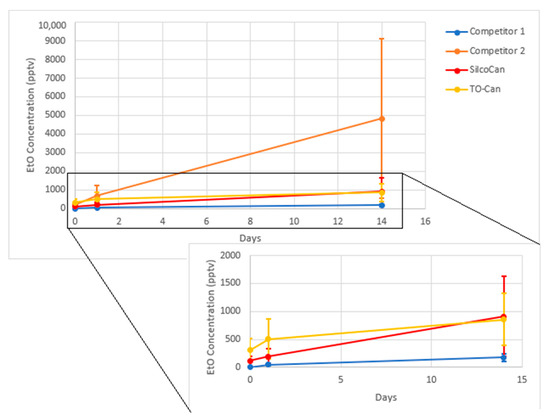
Figure 6.
Ethylene Oxide growth over time. Average of 3 canisters for each data point, error bars are 1 standard deviation. Insert excludes Competitor 2.
Table 6.
Calculated recovery of standards, done in 50% humid air.
The results of the MDL study are shown in Table 7. The low calibration point of 34 pptv was determined as the spiking level of the MDL study due to its S/N ratio of 5.9. Seven replicates were used to calculate the MDL, with the LOQ taken as three times the MDL. The resulting MDL and LOQ of 18 pptv and 55 pptv match with current EPA testing of ambient EtO concentrations, in which labs have reported detection limits and EtO values down to 33 to 44pptv [7].
Table 7.
Method Detection Limit Study results, done in 50% humid air.
Table 8 shows the result of the precision and accuracy study, with an average recovery of 104% and RSD of 13%. 4 separate canisters were spiked at 500 pptv EtO and 50% RH.
Table 8.
Precision and accuracy study results, done in 50% humid air.
Table 9 shows the result of the stability study done on canisters spiked at 500pptv at 50% RH. TO-15A requires a known standard challenge of canisters to be within ±30%. The canisters showed good stability out to at least 8 days, but some canisters began to show results above 130% recovery after at 12 days and later. However, others have shown stability for EtO in canisters for up to 34 days [24,25].
Table 9.
Stability of 500pptv EtO, done in 50% humid air. Results that fail the ±30% recovery criteria noted with *.
3.4. Canister Cleanliness and EtO Growth
While nitrogen has historically often been used as a fill gas for testing air canister blanks for cleanliness due to the ease of which labs can obtain ultra-high purity nitrogen, the use of humidified air is recommended because the inert atmosphere does not react within the canister as ambient air would [21]. When initially testing canister blanks, it was found that many of them would show a baseline level of EtO when filled with humid air, but not when filled with dry air or an inert gas. Table 10 shows the average result of three canister blanks using humid air, dry air, and dry helium as fill gasses.
Table 10.
Comparison of EtO blanks using different fill gasses. Average of 3 samples.
In addition, canisters that showed an initial level of EtO would have the amount increase over time. Figure 6 shows the results of four different types of canisters Restek SilcoCans, Restek TO-cans, and 2 other manufacturer canisters equivalent to SilcoCans (i.e., silicon-lined), showing some level of EtO growth across different sources of canisters. Table 11 shows a summary of the data in Figure 6. This is consistent with findings from the US EPA, which has also found bias at low levels of EtO [7]. In addition, compounds such as acrolein, another small oxygenated hydrocarbon, have shown similar behavior in air canisters [26].
Table 11.
Ethylene Oxide growth in blank canisters, done in 50% humid air.
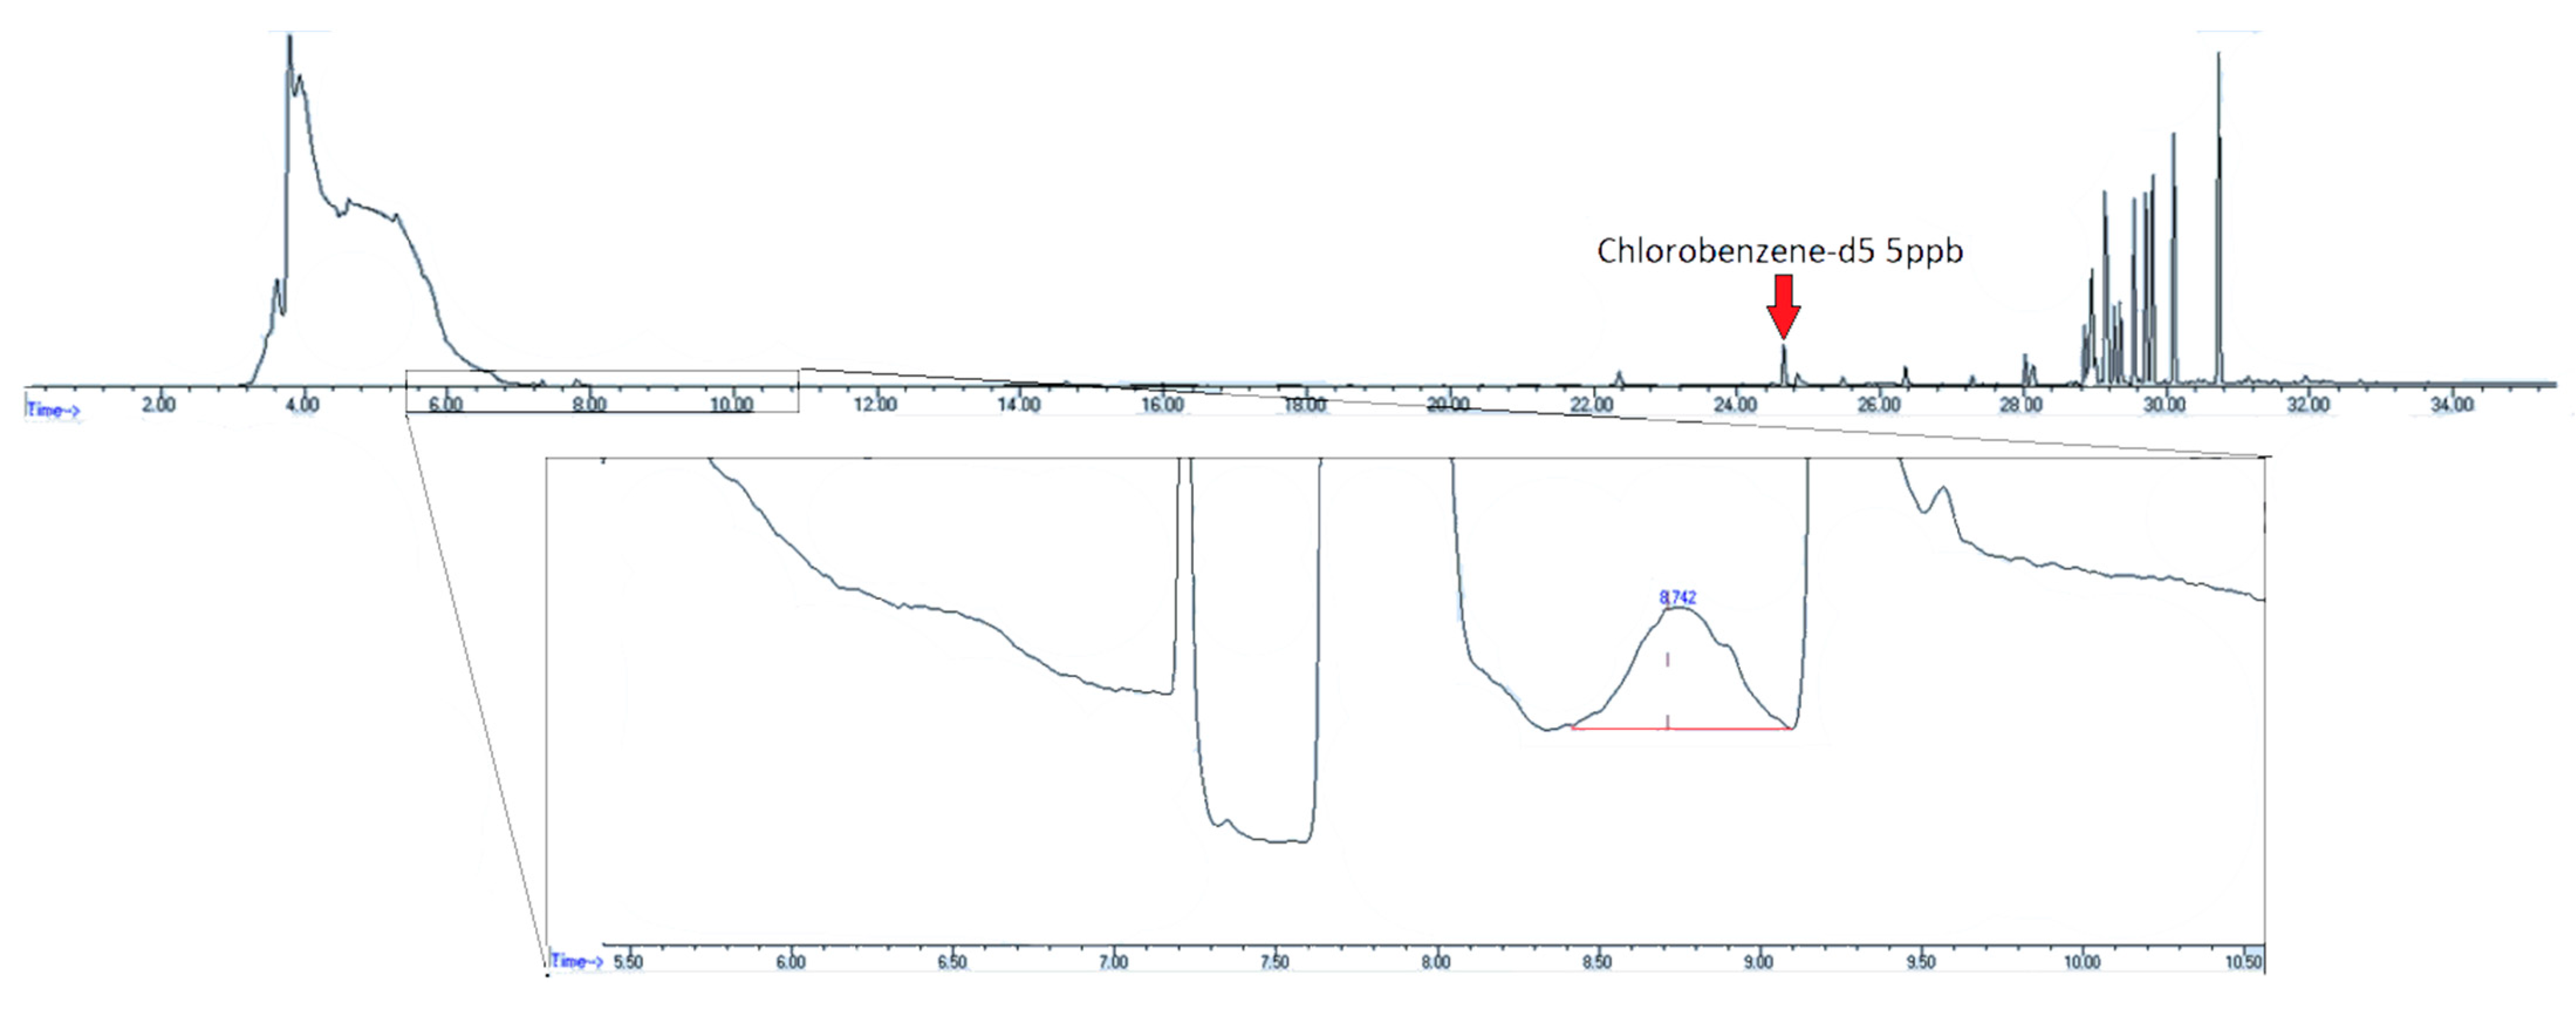
Examination of humid air blanks of heavily used canisters showed high initial levels of EtO. Figure 7 shows the chromatogram of a canister with high levels of contamination from unknown, non-target compounds. The contaminant peaks are over ten times the area of the nearest eluting internal standard compound, chlorobenzene-d5, and the EtO concentration is 5.9 ppbv.
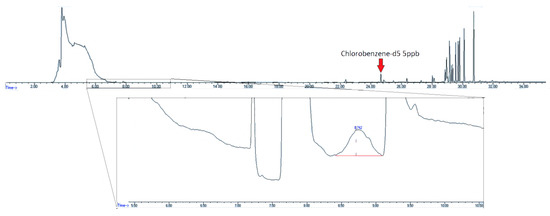
Figure 7.
Chromatogram of contaminated air canister post standard canister cleaning with standard evacuation/pressurization cycle. Insert–SIM trace of m/z 29. EtO concentration–5.9 ppbv.
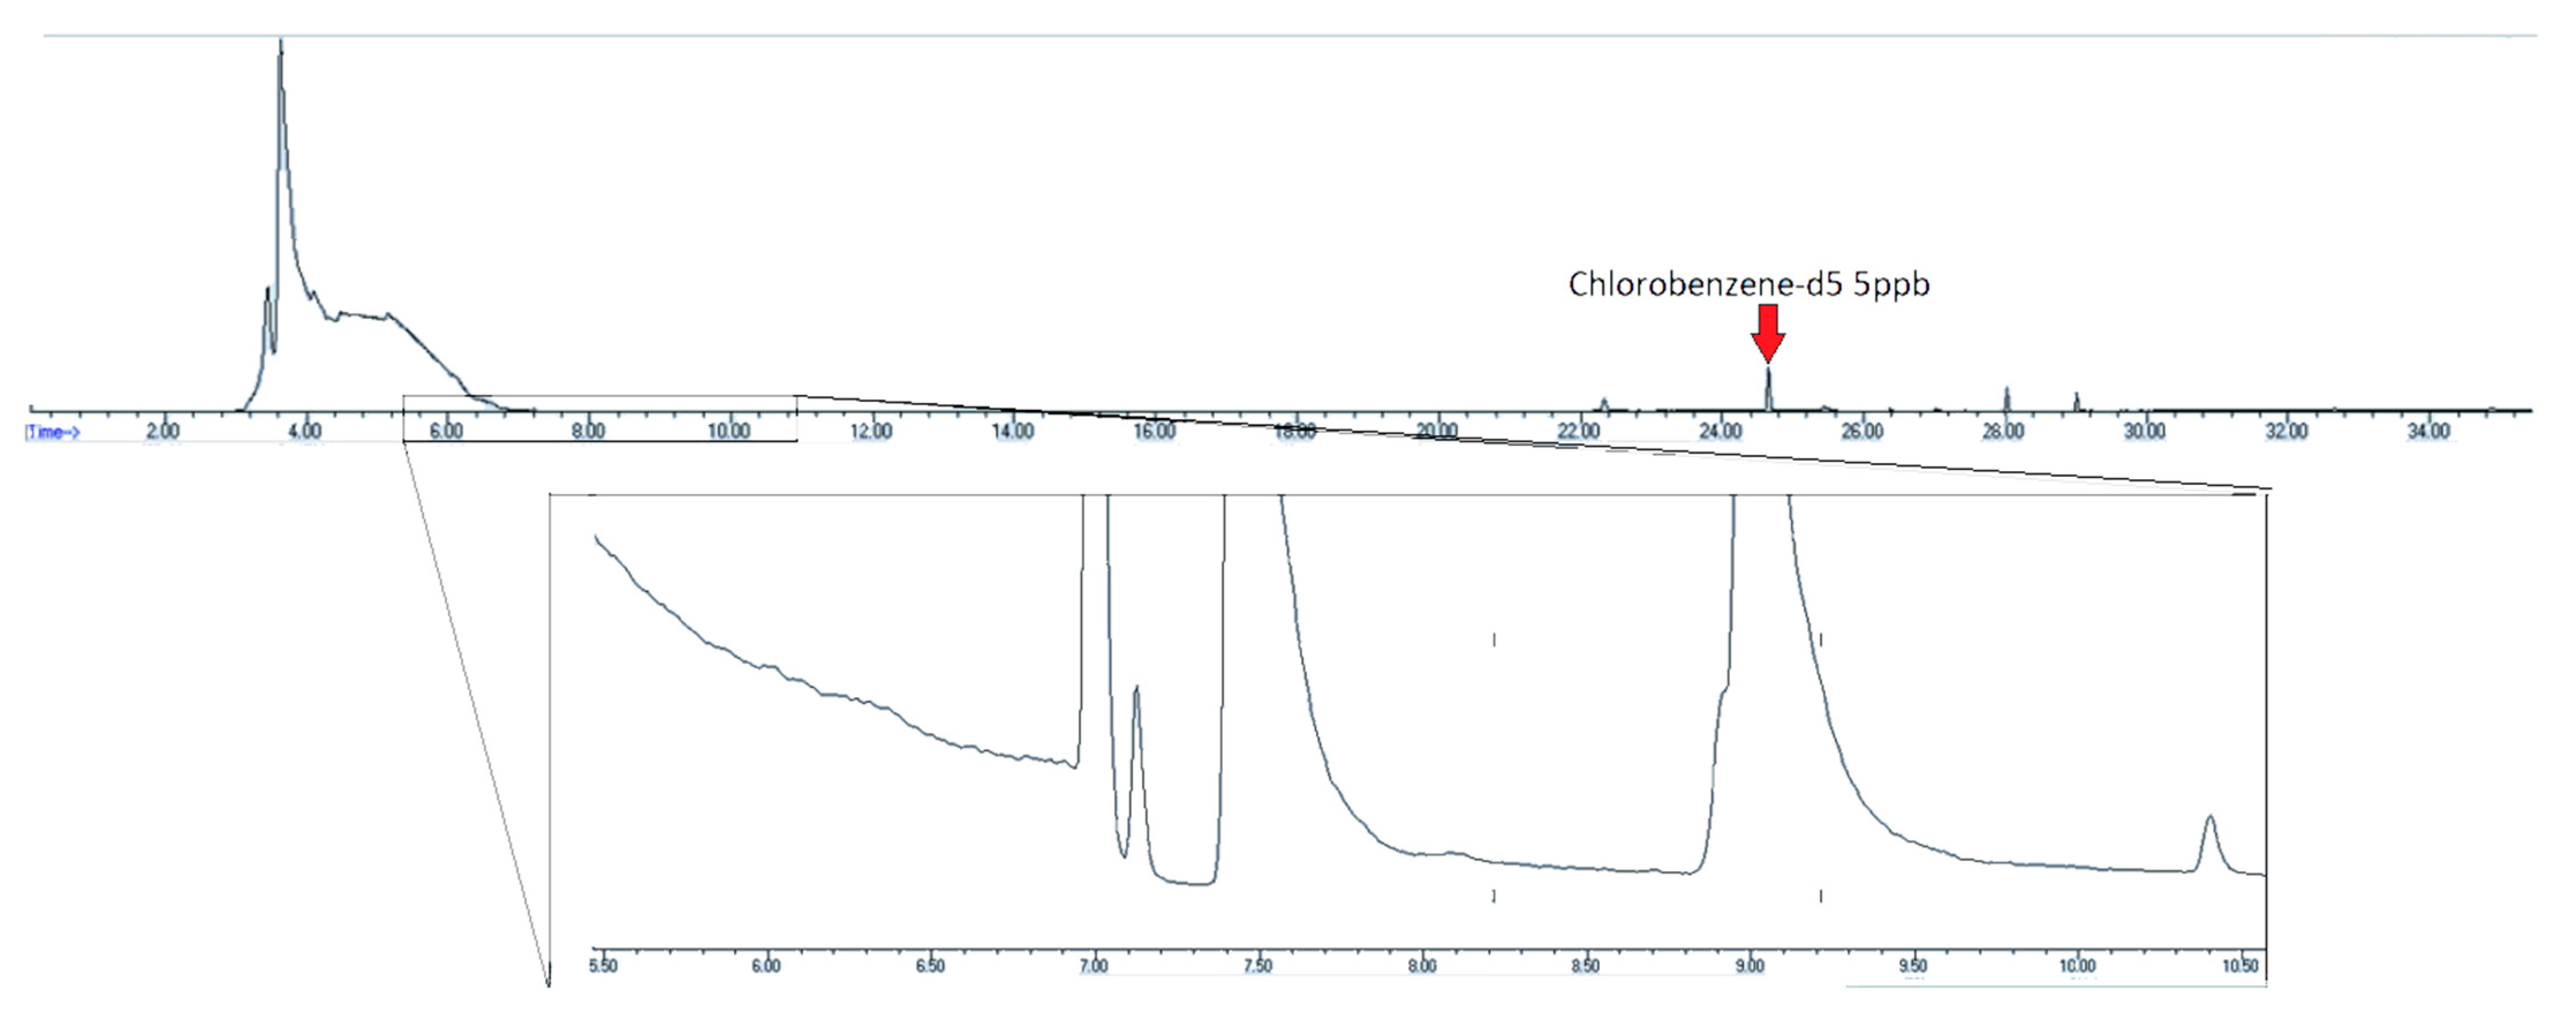
The standard canister cleaning method is a cycle of evacuations and pressurization with humidified zero air [21]. However, the canister in Figure 8 was analyzed after such a cleaning process, showing that it is not sufficient to fully clean heavily contaminated canisters. Restek is developing a proprietary cleaning process that is capable of cleaning canisters that may be too contaminated for the traditional cleaning process. Figure 8 shows the contaminated canister post-proprietary cleaning. In addition to the late eluting non-target compounds being removed, the EtO background was below the detection limit (<LOQ).
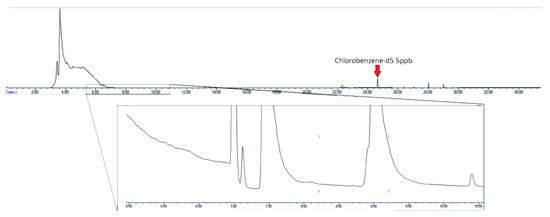
Figure 8.
Chromatogram of contaminated air canister post-proprietary cleaning. Insert–SIM trace of m/z 29. EtO concentration–<LOQ.
Some canisters required more than one round of the proprietary cleaning process to remove EtO contamination. Table 12 shows the results of several contaminated canisters cleaned initially with a standard cycle of evacuation and pressurization with humidified air, followed by a round of proprietary cleaning. The canisters were then stored for 5 months, evacuated and filled with humid air and analyzed again, then subjected to another round of cleaning and analysis. All canisters showed an initial reduction in EtO after the proprietary cleaning. Canisters 1 and 4 showed EtO contamination after 5 months of storage, but canisters 2 and 3 did not show any EtO. The second round of cleaning left canister 1 showing no EtO contamination. Canister 4 showed interference with m/z 29 used for quantitation of EtO but no presence of the secondary ions, indicating non-EtO interference. This shows that the proprietary cleaning is capable of reducing EtO contamination, but further optimization may be needed to fully clean very contaminated canisters.
Table 12.
Contaminated canister cleaning results, done in 50% humid air. Results marked with * showed interference with the quantitation ion, but no secondary ion confirmation.
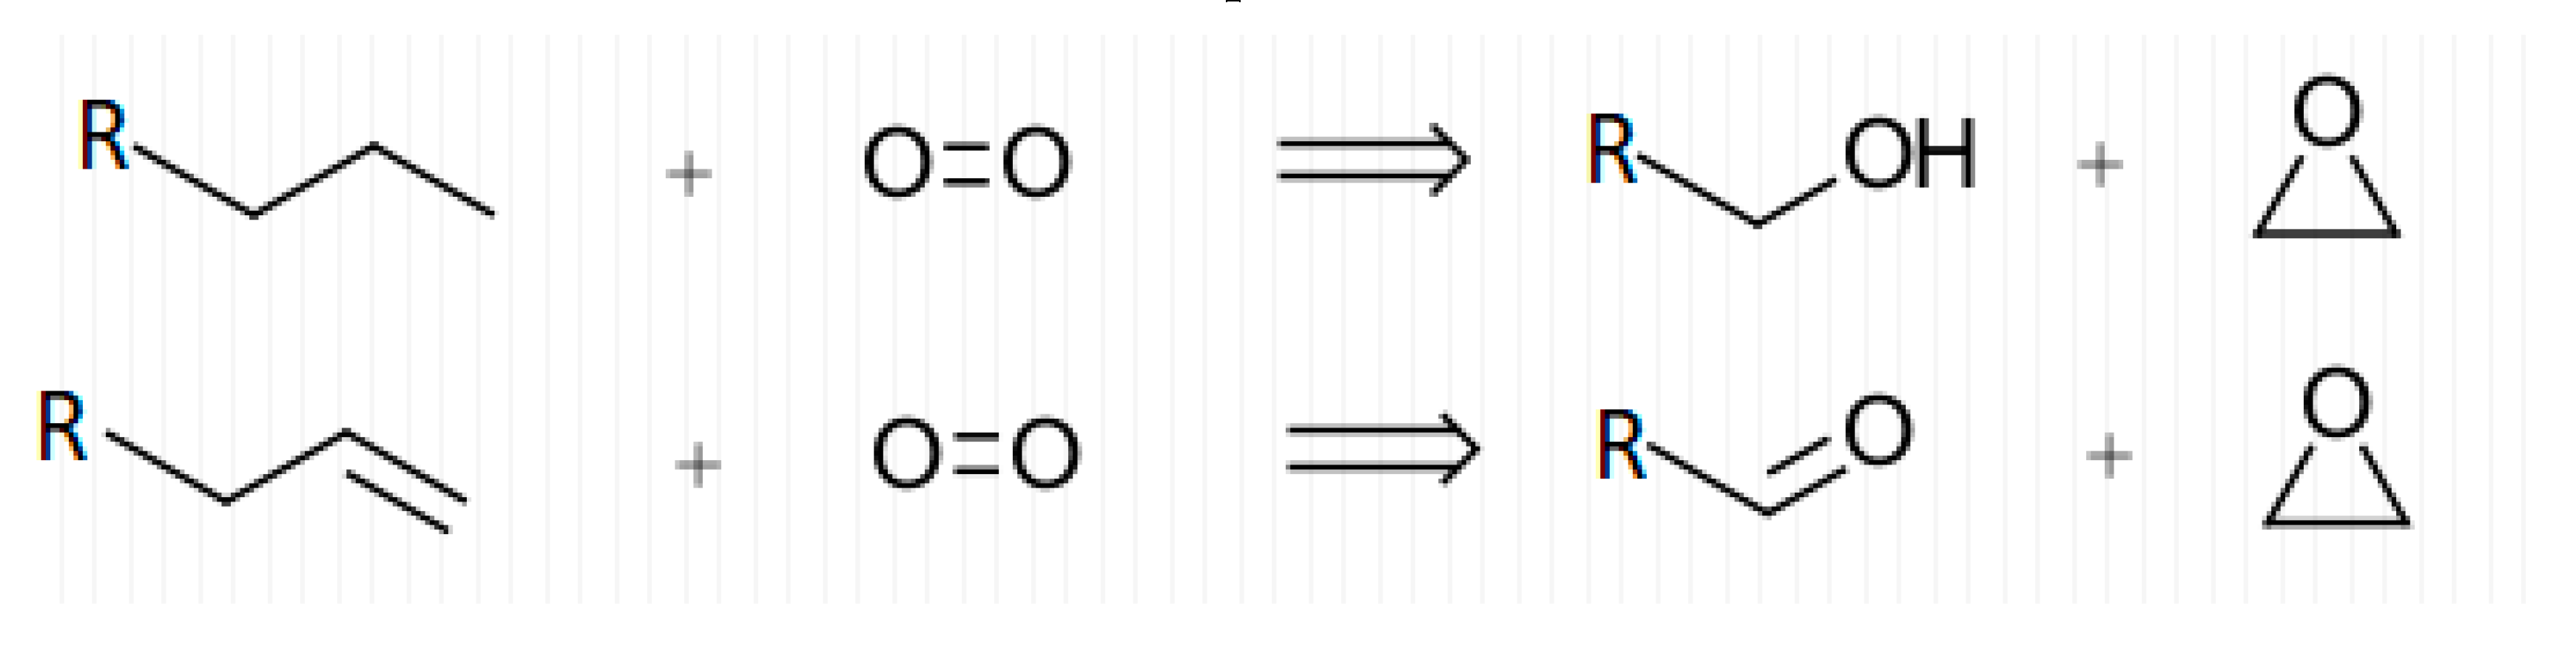
The correlation between thorough cleaning and decreased EtO concentrations show that background EtO levels in canisters can be tied to canister cleanliness. The lack of EtO present in blanks filled with dry or inert atmospheres show that this background may only express itself in the presence of humid air. Given this, it is possible that EtO is formed by the breakdown of larger carbon compounds with oxygen, catalyzed by humidity and the metal canister surface. Figure 9 shows proposed general reactions for the formation of EtO from contaminant compounds.
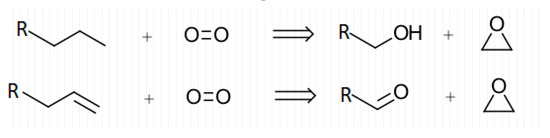
Figure 9.
Proposed general reactions for the formation of EtO in canisters.
Canisters should be thoroughly blank tested using humidified air before being put in EtO use, and only very clean canisters may be suitable for use. It is also important to note the value of using a SIM/Scan method to detect the presence of such SVOCs, which would otherwise be missed by a SIM only method and result in erroneously biased high EtO results. The canisters used for the method performance data in this paper were all new or lightly used, and showed no initial EtO background. The potential for growth and the disparity between the stability shown here and what was obtained by Enthalpy Analytical [25] show the need for laboratories to conduct their own stability tests on canisters intended for use for EtO to verify how their specific canisters may perform.
4. Discussion and Conclusions
The canister-based sampling approach and preconcentrator-GC-MS analysis method for EtO presented here allows for the fast analysis of complex ambient air samples in under 40 min. US EPA interest in including EtO in existing air sampling shows a need for analysis of EtO and other VOCs in ambient air. Unlike the adsorbent and HBr derivatization approaches commonly used in personal air monitoring methods, this approach allows for the simultaneous analysis of 75 other VOCs in addition to EtO, reducing duplicate sampling, preparation, and analysis of samples. The incorporation of the existing environmental analysis method TO-15A makes this method potentially easy for testing labs to incorporate into their existing testing. This would allow labs performing analysis for the NATTS studies will be able to analyze for EtO and other volatile air compounds using a single method, increasing sample throughput. Furthermore, laboratories may applicate the current method to NIOSH Canister Method 3900 for personal and workplace air monitoring of EtO, as well as the extended range of 75 VOCs demonstrated here [27]. Detection limits for EtO of 18.2 pptv are achievable, with repeatability of 12% RSD between canisters at 500 pptv, showing that low level and repeatable analysis of EtO is possible at pptv levels. While EtO growth is possible in contaminated canisters, the use of properly clean canisters shows EtO stability in standards for up to 1 week in 50% humid air.
Future work should be directed at better understanding the mechanism behind EtO growth in blank canisters. This would allow for improvements in the proprietary cleaning process, reduced blank contamination and bias at low levels, and a better determination of suitable holding times for EtO in canisters. Given the low levels of EtO found in ambient air by the US EPA, greater confidence in low level EtO measurements will be key in understanding ambient background concentrations in air. Further validation on the TO-15A compounds should be done as well, although extensive work has been done on these compounds under many chromatographic conditions, so it is not expected that these compounds will have any issues being validated to TO-15A standards.
Author Contributions
Conceptualization, J.H. and J.S.H.; Methodology, J.H. and J.S.H.; Validation, J.H. and J.S.H.; Formal Analysis, J.H. and J.S.H.; Investigation, J.H. and J.S.H.; Resources, J.H. and J.S.H.; Data Curation, J.H. and J.S.H.; Writing—Original Draft Preparation, J.H.; Writing—Review & Editing, J.H. and J.S.H.; Visualization, J.H.; Supervision, J.S.H.; Project Administration, J.S.H. All authors have read and agreed to the published version of the manuscript.
Funding
This research received no external funding.
Institutional Review Board Statement
Not applicable.
Informed Consent Statement
Not applicable.
Data Availability Statement
Not applicable.
Acknowledgments
The authors would like to acknowledge Douglas Tuner of Battelle for his insightful conversations around VOC formation in canisters.
Conflicts of Interest
The authors declare no conflict of interest.
Appendix A
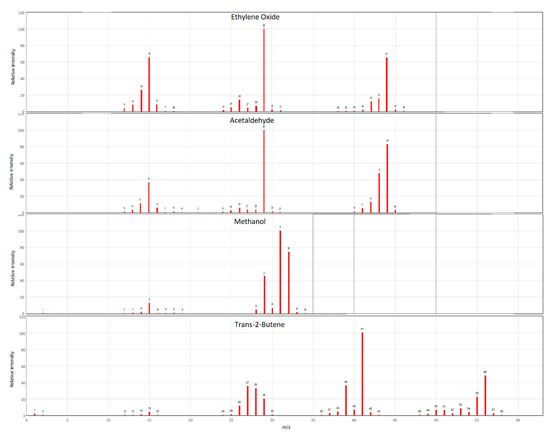
Figure A1.
Mass spectra of EtO (top) and potential coelutions. Mass spectra taken from NIST database.
Figure A1.
Mass spectra of EtO (top) and potential coelutions. Mass spectra taken from NIST database.
References
- Dutia, P. Ethylene Oxide: A Techno-Commercial Profile. Chem. Wkly. 2010, 53, 199–203. [Google Scholar]
- Shah, Y.; Michael, S. OSHA Method 1010; Occupational Safety and Health Administration: Sandy, UT, USA, 2014.
- Mendes, G.C.; Brandao, T.R.; Silva, C.L. Ethylene oxide sterilization of medical devices: A review. Am. J. Infect. Control 2007, 35, 574–581. [Google Scholar] [CrossRef] [PubMed]
- Rutala, W.A.; Weber, D.J. Guideline for Disinfection and Sterilization in Healthcare Facilities; United States Centers for Disease Control and Prevention: Atlanta, GA, USA, 2008.
- 2019 Toxic Release Inventory Factsheet—Ethylene Oxide, 000075218; United States Environmental Protection Agency: Washington, DC, USA, 2020.
- Jinot, J.; Bayliss, D.; Fritz, J.; Kahn, H.D.; Keshava, N.; McGaughy, R.; Subramaniam, R.; Valcovic, L.; Valimiri, S. Evaluation of the Inhalation Carcinogenicity of Ethylene Oxide; United States Environmental Protection Agency: Washington, DC, USA, 2016.
- Work to Understand Background Levels of Ethylene Oxide; United States Environmental Protection Agency: Washington, CD, USA, 2020.
- Ethylene Oxide Ambient Concentrations at National Air Toxics Trends Stations and Urban Air Toxics Monitoring Program Stations. 2019. Available online: https://www.epa.gov/sites/production/files/2019-11/documents/data_summary_stations.pdf (accessed on 10 December 2020).
- Documentation of the Threshold Limit Values and Biological Exposure Indices, 7th ed.; American Conference of Governmental Industrial Hygienists, Inc.: Cincinatti, OH, USA, 2001.
- NIOSH Method 1614; National Institute for Occupational Safety and Health: Washington, DC, USA, 1994.
- Krämer, W. Method for the determination of Ethylene Oxide; German Social Accident Insurance: Weinheim, Germany, 2006. [Google Scholar]
- Esposito, G.C.; Williams, K.; Bongiovanni, R. Determination of ethylene oxide in air by gas chromatography. Anal. Chem. 1984, 56, 1950–1953. [Google Scholar] [CrossRef]
- Lefevre, C.; Ferrari, P.; Delcourt, J.; Guenier, J.P.; Muller, J. Ethylene oxide pollution evaluation Part II: Sampling on HBr-treated charcoal tubes. Chromatographia 1986, 21, 269–273. [Google Scholar] [CrossRef]
- Ueta, I.; Saito, Y.; Ghani, N.B.A.; Ogawa, M.; Yogo, K.; Abe, A.; Shirai, S.; Jinno, K. Rapid determination of ethylene oxide with fiber-packed sample preparation needle. J. Chromatogr. A 2009, 1216, 2848–2853. [Google Scholar] [CrossRef] [PubMed]
- Tsai, S.-W.; Tsai, S.-T.; Wang, V.-S.; Lai, J.-S. Laboratory and field validations of a solid-phase microextraction device for the determination of ethylene oxide. J. Chromatogr. A 2004, 1026, 25–30. [Google Scholar] [CrossRef] [PubMed]
- Tsai, S.-W.; Wu, K.-K. Determination of ethylene oxide by solid-phase microextraction device with on-fiber derivitization. J. Chromatogr. A 2003, 991, 1–11. [Google Scholar] [CrossRef]
- Luong, J.; Gras, R.; Cortes, H.; Shellie, R. Temperature-programmable low thermal mass silicon micromachined gas chromatography and differential mobility detection for the fast analysis of trace level of ethylene oxide in medical work place atmospheres. J. Chromatogr. A 2012, 1261, 136–141. [Google Scholar] [CrossRef] [PubMed]
- Gimeno, P.; Auguste, M.-L.; Handlos, V.; Nielsen, A.M.; Schmidt, S.; Lassu, N.; Vogel, M.; Fischer, A.; Brenier, C.; Duperray, F. Identification and quantification of ethylene oxide in sterilized medical devices using multiple headspace GC/MS measurement. J. Pharm. Biomed. Anal. 2018, 158, 119–127. [Google Scholar] [CrossRef] [PubMed]
- Qazi, A.H.; Ketcham, N.H. A new method for monitoring personal exposure to ethylene oxide in the occupational environment. Am. Ind. Hyg. Assoc. J. 1977, 38, 635–647. [Google Scholar] [CrossRef] [PubMed]
- Romano, S.J.; Renner, J.A. Analysis of ethylene oxide—Woker exposure. Am. Ind. Hyg. Assoc. J. 1979, 40, 742–745. [Google Scholar] [CrossRef] [PubMed]
- Whitaker, D.; Oliver, K.; Shelow, D.; Turner, D.; MacGregor, I. Method TO-15A; United States Environmental Protection Agency: Washington, DC, USA, 2019.
- Herrington, J.S. Meeting NJ Low Level TO-15 Air Testing method Requirements; Restek Corporation: Bellefonte, PA, USA, 2017. [Google Scholar]
- US Environmental Protection Agency. Code of Federal Regulations, 40 CFR Part 136 Appendix B, Definition and Procedure for the Determination of the Method Detection Limit, Revision 2; US Environmental Protection Agency: Washington, DC, USA, 2019.
- Wallace, W.E. “Mass Spectra” in NIST Chemistry WebBook, NIST Standard Reference Database Number 69; National Institute of Standards and Technology: Gaithersburg, MD, USA, 2020.
- Berkowitz, D.; Daniels, D.; Velleco, B. Optimization of EPA Method TO-15 for Analysis of ppt Levels of Ethylene Oxide in Ambient Air. 2 April 2019. Available online: https://montrose-env.com/wp-content/uploads/2017/09/Optimization-of-EPA-Method-TO-15-for-Analysis-of-ppt-Levels-of-Ethylene-AWMA.pdf (accessed on 11 January 2021).
- Whitaker, D.; Oliver, K. Improving the Analysis of Acrolein in Ambient Air; United States Environmental Protection Agency: Washington, DC, USA, 2015.
- NIOSH Manual of Analytical Methods. Method 3900—Volatile Organic Compounds, C1 to C10, Canister Method; National Institute of Occupational Safety and Health: Washington, DC, USA, 2018.


Publisher’s Note: MDPI stays neutral with regard to jurisdictional claims in published maps and institutional affiliations. |
© 2021 by the authors. Licensee MDPI, Basel, Switzerland. This article is an open access article distributed under the terms and conditions of the Creative Commons Attribution (CC BY) license (http://creativecommons.org/licenses/by/4.0/).