Article

Single-Run Separation and Quantification of 14 Cannabinoids Using Capillary Electrophoresis

1
Department of Biology, University of Ottawa, Ottawa, ON K1N 6N5, Canada
2
Department of Chemistry and Biomolecular Sciences, University of Ottawa, Ottawa, ON K1N 6N5, Canada
3
Lumex Instruments Canada, Mission, BC V4S 0A3, Canada
*
Author to whom correspondence should be addressed.
Separations 2021, 8(3), 30; https://doi.org/10.3390/separations8030030
Submission received: 10 January 2021 / Revised: 4 March 2021 / Accepted: 9 March 2021 / Published: 12 March 2021
(This article belongs to the Special Issue Trends and Recent Advances in Capillary Electrophoresis)

Abstract

:
Quantification of major cannabinoids in cannabis products is normally performed using high-pressure liquid chromatography (HPLC)-based methods. We propose a cost-effective alternative method that successfully separates and quantifies 14 cannabinoids in a single run using capillary electrophoresis (CE) coupled with a UV detector in 18 min. The separation is carried out in 60% acetonitrile in the presence of 6.5 mM sodium hydroxide and 25 µM β-cyclodextrin, resulting in good separation of cannabinoids. Our CE method demonstrated the limit of detection between 1.2–1.8 µg/mL, with the linear range reaching up to 50 µg/mL. We validated the method performance by testing a plant extract and quantifying cannabinoid content. This method is the first to separate 14 cannabinoids in one run using a CE system with UV detection.

1. Introduction

Cannabis sativa L. is a flowering plant in the family Cannabaceae [1] and its taxonomy has been widely debated, with some scientists considering the plant to be a polytypic genus with three subspecies—sativa, indica, and ruderalis—and others considering these taxa to be different species [2]. In addition, the continual cross-breeding of C. sativa- and C. indica-like plants has led to many perceiving the group as one species, C. sativa. Phytochemically, C. sativa is recognized for its production of cannabinoids, which are unique to cannabis and underlie its therapeutic potential, including management of anxiety and stress-related symptoms [3], stimulation of appetite [4], pain relief [5], and promotion of sleep [6].
The Cannabis Act (Bill C-45) legalized adult access to cannabis in Canada on 17 October 2018 [7]. It permits the selling of fresh and dried cannabis, cannabis plants and seeds, and cannabis oil by an authorized entity with subsequent regulation of commercial edible products and concentrates the year following [8]. In terms of the cannabinoid content, the regulation requires quantification of only tetrahydrocannabinol (THC), tetrahydrocannabinolic acid (THCA), cannabidiol (CBD), and cannabidiolic acid (CBDA).
In the USA, cannabis legalization is more nuanced. At the federal level, cannabis is recognized under the Controlled Substances act as a Schedule 1 substance, where it is considered to have a high potential for dependency and no accepted medical use. However, the medical use of cannabis is legalized in 33 states, with 11 states also legalizing it for recreational use [9]. In Europe, recreational cannabis is illegal, although several countries have legalized it for medical use or decriminalized its use, for instance, in The Netherlands. In Italy, for example, certain cannabis products are legal, however, the ratio of THC to CBD must be under 1, and total THC content must be under 0.6% [10]. This highlights the importance of precise quantification.
Phytocannabinoids are products naturally found in C. sativa that share a typical C21 terpenophenolic skeleton [11]. The plant synthesizes cannabinoids as acids, such as THCA, where decarboxylation of the 2-COOH by heat or light leads to the neutral cannabinoids, such as THC [12,13]. This thermal conversion is a process common to all acid-form cannabinoids. To date, 120 cannabinoids have been isolated, which has led to classification by 11 types: (-)-Δ9-trans-tetrahydrocannabinol (Δ9-THC), (-)-Δ8-trans-tetrahydrocannabinol (Δ8-THC), cannabigerol (CBG), cannabichromene (CBC), cannabidiol (CBD), cannabinodiol (CBND), cannabielsoin (CBE), cannabicyclol (CBL), cannabinol (CBN), cannabitriol (CBT), and miscellaneous.
Current analytical methods for quantifying cannabis are mostly based on high-performance liquid chromatography (HPLC) [14]; however, they are costly, especially those that rely on ultra-high-performance liquid chromatography UHPLC systems. Capillary electrophoresis (CE) is an alternative separation technique that exploits intrinsic charges present on compounds and uses their different electrophoretic mobilities to separate them inside a narrow (in our case, a 75 µm internal diameter) capillary.
Our method extends to the previous work done in this area. A study dating back to 2002 performed a similar CE separation of cannabinoids extracted from hair [15]. The method described separated four cannabinoids (THC, CBD, CBN, THCA) using a very similar running background electrolyte with sodium hydroxide as an electrolyte, however, in a fully non-aqueous environment and with electrochemical detection in contrast to UV absorption. Another study with a similar method separated only THC and CBD in oral fluids; however, they employed LED-induced fluorescence for detection, with 280 nm excitation and 307 nm emission [16]. A different approach was picked in a study from 1998, where the stationary phase was involved in capillary electrochromatography to facilitate the separation of structurally similar cannabinoids [17]. 7 cannabinoids (6 decarboxylated and one acidic) were separated on a capillary packed with 3 µm C18 beads. The stationary phase helps separation due to the same charge on all cannabinoids and their similar polarity. Another approach with the exploitation of the hydrophobic nature of cannabinoids was undertaken in a study from 2012, where micellar electrokinetic chromatography with SDS was used to separate 10 cannabinoids [18]. The study demonstrated the separation of 10 cannabinoids in one run, which was not achieved before that.
Crude flower extracts sometimes yield very low amounts of certain cannabinoids, in contrast to large amounts of THC and sometimes CBD, making low concentrated compounds difficult to analyze with a UV detector. A study demonstrated a potential solution to that by introducing stacking in SDS presence to suppress electroosmotic flow [19]. They reported over a 2000-fold increase in sensitivity, overcoming one of CE’s greatest problems, which is low injection volumes.
In this work, we employed capillary electrophoresis, which relies on the acetonitrile-based background electrolyte in the presence of β-cyclodextrin (βCD). Cannabinoids are poorly soluble in water, requiring acetonitrile presence in the background electrolyte (BGE) for optimal solubility and separation. Additionally, cannabinoids share very similar ring structures and similar charges, rendering electrokinetic separation difficult to achieve or making separation time excessively long. βCD was also demonstrated to be an enhancer of cannabinoids solubility in aqueous solutions [20].
Accordingly, we added βCD, which brings an orthogonal separation media by transiently interacting with compounds based on their geometry and polarity. Besides, the CE technique is associated with extremely small sample consumption, where one injection in a particular case of this study is only 4 nL. While separation of these 14 compounds is possible in the absence of βCD, its presence shortens the analysis time by ~10 min leading to better resolution due to a lesser extent of longitudinal diffusion. CBDVA and CBGA, in the absence of βCD, migrate much later, making the analysis time very long. A drawback of our method is the low buffering capacity of BGE. Acetonitrile in our electrolyte tends to evaporate fast once the vial has been opened, leading to fast pH changes. Using fresh BGE is mandatory for reproducible data; reusing the same one twice is not recommended, as the pH will be different and data.
We propose a cost-effective, high throughput method using CE to accurately quantify 14 cannabinoids (THC, CBD, THCV, CBDV, CBG, CBN, CBC, and their respective acidic forms, see their structures in Figure S1) with detection by a UV detector at 230 nm. We separated deprotonated forms of these cannabinoids in highly basic conditions (pH ~12); furthermore, we reduced the analysis time to under 20 min with the aid of β-cyclodextrin.

2. Materials and Methods

2.1. Plant Extraction

Lyophilized cannabis flowers were ground up with a hand grinder and extracted immediately. 5 mg of ground cannabis flower material was extracted in 1 mL of methanol (Optima™ LC/MS Grade methanol, A456212, Fisher Scientific, Ottawa, ON, Canada) for 30 min on a shaker at 200 rpm at room temperature. The extracted plant material was removed by filtering through a 0.22 µm PTFE membrane syringe filter (Puradisc 25, WHA67842502, Sigma-Aldrich, Oakville, ON, Canada), and the filtrate was stored in an HPLC vial at −20 °C until further analysis.

2.2. Capillary Electrophoresis

New bare silica capillaries (75 µm ID, Molex 1068150019/50M, Fisher Scientific, Ottawa, ON, Canada) were washed and conditioned at 2000 mbar pressure as following: 5 min wash with 1M HCl, followed by 2 min wash with ddH2O, 10 min wash with 0.1M NaOH, 2 min wash with ddH2O and 5 min with BGE (6 mM NaOH and 25 µM β-cyclodextrin in 60/40 acetonitrile/water). Samples were injected into the capillary electrophoresis system (Capel 205, Lumex Instruments Canada, Mission, BC, Canada) at 10 mbar for 3 s, forming a 2 mm plug of approximately 4 nL volume. Plug volume was calculated using CE Expert lite web app (Sciex, Concord, ON, Canada). 450 V/cm electric field was applied for 19 min to separate. Cannabinoid standards were diluted in methanol and injected the same way as the samples. Standards were purchased from Cayman Chemicals (Ann Arbor, Michigan, USA; THC, 12068; THCA, ISO60175, CBD, 90080; CBDA, 18090; CBG, 15293; CBGA, 20019; CBC, 26252; CBCA, 30879; CBN, 25495; THCV, 18091; CBDV, 29117; CBGVA, 29787).

2.3. HPLC

Extracts were analyzed using an HPLC system (1100 HPLC, Agilent, Santa Clara, CA, USA) coupled with a diode array detector (DAD, series G1315) and an autosampler (series G1313). Chromatography was performed on a Kinetex® 2.6 μm C18 150 × 2.1 mm column (Phenomenex, Torrance, CA, USA) using water + 0.1% TFA (A) and methanol + 0.1% TFA (B) as the mobile phase with a linear gradient from 68% to 85% B in 13 min followed by seven minutes of isocratic conditions (85% B). The flow rate was set at 0.25 mL/min, and the column temperature was maintained at 60 °C with DAD monitoring at a wavelength of 230 nm.

2.4. Reproducibility

Precision was determined as a measure of how close the repeated injections are to each other in peak areas. The relative standard deviation was calculated to assess precision according to the formula: RSD = (SD/x) × 100, where x is the arithmetic mean of all injections. Peak areas were normalized to the respective migration times [21].

2.5. Limit of Detection and Quantification

The limit of detection (LOD) was defined as the lowest concentration of an analyte that can still be detected by the instrument. We used a method based on standard deviation (SD) of multiple injections of a standard mix (in our case, seven injections of 5 µg/mL), where LOD = (3.3 × SD)/m, where m is the slope of the linear curve. The limit of quantification (LOQ) was calculated similarly; however, instead of a coefficient of 3.3, a coefficient of 10 was used.

3. Results and Discussion

3.1. Method

This study aimed to develop a reliable CE method for the separation and quantification of 14 cannabinoids from extracted cannabis samples. CE is a technique that separates compounds based on their charge; therefore, we used highly basic (apparent pH ~12, measured with a pH meter) conditions to deprotonate all 14 standards. Cannabinoids share a highly similar ring structure and exhibit similar migration time in the capillary, causing overlapping peaks if the conditions are inadequate (incorrect pH, for instance).
A method published by Backofen [15] was used as a reference for method development described in this study. They have used a 1:1 mix of methanol and acetonitrile in the presence of 5 mM sodium hydroxide for the separation of 5 cannabinoids. In our case, 6.5 mM sodium hydroxide and high pH alone resulted in the adequate separation of all 14 peaks; however, CBDVA and CBGA were reaching the detector after 30 min of separation, making the analysis time excessive. We have also tested various concentrations of sodium dodecyl sulphate (SDS) in BGE ranging from fully aqueous to aqueous with organic modifiers, as well as fully non-aqueous BGEs; however, most additives resulted in a loss of separation of these 14 compounds, with some of them inevitably comigrating and not properly resolving. We have also tested various concentrations of sodium hydroxide; concentrations lower than 6.5 mM caused a lack of separation between CBG and THC, which started to comigrate. Concentrations of sodium hydroxide higher than 6.5 mM preserved that separation, but the loss of separation between CBN and CBC was observed. Also, higher concentrations of sodium hydroxide extended the analysis time even further.
βCD, normally used as a chiral selector in CE applications, demonstrated very positive effects on reducing the analysis time without loss of separation. Since it is an inclusion complex with a hydrophobic core, the cannabinoids would transition between βCD and BGE throughout the whole run. As a result, cannabinoids that migrate late, around 30 min, would be “carried” by βCD and migrate slightly earlier. Indeed, with βCD added to the background electrolyte, all cannabinoids still showed great separation in a much shorter time (around 10 min less), except for THC and CBG, although partially resolved, had an overlap close to the baseline. CBDVA and CBGA, which migrated after 30 min of analysis time, in the presence of βCD, started to migrate around 14 and 17 min, respectively (Figure S3). Fully non-aqueous electrolyte was not feasible since βCD was not soluble in the absence of water [22].
We found that a combination of βCD and highly basic conditions resulted in a reproducible separation of all 14 compounds (Figure 1) in a 60 cm capillary, enabling further quantification. Only two compounds (CBG and THC) were not resolved to a baseline and had a resolution of Rs = 1; all other peaks were well resolved to a baseline. While feasible for separation of most compounds, shorter capillary length results in lower resolution of CBG and THC and loss of separation.
Individual standards demonstrated high migration time reproducibility compared to the more complex mixture (Figure 1), allowing for identifying each peak. All decarboxylated cannabinoids (CBD, CBDV, CBG, THC, THCV, CBN, CBC, in this order) tend to migrate before the acidic forms (CBCA, THCA, CBNA, THCVA, CBDA, CBDVA, CBGA, in this order), which can be attributed to the higher overall negative charge on acidic cannabinoids due to their carboxyl group, and longer migration time as a result.
We performed HPLC analysis to compare with our CE method (Figure 2), which provided comparable separation over a similar run time. However, some compounds were not fully resolved with this method (THCV, CBD, CBG; CBGA and CBN; THC and THCVA). Cannabinoids share highly similar structure with similar polarity, making them difficult to separate on C18 stationary phase. Reducing the column’s particle size and increasing pressure may result in better separation and a more efficient method than the one we present in the paper; besides, more expensive UHPLC systems can be used to further improve the separation and analysis time [14].

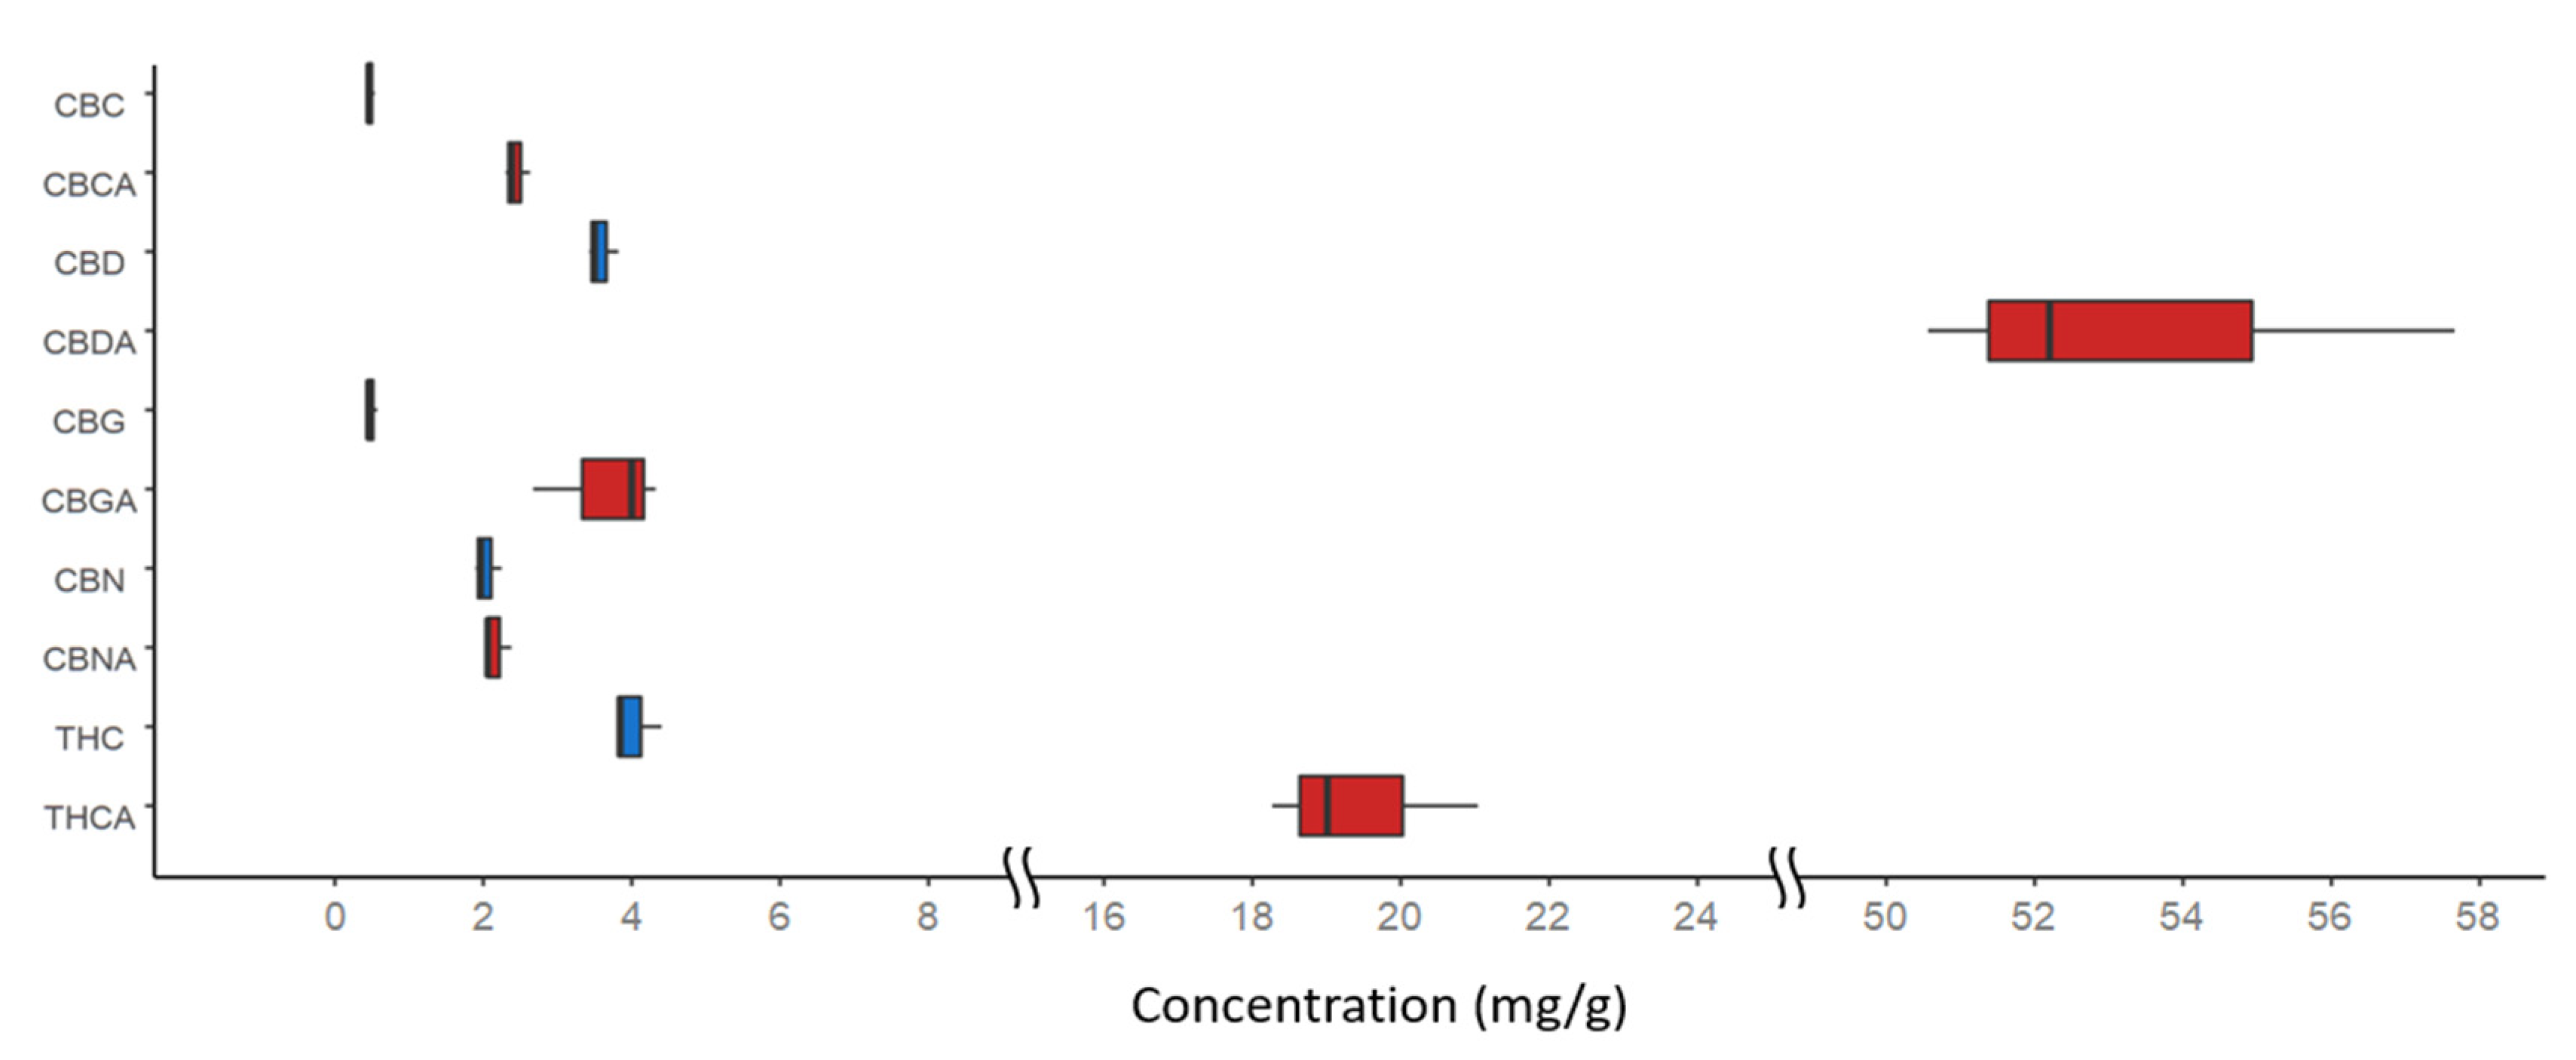
3.2. Quantitation of Cannabinoids in Samples

We demonstrated the applicability of the CE technique for cannabinoids separation in a mixture of synthetic standards. Extracts of a real cannabis flower are rich in THCA and CBDA compared to other classes of cannabinoids. This situation sometimes leads to results where the peaks representing THC, THCA, CBD, and CBDA are magnitudes larger than anything else present in the sample (Figure 3). In some cases, these peaks may overlap adjacent peaks representing low abundant cannabinoids, especially in the case of THCA, which can overlap CBCA and CBNA. However, dilution of the sample may result in loss of detection of low abundant cannabinoids. To solve the problem, two injections may be necessary for the detection and quantification of all 14 compounds: injection of concentrated sample and injection of its 10-fold dilution. In the case of our sample, this was not necessary. Additionally, concentrating the sample using solid phase extraction or simple evaporation under vacuum may assist in detection of low abundant cannabinoids, however, one must be aware of abundant peaks overlapping adjacent smaller peaks.
For all our calibration curves, we injected each concentration 3 times, except for 5 µg/mL, which we injected 7 times for accurate limits estimations (Figure S2). The CE method demonstrated the limit of detection between 1.2–1.8 μg/mL, the limit of quantitation between 3.7–5.4 μg/mL, and a linear range reaching up and exceeding 50 μg/mL (Table 1). Our standard mix showed decent precision at all concentrations except 10 µg/mL, where it had around 30% variation (Figure 4).
All 14 compounds showed highly similar RSD values, with more variation between concentrations rather than between compounds. We observed some loss of precision in the upper ranges, likely due to the higher ionic strength of the mixture injected, greatly reducing sample plug stacking. However, in complex sample mixtures, other compounds may be migrating simultaneously with the compounds of interest, interfering with quantification. We demonstrated that our CE method also provided reliable means of detecting and quantitating cannabinoids in real samples instead of a standard mix (Figure 3). Our extracted sample was analyzed using CE. We quantified all detected cannabinoids in the sample and reported our findings in Figure 5 in quantities of each compound per gram of dry flower.
While the standard mix shows all 14 compounds, in our samples, we found no traces of THCV, CBDV, THCVA, and CBDVA. We hypothesize that there may be two underlying reasons for this. First, our samples may be completely devoid of these four compounds. In this case, different strains with the presence of these compounds should be analyzed for their detection. The second reason, which we think to be the case, is the very low abundance of these compounds in the samples. In this case, more sensitive detection methods should be employed. While it is possible to use a wider capillary to increase the UV detection path’s length, more sensitive detectors such as mass spectrometers should be employed to detect and quantify these four compounds in the samples.

4. Conclusions

We propose a fast and cost-efficient method of separation and quantitation of 14 cannabinoids in refined products and crude extracts. CE is a powerful tool in analytical chemistry; however, only a handful of studies employing this technique exist, with fewer cannabinoids detected and separated than the current study. This study covers seven major classes of cannabinoids and their acidic forms, which has only been previously performed on a costly UHPLC system. Thus, we propose CE as an alternative and demonstrate its feasibility. We also perform the first separation of 14 cannabinoids using CE, with prior methods separating 10 cannabinoids only.

Supplementary Materials

The following are available online at https://www.mdpi.com/2297-8739/8/3/30/s1, Figure S1: Structures of cannabinoids present in the mix. Acid forms of cannabinoids decarboxylate in the presence of heat. Figure S2: Calibration curves of all 14 cannabinoids. Each concentration was injected as a mixture three times (n = 3), with the exception of 5 µg/mL, which was injected seven times (n = 7). Peak areas were normalized to migration times. Figure S3: Electropherograms of 5 µg/mL standard mix separated in 6 mM NaOH in 60/40 acetonitrile/water with and without addition of 25 µM β-cyclodextrin.

Author Contributions

Conceptualization, M.V.B., E.A.Z., and C.S.H.; Methodology, E.A.Z.; Software, A.E.; Validation, E.A.Z., T.L., and Y.D.; Formal Analysis, E.A.Z., and Y.D.; Investigation, E.A.Z.; Resources, M.V.B., A.E. and C.S.H.; Data Curation, E.A.Z.; Writing—Original Draft Preparation, E.A.Z., and T.L.; Writing—Review & Editing, E.A.Z., and Y.D.; Visualization, E.A.Z.; Supervision, M.V.B.; Project Administration, E.A.Z. and M.V.B.; Funding Acquisition, M.V.B. All authors have read and agreed to the published version of the manuscript.

Funding

This work was funded by an NSERC Collaborative Research and Development grant (grant number CRDPJ/491434-2016). E.A.Z. was supported by Queen Elizabeth II Graduate Scholarship in Science & Technology and funded by the Government of Ontario (Canada) and Lumex Instruments Canada Inc.

Institutional Review Board Statement

Not applicable.

Informed Consent Statement

Not applicable.

Data Availability Statement

Data is contained within the article or supplementary material.

Conflicts of Interest

One of the authors (A.E.) is an employee of Lumex Instruments Canada. The rest of the authors declare no conflict of interest.

References

  1. Small, E.; Cronquist, A. A practical and natural taxonomy for Cannabis. Taxon 1976, 25, 405–435. [Google Scholar] [CrossRef]
  2. McPartland, J.M. Cannabis systematics at the levels of family, genus, and species. Cannabis Cannabinoid Res. 2018, 3, 203–212. [Google Scholar] [CrossRef] [PubMed] [Green Version]
  3. Crippa, J.A.; Zuardi, A.W.; Martín-Santos, R.; Bhattacharyya, S.; Atakan, Z.; McGuire, P.; Fusar-Poli, P. Cannabis and anxiety: A critical review of the evidence. Hum. Psychopharmacol. Clin. Exp. 2009, 24, 515–523. [Google Scholar] [CrossRef]
  4. Mattes, R.D.; Engelman, K.; Shaw, L.M.; Elsohly, M.A. Cannabinoids and appetite stimulation. Pharmacol. Biochem. Behav. 1994, 49, 187–195. [Google Scholar] [CrossRef]
  5. Karst, M.; Wippermann, S.; Ahrens, J. Role of cannabinoids in the treatment of pain and (painful) spasticity. Drugs 2010, 70, 2409–2438. [Google Scholar] [CrossRef] [PubMed]
  6. Babson, K.A.; Bonn-Miller, M.O. Sleep disturbances: Implications for cannabis use, cannabis use cessation, and cannabis use treatment. Curr. Addict. Rep. 2014, 1, 109–114. [Google Scholar] [CrossRef] [Green Version]
  7. Gazette, C. Order Fixing 17 October 2018 as the Day on which Certain Provisions of the Act Come into Force. Available online: http://www.gazette.gc.ca/rp-pr/p2/2018/2018-07-11/html/si-tr52-eng.html (accessed on 17 October 2018).
  8. The Cannabis Act: The Facts. Available online: https://www.canada.ca/en/health-canada/news/2018/06/backgrounder-the-cannabis-act-the-facts.html (accessed on 20 June 2018).
  9. State Medical Marijuana Laws. Available online: https://www.ncsl.org/research/health/state-medical-marijuana-laws.aspx (accessed on 1 March 2021).
  10. Dei Cas, M.; Casagni, E.; Saccardo, A.; Arnoldi, S.; Young, C.; Scotti, S.; de Manicor, E.V.; Gambaro, V.; Roda, G. The Italian panorama of cannabis light preparation: Determination of cannabinoids by LC-UV. Forensic Sci. Int. 2020, 307, 110113. [Google Scholar] [CrossRef] [PubMed]
  11. ElSohly, M.A.; Radwan, M.M.; Gul, W.; Chandra, S.; Galal, A. Phytochemistry of Cannabis sativa L. Phytocannabinoids 2017, 103, 1–36. [Google Scholar]
  12. Dussy, F.E.; Hamberg, C.; Luginbühl, M.; Schwerzmann, T.; Briellmann, T.A. Isolation of Δ9-THCA-A from hemp and analytical aspects concerning the determination of Δ9-THC in cannabis products. Forensic Sci. Int. 2005, 149, 3–10. [Google Scholar] [CrossRef]
  13. Yamauchi, T.; Shoyama, Y.; Aramaki, H.; Azuma, T.; Nishioka, I. Tetrahydrocannabinolic acid, a genuine substance of tetrahydrocannabinol. Chem. Pharm. Bull. 1967, 15, 1075–1076. [Google Scholar] [CrossRef] [PubMed] [Green Version]
  14. Mandrioli, M.; Tura, M.; Scotti, S.; Gallina Toschi, T. Fast Detection of 10 Cannabinoids by RP-HPLC-UV Method in Cannabis sativa L. Molecules 2019, 24, 2113. [Google Scholar] [CrossRef] [PubMed] [Green Version]
  15. Backofen, U.; Matysik, F.-M.; Lunte, C.E. Determination of cannabinoids in hair using high-pH non-aqueous electrolytes and electrochemical detection: Some aspects of sensitivity and selectivity. J. Chromatogr. A 2002, 942, 259–269. [Google Scholar] [CrossRef]
  16. Mazina, J.; Spiljova, A.; Vaher, M.; Kaljurand, M.; Kulp, M. A rapid capillary electrophoresis method with LED-induced native fluorescence detection for the analysis of cannabinoids in oral fluid. Anal. Methods 2015, 7, 7741–7747. [Google Scholar] [CrossRef]
  17. Lurie, I.S.; Meyers, R.P.; Conver, T.S. Capillary electrochromatography of cannabinoids. Anal. Chem. 1998, 70, 3255–3260. [Google Scholar] [CrossRef] [PubMed]
  18. Gottardo, R.; Bertaso, A.; Pascali, J.; Sorio, D.; Musile, G.; Trapani, E.; Seri, C.; Serpelloni, G.; Tagliaro, F. Micellar electrokinetic chromatography: A new simple tool for the analysis of synthetic cannabinoids in herbal blends and for the rapid estimation of their log P values. J. Chromatogr. A 2012, 1267, 198–205. [Google Scholar] [CrossRef] [PubMed]
  19. Cheng, H.-L.; Tsai, Y.-H.; Hsu, W.-L.; Lin, Y.-H. An on-line stacking capillary electrophoresis method for the analysis of Δ9-tetrahydrocannabinol and its metabolites. J. Chromatogr. A 2015, 1426, 226–232. [Google Scholar] [CrossRef] [PubMed]
  20. Hippalgaonkar, K.; Gul, W.; ElSohly, M.A.; Repka, M.A.; Majumdar, S. Enhanced solubility, stability, and transcorneal permeability of delta-8-tetrahydrocannabinol in the presence of cyclodextrins. Aaps Pharmscitech 2011, 12, 723–731. [Google Scholar] [CrossRef] [PubMed] [Green Version]
  21. Schmitt-Kopplin, P.; Garmash, A.V.; Kudryavtsev, A.V.; Menzinger, F.; Perminova, I.V.; Hertkorn, N.; Freitag, D.; Petrosyan, V.S.; Kettrup, A. Quantitative and qualitative precision improvements by effective mobility-scale data transformation in capillary electrophoresis analysis. Electrophoresis 2001, 22, 77–87. [Google Scholar] [CrossRef]
  22. da Silva Júnior, W.F.; de Oliveira Pinheiro, J.G.; Moreira, C.D.; de Souza, F.J.; de Lima, Á.A. Alternative technologies to improve solubility and stability of poorly water-soluble drugs. Multifunct. Syst. Comb. Deliv. Biosensing Diagn. 2017, 281–305. [Google Scholar] [CrossRef]
Figure 1. CE electropherograms of 14 cannabinoids in a standard mix and individually. 50 μg/mL of compounds either individually or in a mix were injected and detected with a UV detector at 230 nm. Background electrolyte (BGE): 6 mM NaOH and 25 µM β-cyclodextrin in 60/40 acetonitrile/water. 450 V/cm field was applied to the capillary for 19 min. The first small peak present in all injections represents the injection plug reaching the detector via electroosmotic flow. Blue electropherograms represent decarboxylated forms of cannabinoids, while red electropherograms represent carboxylated forms. EOF represents an injection plug reaching the detector.
Separations 08 00030 g001
Figure 2. A representative HPLC chromatogram of a 14-cannabinoid standard mix. Fifty μg/mL mix was injected and detected with a DAD detector at 230 nm. Chromatography was performed using water + 0.1% TFA (A) and methanol + 0.1% TFA (B) as the mobile phase with a linear gradient from 68% to 85% B in 13 min followed by seven minutes of isocratic conditions (85% B). The flow rate was set at 0.25 mL/min, and the column temperature was maintained at 60 °C.
Separations 08 00030 g002
Figure 3. Electropherograms of a cannabis extract and standard mix detected at 230 nm. Both cannabis extract and standard mix were injected from methanol; 50 μg/mL mix was injected for migration reference standard and detected at 230 nm. BGE: 6 mM NaOH and 25 μM β-cyclodextrin in 60/40 acetonitrile/water. 450 V/cm field was applied to the capillary for 19 min.
Separations 08 00030 g003
Figure 4. Relative standard deviations (RSD) for the peak areas (precision) for each cannabinoid at different concentrations (n = 3). Peak areas were normalized to migration times.
Separations 08 00030 g004
Figure 5. Boxplot representations of cannabinoid quantities per one gram of dry cannabis flower (n = 3).
Separations 08 00030 g005
Table 1. Limits of detection (LOD) and quantification (LOQ) for cannabinoid compounds (n = 7).
Compound NameLOD (µg/mL)LOQ (µg/mL)
CBD1.33.8
CBDV1.23.7
CBG1.54.6
THC1.23.7
THCV1.34.0
CBN1.44.1
CBC1.23.7
CBCA1.44.3
THCA1.33.8
CBNA1.44.3
THCVA1.64.8
CBDA1.44.1
CBDVA1.85.4
CBGA1.75.0
Publisher’s Note: MDPI stays neutral with regard to jurisdictional claims in published maps and institutional affiliations.

