Abstract
Chromatography is a powerful and generally applicable method for the analytical separation and quantification of the chemical constituents in complex mixtures because chromatographic separation can provide high selectivity by isolating all analytes from interferences. Multiway analysis based on the multilinear model is an increasingly widely used method for interference-free and fast determination of the chemical constituents also in complex mixtures because multilinear mathematical separation can provide high selectivity by extracting the pure signal of the analyte from the mixed signal of a real sample. By combining chromatographic separation with mathematical separation, multiway calibration method, multiway standard additions method, and multiway internal standard method can be established. Chromatography assisted by multiway analysis can reduce the requirements for complete chromatographic separation, save elution time, and decrease the consumption of the mobile phase, particularly when the peak coelution problem is difficult to solve. This review presents the fundamentals and analytical applications of multilinear mathematical separation in chromatography.
1. Introduction
There are very few analytical methods that are specific for quantitative analysis of an analyte in complex mixtures. Therefore, the treatment of interferences is often a vital step in an analytical procedure [1,2,3,4]. Because chromatographic separation can provide high selectivity by isolating all analytes from interferences, chromatography has been a powerful and generally applicable method for the analytical separation and quantification of the chemical constituents in complex mixtures [5,6]. Chromatography is an analytical separation technique in which the constituents of a sample are separated based on differences in migration rates at which they are carried through a stationary phase by a mobile phase [5]. With a proper detector at the outlet of the column, a chromatogram can be recorded. Traditionally, an analyte is identified by its elution time and is quantified by its peak height (or area) with the standard curve method, the standard addition method, or the internal standard method. All of the methods are based on the linear model yi = m xi + b and demand that the signal should be fully selective for the analyte.
For quantitative analysis of multiple analytes with widely different distribution constants in complex real samples, it is often difficult to achieve a complete chromatographic separation in proper time. In practice, analysts deal with this problem by decreasing the strength of the mobile phase, by using the gradient elution, or by changing the stationary phase [3,5]. A price paid for gradient elution is that the separation system needs time to be re-equilibrated between runs, and the price of purchasing optimally suitable chromatographic columns for different types of chemical compounds is expensive. Nevertheless, the peak coelution problem may still remain. Alternatively, multiway analysis based on the multilinear model can be utilized for enhancing the selectivity of chromatographic separation by mathematical separation [7,8,9,10,11,12].
Multiway analysis originated in psychometrics in 1944 [13]. Pioneering studies on the parallel factor (PARAFAC) model were published independently by Harshman [14] and Carroll [15] in 1970. While multiway analysis has been rapidly developed in chemometrics, mainly because of the discovery of the second-order advantage in quantitative chemical analysis in 1978 [16], it allows the quantitative determination of analytes in a complex mixture even in the presence of unmodelled signal interferences. By contrast, quantitative chemical analysis is traditionally achieved based on the selective signal of the analyte; if there is any signal interference, it must be masked or removed (precipitation, distillation, extraction, or chromatographic separation) before measurement. Therefore, the revolutionary discovery of the second-order advantage provided a completely new strategy for quantitative chemical analysis and made multiway analysis find its practical value in analytical chemistry. During the decades that followed, the theory and practical application of multiway analysis matured considerably in chemometrics [17,18,19,20,21], on which a guiding theory of analytical chemistry was gradually established [22]. This theory can be used to guide analysts in optimizing existing analytical methods and developing powerful analytical methods. In recent years, multiway analysis has attracted special attention in mathematics [23,24].
The most commonly used model in the multiway analysis is the multilinear model [25,26,27,28,29,30,31,32,33,34,35,36,37,38,39,40]. Multiway analysis based on the multilinear model mainly includes the three-way analysis, and its fundamentals [41,42,43,44,45,46] and analytical applications [47,48,49,50,51,52,53,54,55,56,57,58,59,60] have been extensively studied; there is also an increasing number of research papers on four-way analysis [61,62,63,64,65,66,67,68,69,70,71,72,73,74,75]. In the three-way analysis based on the trilinear model (i.e., the PARAFAC model), the trilinear decomposition process can extract the signal profiles of each analyte from the mixed signal of the complex mixture. Thereafter, interference-free determination of each analyte can be achieved through a linear least-squares analysis step similar to the standard curve method. This is generally called the three-way calibration (also called second-order calibration) method. Analogously, the multiway standard additions method can be developed and used in cases in which matrix effects are a problem [76,77,78], and the multiway internal standard method can also be developed and used when instrument response varies from run to run or sample losses occur in sample preparation. Multilinear mathematical separation can provide an alternative to analytical separation, it can be expected that multiway analysis based on the multilinear model will have excellent potential in chromatography.
With the rapid development of analytical instrument technology, there are already many types of second-order or even higher-order chromatography instruments [1,5,8,10,11]. Chromatography instruments with a first-order detector (i.e., multichannel detector) can generate a second-order tensor (a matrix) of data per sample, such as high-performance liquid chromatography–diode array detector (HPLC–DAD), high-performance liquid chromatography–fluorescence detector (HPLC–FD), liquid chromatography–mass spectrometry (LC–MS), and gas chromatography–mass spectrometry (GC–MS). In a calibration method, multiple second-order tensors of data of the calibration and prediction samples can be arranged into a three-way data array for three-way analysis. Chromatography instruments with a second-order detector or comprehensive two-dimensional chromatography instruments with a first-order detector can even generate a third-order tensor of data per sample, such as high-performance liquid chromatography–excitation-emission matrix fluorescence detector (HPLC–EEMF), and comprehensive two-dimensional liquid chromatography–diode array detector (LC×LC–DAD). Multiple third-order tensors of data of the calibration and prediction samples can be arranged into a four-way data array for four-way analysis.
The application of multiway analysis based on the multilinear model in chromatography is valuable and very convenient, for the following reasons: (1) multilinear decomposition is easy to interpret due to its uniqueness and can give out the chemically meaningful profiles (such as the normalized chromatogram and spectrum) for the analyte; (2) multilinear decomposition can solve the peak coelution problem by mathematically isolating the signal of the analyte from that of interferences; (3) multilinear decomposition can model and separate the drifted baseline, which is a common and difficult problem in chromatographic measurements; (4) multiway analysis can be conveniently and smoothly embedded in the traditional standard curve method in chromatography since there is no difference in their experimental designs and sample preparations. For example, when the coelution problem occurs in a specific range of elution times in a chromatographic separation by HPLC–DAD, one can directly construct the chromatogram–spectrum-sample (including the calibration and prediction samples) trilinear model for this range of elution times, and then one could utilize trilinear decomposition to resolve the coeluted peaks and use least-squares regression to achieve quantitative analysis; (5) when matrix effects are a problem, multiway analysis can be also conveniently and smoothly embedded in the traditional standard additions method; and (6) when instrument response varies from run to run or sample losses occur in sample preparation, multiway analysis can be also conveniently and smoothly embedded in the traditional internal standard method.
Therefore, by combining chromatographic separation with mathematical separation, chromatography assisted by multiway analysis can reduce the requirements for complete chromatographic separation, save the elution time, and decrease the consumption of the mobile phase, particularly when the peak coelution problem of a complex mixture is difficult to solve. In recent decades, there are already more and more analytical applications of chromatography assisted by multiway analysis to a broad range of fields such as food analysis, pharmaceutical analysis, environmental analysis, and biochemical analysis [79,80,81].
This review focuses on the analytical application of multiway analysis based on the multilinear model in chromatography. Firstly, the models, algorithms, and software will be introduced briefly. Secondly, analytical applications of multilinear mathematical separation in chromatography will be reviewed according to the type of instruments. Thirdly, the advantages and disadvantages of applying multiway analysis in chromatography will be summarized, and a future outlook will be provided.
2. Multilinear Models and Algorithms
2.1. Trilinear Model
In three-way quantitative analysis (also called second-order calibration), the trilinear model (i.e., the PARAFAC model) [14,15,21,22,23] is most commonly used [82,83,84,85,86,87,88,89,90,91,92,93,94,95,96,97,98,99,100,101,102,103]. A three-way data array XI×J×K can be considered as a trilinear model if every element xijk can be expressed in terms of scalars,
where N denotes the number of components. ain, bjn, and ckn are the ith, jth, and kth elements in the nth column vectors an, bn, and cn of the three profile matrices AI×N, BJ×N, and CK×N, respectively. eijk is the element of the three-way residual array EI×J×K.
At the matrix level, the trilinear model can be expressed in unfolded matrix form,
where represents the Khatri–Rao product.
In addition, the trilinear model can be expressed in slice form,
where a(i), b(j), and c(k) indicate the ith, jth, and kth rows of AI×N, BJ×N, and CK×N, respectively. Xi.., X.j., and X..k represent the ith horizontal slice, jth lateral slice, and the kth frontal slice of XI×J×K, respectively.
One of these three expressions may be superior, depending on the circumstances. Nevertheless, the structure of the trilinear model is difficult to understand. In Figure 1, the unfolded matrixes and slices of the trilinear model are illustrated.
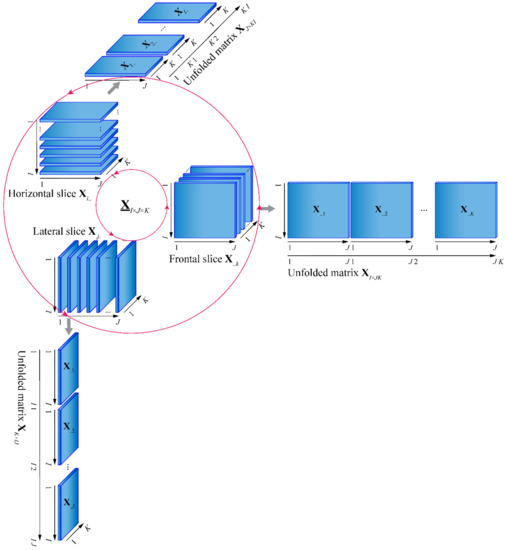
Figure 1.
Illustration of the unfolded matrixes and slices of the trilinear model.
Irrespective of permutation and scaling, the trilinear decomposition of the trilinear model is unique, provided that , where kA, kB, and kC are the k-ranks of AI×N, BJ×N, and CK×N, respectively [104,105]. The uniqueness of the trilinear decomposition is the basis of the second-order advantage. In Figure 2, the trilinear decomposition of the trilinear model is illustrated in profile matrix and outer product forms, respectively. The profile matrix form can exactly illustrate the trilinear decomposition, while the outer product form can more clearly and visually describe the function of the mathematical separation of the trilinear decomposition.
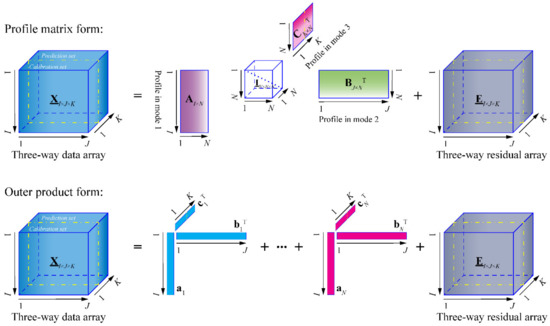
Figure 2.
Illustration of the trilinear decomposition in profile matrix and outer product forms.
2.2. Trilinear Decomposition Algorithms
There are already many algorithms for accomplishing the trilinear decomposition of a trilinear model. The commonly used algorithms could be divided into four types. The first type is based on the eigenvalue–eigenvector decomposition, which mainly includes the generalized rank annihilation method (GRAM) [106] and direct trilinear decomposition (DTLD) [107]. The second type is based on the alternating least squares, which mainly includes the parallel factor analysis (PARAFAC) [14,15] and alternating trilinear decomposition (ATLD) [108] and its variants. The third type is based on the direct least squares, which mainly includes the bilinear least squares-residual bilinearization (BLLS/RBL) [109] and unfold partial least squares-residual bilinearization (U–PLS/RBL) [110]. The fourth type comprises a variety of other novel algorithms.
Every algorithm has analytical situations that are superior to others. However, the algorithms of the second type are used more commonly. The alternating least-squares procedure estimates a profile matrix by assuming the others as known and alternately estimates the others, then repeats the process until the preset termination criterion is satisfied. Here, the PARAFAC and ATLD algorithms are briefly introduced.
The PARAFAC algorithm is based on the unfolded matrix form, its objective functions and least-squares solutions for the three profile matrixes can be expressed as
where M+ is the Moore–Penrose generalized inverse of a matrix M.
The ATLD algorithm is based on the slice form, its objective functions and least-squares solutions for the three profile matrixes can be expressed as
Before the trilinear decomposition process, a proper preprocessing of preserving the trilinearity needs to be used if there are some non-trilinear factors in the data array. For example, the chromatographic three-way data array will need a preprocessing of peak alignment when the time shift problem between runs occurs [11,111,112,113,114,115,116].
In the trilinear decomposition process, there are some solution constraints (such as nonnegativity and unimodality) that could be used to improve the result. In the chromatographic three-way data array, however, the nonnegativity constraint should be used carefully since that part of a chromatogram may be negative due to baseline drift or subtraction of the method blank, and the unimodality constraint should also be used carefully since a peak in a chromatogram may have a small shoulder peak.
By appropriately utilizing an efficient algorithm with a proper number of components, the trilinear decomposition process will give the normalized profile matrixes AI×N and BJ×N (qualitative information), in addition to the unnormalized profile matrix CK×N (quantitative information), in which the nth column vectors correspond to the nth component. This is the three-way mathematical separation that extracts the pure signal of an analyte from the mixed signal of a mixture.
2.3. Three-Way Analysis
From the point of view of mathematical separation, multiway analysis based on the multilinear model consists of multilinear decomposition and regression. Based on the above mathematical separation of three-way analysis, qualitative information of an analyte can be obtained by using a regression step, usually a simple univariate linear regression.
It is worth mentioning that whether it is based on a trilinear model or another multilinear model, the regression step is the same. As mentioned in the introduction, different multiway quantitative analytical methods can be developed for different analytical situations, as shown in Figure 3.
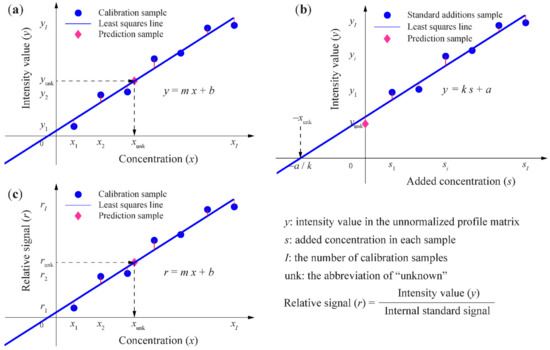
Figure 3.
Illustration of the regression steps in (a) the multiway calibration method, (b) multiway standard additions method, and (c) multiway internal standard method.
2.3.1. Three-Way Calibration Method
Generally, a three-way calibration method is used. In its regression step, as Figure 3a shows, the least-squares line for an analyte is computed by regressing its intensity value in the unnormalized profile matrix versus concentration, based on the calibration samples. Then, the concentration of the analyte in each prediction sample can be predicted by substituting its intensity value in the unnormalized profile matrix into the equation of the least-squares line.
2.3.2. Three-Way Standard Additions Method
When it is difficult to duplicate the sample matrix to eliminate matrix effects, a three-way standard additions method (multiple solutions with constant volume) can be established. In its regression step, as Figure 3b shows, the least-squares line for an analyte is computed by regressing its intensity value in the unnormalized profile matrix versus concentration, based on the standard additions’ samples and prediction sample. Then, the concentration of the analyte in the prediction sample can be predicted as xunk = a/k.
2.3.3. Three-Way Internal Standard Method
When instrument response varies from run to run or sample losses occur in sample preparation, a three-way internal standard method (multiple solutions) can be developed. In its regression step, as Figure 3c shows, the least-squares line for an analyte is computed by regressing its relative signal (analyte intensity value in the unnormalized profile matrix/internal standard signal) versus concentration, based on the calibration samples. Then, the concentration of the analyte in each prediction sample can be predicted by substituting its relative signal into the equation of the least-squares line.
2.4. Quadrilinear Model
In four-way quantitative analysis (also called third-order calibration), the quadrilinear model [8,10,12,23,24] is most commonly used. The quadrilinear model can be considered as an extension of the trilinear model. A four-way data array XI×J×K×L can be considered as a quadrilinear model if every element xijkl can be expressed in terms of scalars,
where N denotes the number of components. ain, bjn, ckn, and dln are the ith, jth, kth, and lth elements in the nth column vectors an, bn, cn, and dn of the four profile matrices AI×N, BJ×N, CK×N, and DL×N, respectively. eijkl is the element of the four-way residual array EI×J×K×L.
Analogously, the quadrilinear model can be expressed in the unfolded matrix, partially unfolded matrix, and slice forms.
In unfolded matrix form, the quadrilinear model can be expressed as
In partially unfolded matrix form, the quadrilinear model can be expressed as
In slice form, the quadrilinear model can be expressed as
2.5. Quadrilinear Decomposition Algorithms
There are also some algorithms for accomplishing the quadrilinear decomposition of a quadrilinear model. The commonly used algorithms include the four-way parallel factor analysis (four-way PARAFAC) [12,117], alternating quadrilinear decomposition (AQLD) [118], alternating penalty quadrilinear decomposition (APQLD) [119], alternating weighted residue constraint quadrilinear decomposition (AWRCQLD) [120], constrained alternating quadrilinear decomposition (CAQLD) [121], etc. The data preprocessing and solution constraints of quadrilinear decomposition are similar to those of trilinear decomposition.
By appropriately utilizing an efficient algorithm with a proper number of components, the quadrilinear decomposition process will give the normalized profile matrixes AI×N, BJ×N, and CK×N (qualitative information), in addition to the unnormalized profile matrix DL×N (quantitative information), in which the nth column vectors correspond to the nth component. This is the four-way mathematical separation that extracts the pure signal of an analyte from the mixed signal of a mixture.
2.6. Four-Way Analysis
Based on the above mathematical separation of four-way analysis, qualitative information of an analyte can be obtained by using a regression step. Similarly, the four-way calibration method, four-way standard additions method, and four-way internal standard method can be established for corresponding analytical situations. Expanding from three-way case to four-way case, these four-way quantitative analysis methods possess the second-order advantage and have higher sensitivity and more resolving power.
Theoretically, further expansion of a three-way case to a higher-way case may bring more advantages. However, the experimental workload will increase sharply and the model will become more complex. Therefore, there are currently very few applications of multiway analysis, which is higher than four-way. In the following section, we only introduce a general expansion of the trilinear model.
2.7. Multilinear Model
A general multiway data array can be considered as a multilinear model [23,122] if every element can be expressed in terms of scalars,
where N denotes the number of components. , , …, and are the , , …, and elements in the nth column vectors of the profile matrixes , , …, and , respectively. is the element of the residual array .
2.8. Analytical Figures of Merit
Essential figures of merit, including the sensitivity (SEN), the limit of detection (LOD), and the limit of quantitation (LOQ) [10,11,34], were often utilized to characterize multiway analysis methods based on the multilinear model.
In a multiway analysis, the SEN of the nth analyte can be computed as follows [34,69]:
where Zc associates to the P calibrated analytes and Zu associates to the Q unexpected interferents. These expressions for computing the SEN can be extended to higher-way cases in a similar way.
After the SEN was computed, the LOD and LOQ can be computed as follows [34,123]:
where is the standard error in the predicted concentration of the blank sample, is the leverage of the blank sample, is the variance in the calibration concentration, and is the variance in the instrumental signal.
2.9. Software
Almost all of the algorithms described above are freely available. For example, some algorithm programs based on MATLAB were published in the supporting information of its reference or some books [9,122], and sometimes there are demonstration programs for analyzing its related data [10]. A software named the N-way Toolbox for MATLAB for multiway analysis was developed by Andersson and Bro [117] and is freely available at http://www.models.life.ku.dk/nwaytoolbox (accessed on 13 March 2021). A MATLAB graphical interface toolbox named MVC2 for three-way analysis was developed by Olivieri, Wu, and Yu [124] and is freely available at http://www.iquir-conicet.gov.ar/descargas/mvc2.rar (accessed on 13 March 2021). A similar MATLAB graphical interface toolbox named MVC3 for four-way analysis was developed by the same authors [125] and is freely available on the internet at http://www.iquir-conicet.gov.ar/descargas/mvc3.rar (accessed on 13 March 2021).
In addition, many MATLAB programs are available at many websites, which are too numerous to mention here.
3. Chromatography with Mathematical Separations
It is important to note that there also are other popular and powerful chemometric methods and strategies for analyzing chromatography data, such as the N-way partial least squares (NPLS), bilinear least squares/residual bilinearization (BLLS/RBL), parallel factor analysis 2 (PARAFAC2), and multivariate curve resolution–alternating least squares (MCR–ALS). Each type of these chemometric methods and strategies deserves an individual review to overview its applications in chromatography.
Therefore, in the following sections of this review, we will only introduce analytical applications of multiway analysis based on the multilinear model in chromatography, according to the type of chromatography instrumentation and its detector.
3.1. HPLC–DAD
HPLC–DAD can be widely used for analytical separation and quantitative determination of many inorganic, organic, and biological species that have ultraviolet–visible absorption signal, in complex mixtures such as pharmaceutical, environmental, food, biochemical, and biological samples.
For a single sample, HPLC–DAD can generate a liquid chromatogram–absorption spectrum (obtained by the diode array detector) (LC–DAD) second-order data array MI×J. By arranging multiple second-order data matrices of the calibration and prediction samples, one can obtain a liquid chromatogram–absorption spectrum-sample (LC–DAD-S) three-way data array XI×J×K. Then, one can apply a three-way analysis to it to obtain the pure normalized liquid chromatogram, normalized absorption spectrum, and unnormalized intensity profile of each coeluted component. This mathematical separation function can enhance the selectivity of HPLC–DAD and therefore make a complicated analytical separation task easier.
Analytical applications of HPLC–DAD assisted by three-way analysis based on the trilinear model are listed in Table 1. Wu et al. [108] constructed the LC–DAD-S trilinear model by using HPLC–DAD, then achieved quantitative analysis of p-chlorotoluene and o-chlorotoluene in the presence of uncalibrated interference o-dichlorobenzene, by using three-way calibration methods based on ATLD and PARAFAC algorithms, respectively. Yu et al. [126] proposed an HPLC–DAD three-way calibration method based on the ATLD algorithm for the determination of 12 quinolones in honey samples with spike within a short time in isocratic mode. Liu et al. [127] proposed an HPLC–DAD three-way calibration method for rapid determination of costunolide and dehydrocostuslactone in human plasma and Chinese patent medicine (Xiang Sha Yang Wei capsule) real samples. Zhao et al. [128] achieved chemometric resolution and quantification of coeluting peaks of 11 antihypertensives from multiple classes in human serum, health product, and Chinese patent medicine samples with spike. Zhang et al. [129] developed a fast HPLC–DAD three-way analytical method for determining nine polyphenols in honey samples. Yu et al. [130] achieved quantification of 11 antibiotics in tap water samples with spike by using three-way calibration based on the PARAFAC algorithm, after a chromatographic background drift correction. Xiang et al. [131] proposed an HPLC–DAD three-way calibration based on the ATLD algorithm for fast quantitative analysis of four tyrosine kinase inhibitors in human plasma samples with spike. Yin et al. [132] achieved quantification of six synthetic colorants in beverage samples by using three-way calibration based on the ATLD algorithm. Liu et al. [133] achieved rapid and simultaneous determination of five vinca alkaloids in Catharanthus roseus real samples and human serum spiked samples by using three-way calibration based on ATLD algorithm. Liu et al. [134] achieved direct and interference-free determination of 13 phenolic compounds in red wine samples with spike by using three-way calibration based on the ATLD algorithm. Ghafghazi et al. [135] evaluated and compared the performances of several three-way calibration methods based on PARAFAC, ATLD, SWATLD, and APTLD algorithms by interference-free determination of carbamazepine in human serum samples with spike. Wang et al. [136] proposed an HPLC–DAD three-way analytical method based on the ATLD algorithm for fast and simultaneous determination of 12 polyphenols in apple peel and pulp real samples. Liu et al. [137] proposed a rapid and interference-free HPLC–DAD three-way analytical method for simultaneous determination of 17 polyphenols in raw propolis real samples. Yin et al. [138] achieved fast and green quantification of eight preservatives in facial mask samples by using three-way calibration based on the ATLD algorithm. Mortera et al. [139] applied HPLC–DAD three-way calibration based on PARAFAC algorithm to identification and quantitative evaluation of 11 short chain organic acids in yoghurt, culture milk, cheese, and wine real samples. Teglia et al. [140] achieved quantification of 15 veterinary active ingredients in real samples of poultry litter from five farms by using HPLC–DAD three-way calibration based on PARAFAC algorithm. Zhang et al. [141] developed a HPLC–DAD three-way analytical method for rapid identification and quantitative analysis of 15 polyphenols in real samples of pu-erh tea, green tea, black tea, and clinacanthus nutans tea.

Table 1.
Analytical applications of high-performance liquid chromatography–diode array detector (HPLC–DAD) assisted by three-way analysis based on the trilinear model.
3.2. HPLC–FD and HPLC–EEMF
HPLC–FD and HPLC–EEMF can be used for analytical separation and sensitive determination of organic compounds, which have autofluorescence or derivative fluorescence in mixtures such as food, environmental, and biological samples.
For a single sample, HPLC–FD can generate a liquid chromatogram-emission spectrum (LC–EM) second-order data array MI×J. By arranging multiple second-order data arrays of the calibration and prediction samples, one can obtain a liquid chromatogram–emission spectrum-sample (LC–EM-S) three-way data array XI×J×K. Then, one can apply a three-way analysis to it to obtain the pure normalized liquid chromatogram, normalized fluorescence emission spectrum, and unnormalized intensity profile of each coeluted component. This mathematical separation function can enhance the selectivity of HPLC–FD.
For a single sample, HPLC–EEMF can generate a liquid chromatogram–excitation spectrum-emission spectrum (LC–EX–EM) third-order data array MI×J×K. Multiple third-order data arrays of the calibration and prediction samples can be arranged into a liquid chromatogram–excitation spectrum–emission spectrum-sample (LC–EX–EM-S) four-way data array XI×J×K×L. One can apply three-way analysis by reshaping this LC–EX–EM-S four-way data array XI×J×K×L into an LC and S-EX–EM three-way data array XI*L×J×K. Actually, one can also directly apply four-way analysis on this four-way data array to obtain the pure normalized liquid chromatogram, normalized fluorescence excitation spectrum, normalized fluorescence emission spectrum, and unnormalized intensity profile of each coeluted component. These mathematical separation manners also can enhance the selectivity of HPLC–EEMF.
Analytical applications of HPLC–FD and HPLC–EEMF assisted by three-way analysis based on the trilinear model are listed in Table 2. Tan et al. [142] developed a novel analytical method by using HPLC–FD and three-way calibration with APTLD algorithm, for simultaneously determining the contents of 20 free amino acids in real samples of green tea, oolong tea, black tea, and pu-erh tea. The authors validated their method by analysis of spiked samples. Wang et al. [143] proposed a novel strategy that combines HPLC–FD with three-way calibration based on the ATLD algorithm for simultaneous determination of seven phenolic antioxidants in six kinds of oil samples with spike. Teglia et al. [140] achieved quantitative analysis of difloxacin, enrofloxacin, flumenique, and albendazole in real samples of poultry litter from five farms by using HPLC–FD coupled with three-way calibration based on PARAFAC algorithm. Alcaráz et al. [144] achieved quantitation of three fluoroquinolones (ofloxacin, ciprofloxacin, and danofloxacin) in tap water, mineral water, and well water samples with spike by a new modeling strategy of HPLC–EEMF data. The authors obtained a third-order LC–EX–EM data per sample, then constructed an LC&S–EX–EM trilinear model to use three-way calibration based on the PARAFAC algorithm. Actually, they can also directly use four-way calibration based on a four-way PARAFAC algorithm to analyze their third-order LC–EX–EM data arrays by constructing an LC–EX–EM-S quadrilinear model. Bortolato et al. [145] achieved quantitation of chlorophyll a, chlorophyll b, pheophytin a, and pheophytin b in olive oil samples with and without spike by an augmented modeling strategy of HPLC–EEMF data. The authors also obtained a third-order LC–EX–EM data per sample and then constructed an LC&S–EX–EM trilinear model to use three-way calibration based on the PARAFAC algorithm.
Table 2.
Analytical applications of high-performance liquid chromatography–fluorescence detector (HPLC–FD) and high-performance liquid chromatography–excitation-emission matrix fluorescence detector (HPLC–EEMF) assisted by three-way analysis based on the trilinear model.
Analytical applications of HPLC–EEMF assisted by four-way analysis based on the quadrilinear model are listed in Table 3. Bortolato et al. [146] also achieved quantitation of chlorophyll a, chlorophyll b, pheophytin a, and pheophytin b in olive oil samples with and without spike by using HPLC–EEMF coupled with four-way calibration based on a four-way PARAFAC algorithm. Montemurro et al. [147] proposed an HPLC–EEMF method for highly sensitive quantitation of six pesticides (carbendazim, fuberidazole, thiabendazole, carbofuran, carbaryl, and naphthol) in real samples of fruit juice from apple, pear, and plum. The authors constructed the LC–EX–EM-S quadrilinear model and then used four-way calibration based on a four-way PARAFAC algorithm to achieve quantitative analysis. Carabajal et al. [148] achieved on-line generation of third-order LC–EX–EM data, and they used these data to construct the LC–EX–EM-S quadrilinear model, on which a four-way calibration method with a four-way PARAFAC algorithm was proposed for the determination of eight polycyclic aromatic hydrocarbons (fluoranthene, pyrene, benz[a]anthracene, chrysene, benzo[b]fluoranthene, benzo[k]fluoranthene, benzo[a]pyrene, and dibenz[a,h]anthracene) in underground water and stream water samples with spike.
Table 3.
Analytical applications of HPLC–EEMF assisted by four-way analysis based on the quadrilinear model.
3.3. LC–MS
LC–MS is almost the most common and powerful analytical instrument for both qualitative and quantitative analysis of compounds (especially hard-to-volatile compounds) in complex mixtures such as pharmaceutical, food, and biological samples [5,149], due to the high selectivities of liquid chromatography and mass spectrometry.
For a single sample, LC–MS can generate a liquid chromatogram–mass spectrum (LC–MS) second-order data array MI×J. By arranging multiple second-order data arrays of the calibration and prediction samples, one can obtain a liquid chromatogram-mass spectrum-sample (LC–MS-S) three-way data array XI×J×K. Then, one can apply a three-way analysis to it to obtain the pure normalized liquid chromatogram, normalized mass spectrum, and unnormalized intensity profile of each analyte. This mathematical separation function can enhance the selectivity of LC–MS.
Analytical applications of LC–MS assisted by three-way analysis based on the trilinear model are listed in Table 4. Gu et al. [150] developed a smart strategy that combines LC–MS with a three-way calibration method based on the ATLD algorithm (see Figure 4) for simultaneous determination of 10 β-blockers (atenolol, sotalol, carteolol, metoprolol, celiprolol, esmolol, bisoprolol, labetalol, propranolol, and betaxolol) in human urine and plasma samples with spike (see Figure 5). The authors validated their method by LC–MS in multiple reaction monitoring (MRM) mode, and t-test demonstrated that there are no significant differences between the prediction results of the two methods. Gu et al. [151] also proposed an LC–MS three-way calibration method based on the ATLD algorithm for simultaneous determination of six sulfonylurea oral antidiabetic agents (glipizide, tolbutamide, gliclazide, glibenclamide, glimepiride, and gliquidone) in health tea and human plasma samples with spike. Liu et al. [152] proposed an LC–MS three-way calibration method based on the ATLD algorithm for the interference-free determination of multi-class mycotoxins in complex cereal samples with spike. Hu et al. [153] developed an LC–MS three-way calibration method based on ATLD or APTLD algorithms for rapid and interference-free quantitative analysis of nine B-group vitamins in real samples of different energy drinks samples. Sun et al. [154] achieved simultaneous determination of multi-class estrogens (estriol, 17-α-estradiol, 17-beta-estradiol, estrone, ethinylestradiol, diethylstilbestrol, and bisphenol A) in infant milk powder samples with spike by using the LC–MS three-way calibration method with ATLD algorithm on LC–MS-S trilinear model. Long et al. [155] developed an LC–MS three-way calibration method based on ATLD algorithm for interference-free determination of 15 glucocorticoids in face mask samples with spike. Yan et al. [156] proposed a three-way calibration with the constrained alternating trilinear decomposition (CATLD) algorithm on LC–MS-S trilinear model for quantitative analysis of coeluting aromatic amino acids in real samples of human plasma. The authors validated their method by an LC–MS one-way calibration and discussed how an additional selectivity mode is introduced by three-way calibration of LC–MS second-order data (Figure 6).
Table 4.
Analytical applications of liquid chromatography–mass spectrometry (LC–MS) assisted by three-way analysis based on the trilinear model.
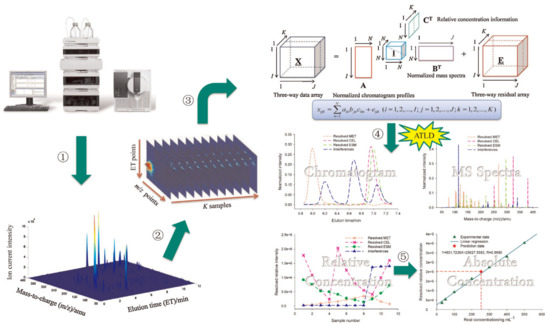
Figure 4.
General procedures of LC–MS assisted with second-order calibration method based on alternating trilinear decomposition (ATLD) algorithm. ① Generate a two-way matrix of responses of one sample by LC–MS in full scan mode; ② stack the two-way data array corresponding to K samples into three-way data array; ③ build the trilinear model for second-order calibration; ④ decompose the three-way data array into underlying contributions of individual interest with ATLD algorithm; ⑤ univariate linear regression using the calibration equation with the ATLD resolved relative concentration to obtain the absolute concentration of a target analyte in an unknown sample. Reproduced with permission from Gu et al. [150], Analytica Chimica Acta; published by Elsevier, 2014.
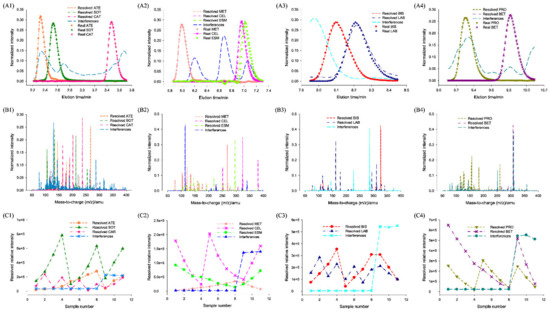
Figure 5.
(A1–A4) ATLD resolved normalized chromatograms, (B1–B4) normalized mass spectra, and (C1–C4) relative concentration profiles and (A1–A4) their corresponding real normalized chromatograms for 10 b-blockers in human urine samples. Reproduced with permission from Gu et al. [150], Analytica Chimica Acta; published by Elsevier, 2014.
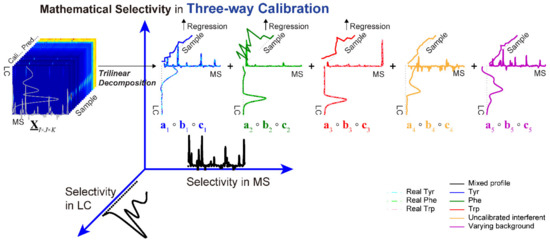
Figure 6.
Illustration of how an additional selectivity mode is introduced by three-way calibration of LC–MS second-order data matrices. Reproduced with permission from Yan et al. [156], Journal of Separation Science; published by Wiley, 2020.
3.4. GC–MS
GC–MS is a commonly used analytical instrument for both qualitative and quantitative analysis of volatile compounds in complex mixtures such as petrochemical and environmental samples.
For a single sample, GC–MS can generate a gas chromatogram–mass spectrum (GC–MS) second-order data array MI×J. By arranging multiple second-order data arrays of the calibration and prediction samples, one can obtain a gas chromatogram-mass spectrum-sample (GC–MS-S) three-way data array XI×J×K. Then, one can apply a three-way analysis to it to obtain the pure normalized gas chromatogram, normalized mass spectrum, and unnormalized intensity profile of each analyte. This mathematical separation function can enhance the selectivity of GC–MS.
Analytical applications of GC–MS assisted by three-way analysis based on the trilinear model are listed in Table 5. Khayamian et al. [157] quantified bifenthrin and tetramethrin in a mixture of analytes by using GC–MS three-way analysis with PARAFAC algorithm. Yang et al. [158] developed a GC–MS three-way calibration based on the PARAFAC algorithm for determining 12C and 13C labeled 11 metabolites in Methylobacterium extorquens AM1 samples. Oca et al. [159] achieved the determination of two bisphenols (bisphenol A, bisphenol B) and their diglycidyl ethers in polycarbonate tableware samples with spike by using GC–MS assisted by three-way calibration with PARAFAC algorithm.
Table 5.
Analytical applications of gas chromatography–mass spectrometry (GC–MS) assisted by three-way analysis based on the trilinear model.
3.5. LC×LC–UV, LC×LC–DAD, and LC×LC–MS
The peak capacity of LC×LC is much better than that of LC, therefore the separation capabilities of LC×LC–DAD and LC×LC–MS are better than that of LC–DAD and LC–MS, respectively.
For a single sample, LC×LC–DAD can generate a liquid chromatogram–liquid chromatogram–absorption spectrum (LC–LC–DAD) third-order data array MI×J×K. By arranging multiple third-order data arrays of the calibration and prediction samples, one can obtain a liquid chromatogram–liquid chromatogram–absorption spectrum-sample (LC-LC–DAD-S) four-way data array XI×J×K×L. Then one can apply four-way analysis to it to obtain the pure normalized first liquid chromatogram, normalized second liquid chromatogram, normalized absorption spectrum, and unnormalized intensity profile of each analyte.
For a single sample, LC×LC–MS can generate a liquid chromatogram–liquid chromatogram–mass spectrum (LC–LC–MS) third-order data array MI×J×K. By arranging multiple third-order data arrays of the calibration and prediction samples, one can obtain a liquid chromatogram–liquid chromatogram-mass spectrum-sample (LC-LC–MS-S) four-way data array XI×J×K×L. Then, one can apply a four-way analysis to it to obtain the pure normalized first liquid chromatogram, normalized second liquid chromatogram, normalized mass spectrum, and unnormalized intensity profile of each analyte.
Analytical applications of LC×LC–UV, LC×LC–DAD, and LC×LC–MS assisted by multiway analysis based on the multilinear model are listed in Table 6. Based on LC×LC–UV, Fraga et al. [160] analyzed three analytes in a simulated mixture of analytes by using three-way calibration with the PARAFAC algorithm. Based on LC×LC–DAD, Zhang et al. [161] used the ATLD algorithm on the LC–LC–DAD trilinear model of a single sample to achieve removal of background drift in its comprehensive two-dimensional chromatography data. Based on LC×LC–DAD, Porter et al. [162] used a four-way analysis with a four-way PARAFAC algorithm to analyze maize seedling digests, focusing on compounds related to the biosynthetic pathways of the primary growth regulator (indole-3-acetic acid) in plants. Based on LC×LC–MS, Navarro-Reig et al. [163] used the PARAFAC algorithm on the LC–LC–MS&S trilinear model to resolve triacylglycerol structural isomers in a corn oil sample.
Table 6.
Analytical applications of comprehensive two-dimensional liquid chromatography–ultraviolet detector (LC×LC–UV), comprehensive two-dimensional liquid chromatography–diode array detector (LC×LC–DAD), and comprehensive two-dimensional liquid chromatography–mass spectrometry (LC×LC–MS) assisted by multiway analysis based on the multilinear model.
3.6. GC×GC–FID and GC×GC–MS
The peak capacity of GC×GC is much better than that of GC, therefore the separation capabilities of GC×GC–FID and GC×GC–MS are better than that of GC–FID and GC–MS, respectively.
For a single sample, GC×GC–FID can generate a gas chromatogram–gas chromatogram (GC–GC) second-order data array MI×J. By arranging multiple second-order data arrays of the calibration and prediction samples, one can obtain a gas chromatogram–gas chromatogram-sample (GC–GC-S) three-way data array XI×J×K. Then, one can apply a three-way analysis to it to obtain the pure normalized first gas chromatogram, normalized second gas chromatogram, and unnormalized intensity profile of each analyte.
For a single sample, GC×GC–MS can generate a gas chromatogram–gas chromatogram–mass spectrum (GC–GC–MS) third-order data array MI×J×K. By arranging multiple third-order data arrays of the calibration and prediction samples, one can obtain a gas chromatogram–gas chromatogram–mass spectrum-sample (GC-GC–MS-S) four-way data array XI×J×K×L. Then, one can apply a four-way analysis to it to obtain the pure normalized first gas chromatogram, normalized second gas chromatogram, normalized mass spectrum, and unnormalized intensity profile of each analyte.
Analytical applications of GC×GC–FID and GC×GC–MS, assisted by multiway analysis based on the multilinear model, are listed in Table 7. Based on GC×GC–FID, van Mispelaar et al. [164] applied three-way calibration with PARAFAC algorithm on the GC–GC–S trilinear model to quantitatively determine six essential-oil markers (γ-terpinene, citronellyl formate, dimethyl anthranliate, lavendulyl acetate, eucalypthol, and menthone) in perfume real samples. The authors found that, in terms of speed and possibilities for automation, the proposed three-way calibration method, in general, is far superior to traditional integration. Based on the GC×GC–MS, Hoggard et al. [165] proposed the third-order analysis with PARAFAC algorithm on the GC–GC–MS trilinear model of a single sample for automated resolution of nontarget analyte signals. Based on GC–GC–MS trilinear model of a single sample, Skov et al. [166] proposed the third-order analysis with PARAFAC algorithm for quantification of bromobenzene and dimethyl phosphite in a kerosene sample. Based on the GC–GC–MS trilinear model of a single sample, Hoggard et al. [167] proposed the third-order analysis with PARAFAC algorithm for automated peak resolution of 32 compounds in diesel and urine samples. Based on the GC–GC–MS trilinear model per sample, Hoggard et al. [168] developed a third-order analysis method with a PARAFAC algorithm to reveal and exploit the chemical impurity profiles from commercial dimethyl methylphosphonate samples to illustrate the type of forensic information that may be obtained from chemical-attack evidence. Snyder et al. [169] developed a third-order analysis method with PARAFAC algorithm on the GC–GC–MS trilinear model per sample, for analysis of l-β-methylamino-alanine in human tissue samples.
Table 7.
Analytical applications of comprehensive two-dimensional gas chromatography–flame ionization detection (GC×GC-FID) and comprehensive two-dimensional gas chromatography–mass spectrometry (GC×GC–MS) assisted by multiway analysis based on the multilinear model.
4. Conclusions
Multiway analysis based on the multilinear model can introduce additional mathematical selectivity to enhance the selectivity of chromatography. When a complete chromatographic separation of a complex mixture is difficult to achieve in proper time, multiway analysis can be utilized to solve the peak coelution problem. By combining chromatographic separation with mathematical separation, chromatography assisted by multiway analysis can reduce the requirements for complete chromatographic separation of components in a complex real sample, save the elution time, decrease the consumption of the mobile phase, and deal with the drifted baseline. It could be expected to provide a simple and efficient separation tool for fast quantitative analysis in complex mixtures containing unknown interferents, especially for the situation where the general elution problem occurs. In addition to these advantages, chromatography assisted by multiway analysis has good compatibility with traditional quantitative analysis methods (the standard curve method, standard additions method, and internal standard method) in experimental design and sample preparation. There are already many analytical applications of multiway analysis based on the multilinear model in chromatography, and we can expect that there will be more and more applications.
5. Future Outlook
Although multiway analysis has already many successful analytical applications in the field of chromatography, there are still issues that need to be further studied. First, these applications are mainly carried out by chemometricians, not chromatographers. On the one hand, multiway analysis is an emerging and interdisciplinary research area that needs a long time to be accepted by the community of chromatographers; on the other hand, multiway analysis requires an appropriate computing platform, a certain degree of programming skills, and a sound understanding of optimizing algorithm parameters. Second, current applied research focuses mostly on chromatography assisted by multiway calibration method, there is little reported research on chromatography coupled with multiway standard additions method or multiway internal standard method.
In the future, as the accessibility and automation of related software increase, and with the cooperation between the societies of chemometrics and chromatography, there will be more applications of multilinear mathematical separation in chromatography. The combination of them will efficiently and intelligently solve increasing number of practical chromatography separation problems in the fields of pharmaceutical, environmental, biochemical, biological, and food analysis.
Author Contributions
Conceptualization, Y.C., J.B., and C.K.; investigation, Y.C.; resources, C.M.Z.; data curation, J.B.; writing—original draft preparation, Y.C.; writing—review and editing, Y.C., C.M.Z., J.B., M.Y., and C.K.; visualization, M.Y.; supervision, C.K.; project administration, C.K.; funding acquisition, Y.C., J.B., and C.K. All authors have read and agreed to the published version of the manuscript.
Funding
This research was funded by the Yunnan Academy of Tobacco Agricultural Sciences (grant numbers 2019530000241019, 2020530000241025, and 2020530000241004); the Science and Technology Program of Guizhou Province (grant numbers [2017]7293, [2017]5788, [2019]1070, and 20204Y133); the Natural Science Project of Department of Education of Guizhou Province (grant number [2017]116); and the Scientific Research Foundation for Introduced Talent of Guizhou University [grant numbers 201564 and 201769].
Conflicts of Interest
The authors declare no conflict of interest.
References
- Harris, D.C. Quantitative Chemical Analysis, 8th ed.; W. H. Freeman and Company: New York, NY, USA, 2010. [Google Scholar]
- Christian, G.D.; Dasgupta, P.K.; Schug, K.A. Analytical Chemistry, 7th ed.; John Wiley & Sons: Hoboken, NJ, USA, 2014. [Google Scholar]
- Skoog, D.A.; West, D.M.; Holler, F.J.; Crouch, S.R. Fundamentals of Analytical Chemistry, 9th ed.; Cengage Learning: Belmont, MA, USA, 2014. [Google Scholar]
- Barreca, S.; Orecchio, S.; Pace, A. Photochemical sample treatment for extracts clean up in PCB analysis from sediments. Talanta 2013, 103, 349–354. [Google Scholar] [CrossRef]
- Skoog, D.A.; Holler, F.J.; Crouch, S.R. Principles of Instrumental Analysis, 7th ed.; Cengage Learning: Boston, MA, USA, 2018. [Google Scholar]
- Barreca, S.; Busetto, M.; Vitelli, M.; Colzani, L.; Clerici, L.; Dellavedova, P. Online solid-phase extraction LC-MS/MS: A rapid and valid method for the determination of perfluorinated compounds at sub ng L−1 level in natural water. J. Chem. 2018, 2018, 3780825. [Google Scholar] [CrossRef]
- Gu, H.W.; Wu, H.L.; Yin, X.L.; Li, S.S.; Liu, Y.J.; Xia, H.; Xie, L.X.; Yu, R.Q.; Yang, P.Y.; Lu, H.J. Solving signal instability to maintain the second-order advantage in the resolution and determination of multi-analytes in complex systems by modeling liquid chromatography-mass spectrometry data using alternating trilinear decomposition method assisted with piecewise direct standardization. J. Chromatogr. A 2015, 1407, 157–168. [Google Scholar] [CrossRef]
- Brown, S.D.; Tauler, R.; Walczak, B. Comprehensive Chemometrics: Chemical and Biochemical Data Analysis; Elsevier: Amsterdam, The Netherlands, 2009. [Google Scholar]
- Gemperline, P.J. Practical Guide to Chemometrics, 2nd ed.; CRC Press: Boca Raton, MA, USA, 2006. [Google Scholar]
- Muñoz de la Peña, A.; Goicoechea, H.C.; Escandar, G.M.; Olivieri, A.C. Fundamentals and Analytical Applications of Multiway Calibration; Elsevier: Amsterdam, The Netherlands, 2015. [Google Scholar]
- Olivieri, A.C.; Escandar, G.M. Practical Three-Way Calibration; Elsevier: Amsterdam, The Netherlands, 2014. [Google Scholar]
- Smilde, A.; Bro, R.; Geladi, P. Multi-Way Analysis with Applications in the Chemical Sciences; Wiley: Chichester, UK, 2005. [Google Scholar]
- Cattell, R.B. Parallel proportional profiles and other principles for determining the choice of factors by rotation. Psychometrika 1944, 9, 267–283. [Google Scholar] [CrossRef]
- Harshman, R.A. Foundations of the PARAFAC Procedure: Models and Conditions for an “Explanatory” Multimodal Factor Analysis. Ucla Work. Pap. Phon. 1970, 16, 1–84. Available online: https://www.psychology.uwo.ca/faculty/harshman/wpppfac0.pdf (accessed on 24 October 2020).
- Carroll, J.D.; Chang, J.J. Analysis of individual differences in multidimensional scaling via an N-way generalization of “Eckart-Young” decomposition. Psychometrika 1970, 35, 283–319. [Google Scholar] [CrossRef]
- Ho, C.N.; Christian, G.D.; Davidson, E.R. Application of the method of rank annihilation to quantitative analyses of multicomponent fluorescence data from the video fluorometer. Anal. Chem. 1978, 50, 1108–1113. [Google Scholar] [CrossRef]
- Appellof, C.J.; Davidson, E.R. Strategies for analyzing data from video fluorometric monitoring of liquid chromatographic effluents. Anal. Chem. 1981, 53, 2053–2056. [Google Scholar] [CrossRef]
- Kiers, H.A.; Krijnen, W.P. An efficient algorithm for PARAFAC of three-way data with large numbers of observation units. Psychometrika 1991, 56, 147–152. [Google Scholar] [CrossRef]
- Booksh, K.S.; Muroski, A.R.; Myrick, M.L. Single-measurement excitation/emission matrix spectrofluorometer for determination of hydrocarbons in ocean water. 2. Calibration and quantitation of naphthalene and styrene. Anal. Chem. 1996, 68, 3539–3544. [Google Scholar] [CrossRef]
- Muroski, A.R.; Booksh, K.S.; Myrick, M.L. Single-measurement excitation/emission matrix spectrofluorometer for determination of hydrocarbons in ocean water. 1. Instrumentation and background correction. Anal. Chem. 1996, 68, 3534–3538. [Google Scholar] [CrossRef]
- Bro, R. PARAFAC. Tutorial and applications. Chemom. Intell. Lab Syst. 1997, 38, 149–171. [Google Scholar] [CrossRef]
- Booksh, K.S.; Kowalski, B.R. Theory of analytical chemistry. Anal. Chem. 1994, 66, 782–791. [Google Scholar] [CrossRef]
- Kolda, T.G.; Bader, B.W. Tensor decompositions and applications. Siam. Rev. 2009, 51, 455–500. [Google Scholar] [CrossRef]
- Golub, G.H.; Van Loan, C.F. Matrix Computations, 4th ed.; The Johns Hopkins University Press: Baltimore, MD, USA, 2013. [Google Scholar]
- Meyers, R.A.; Albani, J.R. Encyclopedia of Analytical Chemistry; John Wiley & Sons: New York, NY, USA, 2000. [Google Scholar]
- Geladi, P. Analysis of multi-way (multi-mode) data. Chemom. Intell. Lab. Syst. 1989, 7, 11–30. [Google Scholar] [CrossRef]
- Smilde, A.K. Three-way analyses problems and prospects. Chemom. Intell. Lab. Syst. 1992, 15, 143–157. [Google Scholar] [CrossRef]
- Escandar, G.M.; Olivieri, A.C.; Faber, N.K.M.; Goicoechea, H.C.; Muñoz de la Peña, A.; Poppi, R.J. Second- and third-order multivariate calibration: Data, algorithms and applications. Trac Trends Anal. Chem. 2007, 26, 752–765. [Google Scholar] [CrossRef]
- Gómez, V.; Callao, M.P. Analytical applications of second-order calibration methods. Anal. Chim. Acta 2008, 627, 169–183. [Google Scholar] [CrossRef] [PubMed]
- Olivieri, A.C. Analytical advantages of multivariate data processing. One, two, three, infinity? Anal. Chem. 2008, 80, 5713–5720. [Google Scholar] [CrossRef]
- Olivieri, A.C. Recent advances in analytical calibration with multi-way data. Anal. Methods 2012, 4, 1876–1886. [Google Scholar] [CrossRef]
- Murphy, K.R.; Stedmon, C.A.; Graeber, D.; Bro, R. Fluorescence spectroscopy and multi-way techniques. PARAFAC. Anal. Methods 2013, 5, 6557–6566. [Google Scholar] [CrossRef]
- Escandar, G.M.; Goicoechea, H.C.; Muñoz de la Peña, A.; Olivieri, A.C. Second- and higher-order data generation and calibration: A tutorial. Anal. Chim. Acta 2014, 806, 8–26. [Google Scholar] [CrossRef]
- Olivieri, A.C. Analytical figures of merit: From univariate to multiway calibration. Chem. Rev. 2014, 114, 5358–5378. [Google Scholar] [CrossRef]
- Wu, H.L.; Long, W.J.; Wang, T.; Dong, M.Y.; Yu, R.Q. Recent applications of multiway calibration methods in environmental analytical chemistry: A review. Microchem. J. 2020, 159, 105575. [Google Scholar] [CrossRef]
- Wu, H.L.; Nie, J.F.; Yu, Y.J.; Yu, R.Q. Multi-way chemometric methodologies and applications: A central summary of our research work. Anal. Chim. Acta 2009, 650, 131–142. [Google Scholar] [CrossRef] [PubMed]
- Mas, S.; de Juan, A.; Tauler, R.; Olivieri, A.C.; Escandar, G.M. Application of chemometric methods to environmental analysis of organic pollutants: A review. Talanta 2010, 80, 1052–1067. [Google Scholar] [CrossRef]
- Faber, N.M.; Bro, R.; Hopke, P.K. Recent developments in CANDECOMP/PARAFAC algorithms: A critical review. Chemom. Intell. Lab. Syst. 2003, 65, 119–137. [Google Scholar] [CrossRef]
- Nahorniak, M.L.; Cooper, G.A.; Kim, Y.C.; Booksh, K.S. Three- and four-way parallel factor (PARAFAC) analysis of photochemically induced excitation-emission kinetic fluorescence spectra. Analyst 2005, 130, 85–93. [Google Scholar] [CrossRef]
- Tomasi, G.; Bro, R. PARAFAC and missing values. Chemom. Intell. Lab. Syst. 2005, 75, 163–180. [Google Scholar] [CrossRef]
- Jiang, J.H.; Wu, H.L.; Li, Y.; Yu, R.Q. Alternating coupled vectors resolution (ACOVER) method for trilinear analysis of three-way data. J. Chemom. 1999, 13, 557–578. [Google Scholar] [CrossRef]
- Chen, Z.P.; Wu, H.L.; Jiang, J.H.; Li, Y.; Yu, R.Q. A novel trilinear decomposition algorithm for second-order linear calibration. Chemom. Intell. Lab. Syst. 2000, 52, 75–86. [Google Scholar] [CrossRef]
- Bro, R.; Kiers, H.A. A new efficient method for determining the number of components in PARAFAC models. J. Chemom. 2003, 17, 274–286. [Google Scholar] [CrossRef]
- Cramer, J.; Kim, Y.-C.; Vogt, F.; Booksh, K. Accelerating the analyses of 3-way and 4-way PARAFAC models utilizing multi-dimensional wavelet compression. J. Chemom. 2005, 19, 593–606. [Google Scholar] [CrossRef]
- Xia, A.L.; Wu, H.L.; Fang, D.M.; Ding, Y.J.; Hu, L.Q.; Yu, R.Q. Alternating penalty trilinear decomposition algorithm for second-order calibration with application to interference-free analysis of excitation-emission matrix fluorescence data. J. Chemom. 2005, 19, 65–76. [Google Scholar] [CrossRef]
- Lozano, V.A.; Ibañez, G.A.; Olivieri, A.C. Second-order analyte quantitation under identical profiles in one data dimension. A dependency-adapted partial least-squares/residual bilinearization method. Anal. Chem. 2010, 82, 4510–4519. [Google Scholar] [CrossRef]
- De la Peña, A.M.; Mansilla, A.E.; Gómez, D.G.; Olivieri, A.C.; Goicoechea, H.C. Interference-free analysis using three-way fluorescence data and the parallel factor model. Determination of fluoroquinolone antibiotics in human serum. Anal. Chem. 2003, 75, 2640–2646. [Google Scholar] [CrossRef] [PubMed]
- Nahorniak, M.L.; Booksh, K.S. Excitation-emission matrix fluorescence spectroscopy in conjunction with multiway analysis for PAH detection in complex matrices. Analyst 2006, 131, 1308–1315. [Google Scholar] [CrossRef] [PubMed]
- Zhang, Y.; Wu, H.L.; Ding, Y.J.; Xia, A.L.; Cui, H.; Yu, R.Q. Simultaneous determination of cortisol and prednisolone in body fluids by using HPLC–DAD coupled with second-order calibration based on alternating trilinear decomposition. J. Chromatogr. B 2006, 840, 116–123. [Google Scholar] [CrossRef]
- Zhang, Y.; Wu, H.L.; Xia, A.L.; Zhu, S.H.; Han, Q.J.; Yu, R.Q. Fluorescence determination of metoprolol in human plasma by trilinear decomposition-based calibration techniques. Anal. Bioanal. Chem. 2006, 386, 1741–1748. [Google Scholar] [CrossRef]
- Tan, Y.X.; Jiang, J.H.; Wu, H.L.; Cui, H.; Yu, R.Q. Resolution of kinetic system of simultaneous degradations of chlorophyll a and b by PARAFAC. Anal. Chim. Acta 2000, 412, 195–202. [Google Scholar] [CrossRef]
- Li, S.F.; Wu, H.L.; Huang, L.; Li, Y.N.; Nie, J.F.; Zhang, S.R.; Yu, R.Q. Quantitative analysis of fluphenazine hydrochloride in human urine using excitation-emission matrix fluorescence based on oxidation derivatization and combined with second-order calibration methods. Anal. Methods 2010, 2, 1069–1077. [Google Scholar] [CrossRef]
- Liu, Y.J.; Wu, H.L.; Nie, J.F.; Wang, J.Y.; Ouyang, L.Q.; Yu, R.Q. Simultaneous determination of dextromethorphan and its metabolite dextrorphan in plasma samples using second-order calibration coupled with excitation-emission matrix fluorescence. Anal. Sci. 2010, 27, 663–666. [Google Scholar] [CrossRef]
- Liu, Y.T.; Deng, J.; An, L.; Liang, J.; Chen, F.; Wang, H. Spectrophotometric determination of melamine in milk by rank annihilation factor analysis based on pH gradual change-UV spectral data. Food Chem. 2011, 126, 745–750. [Google Scholar] [CrossRef]
- Wang, J.Y.; Wu, H.L.; Chen, Y.; Sun, Y.M.; Yu, Y.J.; Zhang, X.H.; Yu, R.Q. Fast analysis of synthetic antioxidants in edible vegetable oil using trilinear component modeling of liquid chromatography–diode array detection data. J. Chromatogr. A 2012, 1264, 63–71. [Google Scholar] [CrossRef]
- Zhang, X.H.; Wu, H.L.; Wang, J.Y.; Chen, Y.; Yu, Y.J.; Nie, C.C.; Kang, C.; Tu, D.Z.; Yu, R.Q. Second-order calibration applied to quantification of two active components of Schisandra chinensis in complex matrix. J. Pharm. Anal. 2012, 2, 241–248. [Google Scholar] [CrossRef]
- Zhang, S.R.; Wu, H.L.; Chen, Y.; Zhang, X.H.; Wang, J.Y.; Li, Y.; Yu, R.Q. An investigation on hydrogen bonding between 3-methylindole and ethanol using trilinear decomposition of fluorescence excitation–emission matrices. Chemom. Intell. Lab. Syst. 2013, 121, 9–14. [Google Scholar] [CrossRef]
- Nie, J.F.; Wu, H.L.; Wang, X.M.; Zhang, Y.; Zhu, S.H.; Yu, R.Q. Determination of testosterone propionate in cosmetics using excitation-emission matrix fluorescence based on oxidation derivatization with the aid of second-order calibration methods. Anal. Chim. Acta 2008, 628, 24–32. [Google Scholar] [CrossRef]
- Yuan, J.T.; Liao, L.F.; Lin, Y.W.; Deng, C.A.; He, B. Determination of Sudan I in chilli powder from solvent components gradual change–visible spectra data using second order calibration algorithms. Anal. Chim. Acta 2008, 607, 160–167. [Google Scholar] [CrossRef]
- Zhu, S.H.; Wu, H.L.; Xia, A.L.; Han, Q.J.; Zhang, Y.; Yu, R.Q. Quantitative analysis of hydrolysis of carbaryl in tap water and river by excitation–emission matrix fluorescence coupled with second-order calibration. Talanta 2008, 74, 1579–1585. [Google Scholar] [CrossRef] [PubMed]
- Olivieri, A.C.; Arancibia, J.A.; Muñoz de la Peña, A.; Duran-Meras, I.; Mansilla, A.E. Second-order advantage achieved with four-way fluorescence excitation-emission-kinetic data processed by parallel factor analysis and trilinear least-squares. Determination of methotrexate and leucovorin in human urine. Anal. Chem. 2004, 76, 5657–5666. [Google Scholar] [CrossRef]
- Goicoechea, H.C.; Yu, S.; Olivieri, A.C.; Campiglia, A.D. Four-way data coupled to parallel factor model applied to environmental analysis: Determination of 2, 3, 7, 8-tetrachloro-dibenzo-para-dioxin in highly contaminated waters by solid-liquid extraction laser-excited time-resolved Shpol’skii spectroscopy. Anal. Chem. 2005, 77, 2608–2616. [Google Scholar] [CrossRef]
- Arancibia, J.A.; Olivieri, A.C.; Gil, D.B.; Mansilla, A.E.; Durán-Merás, I.; de la Peña, A.M. Trilinear least-squares and unfolded-PLS coupled to residual trilinearization: New chemometric tools for the analysis of four-way instrumental data. Chemom. Intell. Lab. Syst. 2006, 80, 77–86. [Google Scholar] [CrossRef]
- De la Peña, M.A.; Durán Merás, I.; Jiménez Girón, A. Four-way calibration applied to the simultaneous determination of folic acid and methotrexate in urine samples. Anal. Bioanal. Chem. 2006, 385, 1289–1297. [Google Scholar] [CrossRef]
- García-Reiriz, A.; Damiani, P.C.; Olivieri, A.C.; Cañada-Cañada, F.; Muñoz de la Peña, A. Nonlinear four-way kinetic-excitation-emission fuorescence data processed by a variant of parallel factor analysis and by a neural network model achieving the second-order advantage: Malonaldehyde determination in olive oil samples. Anal. Chem. 2008, 80, 7248–7256. [Google Scholar] [CrossRef]
- Zhu, S.H.; Wu, H.L.; Xia, A.L.; Nie, J.F.; Bian, Y.C.; Cai, C.B.; Yu, R.Q. Excitation-emission-kinetic fluorescence coupled with third-order calibration for quantifying carbaryl and investigating the hydrolysis in effluent water. Talanta 2009, 77, 1640–1646. [Google Scholar] [CrossRef] [PubMed]
- Goicoechea, H.C.; Yu, S.; Moore, A.F.T.; Campiglia, A.D. Four-way modeling of 4.2 K time-resolved excitation emission fluorescence data for the quantitation of polycyclic aromatic hydrocarbons in soil samples. Talanta 2012, 101, 330–336. [Google Scholar] [CrossRef]
- Liu, Y.J.; Wu, H.L.; Kang, C.; Gu, H.W.; Nie, J.F.; Li, S.S.; Su, Z.Y.; Yu, R.Q. Four-way self-weighted alternating normalized residue fitting algorithm with application for the analysis of serotonin in human plasma. Anal. Sci. 2012, 28, 1097–1104. [Google Scholar] [CrossRef] [PubMed]
- Olivieri, A.C.; Faber, K. New developments for the sensitivity estimation in four-way calibration with the quadrilinear parallel factor model. Anal. Chem. 2012, 84, 186–193. [Google Scholar] [CrossRef]
- Kang, C.; Wu, H.L.; Xie, L.X.; Xiang, S.X.; Yu, R.Q. Direct quantitative analysis of aromatic amino acids in human plasma by four-way calibration using intrinsic fluorescence: Exploration of third-order advantages. Talanta 2014, 122, 293–301. [Google Scholar] [CrossRef]
- Xie, L.X.; Wu, H.L.; Fang, Y.; Kang, C.; Xiang, S.X.; Zhu, L.; Yin, X.L.; Gu, H.W.; Liu, Z.; Yu, R.Q. Simultaneous determination of tyrosine and levodopa in human plasma using enzyme-induced excitation-emission-kinetic third-order calibration method. Chemom. Intell. Lab. Syst. 2015, 148, 9–19. [Google Scholar] [CrossRef]
- Kang, C.; Wu, H.L.; Zhou, C.; Xiang, S.X.; Zhang, X.H.; Yu, Y.J.; Yu, R.Q. Quantitative fluorescence kinetic analysis of NADH and FAD in human plasma using three- and four-way calibration methods capable of providing the second-order advantage. Anal. Chim. Acta 2016, 910, 36–44. [Google Scholar] [CrossRef] [PubMed]
- Zhang, X.H.; Wu, H.L.; Yin, X.L.; Li, Y.; Qing, X.D.; Gu, H.W.; Kang, C.; Yu, R.Q. Exploiting third-order advantage using four-way calibration method for direct quantitative analysis of active ingredients of Schisandra chinensis in DMEM by processing four-way excitation-emission-solvent fluorescence data. Chemom. Intell. Lab. Syst. 2016, 155, 46–53. [Google Scholar] [CrossRef]
- Kang, C.; Wu, H.L.; Xu, M.L.; Yan, X.F.; Liu, Y.J.; Yu, R.Q. Simultaneously quantifying intracellular FAD and FMN using a novel strategy of intrinsic fluorescence four-way calibration. Talanta 2019, 197, 105–112. [Google Scholar] [CrossRef] [PubMed]
- Lu, S.H.; Zhai, H.L.; Zhao, B.Q.; Yin, B.; Zhu, L. A novel approach to the analysis of chemical third-order data. J. Chem. Inf. Modeling 2020, 60, 4750–4756. [Google Scholar] [CrossRef]
- Booksh, K.; Henshaw, J.M.; Burgess, L.W.; Kowalski, B.R. A second-order standard addition method with application to calibration of a kinetics-spectroscopic sensor for quantitation of trichloroethylene. J. Chemom. 1995, 9, 263–282. [Google Scholar] [CrossRef]
- Samari, F.; Hemmateenejad, B.; Shamsipur, M. Spectrophotometric determination of carminic acid in human plasma and fruit juices by second order calibration of the absorbance spectra–pH data matrices coupled with standard addition method. Anal. Chim. Acta 2010, 667, 49–56. [Google Scholar] [CrossRef]
- Zhu, S.H.; Wu, H.L.; Li, B.R.; Xia, A.L.; Han, Q.J.; Zhang, Y.; Bian, Y.C.; Yu, R.Q. Determination of pesticides in honey using excitation–emission matrix fluorescence coupled with second-order calibration and second-order standard addition methods. Anal. Chim. Acta 2008, 619, 165–172. [Google Scholar] [CrossRef]
- Arancibia, J.A.; Damiani, P.C.; Escandar, G.M.; Ibañez, G.A.; Olivieri, A.C. A review on second- and third-order multivariate calibration applied to chromatographic data. J. Chromatogr. B 2012, 910, 22–30. [Google Scholar] [CrossRef]
- Escandar, G.M.; Olivieri, A.C. Multi-way chromatographic calibration—A review. J. Chromatogr. A 2019, 1587, 2–13. [Google Scholar] [CrossRef] [PubMed]
- Anzardi, M.B.; Arancibia, J.A.; Olivieri, A.C. Processing multi-way chromatographic data for analytical calibration, classification and discrimination: A successful marriage between separation science and chemometrics. Trac Trends Anal. Chem. 2021, 134, 116128. [Google Scholar] [CrossRef]
- Fang, D.M.; Wu, H.L.; Ding, Y.J.; Hu, L.Q.; Xia, A.L.; Yu, R.Q. Interference-free determination of fluoroquinolone antibiotics in plasma by using excitation–emission matrix fluorescence coupled with second-order calibration algorithms. Talanta 2006, 70, 58–62. [Google Scholar] [CrossRef] [PubMed]
- Zhang, Y.; Wu, H.L.; Xia, A.L.; Han, Q.J.; Cui, H.; Yu, R.Q. Interference-free determination of Sudan dyes in chilli foods using second-order calibration algorithms coupled with HPLC-DAD. Talanta 2007, 72, 926–931. [Google Scholar] [CrossRef]
- Qing, X.D.; Zhou, H.B.; Zhang, X.H.; Wu, H.L.; Chen, C.Y.; Xu, S.W.; Li, S.S. Alternating trilinear decomposition of highly overlapped chromatograms for simultaneously targeted quantification of 15 PAHs in samples of pollution source. Microchem. J. 2019, 146, 742–752. [Google Scholar] [CrossRef]
- Cabrera-Bañegil, M.; Lavado Rodas, N.; Prieto Losada, M.H.; Blanco Cipollone, F.; Moñino Espino, M.J.; Muñoz de la Peña, A.; Durán-Merás, I. Evolution of polyphenols content in plum fruits (Prunus salicina) with harvesting time by second-order excitation-emission fluorescence multivariate calibration. Microchem. J. 2020, 158, 105299. [Google Scholar] [CrossRef]
- Dinç, E.; Ünal, N.; Ertekin, Z.C. Novel three-dimensional resolution of a pH and ultraviolet-visible absorption spectral dataset for the determination of desloratadine in a pharmaceutical product and its acid dissociation constant. Anal. Lett. 2020, 53, 1871–1887. [Google Scholar] [CrossRef]
- Ouyang, Y.Z.; Wu, H.L.; Fang, H.; Wang, T.; Sun, X.D.; Chang, Y.Y.; Ding, Y.J.; Yu, R.Q. Rapid and simultaneous determination of three fluoroquinolones in animal-derived foods using excitation-emission matrix fluorescence coupled with second-order calibration method. Spectrochim. Acta Part A Mol. Biomol. Spectrosc. 2020, 224, 117458. [Google Scholar] [CrossRef]
- Zhang, J.; Guo, C.; Cai, W.S.; Shao, X.G. Direct non-trilinear decomposition for analyzing high-dimensional data with imperfect trilinearity. Chemom. Intell. Lab. Syst. 2021, 210, 104244. [Google Scholar] [CrossRef]
- Bravo, M.A.; Gonzalez, L.A.; Valverde, O.B.; Quiroz, V.W.; Toledo-Neira, C. Evaluation of three-way fluorescence data-based for simultaneous determination of polycyclic aromatic hydrocarbons in tea infusion samples at sub-ppb levels by second-order multivariate calibration. Microchem. J. 2019, 151, 104208. [Google Scholar] [CrossRef]
- Yan, X.F.; Wu, H.L.; Qing, X.D.; Sun, Y.M.; Yu, R.Q. Interference-free determination of indole-3-acetic acid in two real systems using second-order calibration method coupled with excitation-emission matrix fluorescence. Anal. Sci. 2014, 30, 489–494. [Google Scholar] [CrossRef][Green Version]
- Hu, Y.; Wu, H.L.; Yin, X.L.; Gu, H.W.; Kang, C.; Xiang, S.X.; Xia, H.; Yu, R.Q. Chemometrics-assisted determination of amiloride and triamterene in biological fluids with overlapped peaks and unknown interferences. Bioanalysis 2015, 7, 1685–1697. [Google Scholar] [CrossRef]
- Xie, L.X.; Wu, H.L.; Kang, C.; Xiang, S.X.; Yin, X.L.; Gu, H.W.; Zuo, Q.; Yu, R.Q. Quantitative investigation of the dynamic interaction of human serum albumin with procaine using a multi-way calibration method coupled with three-dimensional fluorescence spectroscopy. Anal. Methods 2015, 7, 6552–6560. [Google Scholar] [CrossRef]
- Ouyang, L.Q.; Wu, H.L.; Nie, J.F.; Zhang, Y.; Zou, H.Y.; Fu, H.Y.; Yu, R.Q. Simultaneous determination of psoralen and isopsoralen in plasma and chinese medicine Xian Ling Gu Bao capsule by using HPLC-DAD coupled with alternating trilinear decomposition algorithm. Anal. Chim. Acta 2009, 650, 160–166. [Google Scholar] [CrossRef]
- Zou, H.Y.; Wu, H.L.; OuYang, L.Q.; Zhang, Y.; Nie, J.F.; Fu, H.Y.; Yu, R.Q. Fluorescent quantification of terazosin hydrochloride content in human plasma and tablets using second-order calibration based on both parallel factor analysis and alternating penalty trilinear decomposition. Anal. Chim. Acta 2009, 650, 143–149. [Google Scholar] [CrossRef] [PubMed]
- Li, Y.N.; Wu, H.L.; Qing, X.D.; Nie, C.C.; Li, S.F.; Yu, Y.J.; Zhang, S.R.; Yu, R.Q. The maintenance of the second-order advantage: Second-order calibration of excitation–emission matrix fluorescence for quantitative analysis of herbicide napropamide in various environmental samples. Talanta 2011, 85, 325–332. [Google Scholar] [CrossRef] [PubMed]
- Chen, H.; Kenny, J.E. Application of PARAFAC to a two-component system exhibiting fluorescence resonance energy transfer: From theoretical prediction to experimental validation. Analyst 2012, 137, 153–162. [Google Scholar] [CrossRef] [PubMed]
- Ni, Y.N.; Gu, Y.; Kokot, S. Multiway calibrations based on spectrofluorimetric data derived from kinetic analysis of the hydrolysis reaction of nitrofurans—A comparison of prediction performance. Chemom. Intell. Lab. Syst. 2012, 112, 55–64. [Google Scholar] [CrossRef]
- Tu, D.Z.; Wu, H.L.; Li, Y.N.; Zhang, J.; Li, Y.; Nie, C.C.; Zhang, X.H.; Yu, R.Q. Measuring estriol and estrone simultaneously in liquid cosmetic samples using second-order calibration coupled with excitation–emission matrix fluorescence based on region selection. Anal. Methods 2012, 4, 222–229. [Google Scholar] [CrossRef]
- Wang, J.Y.; Wu, H.L.; Chen, Y.; Zhai, M.; Qing, X.D.; Yu, R.Q. Quantitative determination of butylated hydroxyanisole and n-propyl gallate in cosmetics using three-dimensional fluorescence coupled with second-order calibration. Talanta 2013, 116, 347–353. [Google Scholar] [CrossRef] [PubMed]
- Zhang, X.H.; Wu, H.L.; Yin, X.L.; Li, L.H.; Wang, J.Y.; Chen, Y.; Kang, C.; Yu, R.Q. A combined theoretical and experimental study for the chiral discrimination of naproxen enantiomers by molecular modeling and second-order standard addition method. Anal. Methods 2013, 5, 710–717. [Google Scholar] [CrossRef]
- Kang, C.; Wu, H.L.; Xiang, S.X.; Xie, L.X.; Liu, Y.J.; Yu, Y.J.; Sun, J.J.; Yu, R.Q. Simultaneous determination of aromatic amino acids in different systems using three-way calibration based on the PARAFAC-ALS algorithm coupled with EEM fluorescence: Exploration of second-order advantages. Anal. Methods 2014, 6, 6358–6368. [Google Scholar] [CrossRef]
- Nie, J.F.; Wu, H.L.; Zhu, S.H.; Han, Q.J.; Fu, H.Y.; Li, S.F.; Yu, R.Q. Simultaneous determination of 6-methylcoumarin and 7-methoxycoumarin in cosmetics using three-dimensional excitation–emission matrix fluorescence coupled with second-order calibration methods. Talanta 2008, 75, 1260–1269. [Google Scholar] [CrossRef]
- Zhou, P.R.; Tang, Z.F.; Wei, K.S.; Wan, Y.; Gao, Y.M.; Liang, Y.M.; Yan, X.F.; Bin, J.; Kang, C. Enhanced selectivity of ultraviolet-visible absorption spectroscopy with trilinear decomposition on spectral pH measurements for the interference-free determination of rutin and isorhamnetin in Chinese herbal medicine. Anal. Lett. 2021. [Google Scholar] [CrossRef]
- Kruskal, J.B. Three-way arrays: Rank and uniqueness of trilinear decompositions, with application to arithmetic complexity and statistics. Linear Algebra Appl. 1977, 18, 95–138. [Google Scholar] [CrossRef]
- Sidiropoulos, N.D.; Bro, R. On the uniqueness of multilinear decomposition of N-way arrays. J. Chemom. 2000, 14, 229–239. [Google Scholar] [CrossRef]
- Sanchez, E.; Kowalski, B.R. Generalized rank annihilation factor analysis. Anal. Chem. 1986, 58, 496–499. [Google Scholar] [CrossRef]
- Sanchez, E.; Kowalski, B.R. Tensorial resolution: A direct trilinear decomposition. J. Chemom. 1990, 4, 29–45. [Google Scholar] [CrossRef]
- Wu, H.L.; Shibukawa, M.; Oguma, K. An alternating trilinear decomposition algorithm with application to calibration of HPLC-DAD for simultaneous determination of overlapped chlorinated aromatic hydrocarbons. J. Chemom. 1998, 12, 1–26. [Google Scholar] [CrossRef]
- Linder, M.; Sundberg, R. Second-order calibration: Bilinear least squares regression and a simple alternative. Chemom. Intell. Lab. Syst. 1998, 42, 159–178. [Google Scholar] [CrossRef][Green Version]
- Olivieri, A.C. On a versatile second-order multivariate calibration method based on partial least-squares and residual bilinearization: Second-order advantage and precision properties. J. Chemom. 2005, 19, 253–265. [Google Scholar] [CrossRef]
- Yu, Y.J.; Wu, H.L.; Niu, J.F.; Zhao, J.; Li, Y.N.; Kang, C.; Yu, R.Q. A novel chromatographic peak alignment method coupled with trilinear decomposition for three dimensional chromatographic data analysis to obtain the second-order advantage. Analyst 2013, 138, 627–634. [Google Scholar] [CrossRef]
- Kumar, K. Discrete wavelet assisted correlation optimised warping of chromatograms: Optimizing the computational time for correcting the drifts in peak positions. Anal. Methods 2017, 9, 2049–2058. [Google Scholar] [CrossRef]
- Kumar, K. Chemometric assisted correlation optimized warping of chromatograms: Optimizing the computational time for correcting the drifts in chromatographic peak positions. Anal. Methods 2018, 10, 1006–1014. [Google Scholar] [CrossRef]
- Kumar, K. Optimizing the process of reference selection for correlation optimised warping (COW) and interval correlation shifting (icoshift) analysis: Automating the chromatographic alignment procedure. Anal. Methods 2018, 10, 190–203. [Google Scholar] [CrossRef]
- Kumar, K. Introducing an integral optimised warping (IOW) approach for achieving swift alignment of drifted chromatographic peaks: An optimisation of the correlation optimised warping (COW) technique. Anal. Methods 2018, 10, 2764–2774. [Google Scholar] [CrossRef]
- Kumar, K. Anchor assisted warping of the chromatograms: A novel procedure to correct the drifts in the chromatographic peak positions. Talanta 2019, 195, 543–549. [Google Scholar] [CrossRef] [PubMed]
- Andersson, C.A.; Bro, R. The N-way toolbox for MATLAB. Chemom. Intell. Lab. Syst. 2000, 52, 1–4. [Google Scholar] [CrossRef]
- Qing, X.D.; Wu, H.L.; Yan, X.F.; Li, Y.; Ouyang, L.Q.; Nie, C.C.; Yu, R.Q. Development of a novel alternating quadrilinear decomposition algorithm for the kinetic analysis of four-way room-temperature phosphorescence data. Chemom. Intell. Lab. Syst. 2014, 132, 8–17. [Google Scholar] [CrossRef]
- Xia, A.L.; Wu, H.L.; Li, S.F.; Zhu, S.H.; Hu, L.Q.; Yu, R.Q. Alternating penalty quadrilinear decomposition algorithm for an analysis of four-way data arrays. J. Chemom. 2007, 21, 133–144. [Google Scholar] [CrossRef]
- Fu, H.Y.; Wu, H.L.; Yu, Y.J.; Yu, L.L.; Zhang, S.R.; Nie, J.F.; Li, S.F.; Yu, R.Q. A new third order calibration method with application for analysis of four way data arrays. J. Chemom. 2011, 25, 408–429. [Google Scholar] [CrossRef]
- Kang, C.; Wu, H.L.; Yu, Y.J.; Liu, Y.J.; Zhang, S.R.; Zhang, X.H.; Yu, R.Q. An alternative quadrilinear decomposition algorithm for four-way calibration with application to analysis of four-way fluorescence excitation-emission-pH data array. Anal. Chim. Acta 2013, 758, 45–57. [Google Scholar] [CrossRef] [PubMed]
- Kang, C.; Wu, H.L.; Song, J.J.; Xu, H.; Liu, Y.J.; Yu, Y.J.; Zhang, X.H.; Yu, R.Q. A flexible trilinear decomposition algorithm for three-way calibration based on the trilinear component model and a theoretical extension of the algorithm to the multilinear component model. Anal. Chim. Acta 2015, 878, 63–77. [Google Scholar] [CrossRef] [PubMed]
- Olivieri, A.C.; Faber, N.K.M. Standard error of prediction in parallel factor analysis of three-way data. Chemom. Intell. Lab. Syst. 2004, 70, 75–82. [Google Scholar] [CrossRef]
- Olivieri, A.C.; Wu, H.L.; Yu, R.Q. MVC2: A MATLAB graphical interface toolbox for second-order multivariate calibration. Chemom. Intell. Lab. Syst. 2009, 96, 246–251. [Google Scholar] [CrossRef]
- Olivieri, A.C.; Wu, H.L.; Yu, R.Q. MVC3: A MATLAB graphical interface toolbox for third-order multivariate calibration. Chemom. Intell. Lab. Syst. 2012, 116, 9–16. [Google Scholar] [CrossRef]
- Yu, Y.J.; Wu, H.L.; Shao, S.Z.; Kang, C.; Zhao, J.; Wang, Y.; Zhu, S.H.; Yu, R.Q. Using second-order calibration method based on trilinear decomposition algorithms coupled with high performance liquid chromatography with diode array detector for determination of quinolones in honey samples. Talanta 2011, 85, 1549–1559. [Google Scholar] [CrossRef] [PubMed]
- Liu, Y.J.; Wu, H.L.; Zhu, S.H.; Kang, C.; Xu, H.; Su, Z.Y.; Gu, H.W.; Yu, R.Q. Rapid determination of costunolide and dehydrocostuslactone in human plasma sample and chinese patent medicine Xiang Sha Yang Wei capsule using HPLC-DAD coupled with second-order calibration. Chin. J. Chem. 2012, 30, 1137–1143. [Google Scholar] [CrossRef]
- Zhao, J.; Wu, H.L.; Niu, J.F.; Yu, Y.J.; Yu, L.L.; Kang, C.; Li, Q.; Zhang, X.H.; Yu, R.Q. Chemometric resolution of coeluting peaks of eleven antihypertensives from multiple classes in high performance liquid chromatography: A comprehensive research in human serum, health product and Chinese patent medicine samples. J. Chromatogr. B 2012, 902, 96–107. [Google Scholar] [CrossRef]
- Zhang, X.H.; Wu, H.L.; Wang, J.Y.; Tu, D.Z.; Kang, C.; Zhao, J.; Chen, Y.; Miu, X.X.; Yu, R.Q. Fast HPLC-DAD quantification of nine polyphenols in honey by using second-order calibration method based on trilinear decomposition algorithm. Food Chem. 2013, 138, 62–69. [Google Scholar] [CrossRef]
- Yu, Y.J.; Wu, H.L.; Fu, H.Y.; Zhao, J.; Li, Y.N.; Li, S.F.; Kang, C.; Yu, R.Q. Chromatographic background drift correction coupled with parallel factor analysis to resolve coelution problems in three-dimensional chromatographic data: Quantification of eleven antibiotics in tap water samples by high-performance liquid chromatography coupled with a diode array detector. J. Chromatogr. A 2013, 1302, 72–80. [Google Scholar] [CrossRef]
- Xiang, S.X.; Wu, H.L.; Kang, C.; Xie, L.X.; Yin, X.L.; Gu, H.W.; Yu, R.Q. Fast quantitative analysis of four tyrosine kinase inhibitors in different human plasma samples using three-way calibration-assisted liquid chromatography with diode array detection. J. Sep. Sci. 2015, 38, 2781–2788. [Google Scholar] [CrossRef]
- Yin, X.L.; Wu, H.L.; Gu, H.W.; Hu, Y.; Wang, L.; Xia, H.; Xiang, S.X.; Yu, R.Q. Chemometrics-assisted high performance liquid chromatography-diode array detection strategy to solve varying interfering patterns from different chromatographic columns and sample matrices for beverage analysis. J. Chromatogr. A 2016, 1435, 75–84. [Google Scholar] [CrossRef] [PubMed]
- Liu, Z.; Wu, H.L.; Li, Y.; Gu, H.W.; Yin, X.L.; Xie, L.X.; Yu, R.Q. Rapid and simultaneous determination of five vinca alkaloids in Catharanthus roseus and human serum using trilinear component modeling of liquid chromatography–diode array detection data. J. Chromatogr. B 2016, 1026, 114–123. [Google Scholar] [CrossRef] [PubMed]
- Liu, Z.; Wu, H.L.; Xie, L.X.; Hu, Y.; Fang, H.; Sun, X.D.; Wang, T.; Xiao, R.; Yu, R.Q. Direct and interference-free determination of thirteen phenolic compounds in red wines using a chemometrics-assisted HPLC-DAD strategy for authentication of vintage year. Anal. Methods 2017, 9, 3361–3374. [Google Scholar] [CrossRef]
- Vosough, M.; Ghafghazi, S.; Moini Zanjani, T.; Sabetkasaei, M. Interference-free determination of carbamazepine in human serum using high performance liquid chromatography: A comprehensive research with three-way calibration methods. Iran. J. Pharm. Res. 2017, 16, 120–131. [Google Scholar] [CrossRef]
- Wang, T.; Wu, H.L.; Xie, L.X.; Zhu, L.; Liu, Z.; Sun, X.D.; Xiao, R.; Yu, R.Q. Fast and simultaneous determination of 12 polyphenols in apple peel and pulp by using chemometrics-assisted high-performance liquid chromatography with diode array detection. J. Sep. Sci. 2017, 40, 1651–1659. [Google Scholar] [CrossRef] [PubMed]
- Liu, Q.; Wu, H.L.; Liu, Z.; Xiao, R.; Wang, T.; Hu, Y.; Ding, Y.J.; Yu, R.Q. Chemometrics-assisted HPLC-DAD as a rapid and interference-free strategy for simultaneous determination of 17 polyphenols in raw propolis. Anal. Methods 2018, 10, 5577–5588. [Google Scholar] [CrossRef]
- Yin, X.L.; Gu, H.W.; Jalalvand, A.R.; Liu, Y.J.; Chen, Y.; Peng, T.Q. Dealing with overlapped and unaligned chromatographic peaks by second-order multivariate calibration for complex sample analysis: Fast and green quantification of eight selected preservatives in facial masks. J. Chromatogr. A 2018, 1573, 18–27. [Google Scholar] [CrossRef]
- Mortera, P.; Zuljan, F.A.; Magni, C.; Bortolato, S.A.; Alarcón, S.H. Multivariate analysis of organic acids in fermented food from reversed-phase high-performance liquid chromatography data. Talanta 2018, 178, 15–23. [Google Scholar] [CrossRef]
- Teglia, C.M.; Azcarate, S.M.; Alcaráz, M.R.; Goicoechea, H.C.; Culzoni, M.J. Exploiting the synergistic effect of concurrent data signals: Low-level fusion of liquid chromatographic with dual detection data. Talanta 2018, 186, 481–488. [Google Scholar] [CrossRef]
- Zhang, X.H.; Zhou, Q.; Liu, Z.; Qing, X.D.; Zheng, J.J.; Mu, S.T.; Liu, P.H. Comparison of three second-order multivariate calibration methods for the rapid identification and quantitative analysis of tea polyphenols in Chinese teas using high-performance liquid chromatography. J. Chromatogr. A 2020, 1618, 460905. [Google Scholar] [CrossRef] [PubMed]
- Tan, F.Y.; Tan, C.; Zhao, A.P.; Li, M.L. Simultaneous determination of free amino acid content in tea infusions by using high-performance liquid chromatography with fluorescence detection coupled with alternating penalty trilinear decomposition algorithm. J. Agric. Food Chem. 2011, 59, 10839–10847. [Google Scholar] [CrossRef]
- Wang, J.Y.; Wu, H.L.; Sun, Y.M.; Gu, H.W.; Liu, Z.; Liu, Y.J.; Yu, R.Q. Simultaneous determination of phenolic antioxidants in edible vegetable oils by HPLC–FLD assisted with second-order calibration based on ATLD algorithm. J. Chromatogr. B 2014, 947, 32–40. [Google Scholar] [CrossRef]
- Alcaráz, M.R.; Bortolato, S.A.; Goicoechea, H.C.; Olivieri, A.C. A new modeling strategy for third-order fast high-performance liquid chromatographic data with fluorescence detection. Quantitation of fluoroquinolones in water samples. Anal. Bioanal. Chem. 2015, 407, 1999–2011. [Google Scholar] [CrossRef]
- Bortolato, S.A.; Lozano, V.A.; de la Peña, A.M.; Olivieri, A.C. Novel augmented parallel factor model for four-way calibration of high-performance liquid chromatography–fluorescence excitation–emission data. Chemom. Intell. Lab. Syst. 2015, 141, 1–11. [Google Scholar] [CrossRef]
- Lozano, V.A.; Muñoz de la Peña, A.; Durán-Merás, I.; Espinosa Mansilla, A.; Escandar, G.M. Four-way multivariate calibration using ultra-fast high-performance liquid chromatography with fluorescence excitation–emission detection. Application to the direct analysis of chlorophylls a and b and pheophytins a and b in olive oils. Chemom. Intell. Lab. Syst. 2013, 125, 121–131. [Google Scholar] [CrossRef]
- Montemurro, M.; Pinto, L.; Véras, G.; de Araújo Gomes, A.; Culzoni, M.J.; Ugulino de Araújo, M.C.; Goicoechea, H.C. Highly sensitive quantitation of pesticides in fruit juice samples by modeling four-way data gathered with high-performance liquid chromatography with fluorescence excitation-emission detection. Talanta 2016, 154, 208–218. [Google Scholar] [CrossRef] [PubMed]
- Carabajal, M.D.; Arancibia, J.A.; Escandar, G.M. On-line generation of third-order liquid chromatography–excitation-emission fluorescence matrix data. Quantitation of heavy-polycyclic aromatic hydrocarbons. J. Chromatogr. A 2017, 1527, 61–69. [Google Scholar] [CrossRef] [PubMed]
- Barreca, S.; Busetto, M.; Colzani, L.; Clerici, L.; Daverio, D.; Dellavedova, P.; Balzamo, S.; Calabretta, E.; Ubaldi, V. Determination of estrogenic endocrine disruptors in water at sub-ng L−1 levels in compliance with Decision 2015/495/EU using offline-online solid phase extraction concentration coupled with high performance liquid chromatography-tandem mass spectrometry. Microchem. J. 2019, 147, 1186–1191. [Google Scholar] [CrossRef]
- Gu, H.W.; Wu, H.L.; Yin, X.L.; Li, Y.; Liu, Y.J.; Xia, H.; Zhang, S.R.; Jin, Y.F.; Sun, X.D.; Yu, R.Q.; et al. Multi-targeted interference-free determination of ten β-blockers in human urine and plasma samples by alternating trilinear decomposition algorithm-assisted liquid chromatography–mass spectrometry in full scan mode: Comparison with multiple reaction monitoring. Anal. Chim. Acta 2014, 848, 10–24. [Google Scholar] [CrossRef]
- Gu, H.W.; Wu, H.L.; Li, S.S.; Yin, X.L.; Hu, Y.; Xia, H.; Fang, H.; Yu, R.Q.; Yang, P.Y.; Lu, H.J. Chemometrics-enhanced full scan mode of liquid chromatography-mass spectrometry for the simultaneous determination of six co-eluted sulfonylurea-type oral antidiabetic agents in complex samples. Chemom. Intell. Lab. Syst. 2016, 155, 62–72. [Google Scholar] [CrossRef]
- Liu, Z.; Wu, H.L.; Xie, L.X.; Hu, Y.; Fang, H.; Sun, X.D.; Wang, T.; Xiao, R.; Yu, R.Q. Chemometrics-enhanced liquid chromatography-full scan-mass spectrometry for interference-free analysis of multi-class mycotoxins in complex cereal samples. Chemom. Intell. Lab. Syst. 2017, 160, 125–138. [Google Scholar] [CrossRef]
- Hu, Y.; Wu, H.L.; Yin, X.L.; Gu, H.W.; Xiao, R.; Xie, L.X.; Liu, Z.; Fang, H.; Wang, L.; Yu, R.Q. Rapid and interference-free analysis of nine B-group vitamins in energy drinks using trilinear component modeling of liquid chromatography-mass spectrometry data. Talanta 2018, 180, 108–119. [Google Scholar] [CrossRef]
- Sun, X.D.; Wu, H.L.; Liu, Z.; Xie, L.X.; Hu, Y.; Fang, H.; Wang, T.; Xiao, R.; Ding, Y.J.; Yu, R.Q. Chemometrics-assisted liquid chromatography-full scan mass spectrometry for simultaneous determination of multi-class estrogens in infant milk powder. Anal. Methods 2018, 10, 1459–1471. [Google Scholar] [CrossRef]
- Long, W.J.; Wu, H.L.; Wang, T.; Xie, L.X.; Hu, Y.; Fang, H.; Cheng, L.; Ding, Y.J.; Yu, R.Q. Chemometrics-assisted liquid chromatography with full scan mass spectrometry for the interference-free determination of glucocorticoids illegally added to face masks. J. Sep. Sci. 2018, 41, 3527–3537. [Google Scholar] [CrossRef]
- Yan, X.F.; Liang, Y.M.; Zhou, B.; Bin, J.; Kang, C. Enhancing the selectivity of liquid chromatography–mass spectrometry by using trilinear decomposition on LC-MS data: An application to three-way calibration of coeluting analytes in human plasma. J. Sep. Sci. 2020, 43, 2718–2727. [Google Scholar] [CrossRef]
- Khayamian, T.; Tan, G.H.; Sirhan, A.; Siew, Y.F.; Sajjadi, S.M. Comparison of three multi-way models for resolving and quantifying bifenthrin and tetramethrin using gas chromatography–mass spectrometry. Chemom. Intell. Lab. Syst. 2009, 96, 149–158. [Google Scholar] [CrossRef]
- Yang, S.; Nadeau, J.S.; Humston-Fulmer, E.M.; Hoggard, J.C.; Lidstrom, M.E.; Synovec, R.E. Gas chromatography–mass spectrometry with chemometric analysis for determining 12C and 13C labeled contributions in metabolomics and 13C flux analysis. J. Chromatogr. A 2012, 1240, 156–164. [Google Scholar] [CrossRef] [PubMed]
- Oca, M.L.; Ortiz, M.C.; Herrero, A.; Sarabia, L.A. Optimization of a GC/MS procedure that uses parallel factor analysis for the determination of bisphenols and their diglycidyl ethers after migration from polycarbonate tableware. Talanta 2013, 106, 266–280. [Google Scholar] [CrossRef]
- Fraga, C.G.; Corley, C.A. The chemometric resolution and quantification of overlapped peaks form comprehensive two-dimensional liquid chromatography. J. Chromatogr. A 2005, 1096, 40–49. [Google Scholar] [CrossRef]
- Zhang, Y.; Wu, H.-L.; Xia, A.L.; Hu, L.-H.; Zou, H.-F.; Yu, R.-Q. Trilinear decomposition method applied to removal of three-dimensional background drift in comprehensive two-dimensional separation data. J. Chromatogr. A 2007, 1167, 178–183. [Google Scholar] [CrossRef]
- Porter, S.E.G.; Stoll, D.R.; Rutan, S.C.; Carr, P.W.; Cohen, J.D. Analysis of four-way two-dimensional liquid chromatography-diode array data: Application to metabolomics. Anal. Chem. 2006, 78, 5559–5569. [Google Scholar] [CrossRef]
- Navarro-Reig, M.; Jaumot, J.; van Beek, T.A.; Vivó-Truyols, G.; Tauler, R. Chemometric analysis of comprehensive LC×LC-MS data: Resolution of triacylglycerol structural isomers in corn oil. Talanta 2016, 160, 624–635. [Google Scholar] [CrossRef] [PubMed]
- Van Mispelaar, V.G.; Tas, A.C.; Smilde, A.K.; Schoenmakers, P.J.; van Asten, A.C. Quantitative analysis of target components by comprehensive two-dimensional gas chromatography. J. Chromatogr. A 2003, 1019, 15–29. [Google Scholar] [CrossRef]
- Hoggard, J.C.; Synovec, R.E. Automated resolution of nontarget analyte signals in GC × GC-TOFMS data using parallel factor analysis. Anal. Chem. 2008, 80, 6677–6688. [Google Scholar] [CrossRef] [PubMed]
- Skov, T.; Hoggard, J.C.; Bro, R.; Synovec, R.E. Handling within run retention time shifts in two-dimensional chromatography data using shift correction and modeling. J. Chromatogr. A 2009, 1216, 4020–4029. [Google Scholar] [CrossRef] [PubMed]
- Hoggard, J.C.; Siegler, W.C.; Synovec, R.E. Toward automated peak resolution in complete GC × GC–TOFMS chromatograms by PARAFAC. J. Chemom. 2009, 23, 421–431. [Google Scholar] [CrossRef]
- Hoggard, J.C.; Wahl, J.H.; Synovec, R.E.; Mong, G.M.; Fraga, C.G. Impurity profiling of a chemical weapon precursor for possible forensic signatures by comprehensive two-dimensional gas chromatography/mass spectrometry and chemometrics. Anal. Chem. 2010, 82, 689–698. [Google Scholar] [CrossRef] [PubMed]
- Snyder, L.R.; Hoggard, J.C.; Montine, T.J.; Synovec, R.E. Development and application of a comprehensive two-dimensional gas chromatography with time-of-flight mass spectrometry method for the analysis of l-β-methylamino-alanine in human tissue. J. Chromatogr. A 2010, 1217, 4639–4647. [Google Scholar] [CrossRef]
Publisher’s Note: MDPI stays neutral with regard to jurisdictional claims in published maps and institutional affiliations. |
© 2021 by the authors. Licensee MDPI, Basel, Switzerland. This article is an open access article distributed under the terms and conditions of the Creative Commons Attribution (CC BY) license (http://creativecommons.org/licenses/by/4.0/).