
Identification of Tentative Traceability Markers with Direct Implications in Polyphenol Fingerprinting of Red Wines: Application of LC-MS and Chemometrics Methods

 ,
,  , and
, and 
Abstract
:
1. Introduction
2. Materials and Methods
2.1. Reagents and Standards
2.2. Wine Samples
2.3. HPLC-MS Analysis
2.4. Statistical Analysis
3. Results and Discussion
3.1. Analytical Performance
3.2. Evaluation of Wine Polyphenol Profiles
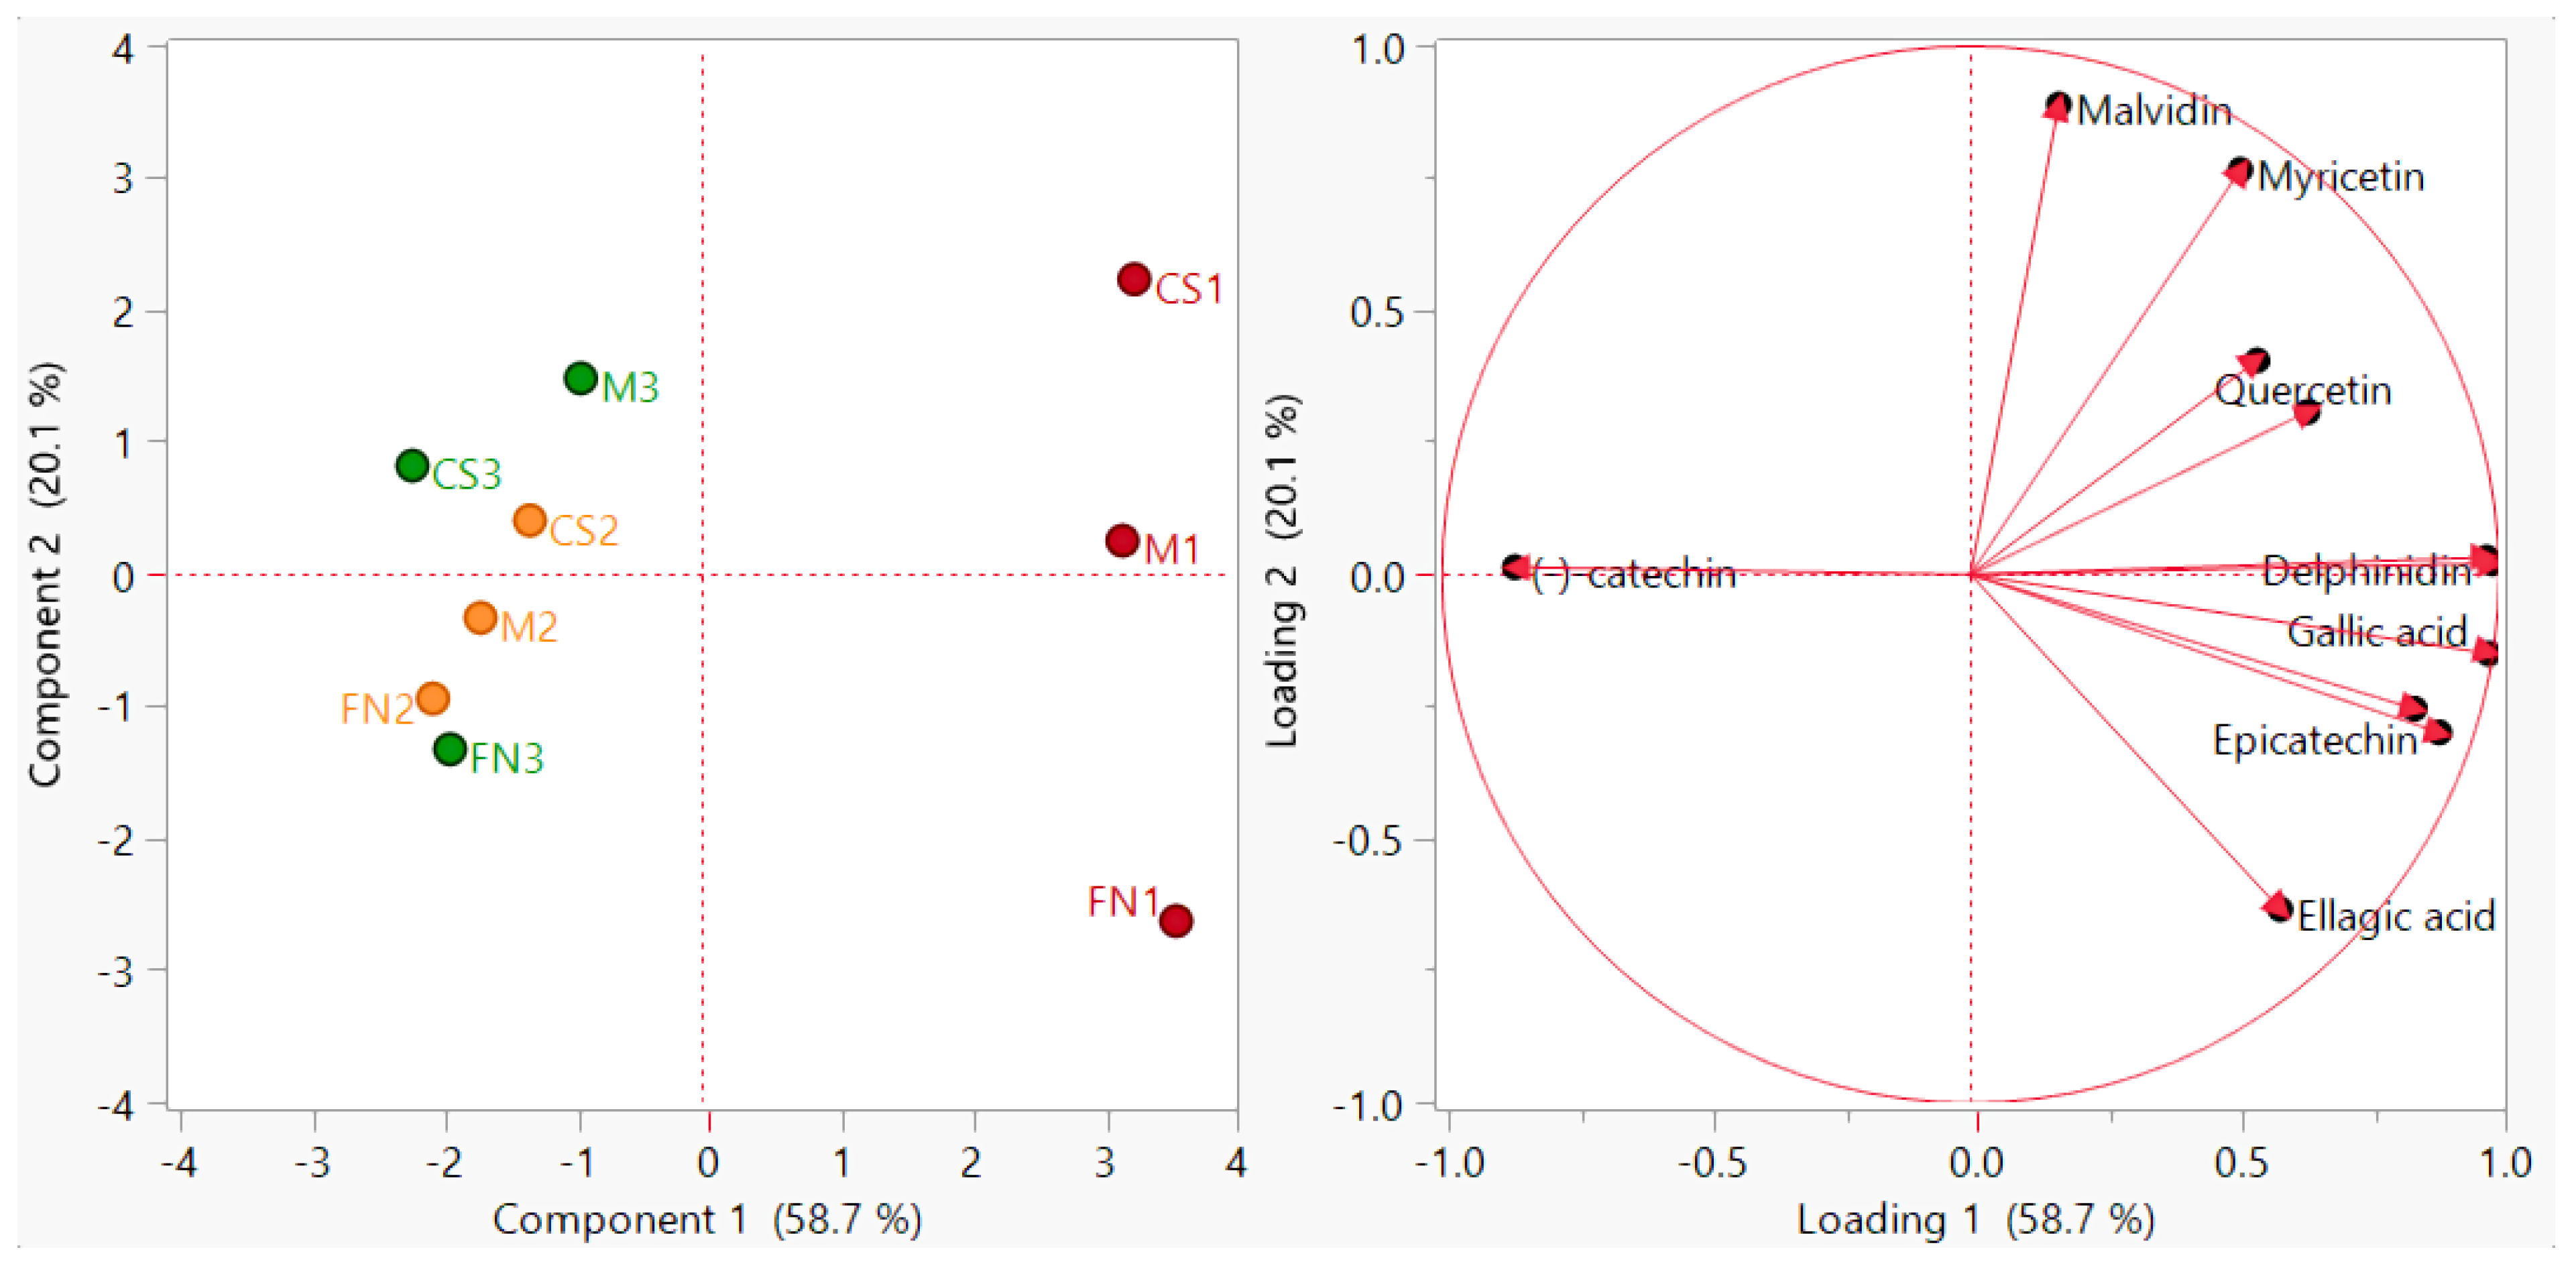
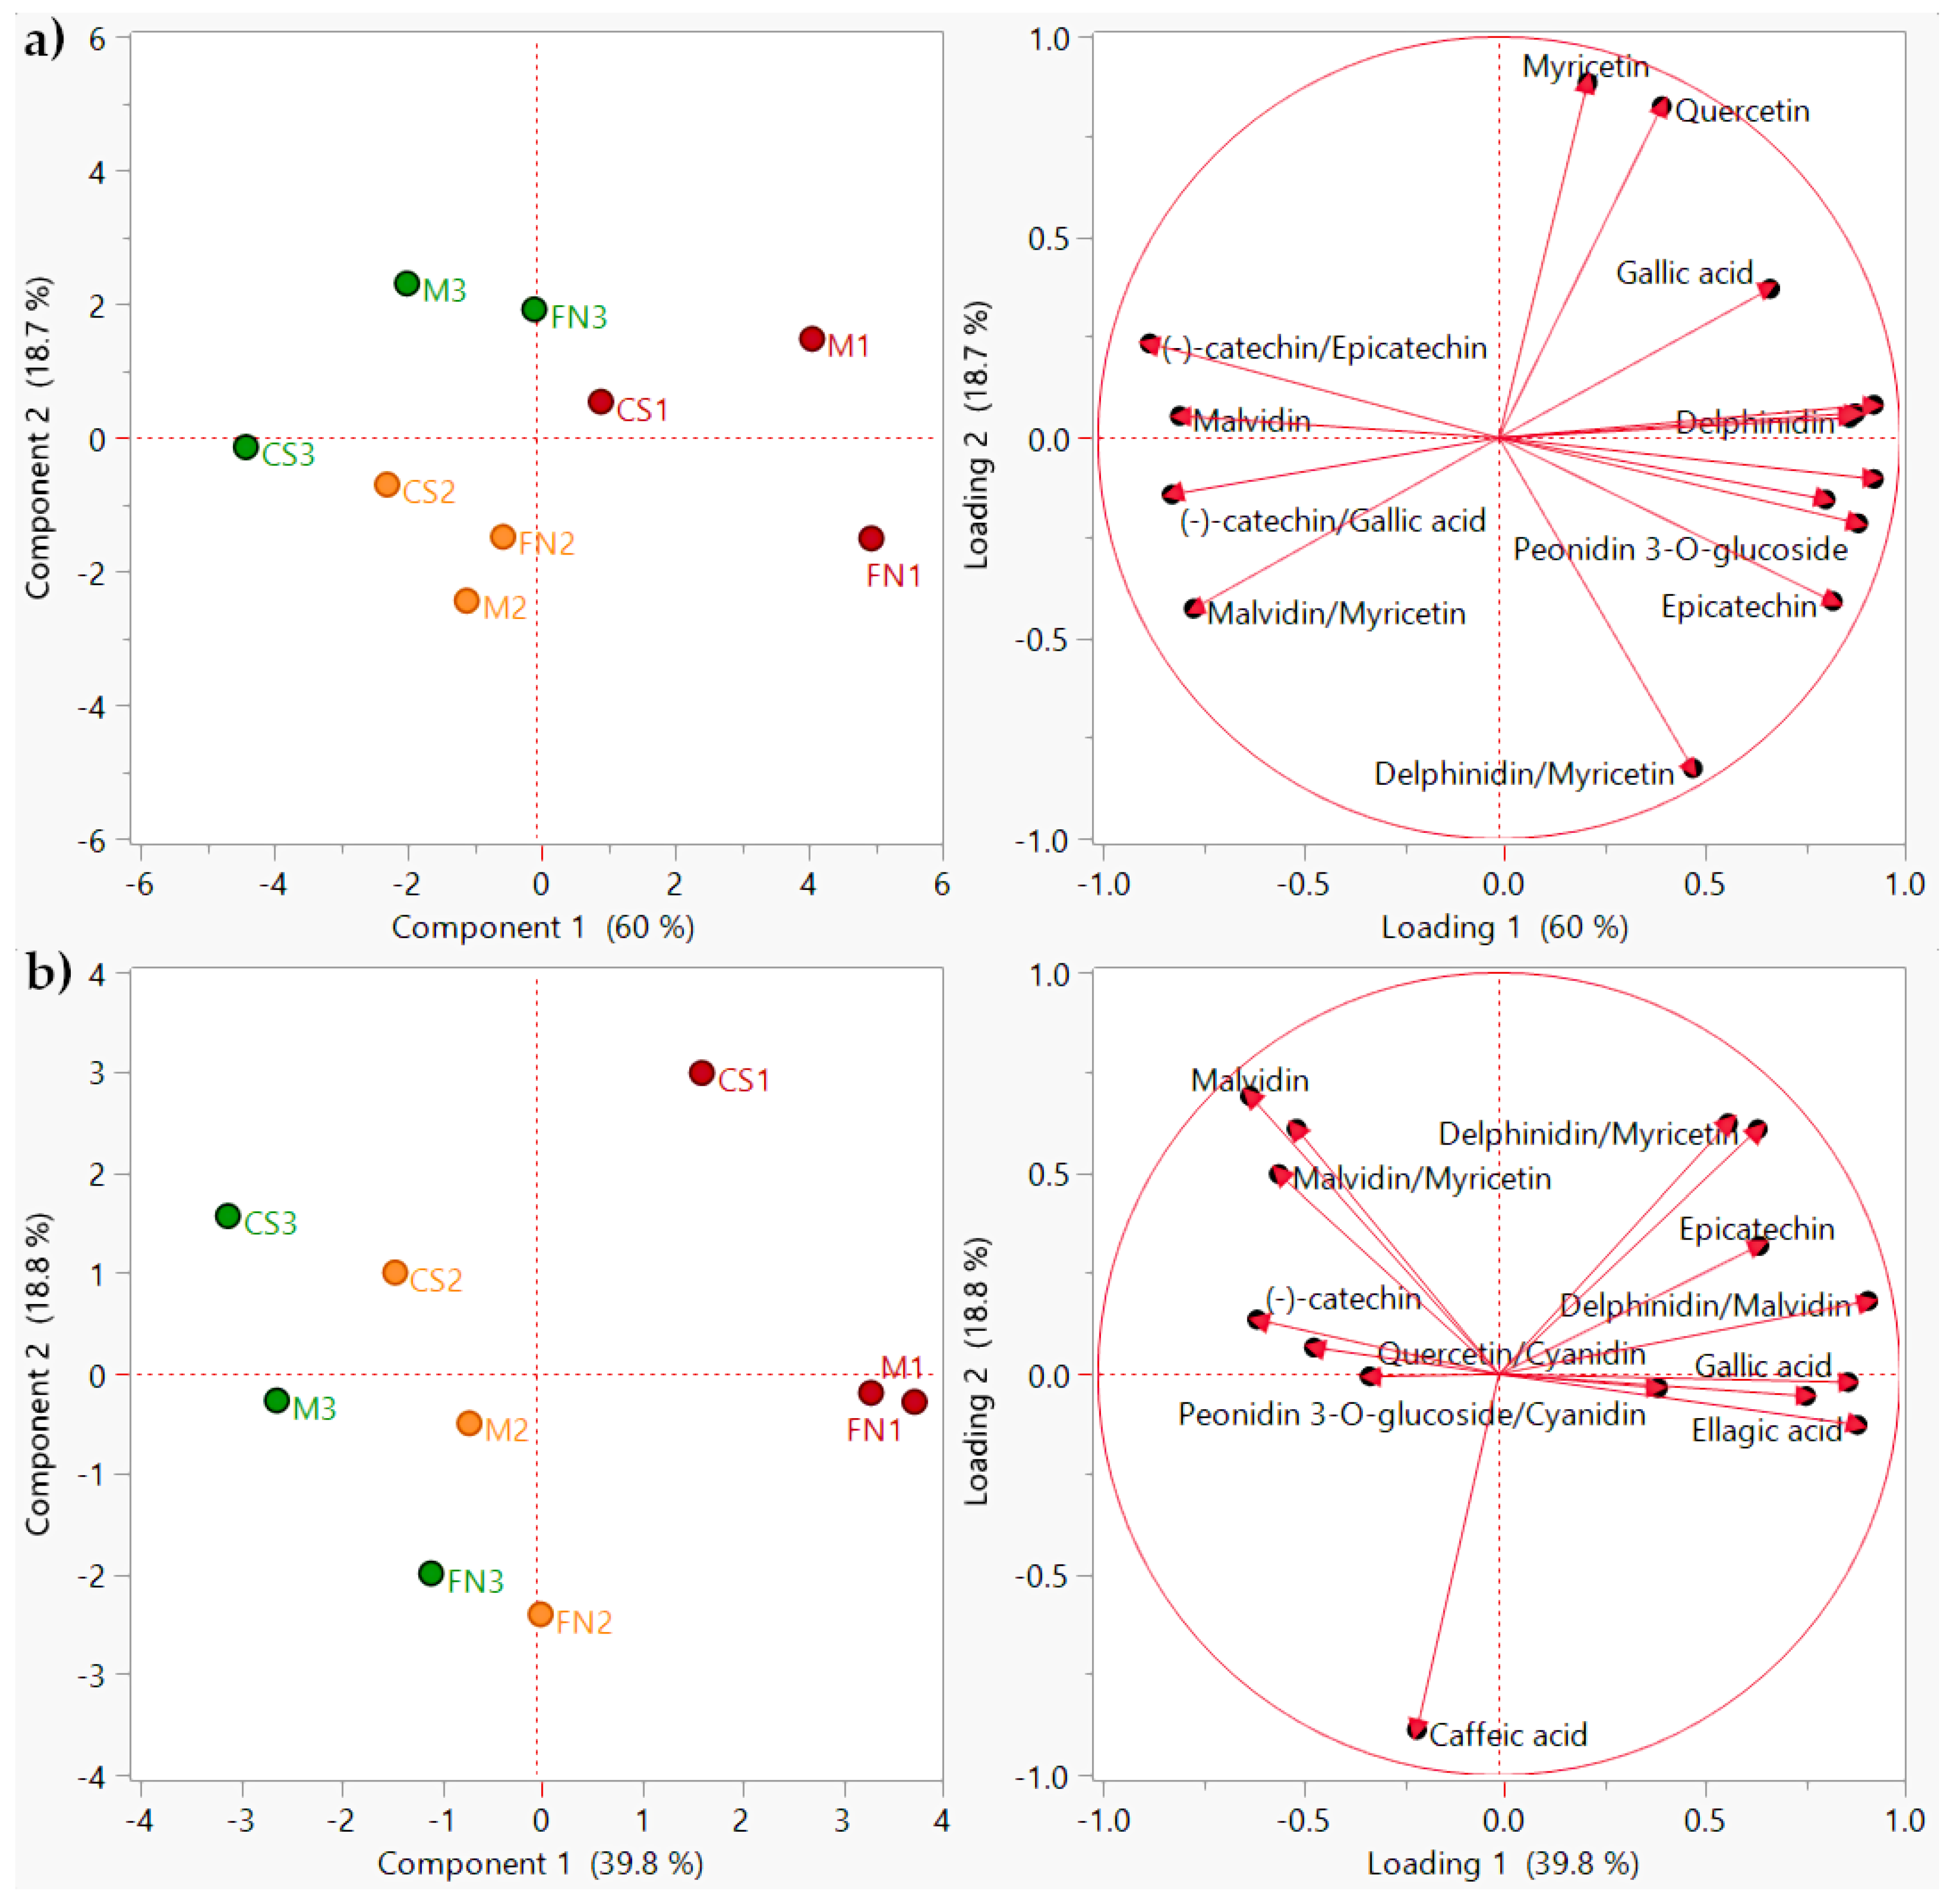
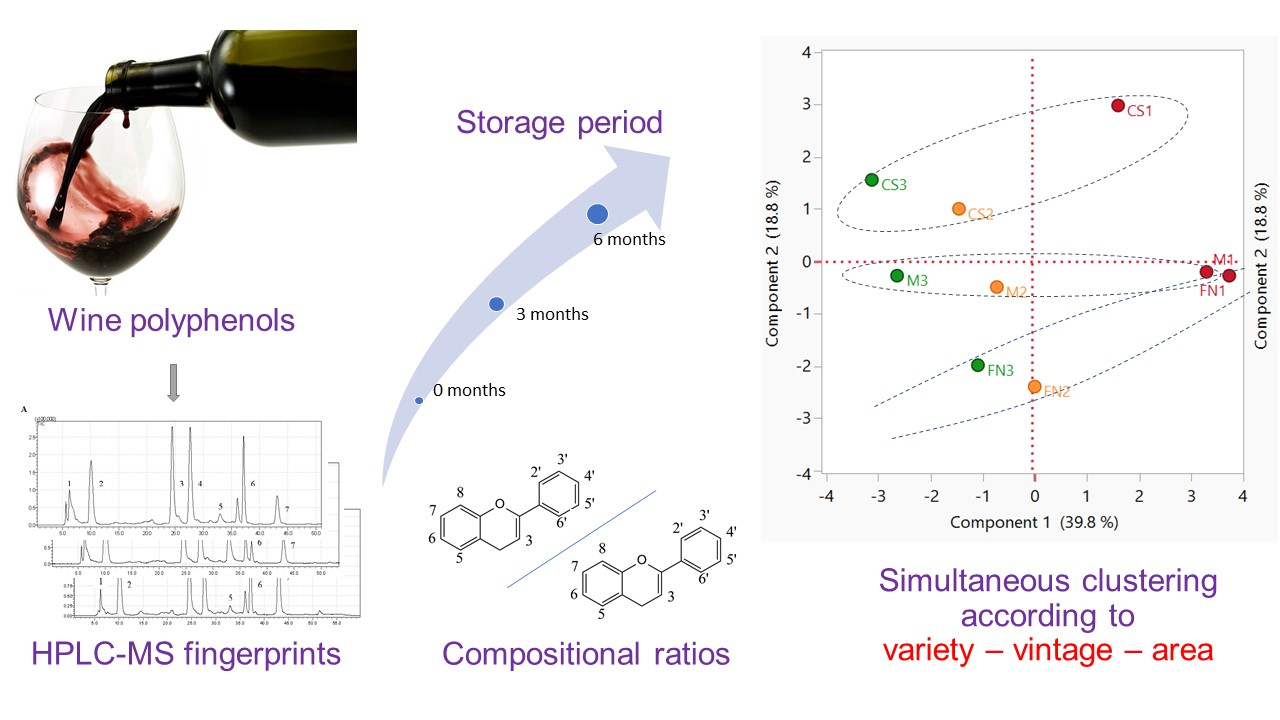
3.3. Chemometric Differentiation of Wine Samples after Vinification
3.4. Preliminary Assessment of Tentative Markers
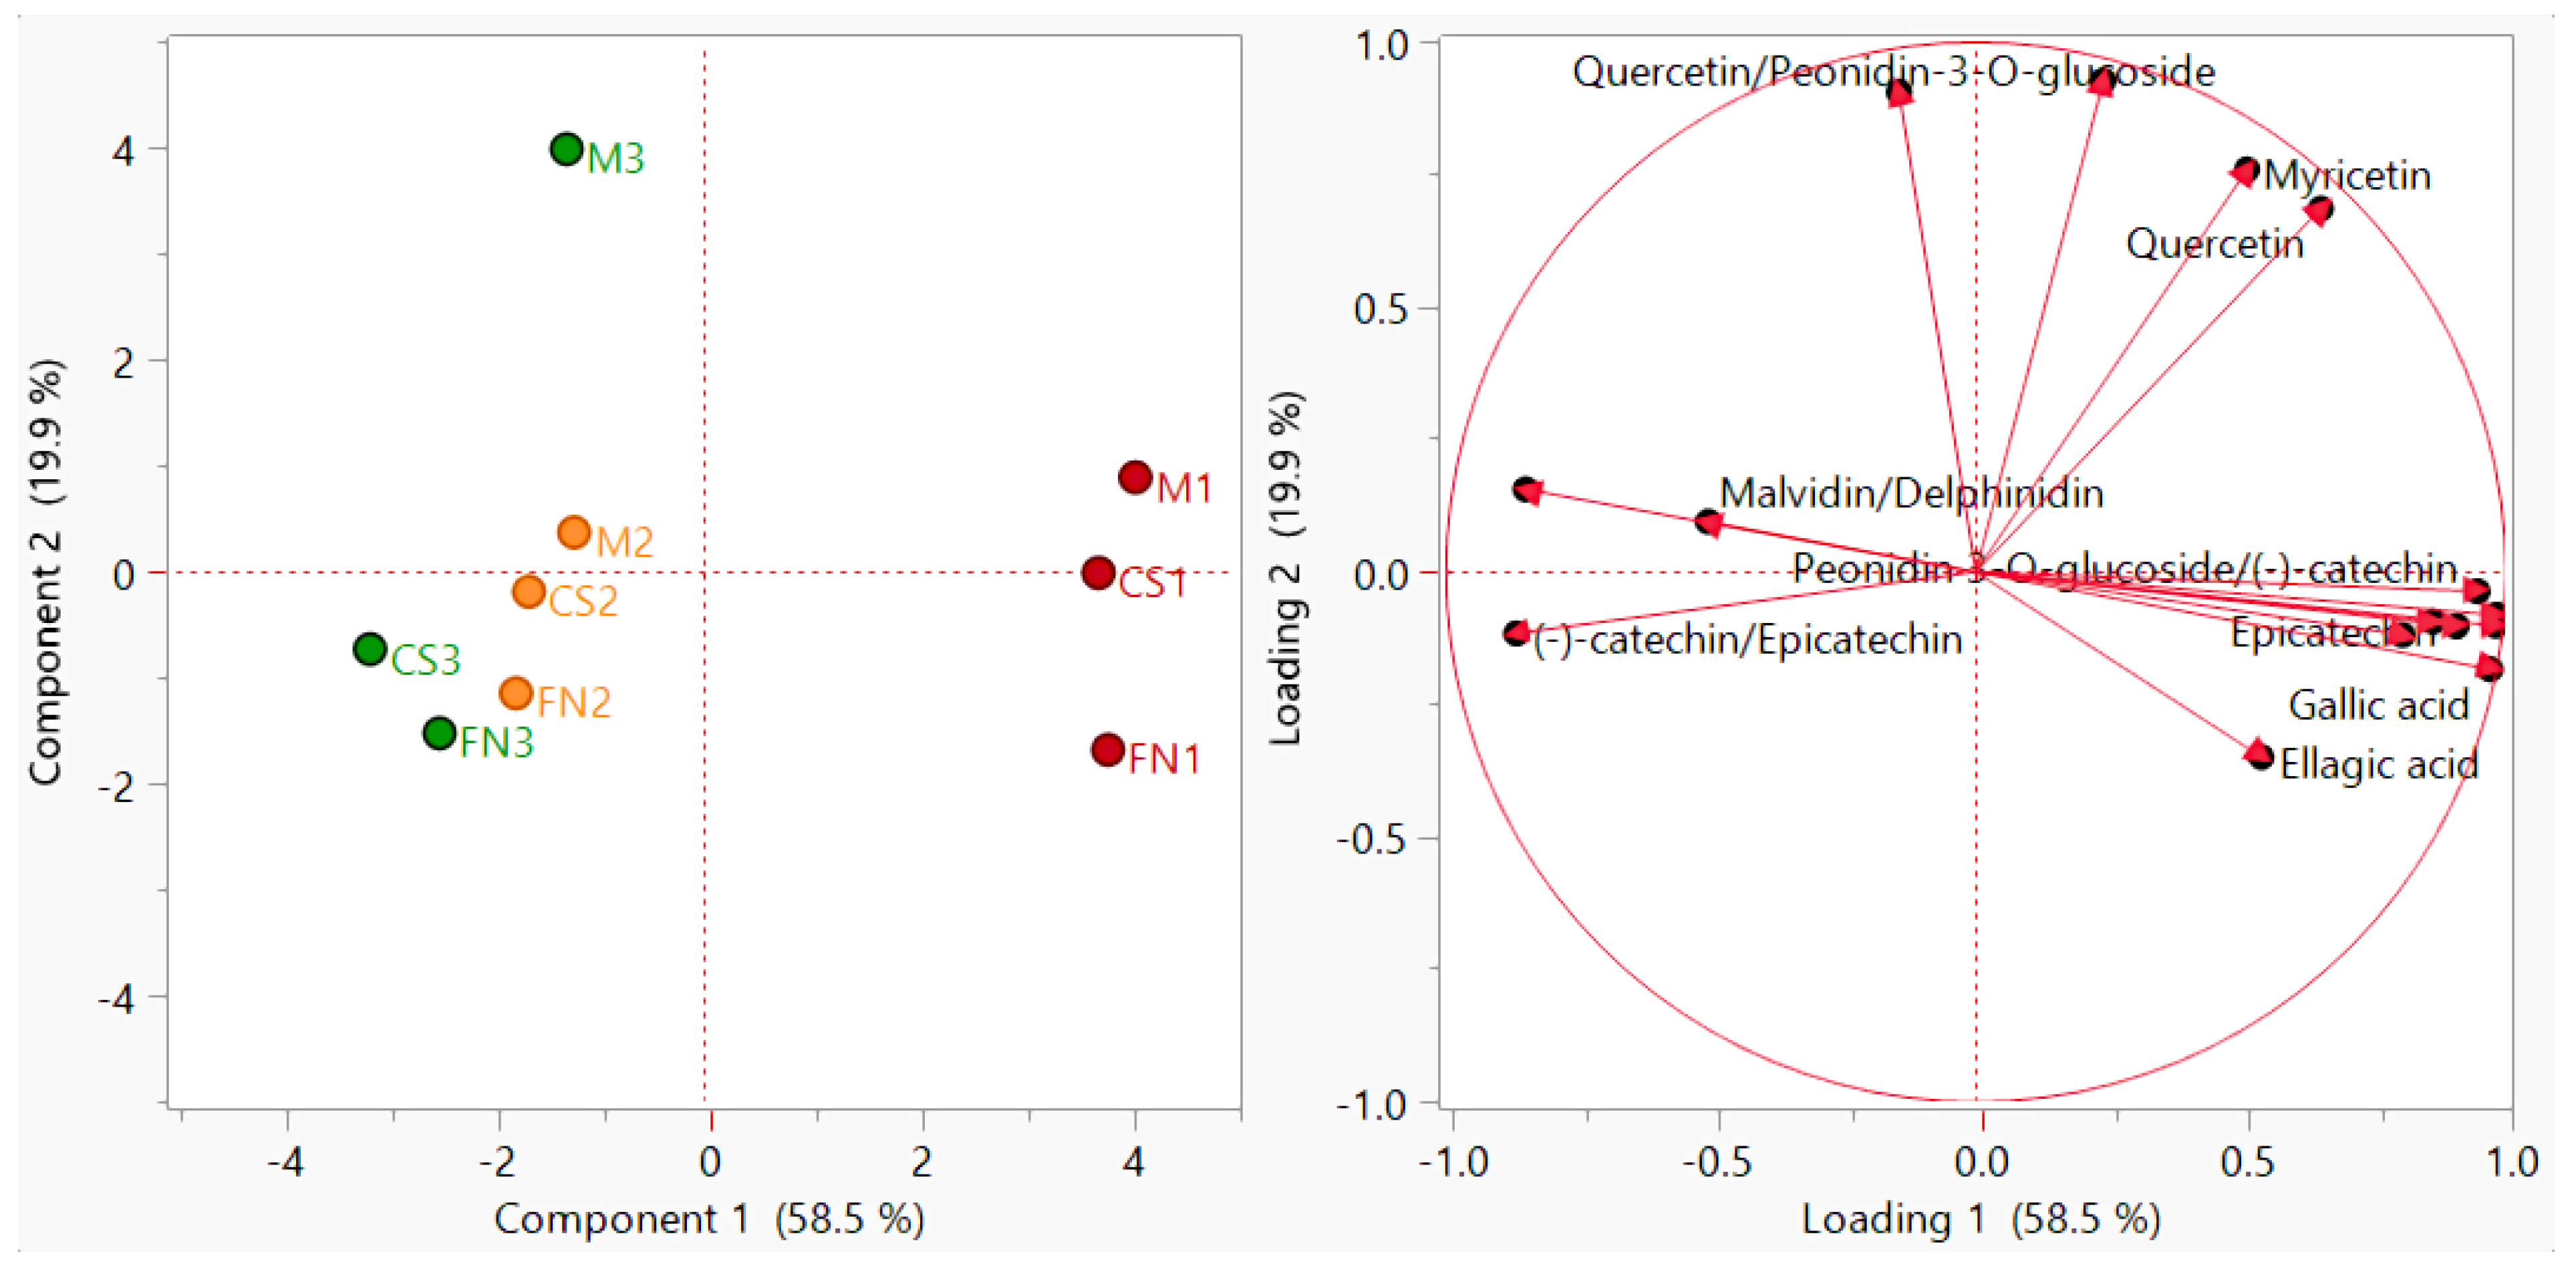
3.4.1. Ratios between Individual Polyphenol Concentrations
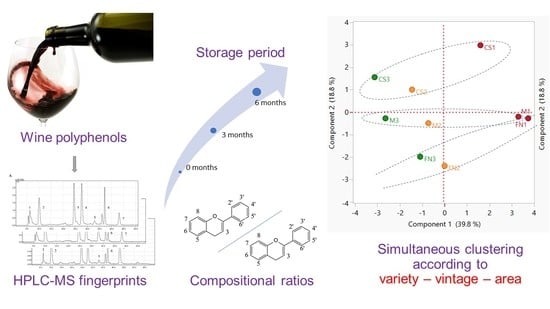
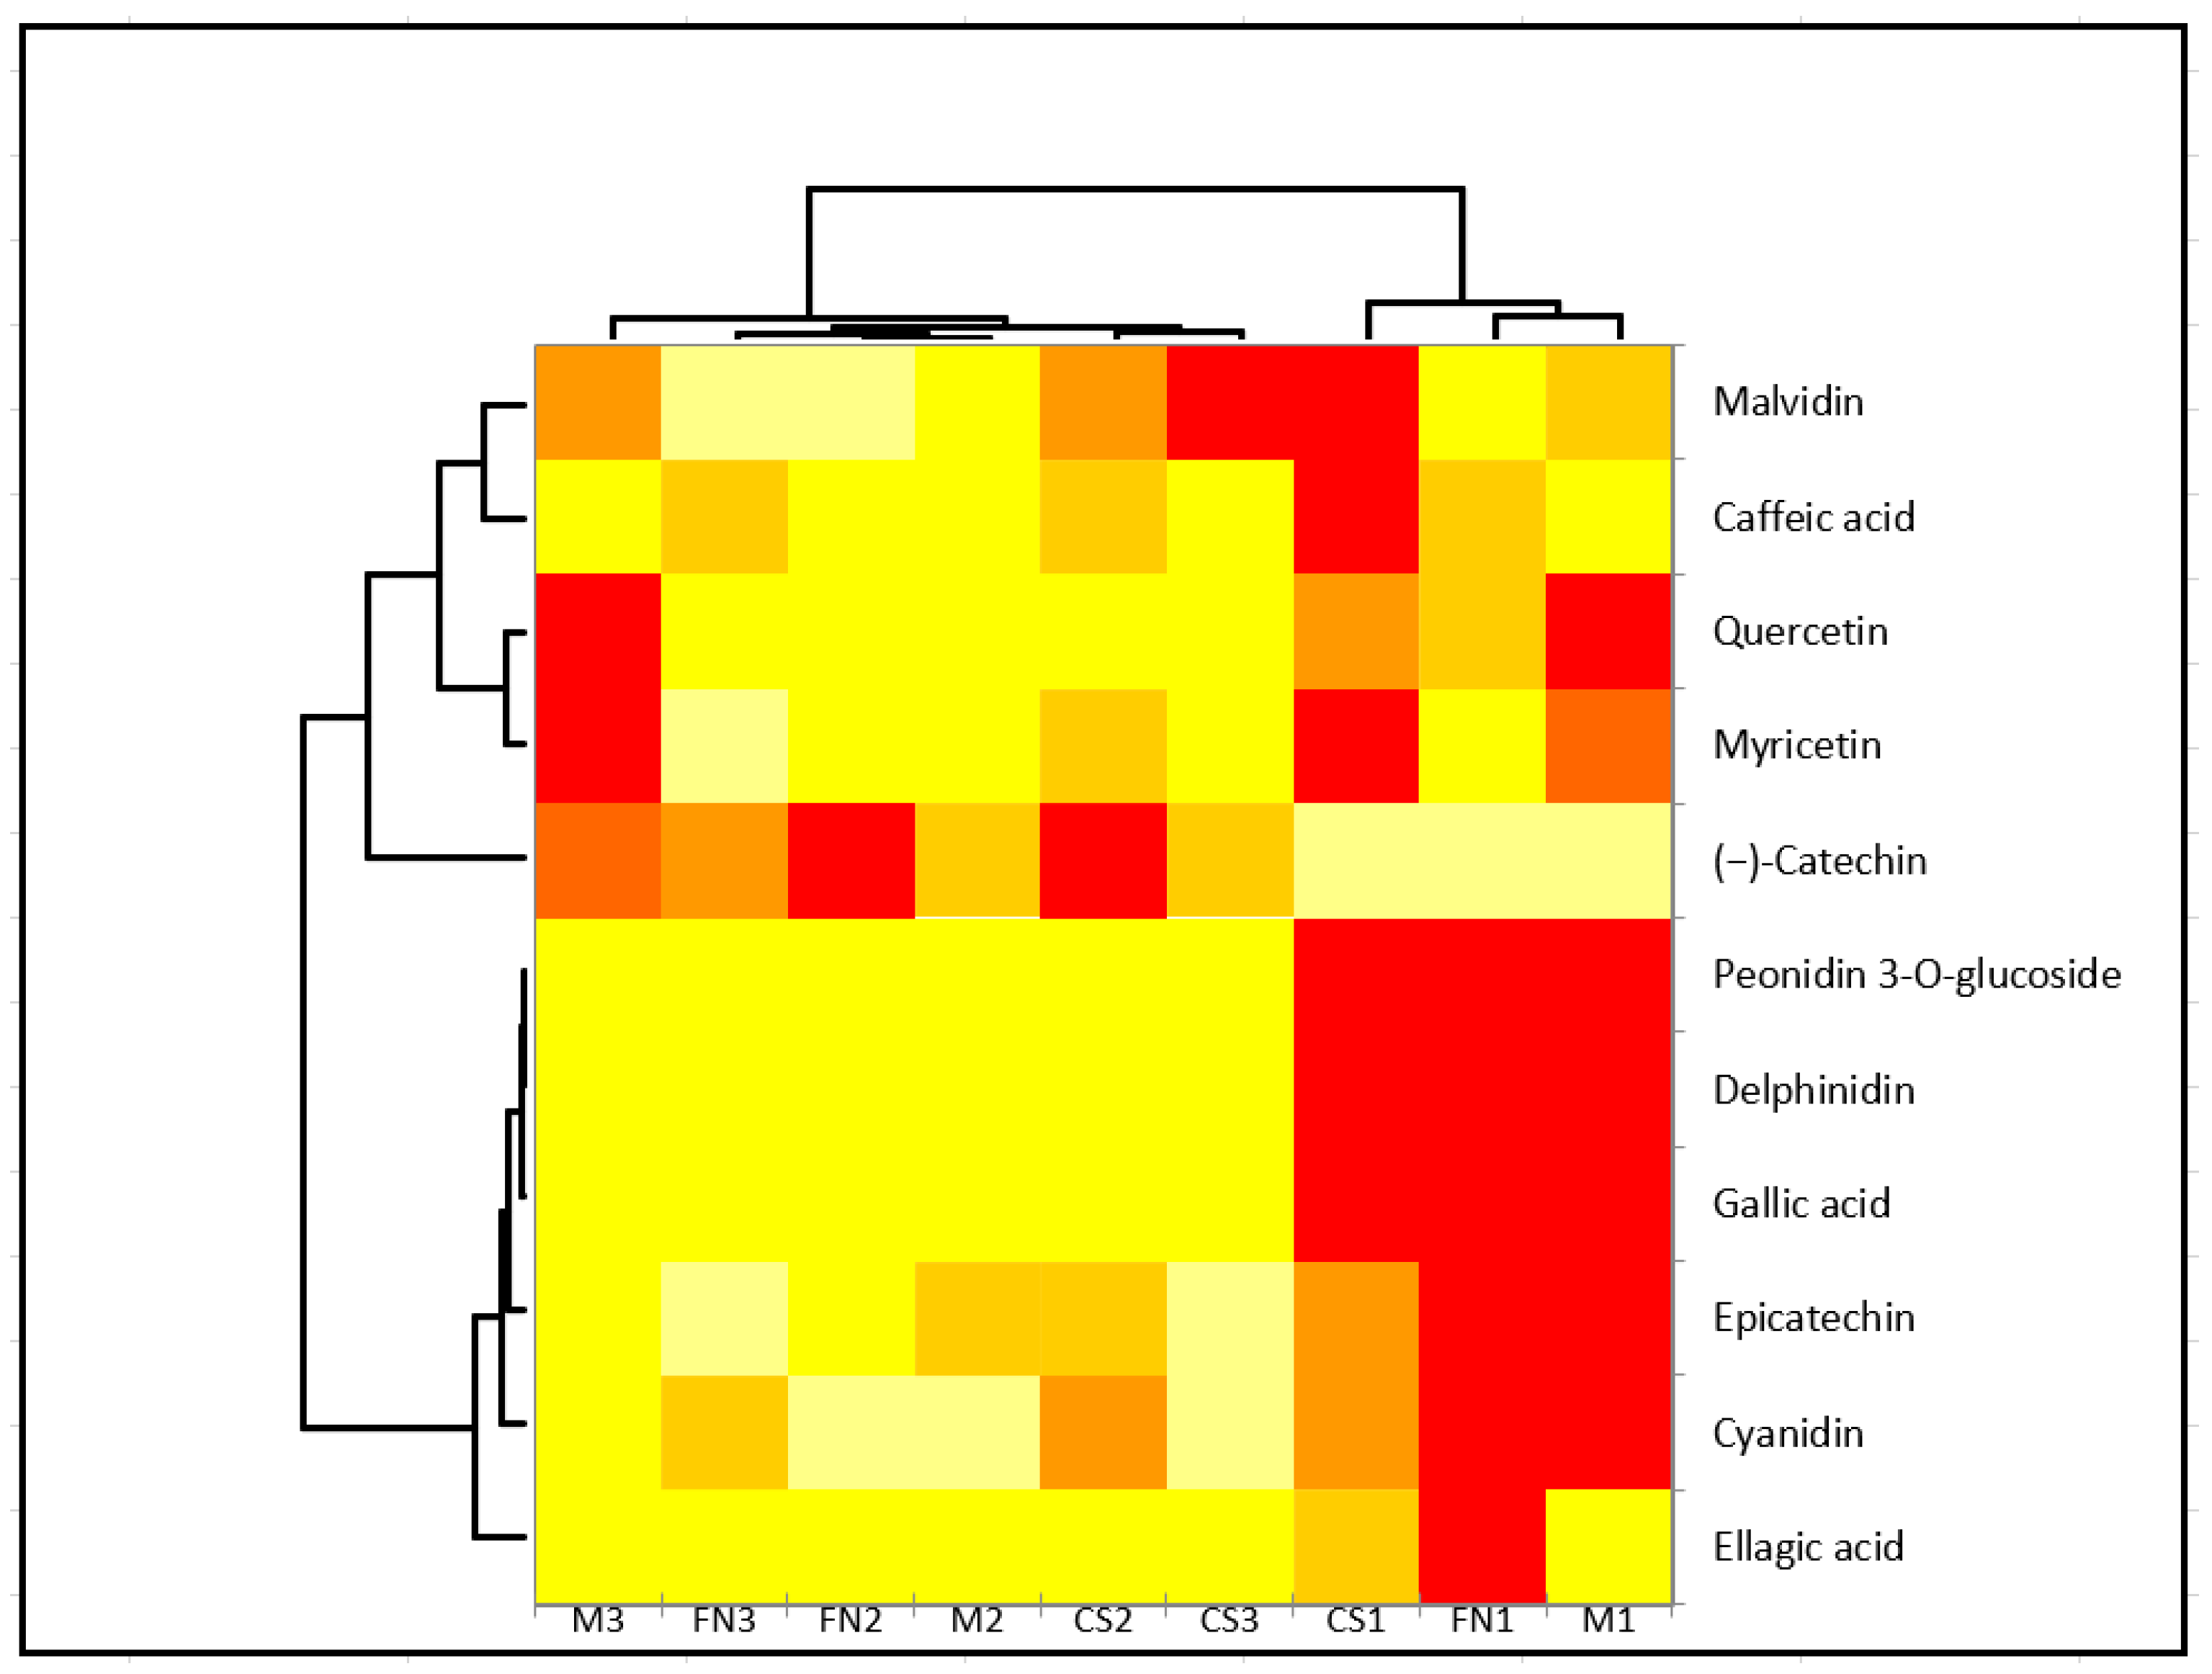
3.4.2. Fingerprinting Application of Proposed Polyphenol Markers during Storage
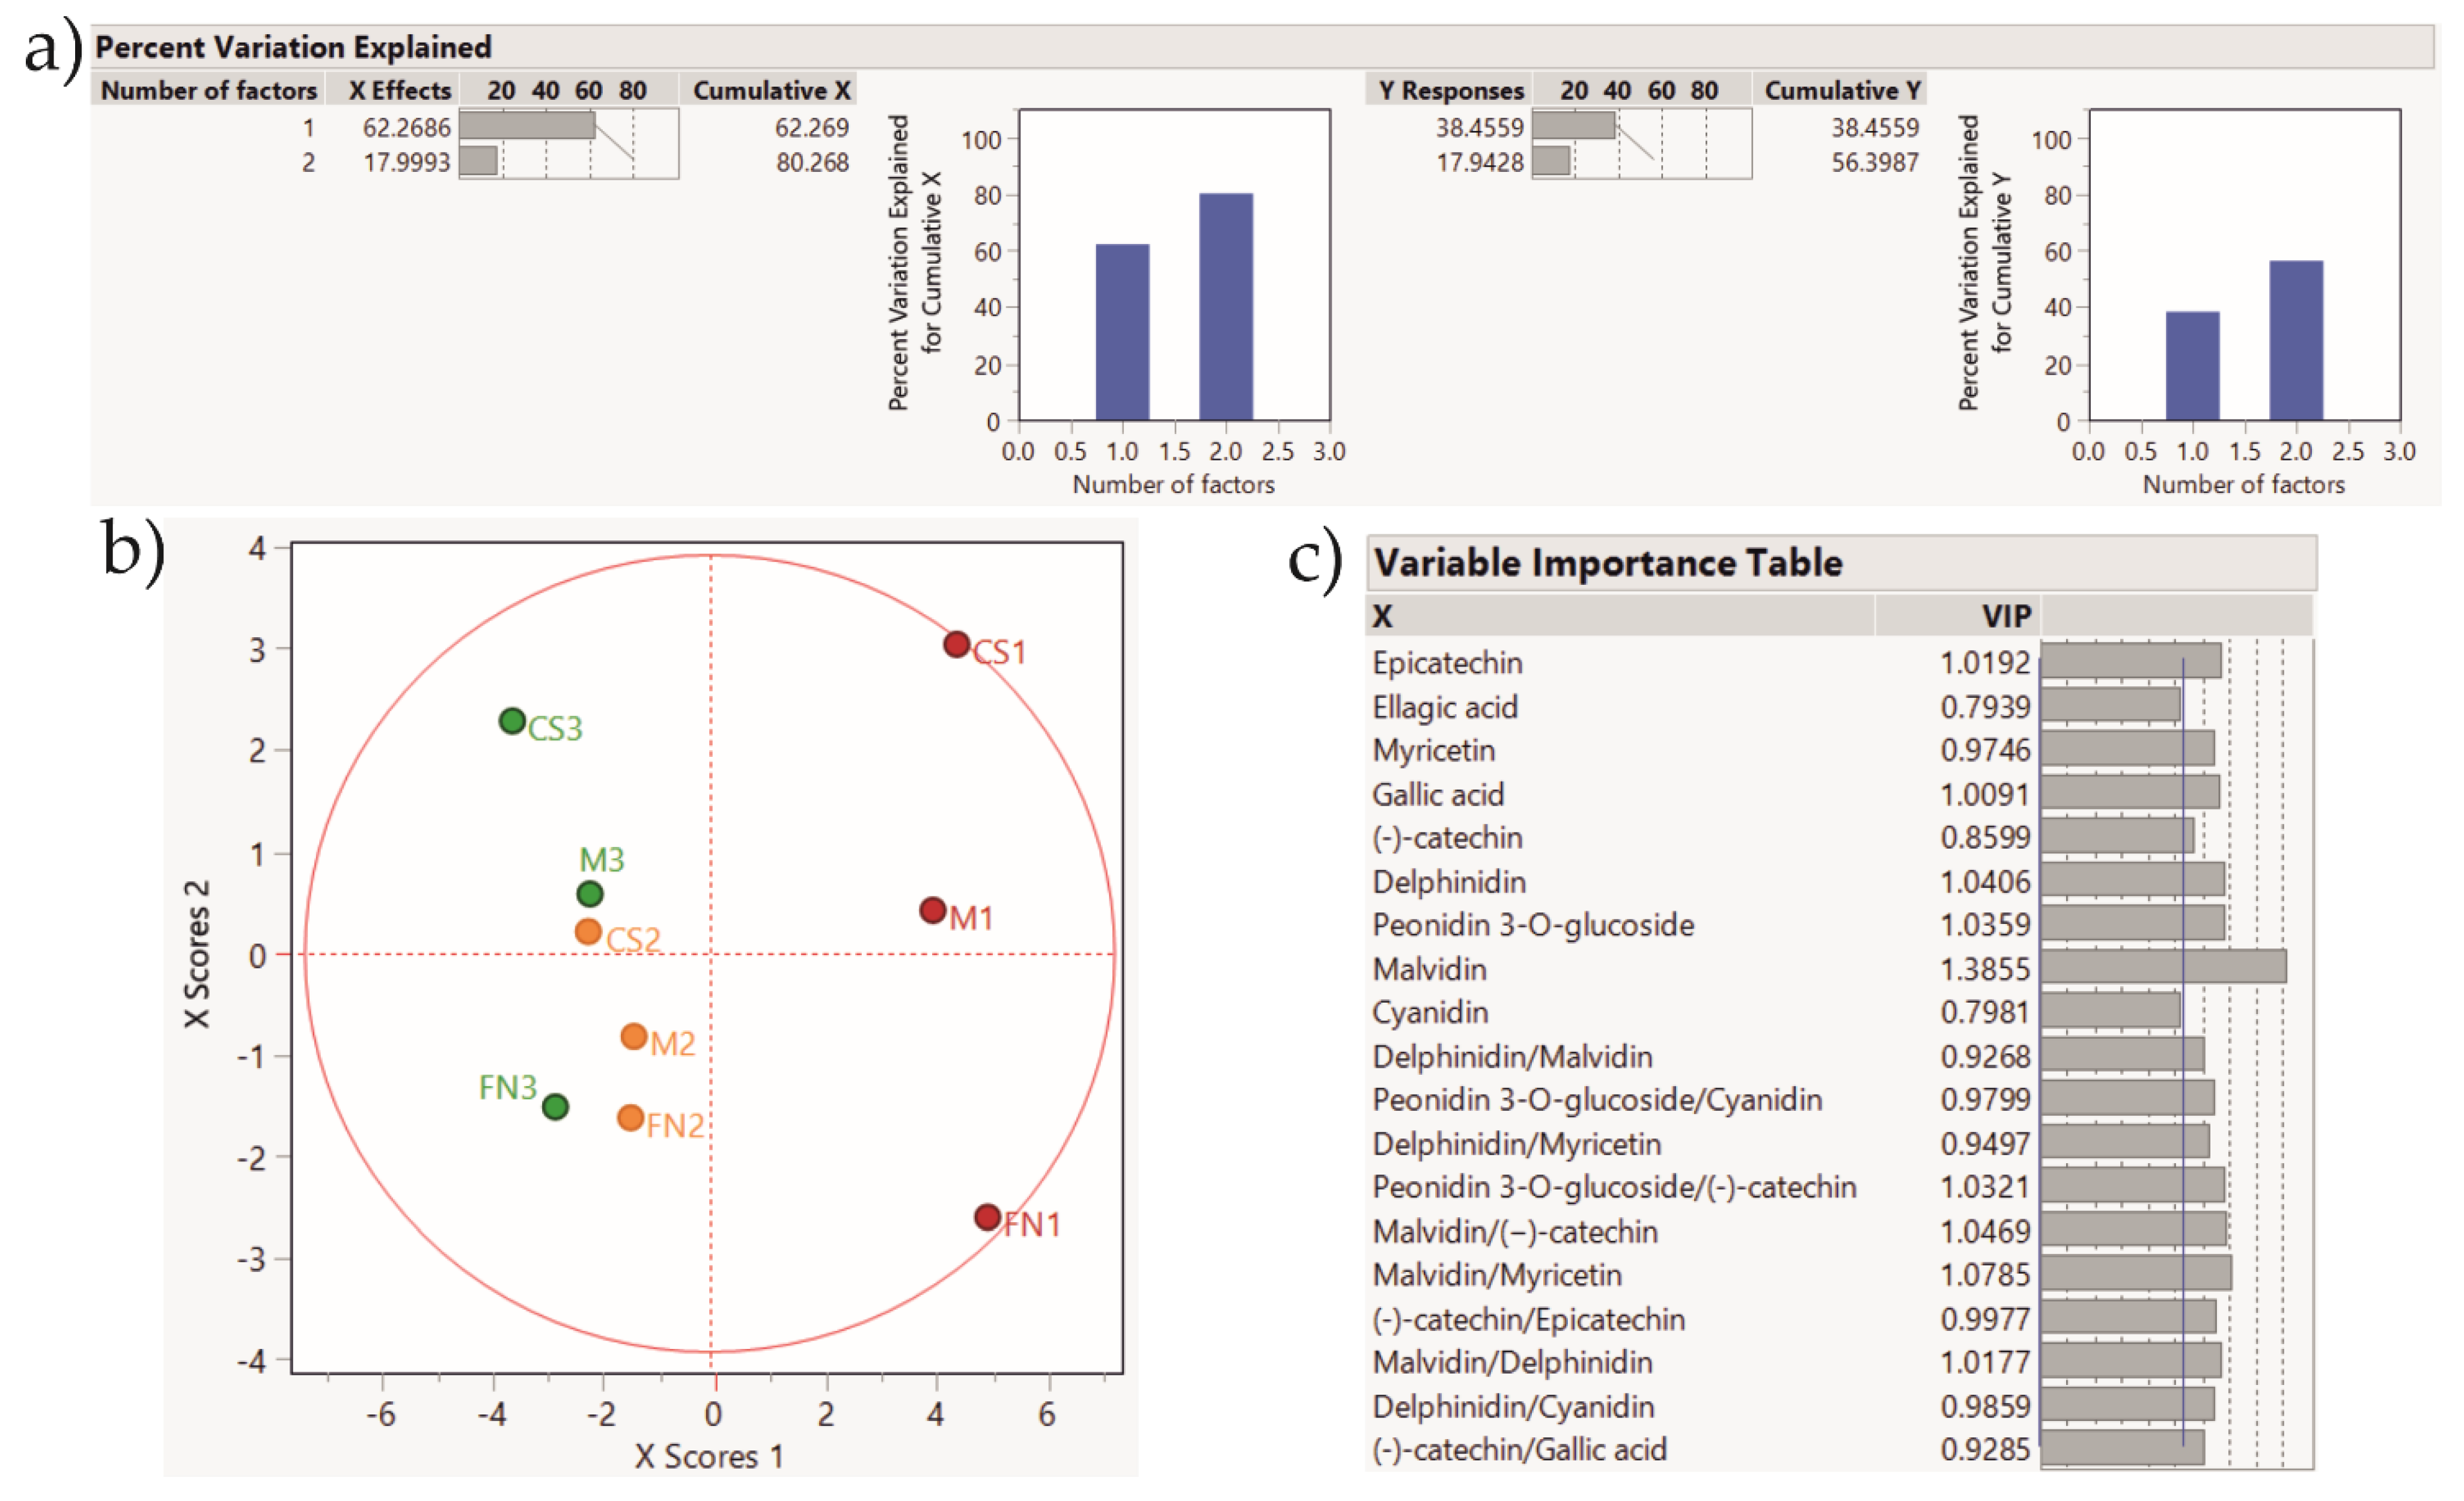
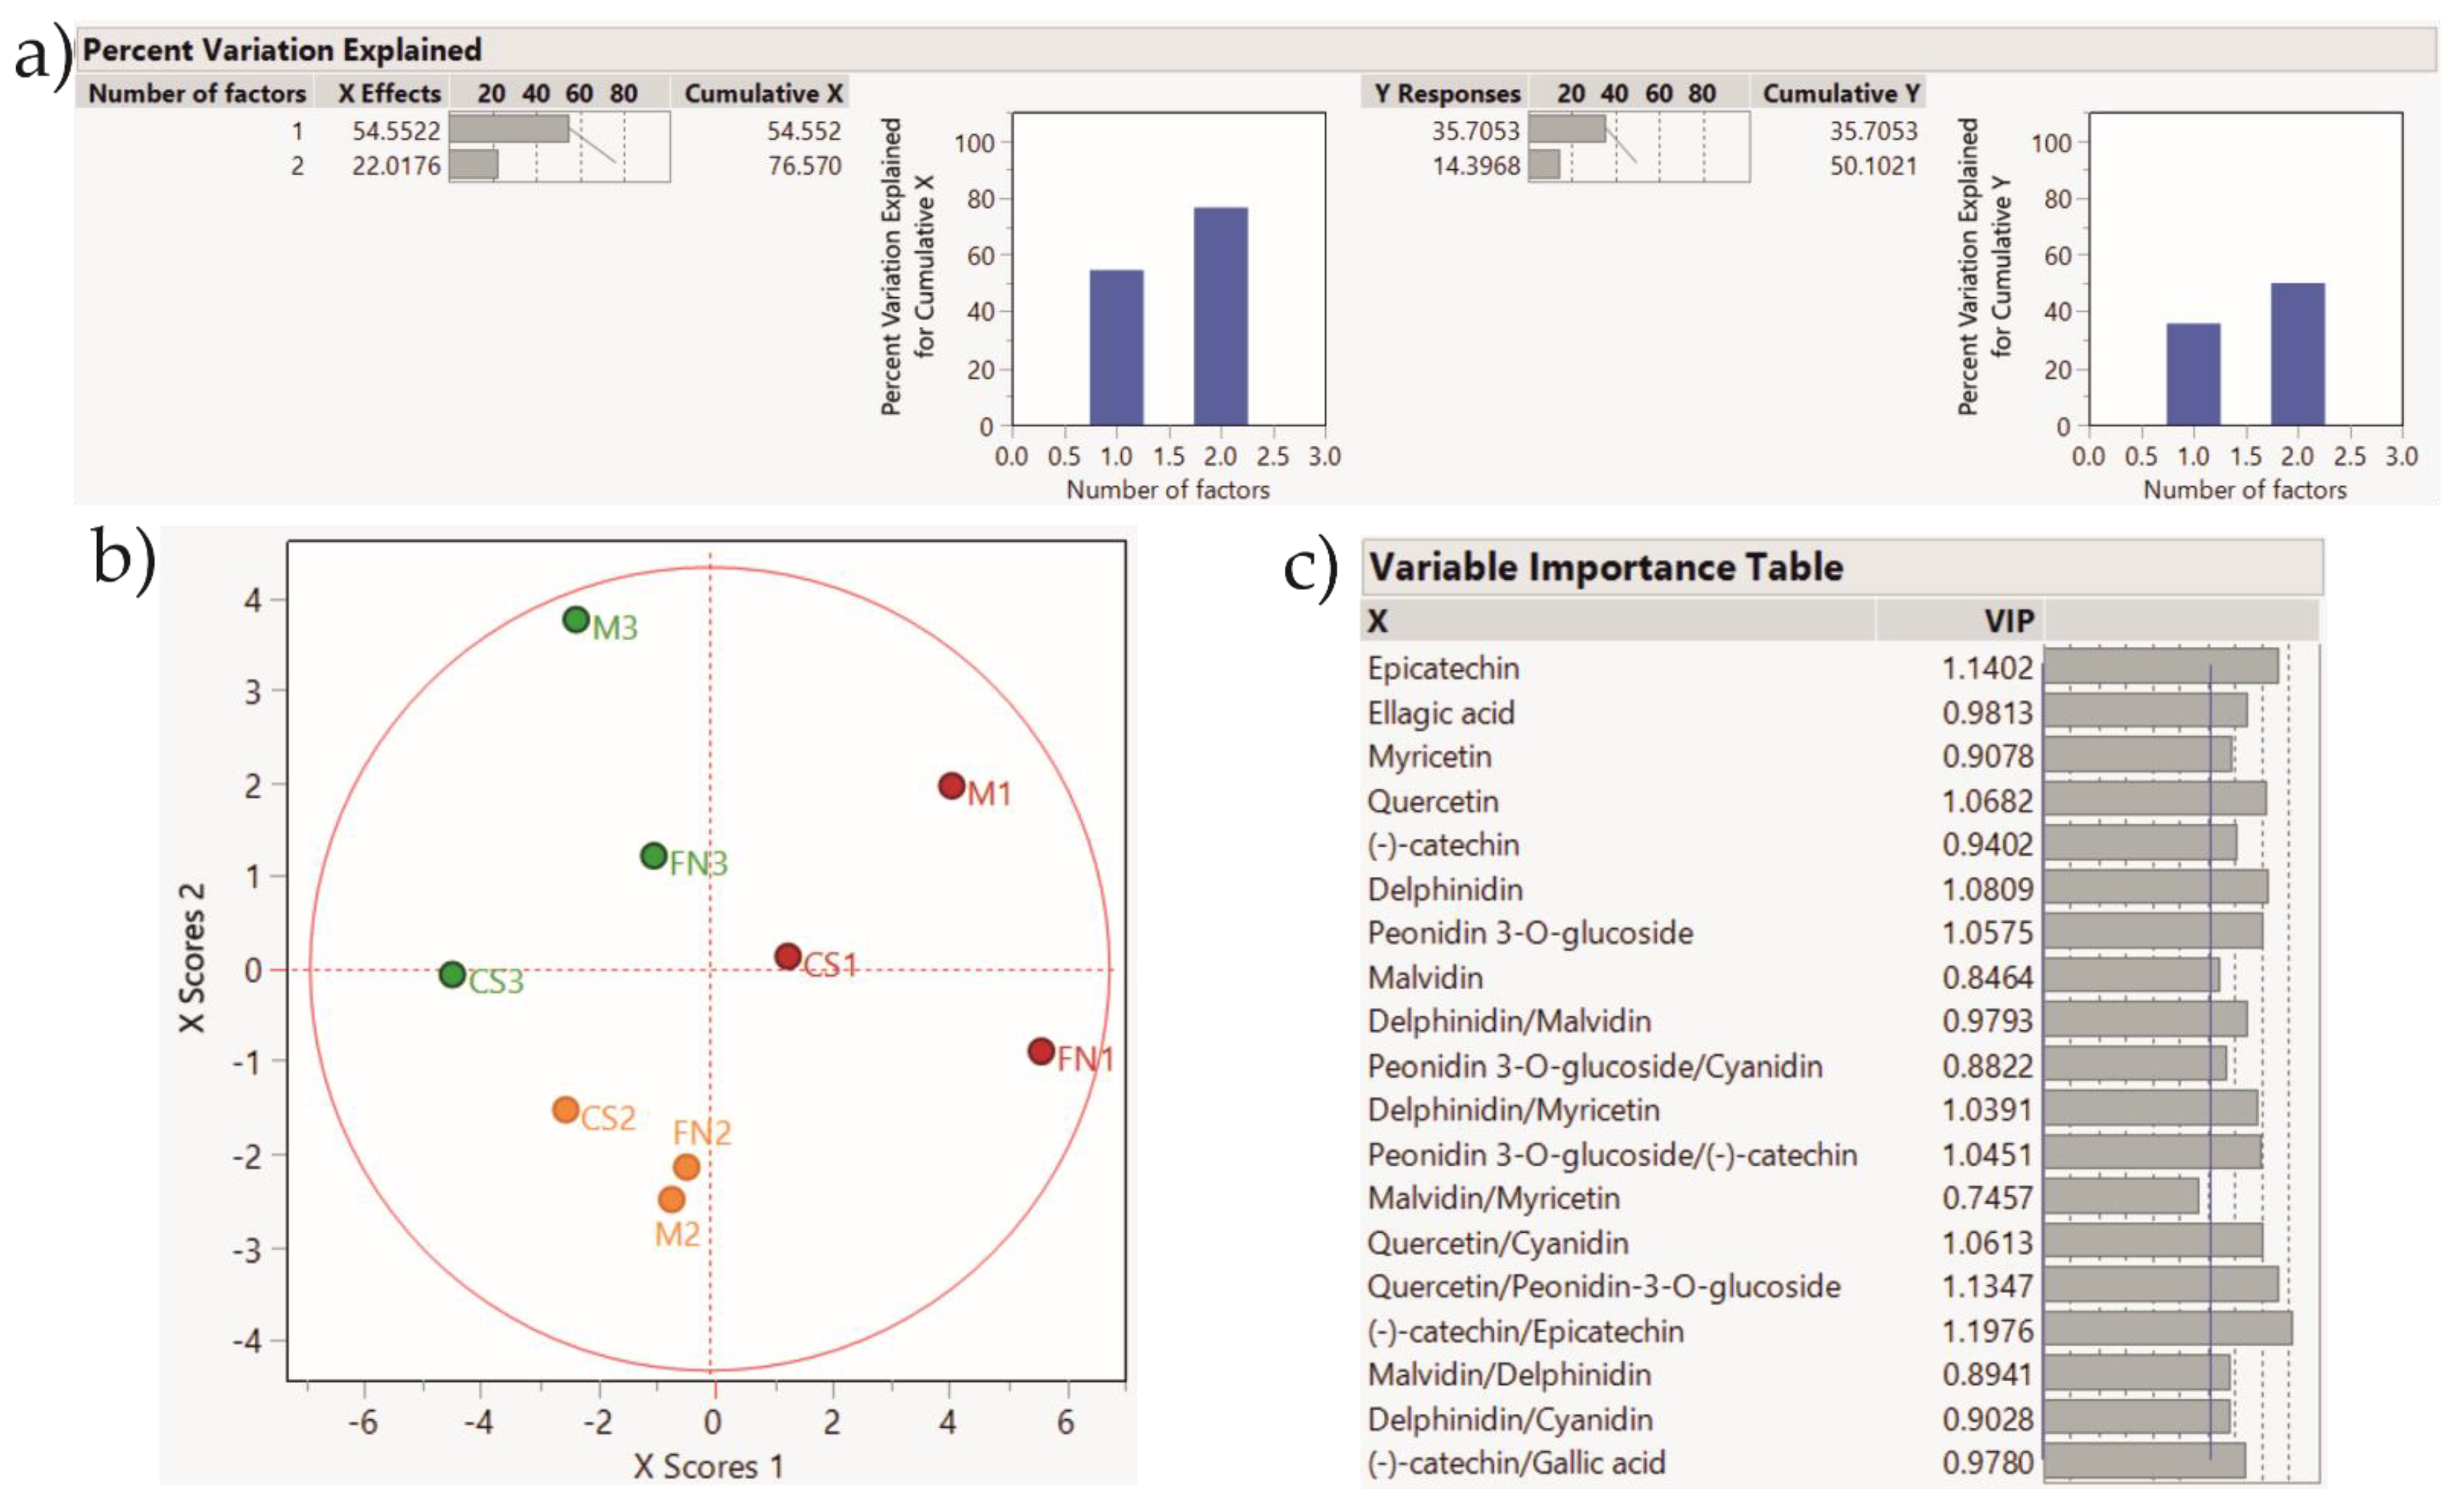
3.4.3. Classification Studies by PLS-DA
3.5. Study Limitations
4. Conclusions
Supplementary Materials
Author Contributions
Funding
Institutional Review Board Statement
Informed Consent Statement
Data Availability Statement
Acknowledgments
Conflicts of Interest
References
- Pavloušek, P.; Kumšta, M. Authentication of Riesling wines from the Czech Republic on the basis of the non-flavonoid phenolic compounds. Czech J. Food Sci. 2013, 31, 474–482. [Google Scholar] [CrossRef] [Green Version]
- Bonada, M.; Jeffery, D.; Petrie, P.; Moran, M.A.; Sadras, V. Impact of elevated temperature and water deficit on the chemical and sensory profiles of Barossa Shiraz grapes and wines. Aust. J. Grape Wine Res. 2015, 21, 240–253. [Google Scholar] [CrossRef]
- Palade, L.M.; Popa, M.E. Polyphenol Fingerprinting Approaches in Wine Traceability and Authenticity: Assessment and Implications of Red Wines. Beverages 2018, 4, 75. [Google Scholar] [CrossRef] [Green Version]
- Kamiloglu, S. Authenticity and traceability in beverages. Food Chem. 2019, 277, 12–24. [Google Scholar] [CrossRef]
- Wadood, S.A.; Boli, G.; Xiaowen, Z.; Hussain, I.; Yimin, W. Recent development in the application of analytical techniques for the traceability and authenticity of food of plant origin. Microchem. J. 2020, 152, 104295. [Google Scholar] [CrossRef]
- Tonietto, J.; Ruiz, V.S.; Zanus, M.C.; Montes, C. The Effect of Viticultural Climate on Red and White Wine Typicity. Characterization in Ibero-American grape-growing regions. Spécial Laccave J. Int. Sci. Vigne Vin 2014, 19–23. [Google Scholar]
- de Oliveira, J.B.; Egipto, R.; Laureano, O.; de Castro, R.; Pereira, G.E.; Ricardo-Da-Silva, J.M. Chemical composition and sensory profile of Syrah wines from semiarid tropical Brazil—Rootstock and harvest season effects. LWT 2019, 114, 108415. [Google Scholar] [CrossRef]
- Croitoru, C. Oenologie. Inovari si Noutati; Editura AGIR: Bucuresti, Romania, 2012; ISBN 978-973-720-463-9. [Google Scholar]
- Versari, A.; Laurie, F.; Ricci, A.; Laghi, L.; Parpinello, G.P. Progress in authentication, typification and traceability of grapes and wines by chemometric approaches. Food Res. Int. 2014, 60, 2–18. [Google Scholar] [CrossRef]
- Cravero, C.M. Wine Traceability. Beverages 2019, 5, 59. [Google Scholar] [CrossRef] [Green Version]
- Perini, M.; Strojnik, L.; Paolini, M.; Camin, F. Gas Chromatography Combustion Isotope Ratio Mass Spectrometry for Improving the Detection of Authenticity of Grape Must. J. Agric. Food Chem. 2020, 68, 3322–3329. [Google Scholar] [CrossRef] [PubMed]
- de Lima, C.M.; Fernandes, D.D.S.; Pereira, G.E.; Gomes, A.D.A.; de Araújo, M.C.U.; Diniz, P.H.G.D. Digital image-based tracing of geographic origin, winemaker, and grape type for red wine authentication. Food Chem. 2020, 312, 126060. [Google Scholar] [CrossRef]
- Sacchi, K.L.; Bisson, L.F.; Adams, D.O. A review of the effect of winemaking techniques on phenolic extraction in red wines. Am. J. Enol. Vitic. 2005, 56, 197–206. [Google Scholar]
- Di Paola-Naranjo, R.D.; Baroni, M.V.; Podio, N.S.; Rubinstein, H.R.; Fabani, M.P.; Badini, R.G.; Inga, M.; Ostera, H.A.; Cagnoni, M.; Gallegos, E.; et al. Fingerprints for Main Varieties of Argentinean Wines: Terroir Differentiation by Inorganic, Organic, and Stable Isotopic Analyses Coupled to Chemometrics. J. Agric. Food Chem. 2011, 59, 7854–7865. [Google Scholar] [CrossRef] [PubMed]
- Alecu, A.; Albu, C.; Litescu, S.C.; Eremia, S.A.V.; Radu, G.L. Phenolic and Anthocyanin Profile of Valea Calugareasca Red Wines by HPLC-PDA-MS and MALDI-TOF Analysis. Food Anal. Methods 2015, 9, 300–310. [Google Scholar] [CrossRef]
- Siracusa, L.; Ruberto, G. Plant Polyphenol Profiles as a Tool for Traceability and Valuable Support to Biodiversity. In Polyphenols in Plants: Isolation, Purification and Extract Preparation; Watson, R.R., Ed.; Academic Press: Cambridge, MA, USA, 2014; pp. 15–33. ISBN 9780123979346. [Google Scholar]
- Donno, D.; Boggia, R.; Zunin, P.; Cerutti, A.; Guido, M.; Mellano, M.G.; Prgomet, Z.; Beccaro, G.L. Phytochemical fingerprint and chemometrics for natural food preparation pattern recognition: An innovative technique in food supplement quality control. J. Food Sci. Technol. 2016, 53, 1071–1083. [Google Scholar] [CrossRef] [Green Version]
- Jackson, R. Grapevine Structure and Function. In Wine Science, 4th ed.; Academic Press: San Diego, CA, USA, 2014; pp. 69–141. ISBN 9780123814685. [Google Scholar]
- Lingua, M.S.; Fabani, M.; Wunderlin, D.A.; Baroni, M.V. From grape to wine: Changes in phenolic composition and its influence on antioxidant activity. Food Chem. 2016, 208, 228–238. [Google Scholar] [CrossRef] [PubMed]
- Teixeira, A.; Eiras-Dias, J.; Castellarin, S.D.; Gerós, H. Berry Phenolics of Grapevine under Challenging Environments. Int. J. Mol. Sci. 2013, 14, 18711–18739. [Google Scholar] [CrossRef] [PubMed] [Green Version]
- Degu, A.; Hochberg, U.; Sikron, N.; Venturini, L.; Buson, G.; Ghan, R.; Plaschkes, I.; Batushansky, A.; Chalifa-Caspi, V.; Mattivi, F.; et al. Metabolite and transcript profiling of berry skin during fruit development elucidates differential regulation between Cabernet Sauvignon and Shiraz cultivars at branching points in the polyphenol pathway. BMC Plant Biol. 2014, 14, 188. [Google Scholar] [CrossRef] [Green Version]
- Harrison, R. Practical interventions that influence the sensory attributes of red wines related to the phenolic composition of grapes: A review. Int. J. Food Sci. Technol. 2017, 53, 3–18. [Google Scholar] [CrossRef]
- Gambacorta, G.; Trani, A.; Fasciano, C.; Paradiso, V.M.; Faccia, M. Effects of prefermentative cold soak on polyphenols and volatiles of Aglianico, Primitivo and Nero di Troia red wines. Food Sci. Nutr. 2019, 7, 483–491. [Google Scholar] [CrossRef] [Green Version]
- Rousserie, P.; Rabot, A.; Geny-Denis, L. From Flavanols Biosynthesis to Wine Tannins: What Place for Grape Seeds? J. Agric. Food Chem. 2019, 67, 1325–1343. [Google Scholar] [CrossRef]
- Jackson, R. Vineyard Practice. In Wine Science, 4th ed.; Academic Press: San Diego, CA, USA, 2014; pp. 143–306. ISBN 9780123814685. [Google Scholar]
- de Freitas, V. Revisiting Wine Polyphenols Chemistry in Relation to Their Sensory Characteristics. In Recent Advances in Polyphenol Research; Halbwirth, H., Stich, K., Cheynier, V., Quideau, S., Eds.; Wiley Online Books: Hoboken, NJ, USA, 2019; pp. 263–284. ISBN 9781119427896. [Google Scholar]
- Li, S.-Y.; Duan, C.-Q. Astringency, bitterness and color changes in dry red wines before and during oak barrel aging: An updated phenolic perspective review. Crit. Rev. Food Sci. Nutr. 2019, 59, 1840–1867. [Google Scholar] [CrossRef]
- Santos, M.C.; Nunes, C.; Ferreira, A.S.; Jourdes, M.; Teissedre, P.-L.; Rodrigues, A.; Amado, O.; Saraiva, J.A.; Coimbra, M.A. Comparison of high pressure treatment with conventional red wine aging processes: Impact on phenolic composition. Food Res. Int. 2019, 116, 223–231. [Google Scholar] [CrossRef] [PubMed]
- Lerno, L.; Reichwage, M.; Ponangi, R.; Hearne, L.; Block, D.E.; Oberholster, A. Effects of Cap and Overall Fermentation Temperature on Phenolic Extraction in Cabernet Sauvignon Fermentations. Am. J. Enol. Vitic. 2015, 66, 444–453. [Google Scholar] [CrossRef]
- Setford, P.C.; Jeffery, D.W.; Grbin, P.R.; Muhlack, R.A. Factors affecting extraction and evolution of phenolic compounds during red wine maceration and the role of process modelling. Trends Food Sci. Technol. 2017, 69, 106–117. [Google Scholar] [CrossRef]
- Pérez-Navarro, J.; Romero, E.G.; Gómez-Alonso, S.; Cañas, P.M.I. Comparison between the phenolic composition of Petit Verdot wines elaborated at different maceration/fermentation temperatures. Int. J. Food Prop. 2018, 21, 996–1007. [Google Scholar] [CrossRef] [Green Version]
- Ortega-Regules, A.; Romero-Cascales, I.; López-Roca, J.M.; Ros-García, J.M.; Gómez-Plaza, E. Anthocyanin fingerprint of grapes: Environmental and genetic variations. J. Sci. Food Agric. 2006, 86, 1460–1467. [Google Scholar] [CrossRef]
- Mayr, C.M.; De Rosso, M.; Vedova, A.D.; Flamini, R. High-Resolution Mass Spectrometry Identification of Secondary Metabolites in Four Red Grape Varieties Potentially Useful as Traceability Markers of Wines. Beverages 2018, 4, 74. [Google Scholar] [CrossRef] [Green Version]
- Muccillo, L.; Gambuti, A.; Frusciante, L.; Iorizzo, M.; Moio, L.; Raieta, K.; Rinaldi, A.; Colantuoni, V.; Aversano, R. Biochemical features of native red wines and genetic diversity of the corresponding grape varieties from Campania region. Food Chem. 2014, 143, 506–513. [Google Scholar] [CrossRef] [Green Version]
- Bertacchini, L.; Cocchi, M.; Vigni, M.L.; Marchetti, A.; Salvatore, E.; Sighinolfi, S.; Silvestri, M.; Durante, C. The Impact of Chemometrics on Food Traceability. In Data Handling in Science and Technology; Elsevier: Amsterdam, The Netherlands, 2013; Volume 28, pp. 371–410. ISBN 0922-3487. [Google Scholar]
- Schlesier, K.; Fauhl-Hassek, C.; Forina, M.; Cotea, V.; Kocsi, E.; Schoula, R.; van Jaarsveld, F.; Wittkowski, R. Characterisation and determination of the geographical origin of wines. Part I: Overview. Eur. Food Res. Technol. 2009, 230, 1–13. [Google Scholar] [CrossRef]
- Römisch, U.; Jäger, H.; Capron, X.; Lanteri, S.; Forina, M.; Smeyers-Verbeke, J. Characterization and determination of the geographical origin of wines. Part III: Multivariate discrimination and classification methods. Eur. Food Res. Technol. 2009, 230, 31–45. [Google Scholar] [CrossRef]
- Merkytė, V.; Longo, E.; Windisch, G.; Boselli, E. Phenolic Compounds as Markers of Wine Quality and Authenticity. Foods 2020, 9, 1785. [Google Scholar] [CrossRef]
- Saurina, J. Characterization of wines using compositional profiles and chemometrics. TrAC Trends Anal. Chem. 2010, 29, 234–245. [Google Scholar] [CrossRef]
- Rubert, J.; Lacina, O.; Fauhl-Hassek, C.; Hajslova, J. Metabolic fingerprinting based on high-resolution tandem mass spectrometry: A reliable tool for wine authentication? Anal. Bioanal. Chem. 2014, 406, 6791–6803. [Google Scholar] [CrossRef]
- Jackson, R.S. Site Selection and Climate. In Wine Science, 4th ed.; Academic Press: San Diego, CA, USA, 2014; pp. 307–346. ISBN 9780123814685. [Google Scholar]
- Anesi, A.; Stocchero, M.; Santo, S.D.; Commisso, M.; Zenoni, S.; Ceoldo, S.; Tornielli, G.B.; Siebert, T.E.; Herderich, M.; Pezzotti, M.; et al. Towards a scientific interpretation of the terroir concept: Plasticity of the grape berry metabolome. BMC Plant Biol. 2015, 15, 191. [Google Scholar] [CrossRef] [Green Version]
- Villano, C.; Lisanti, M.T.; Gambuti, A.; Vecchio, R.; Moio, L.; Frusciante, L.; Aversano, R.; Carputo, D. Wine varietal authentication based on phenolics, volatiles and DNA markers: State of the art, perspectives and drawbacks. Food Control. 2017, 80, 1–10. [Google Scholar] [CrossRef]
- González-Neves, G.; Favre, G.; Gil, G.; Ferrer, M.; Charamelo, D. Effect of cold pre-fermentative maceration on the color and composition of young red wines cv. Tannat. J. Food Sci. Technol. 2014, 52, 3449–3457. [Google Scholar] [CrossRef] [Green Version]
- Vilanova, M.; Rodríguez, I.; Canosa, P.; Otero, I.; Gamero, E.; Moreno, D.; Talaverano, I.; Valdés, E. Variability in chemical composition of Vitis vinifera cv Mencía from different geographic areas and vintages in Ribeira Sacra (NW Spain). Food Chem. 2015, 169, 187–196. [Google Scholar] [CrossRef]
- Makris, D.P.; Kallithraka, S.; Mamalos, A. Differentiation of young red wines based on cultivar and geographical origin with application of chemometrics of principal polyphenolic constituents. Talanta 2006, 70, 1143–1152. [Google Scholar] [CrossRef] [PubMed]
- Radovanović, B.C.; Radovanović, A.N.; Souquet, J.-M. Phenolic profile and free radical-scavenging activity of Cabernet Sauvignon wines of different geographical origins from the Balkan region. J. Sci. Food Agric. 2010, 90, 2455–2461. [Google Scholar] [CrossRef] [PubMed]
- Kallithraka, S.; Tsoutsouras, E.; Tzourou, E.; Lanaridis, P. Principal phenolic compounds in Greek red wines. Food Chem. 2006, 99, 784–793. [Google Scholar] [CrossRef]
- Jaitz, L.; Siegl, K.; Eder, R.; Rak, G.; Abranko, L.; Koellensperger, G.; Hann, S. LC–MS/MS analysis of phenols for classification of red wine according to geographic origin, grape variety and vintage. Food Chem. 2010, 122, 366–372. [Google Scholar] [CrossRef]
- Salvatore, E.; Cocchi, M.; Marchetti, A.; Marini, F.; de Juan, A. Determination of phenolic compounds and authentication of PDO Lambrusco wines by HPLC-DAD and chemometric techniques. Anal. Chim. Acta 2013, 761, 34–45. [Google Scholar] [CrossRef]
- Wu, Q.; Gu, H.-W.; Yin, X.-L.; Zhou, H.-H.; Chang, H.-Y.; Shi, J.; Chen, Y.; Yan, X.-F.; Liu, Z. Development of an HPLC-DAD Method Combined with Chemometrics for Differentiating Geographical Origins of Chinese Red Wines on the Basis of Phenolic Compounds. Food Anal. Methods 2021, 14, 1895–1907. [Google Scholar] [CrossRef]
- Pisano, P.L.; Silva, M.F.; Olivieri, A.C. Anthocyanins as markers for the classification of Argentinean wines according to botanical and geographical origin. Chemometric modeling of liquid chromatography–mass spectrometry data. Food Chem. 2015, 175, 174–180. [Google Scholar] [CrossRef] [PubMed]
- Cozzolino, D. Metabolomics in Grape and Wine: Definition, Current Status and Future Prospects. Food Anal. Methods 2016, 9, 2986–2997. [Google Scholar] [CrossRef]
- Aleixandre-Tudo, J.L.; Nieuwoudt, H.; Olivieri, A.; Aleixandre, J.L.; du Toit, W. Phenolic profiling of grapes, fermenting samples and wines using UV-Visible spectroscopy with chemometrics. Food Control 2018, 85, 11–22. [Google Scholar] [CrossRef]
- Albu, C.; Eremia, S.A.V.; Penu, R.; Vasilescu, I.; Litescu, S.C.; Radu, G.L. Characterization of the Phenolics and Free Radical Scavenging of Romanian Red Wine. Anal. Lett. 2017, 50, 591–606. [Google Scholar] [CrossRef]
- Favre, G.; Hermosín-Gutiérrez, I.; Piccardo, D.; Gómez-Alonso, S.; González-Neves, G. Selectivity of pigments extraction from grapes and their partial retention in the pomace during red-winemaking. Food Chem. 2019, 277, 391–397. [Google Scholar] [CrossRef]
- Piccardo, D.; González-Neves, G.; Favre, G.; Pascual, O.; Canals, J.M.; Zamora, F. Impact of Must Replacement and Hot Pre-Fermentative Maceration on the Color of Uruguayan Tannat Red Wines. Fermentation 2019, 5, 80. [Google Scholar] [CrossRef] [Green Version]
- Arcena, M.R.; Kebede, B.; Leong, S.Y.; Silcock, P.; Oey, I. Feasibility of using integrated fingerprinting, profiling and chemometrics approach to understand (bio) chemical changes throughout commercial red winemaking: A case study on Merlot. Food Res. Int. 2020, 127, 108767. [Google Scholar] [CrossRef]
- Rentzsch, M.; Wilkens, A.; Winterhalter, P. Non-flavonoid Phenolic Compounds. In Wine Chemistry and Biochemistry; Moreno-Arribas, M.V., Polo, M.C., Eds.; Springer: New York, NY, USA, 2008; pp. 509–527. ISBN 978-0-387-74118-5. [Google Scholar]
- García-Beneytez, E.; Revilla, E.; Cabello, F. Anthocyanin pattern of several red grape cultivars and wines made from them. Eur. Food Res. Technol. 2002, 215, 32–37. [Google Scholar] [CrossRef]
- Mattivi, F.; Guzzon, R.; Vrhovsek, U.; Stefanini, A.M.; Velasco, R. Metabolite Profiling of Grape: Flavonols and Anthocyanins. J. Agric. Food Chem. 2006, 54, 7692–7702. [Google Scholar] [CrossRef] [PubMed]
- Costa, E.; Cosme, F.; Jordão, A.M.; Mendes-Faia, A. Anthocyanin profile and antioxidant activity from 24 grape varieties cultivated in two Portuguese wine regions. OENO One 2014, 48, 51–62. [Google Scholar] [CrossRef]
- Kyraleou, M.; Kallithraka, S.; Gkanidi, E.; Koundouras, S.; Mannion, D.T.; Kilcawley, K.N. Discrimination of five Greek red grape varieties according to the anthocyanin and proanthocyanidin profiles of their skins and seeds. J. Food Compos. Anal. 2020, 92, 103547. [Google Scholar] [CrossRef]
- Jackson, R. Post-Fermentation Treatments and Related Topics. In Wine Science, 4th ed.; Academic Press: San Diego, CA, USA, 2014; pp. 535–676. ISBN 9780123814685. [Google Scholar]
- Zhang, B.; He, F.; Zhou, P.-P.; Liu, Y.; Duan, C.-Q. Copigmentation between malvidin-3-O-glucoside and hydroxycinnamic acids in red wine model solutions: Investigations with experimental and theoretical methods. Food Res. Int. 2015, 78, 313–320. [Google Scholar] [CrossRef]
- He, F.; Liang, N.-N.; Mu, L.; Pan, Q.-H.; Wang, J.; Reeves, M.J.; Duan, C.-Q. Anthocyanins and Their Variation in Red Wines I. Monomeric Anthocyanins and Their Color Expression. Molecules 2012, 17, 1571–1601. [Google Scholar] [CrossRef] [Green Version]
- Garrido, J.; Borges, F. Wine and grape polyphenols—A chemical perspective. Food Res. Int. 2013, 54, 1844–1858. [Google Scholar] [CrossRef] [Green Version]
- Blanco-Vega, D.; Gómez-Alonso, S.; Hermosín-Gutiérrez, I. Identification, content and distribution of anthocyanins and low molecular weight anthocyanin-derived pigments in Spanish commercial red wines. Food Chem. 2014, 158, 449–458. [Google Scholar] [CrossRef]
- Marquez, A.; Serratosa, M.P.; Merida, J. Influence of bottle storage time on colour, phenolic composition and sensory properties of sweet red wines. Food Chem. 2014, 146, 507–514. [Google Scholar] [CrossRef] [PubMed]
- Kumšta, M.; Pavloušek, P.; Kárník, P. Use of Anthocyanin Profiles When Differentiating Individual Varietal Wines and Terroirs. Food Technol. Biotechnol. 2014, 52, 383–390. [Google Scholar] [CrossRef]
- Malacarne, M.; Nardin, T.; Bertoldi, D.; Nicolini, G.; Larcher, R. Verifying the botanical authenticity of commercial tannins through sugars and simple phenols profiles. Food Chem. 2016, 206, 274–283. [Google Scholar] [CrossRef]
- Figueiredo-González, M.; Martínez-Carballo, E.; Cancho-Grande, B.; Santiago, J.; Martínez, M.; Simal-Gándara, J. Pattern recognition of three Vitis vinifera L. red grapes varieties based on anthocyanin and flavonol profiles, with correlations between their biosynthesis pathways. Food Chem. 2012, 130, 9–19. [Google Scholar] [CrossRef]
- Díaz, R.; Gallart-Ayala, H.; Sancho, J.V.; Nuñez, O.; Zamora, T.; Martins, C.P.; Hernandez, F.; Hernández-Cassou, S.; Saurina, J.; Checa, A. Told through the wine: A liquid chromatography–mass spectrometry interplatform comparison reveals the influence of the global approach on the final annotated metabolites in non-targeted metabolomics. J. Chromatogr. A 2016, 1433, 90–97. [Google Scholar] [CrossRef] [PubMed] [Green Version]
- Flamini, R.; Mattivi, F.; De Rosso, M.; Arapitsas, P.; Bavaresco, L. Advanced Knowledge of Three Important Classes of Grape Phenolics: Anthocyanins, Stilbenes and Flavonols. Int. J. Mol. Sci. 2013, 14, 19651–19669. [Google Scholar] [CrossRef] [PubMed]
- Terrier, N.; Poncet-Legrand, C.; Cheynier, V. Flavanols, Flavonols and Dihydroflavonols. In Wine Chemistry and Biochemistry; Moreno-Arribas, M.V., Polo, M.C., Eds.; Springer: New York, NY, USA, 2009; pp. 463–507. ISBN 9780387741161. [Google Scholar]
- Moreno, J.; Peinado, R. Polyphenols. In Enological Chemistry; Elsevier: Amsterdam, The Netherlands, 2012; pp. 53–76. ISBN 9780123884381. [Google Scholar]
- Castellarin, S.; Bavaresco, L.; Falginella, L.; Goncalves, M.; Di Gaspero, G. Phenolics in Grape Berry and Key Antioxidants. In The Biochemistry of the Grape Berry; Geros, H., Chaves, M.M., Delrot, S., Eds.; Bentham Science Publishers: Sharja, United Arab Emirates, 2012; pp. 89–110. [Google Scholar]
- Geana, E.-I.; Popescu, R.; Costinel, D.; (Dinca), O.R.B.; Stefanescu, I.; Ionete, R.E.; Bala, C. Verifying the red wines adulteration through isotopic and chromatographic investigations coupled with multivariate statistic interpretation of the data. Food Control 2016, 62, 1–9. [Google Scholar] [CrossRef]
- Fabani, M.; Ravera, M.J.; Wunderlin, D.A. Markers of typical red wine varieties from the Valley of Tulum (San Juan-Argentina) based on VOCs profile and chemometrics. Food Chem. 2013, 141, 1055–1062. [Google Scholar] [CrossRef]
- Ferreira, V.; Fernandes, F.; Pinto-Carnide, O.; Valentão, P.; Falco, V.; Martín, J.P.; Ortiz, J.M.; Arroyo-Garcia, R.; Andrade, P.B.; Castro, I. Identification of Vitis vinifera L. grape berry skin color mutants and polyphenolic profile. Food Chem. 2016, 194, 117–127. [Google Scholar] [CrossRef]
- Avizcuri, J.-M.; Saenz-Navajas, M.-P.; Echavarri, J.F.; Ferreira, V.; Fernández-Zurbano, P. Evaluation of the impact of initial red wine composition on changes in color and anthocyanin content during bottle storage. Food Chem. 2016, 213, 123–134. [Google Scholar] [CrossRef] [Green Version]
- Carrascón, V.; Vallverdu-Queralt, A.; Meudec, E.; Sommerer, N.; Fernandez-Zurbano, P.; Ferreira, V. The kinetics of oxygen and SO2 consumption by red wines. What do they tell about oxidation mechanisms and about changes in wine composition? Food Chem. 2018, 241, 206–214. [Google Scholar] [CrossRef] [PubMed] [Green Version]
- Puértolas, E.; Saldaña, G.; Condón, S.; Alvarez, I.; Raso, J. Evolution of polyphenolic compounds in red wine from Cabernet Sauvignon grapes processed by pulsed electric fields during aging in bottle. Food Chem. 2010, 119, 1063–1070. [Google Scholar] [CrossRef]
- Quaglieri, C.; Prieto-Perea, N.; Berrueta, L.A.; Gallo, B.; Rasines-Perea, Z.; Jourdes, M.; Teissedre, P.-L. Comparison of Aquitaine and Rioja Red Wines: Characterization of Their Phenolic Composition and Evolution from 2000 to 2013. Molecules 2017, 22, 192. [Google Scholar] [CrossRef] [PubMed] [Green Version]
- Bellomarino, S.; Conlan, X.; Parker, R.; Barnett, N.; Adams, M. Geographical classification of some Australian wines by discriminant analysis using HPLC with UV and chemiluminescence detection. Talanta 2009, 80, 833–838. [Google Scholar] [CrossRef] [PubMed]
- Sun, X.; Li, L.; Ma, T.; Liu, X.; Huang, W.; Zhan, J. Profiles of Phenolic Acids and Flavan-3-ols for Select Chinese Red Wines: A Comparison and Differentiation According to Geographic Origin and Grape Variety. J. Food Sci. 2015, 80, C2170–C2179. [Google Scholar] [CrossRef] [PubMed]


| Wine | Ellagic Acid µg/mL | Gallic Acid µg/mL | Caffeic Acid µg/mL | Myricetin µg/mL | Quercetin µg/mL | (−)-catechin µg/mL | Epicatechin µg/mL | Delphinidin µg/mL | Peonidin 3-O-glucoside µg/mL | Malvidin µg/mL | Cyanidin µg/mL | |
|---|---|---|---|---|---|---|---|---|---|---|---|---|
| Stage 1 | ||||||||||||
| Murfatlar (2014) | FN1 | 19.54 ± 0.40 a | 246.74 ± 1.08 a | 6.47 ± 0.12 b | 2.77 ± 0.06 e | 4.89 ± 0.22 c | 2.61 ± 0.10 e | 70.09 ± 0.90 a | 7.81 ± 0.21 b | 128.34 ± 1.35 c | 12.70 ± 0.13 f | 1.47 ± 0.02 a |
| CS1 | 4.03 ± 0.12 b | 218.95 ± 3.28 b | 18.50 ± 0.17 a | 7.59 ± 0.21 a | 5.19 ± 0.13 c | 1.77 ± 0.10 f | 39.07 ± 0.57 c | 8.52 ± 0.19 a | 150.29 ± 0.97 b | 89.98 ± 0.66 a | 0.96 ± 0.03 c | |
| M1 | 3.10 ± 0.05 c | 208.48 ± 1.30 c | 2.97 ± 0.05 f | 6.55 ± 0.17 b | 12.52 ± 0.49 a | 2.13 ± 0.02 e f | 58.62 ± 0.36 b | 7.44 ± 0.18 c | 155.86 ± 1.79 a | 37.57 ± 0.53 d | 1.31 ± 0.02 b | |
| Murfatlar (2015) | FN2 | 3.35 ± 0.07 c | 92.40 ± 1.25 d | 3.68 ± 0.21 e | 1.91 ± 0.05 f | - | 12.86 ± 0.41 b | 23.09 ± 0.15 f | 0.97 ± 0.05 d | 17.55 ± 0.47 d | 10.09 ± 0.11 g | 0.25 ± 0.01 f |
| CS2 | 2.08 ± 0.18 d | 85.45 ± 1.55 e | 5.28 ± 0.15 c | 4.21 ± 0.15 c | 1.67 ± 0.07 e | 14.98 ± 0.30 a | 28.96 ± 0.14 d | 0.97 ± 0.06 d | 13.63 ± 0.52 e | 56.06 ± 0.85 c | 0.90 ± 0.09 cd | |
| M2 | 1.78 ± 0.03 d | 77.59 ± 0.57 f | 2.22 ± 0.04 g | 3.32 ± 0.05 d | 2.30 ± 0.10 d | 8.82 ± 0.15 c d | 27.45 ± 0.69 e | 0.61 ± 0.02 e | 16.33 ± 0.40 d | 20.92 ± 0.40 e | 0.25 ± 0.01 f | |
| V. Calugareasca (2015) | FN3 | 3.39 ± 0.01 c | 90.46 ± 0.10 d | 4.87 ± 0.03 d | 0.45 ± 0.01 g | <LoD | 9.65 ± 0.27 c | 7.80 ± 0.10 h | <LoD | 9.03 ± 0.02 f | 5.91 ± 0.06 h | 0.81 ± 0.08 d |
| CS3 | 1.95 ± 0.02 d | 63.13 ± 0.05 g | 3.53 ± 0.01 e | 2.92 ± 0.01 e | <LoD | 8.35 ± 0.62 d | 8.35 ± 0.11 h | 0.25 ± 0.02 f | 2.50 ± 0.10 g | 74.54 ± 1.08 b | 0.16 ± 0.01 f | |
| M3 | 3.28 ± 0.02 c | 80.37 ± 1.51 f | 3.07 ± 0.04 f | 7.55 ± 0.10 a | 9.96 ± 0.05 b | 12.03 ± 0.04 b | 18.75 ± 0.24 g | 0.65 ± 0.01 d e | 8.56 ± 0.22 f | 57.07 ± 0.75 c | 0.56 ± 0.04 e | |
| Stage 2 | ||||||||||||
| Murfatlar (2014) | FN1 | 16.38 ± 0.67 a | 103.26 ± 1.67 b | 3.54 ± 0.37 cd | 3.18 ± 0.08 d | 2.52 ± 0.06 d | 3.06 ± 0.28 e f | 56.99 ± 1.09 a | 1.46 ± 0.03 a b | 29.65 ± 0.73 b | 8.72 ± 0.64 g | 0.12 ± 0.01 e |
| CS1 | 7.99 ± 0.18 c | 91.02 ± 1.32 c | 2.22 ± 0.15 e | 5.63 ± 0.21 b | 2.81 ± 0.78 d | 3.56 ± 0.34 e | 36.66 ± 0.92 c | 1.39 ± 0.05 b | 12.99 ± 0.62 d | 34.35 ± 0.83 d | 0.29 ± 0.02 d | |
| M1 | 11.44 ± 0.82 b | 105.26 ± 1.37 b | 4.82 ± 0.55 b | 6.10 ± 0.74 a b | 11.33 ± 0.67 a | 2.32 ± 0.09 f | 39.13 ± 0.19 b | 1.63 ± 0.13 a | 31.17 ± 0.81 a | 14.34 ± 0.41 e | 0.28 ± 0.02 d | |
| Murfatlar (2015) | FN2 | 4.07 ± 0.16 d | 90.63 ± 0.75 c | 3.97 ± 0.07 c | 1.23 ± 0.02 e | - | 11.59 ± 0.20 c | 23.35 ± 0.76 e | 0.50 ± 0.03 e | 14.04 ± 0.22 d | 8.15 ± 0.24 g | 0.21 ± 0.01 d e |
| CS2 | 2.44 ± 0.03 e | 80.25 ± 0.43 d | 5.71 ± 0.12 a | 3.52 ± 0.06 d | <LoD | 19.28 ± 0.03 a | 31.29 ± 0.11 d | 0.84 ± 0.02 c d | 13.57 ± 0.12 d | 55.58 ± 0.56 b | 0.83 ± 0.01 b | |
| M2 | 1.89 ± 0.02 e | 75.05 ± 0.67 e | 3.45 ± 0.05 c d | 1.94 ± 0.01 e | <LoD | 11.01 ± 0.16 c | 37.40 ± 0.15 c | 0.95 ± 0.02 c | 19.54 ± 0.09 c | 42.58 ± 0.40 c | 1.05 ± 0.12 a | |
| V. Calugareasca (2015) | FN3 | 7.89 ± 0.02 c | 125.29 ± 1.23 a | 3.38 ± 0.02 cd | 4.78 ± 0.01 c | 6.47 ± 0.15 c | 13.25 ± 0.34 b | 19.49 ± 0.06 f | 0.74 ± 0.03 d | 10.14 ± 0.27 e | 12.28 ± 0.36 f | 0.49 ± 0.08 c |
| CS3 | 1.96 ± 0.04 e | 62.71 ± 1.09 f | 3.36 ± 0.07 cd | 2.86 ± 0.04 d | 0.08 ± 0.01 e | 8.87 ± 0.69 d | 8.31 ± 0.17 h | 0.33 ± 0.03 e | 2.58 ± 0.27 f | 75.21 ± 1.22 a | 0.17 ± 0.01 d e | |
| M3 | 2.76 ± 0.01 e | 79.76 ± 0.58 d | 3.12 ± 0.01 d | 6.81 ± 0.09 a | 9.51 ± 0.09 b | 13.27 ± 0.14 b | 17.09 ± 0.64 g | 0.69 ± 0.09 d | 10.17 ± 0.75 e | 57.49 ± 1.04 b | 0.16 ± 0.01 d e | |
| Stage 3 | ||||||||||||
| Murfatlar (2014) | FN1 | 13.20 ± 0.05 a | 138.14 ± 2.13 a | 3.26 ± 0.02 d | 2.35 ± 0.05 d | <LoD | 9.45 ± 0.32 e | 30.98 ± 0.01 b | 0.22 ± 0.02 c | 9.60 ± 0.11 c | 3.27 ± 0.02 f g | 0.21 ± 0.01 g |
| CS1 | 6.72 ± 0.01 d | 126.78 ± 0.73 b | 2.25 ± 0.04 e | 4.19 ± 0.01 b | 0.57 ± 0.01 e | 21.58 ± 0.79 b | 26.06 ± 0.13 d | 1.17 ± 0.04 a | 7.05 ± 0.03 d | 33.37 ± 0.04 b | 0.95 ± 0.02 a | |
| M1 | 8.88 ± 0.24 b | 136.22 ± 1.87 a | 4.46 ± 0.16 c | 4.24 ± 0.04 b | 4.56 ± 0.08 b | 7.14 ± 0.40 f | 28.00 ± 0.70 c | 0.51 ± 0.01 b | 12.40 ± 0.38 a | 7.43 ± 0.05 e | 0.60 ± 0.01 b | |
| Murfatlar (2015) | FN2 | 7.85 ± 0.28 c | 108.59 ± 1.48 c | 6.02 ± 0.11 a | 1.41 ± 0.03 e | <LoD | 14.97 ± 0.53 d | 9.37 ± 0.40 g | - | 6.79 ± 0.17 d | 4.13 ± 0.21 f | 0.42 ± 0.01 d |
| CS2 | 1.59 ± 0.02 h | 59.64 ± 0.93 g | 3.04 ± 0.14 d | 1.15 ± 0.05 e | 0.65 ± 0.01 | 17.44 ± 0.51 c | 24.69 ± 0.25 e | - | 12.16 ± 0.22 ab | 31.35 ± 0.27 c | 0.26 ± 0.01 f | |
| M2 | 2.06 ± 0.14 g | 83.62 ± 1.41 e | 4.23 ± 0.31 c | 1.97 ± 0.18 d | 1.55 ± 0.08 c | 21.86 ± 0.46 b | 33.03 ± 0.48 a | - | 11.83 ± 0.31 b | 15.48 ± 0.35 d | 0.54 ± 0.01 c | |
| V. Calugareasca (2015) | FN3 | 3.17 ± 0.12 e | 92.12 ± 1.02 d | 5.44 ± 0.21 b | 0.63 ± 0.01 f | - | 17.84 ± 0.61 c | 6.55 ± 0.18 h | - | 2.52 ± 0.07 f | 3.21 ± 0.16 g | 0.34 ± 0.01 e |
| CS3 | 2.20 ± 0.12 g | 78.49 ± 0.73 f | 4.02 ± 0.23 c | 3.64 ± 0.05 c | 1.12 ± 0.07 d | 13.62 ± 0.37 d | 7.44 ± 0.23 h | - | 1.83 ± 0.05 g | 70.59 ± 0.51 a | 0.44 ± 0.02 d | |
| M3 | 2.66 ± 0.09 f | 94.69 ± 0.82 d | 4.09 ± 0.11 c | 8.22 ± 0.42 a | 9.74 ± 0.37 a | 26.17 ± 0.26 a | 11.44 ± 0.27 f | - | 4.77 ± 0.12 e | 34.16 ± 0.54 b | 0.42 ± 0.01 d | |
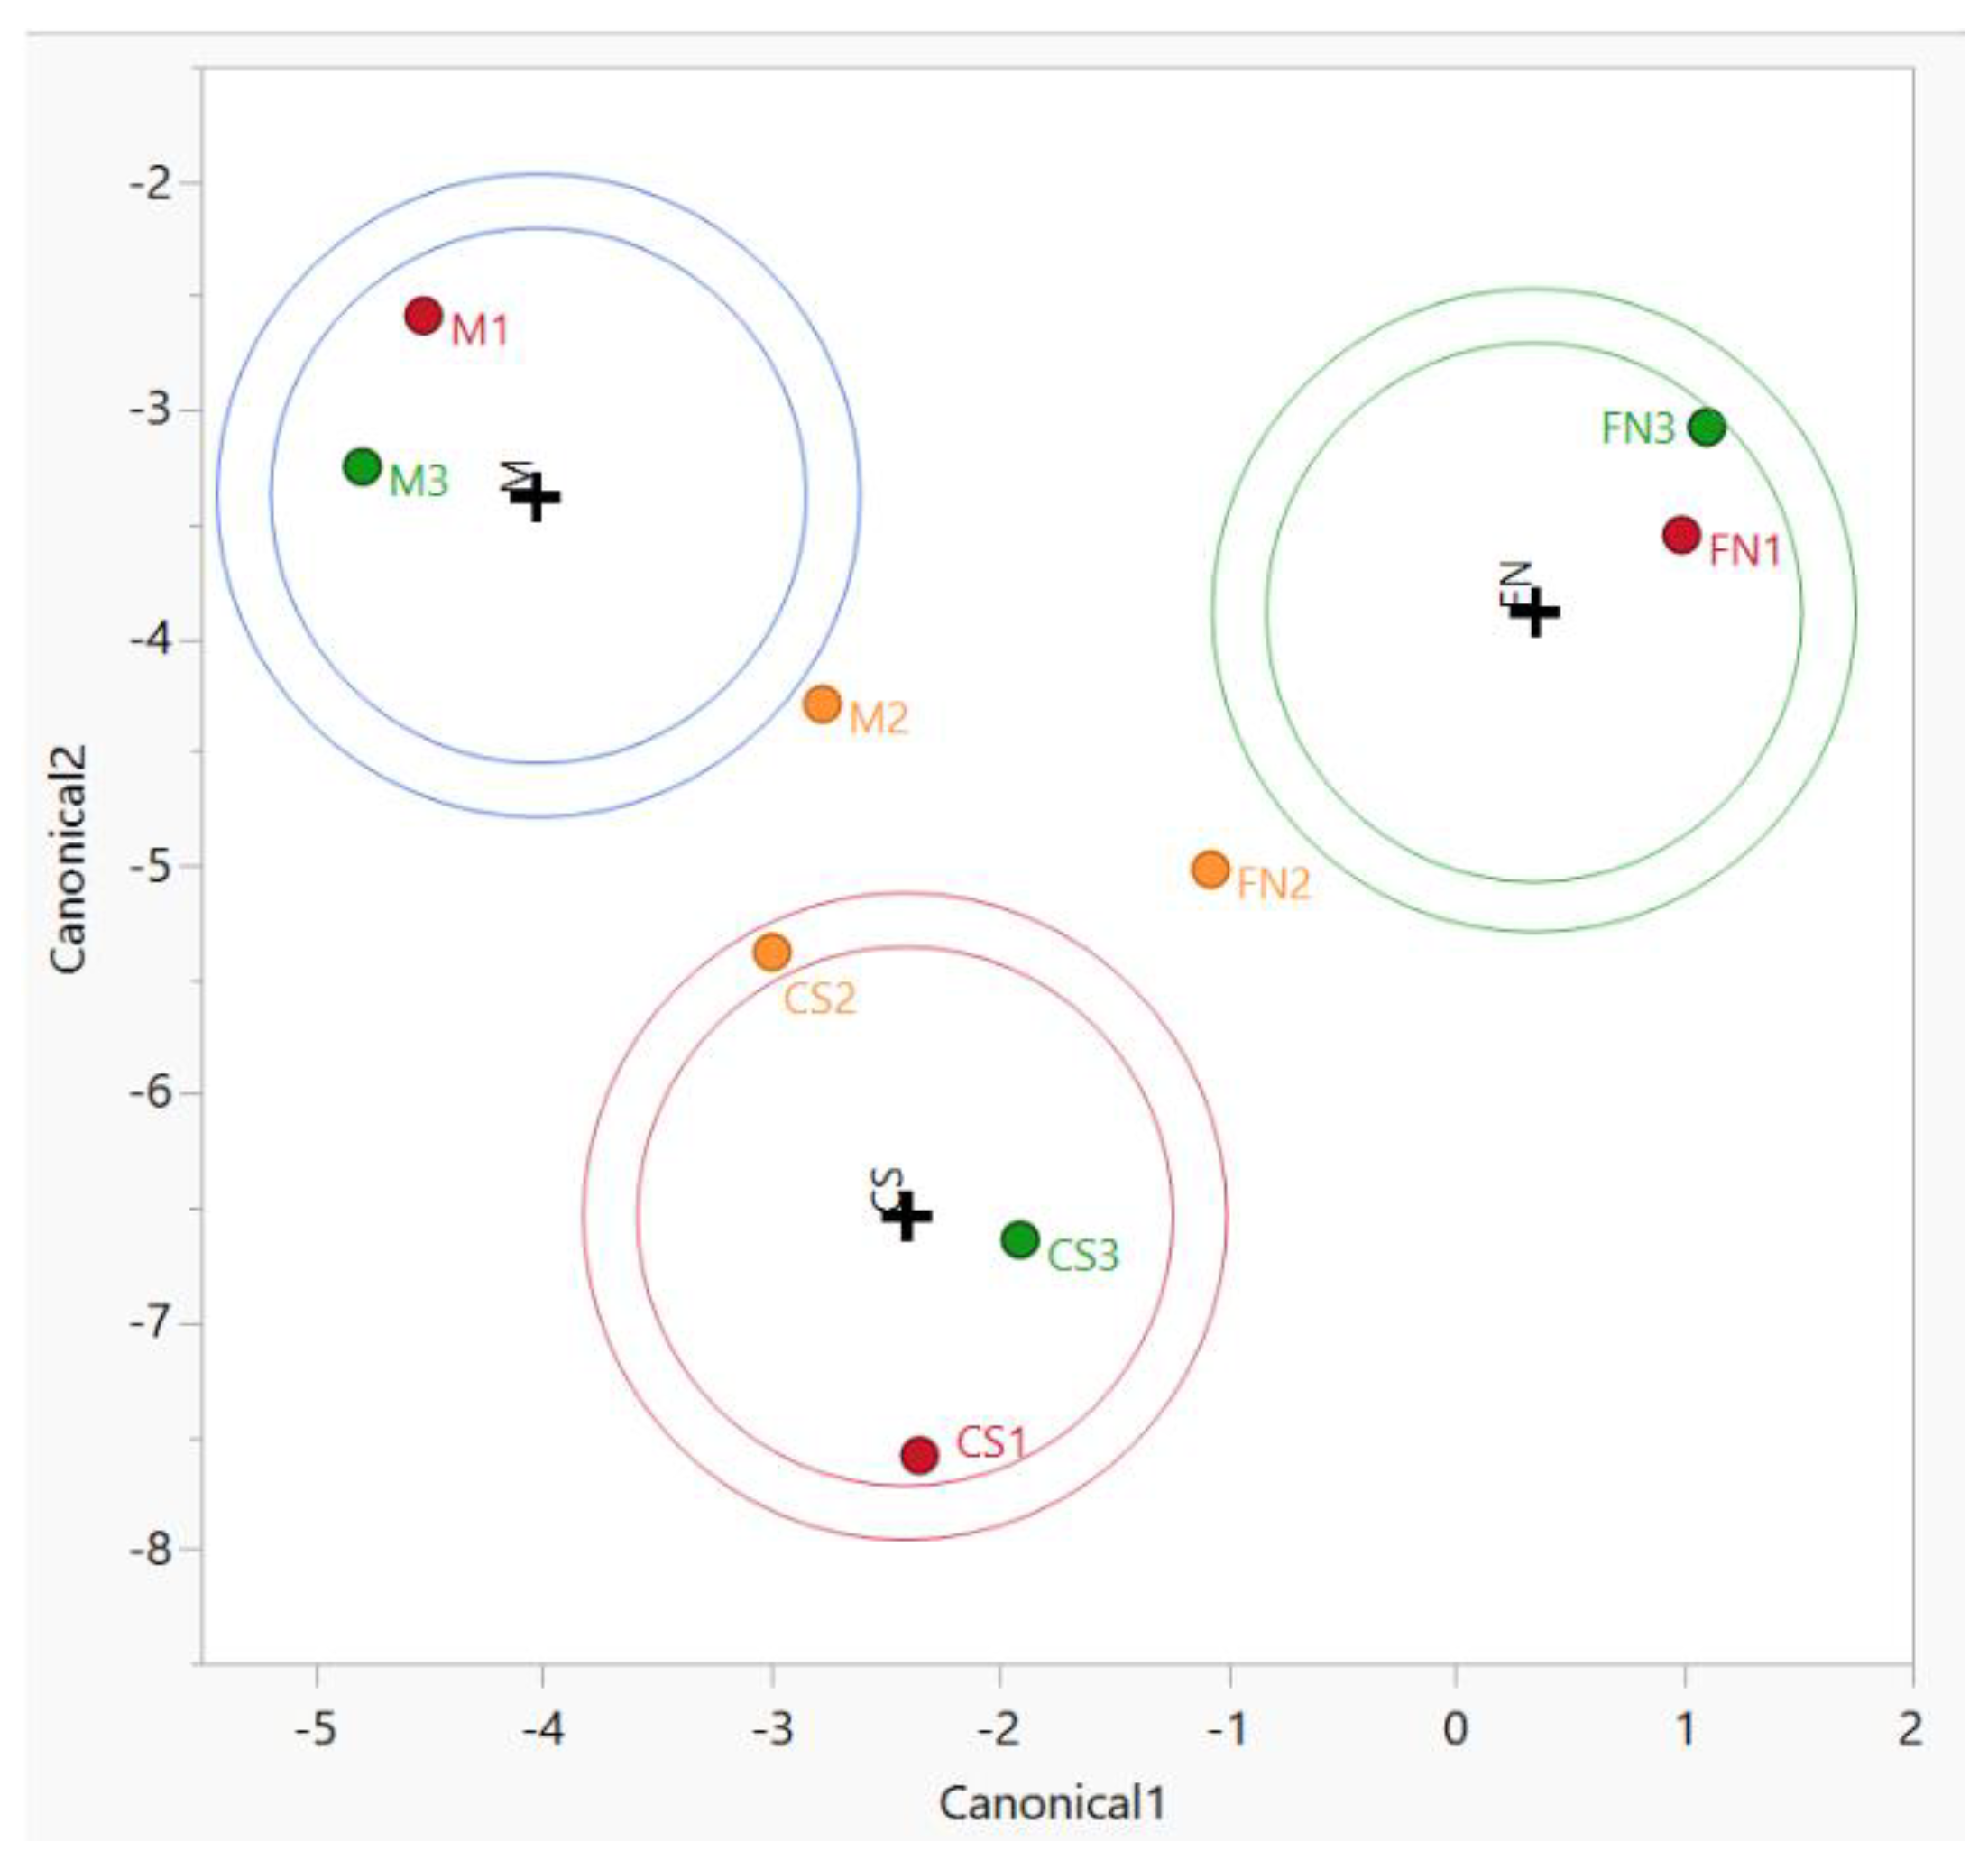
| CDA | ||
|---|---|---|
| Can. 1 | Can. 2 | |
| Variance | ||
| 62.898% | 37.101% | |
| Compound | Standardized Scoring Coefficients | |
| Epicatechin | −0.69469 | 2.433443 |
| Ellagic acid | 0.889881 | 0.260918 |
| Myricetin | −1.97043 | −3.72623 |
| Quercetin | 0.709911 | 4.66888 |
| Gallic acid | 0.00773 | −5.39067 |
| Caffeic acid | 1.191303 | 2.644185 |
| (−)-catechin | 0 | 0 |
| Delphinidin | 0 | 0 |
| Peonidin 3-O-glucoside | 0 | 0 |
| Malvidin | 0 | 0 |
| Cyanidin | 0 | 0 |
Publisher’s Note: MDPI stays neutral with regard to jurisdictional claims in published maps and institutional affiliations. |
© 2021 by the authors. Licensee MDPI, Basel, Switzerland. This article is an open access article distributed under the terms and conditions of the Creative Commons Attribution (CC BY) license (https://creativecommons.org/licenses/by/4.0/).
Share and Cite
Palade, L.M.; Croitoru, C.; Albu, C.; Radu, G.L.; Popa, M.E. Identification of Tentative Traceability Markers with Direct Implications in Polyphenol Fingerprinting of Red Wines: Application of LC-MS and Chemometrics Methods. Separations 2021, 8, 233. https://doi.org/10.3390/separations8120233
Palade LM, Croitoru C, Albu C, Radu GL, Popa ME. Identification of Tentative Traceability Markers with Direct Implications in Polyphenol Fingerprinting of Red Wines: Application of LC-MS and Chemometrics Methods. Separations. 2021; 8(12):233. https://doi.org/10.3390/separations8120233
Chicago/Turabian StylePalade, Laurentiu Mihai, Constantin Croitoru, Camelia Albu, Gabriel Lucian Radu, and Mona Elena Popa. 2021. "Identification of Tentative Traceability Markers with Direct Implications in Polyphenol Fingerprinting of Red Wines: Application of LC-MS and Chemometrics Methods" Separations 8, no. 12: 233. https://doi.org/10.3390/separations8120233
APA StylePalade, L. M., Croitoru, C., Albu, C., Radu, G. L., & Popa, M. E. (2021). Identification of Tentative Traceability Markers with Direct Implications in Polyphenol Fingerprinting of Red Wines: Application of LC-MS and Chemometrics Methods. Separations, 8(12), 233. https://doi.org/10.3390/separations8120233