Review

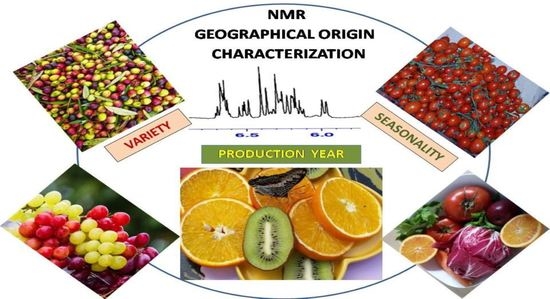
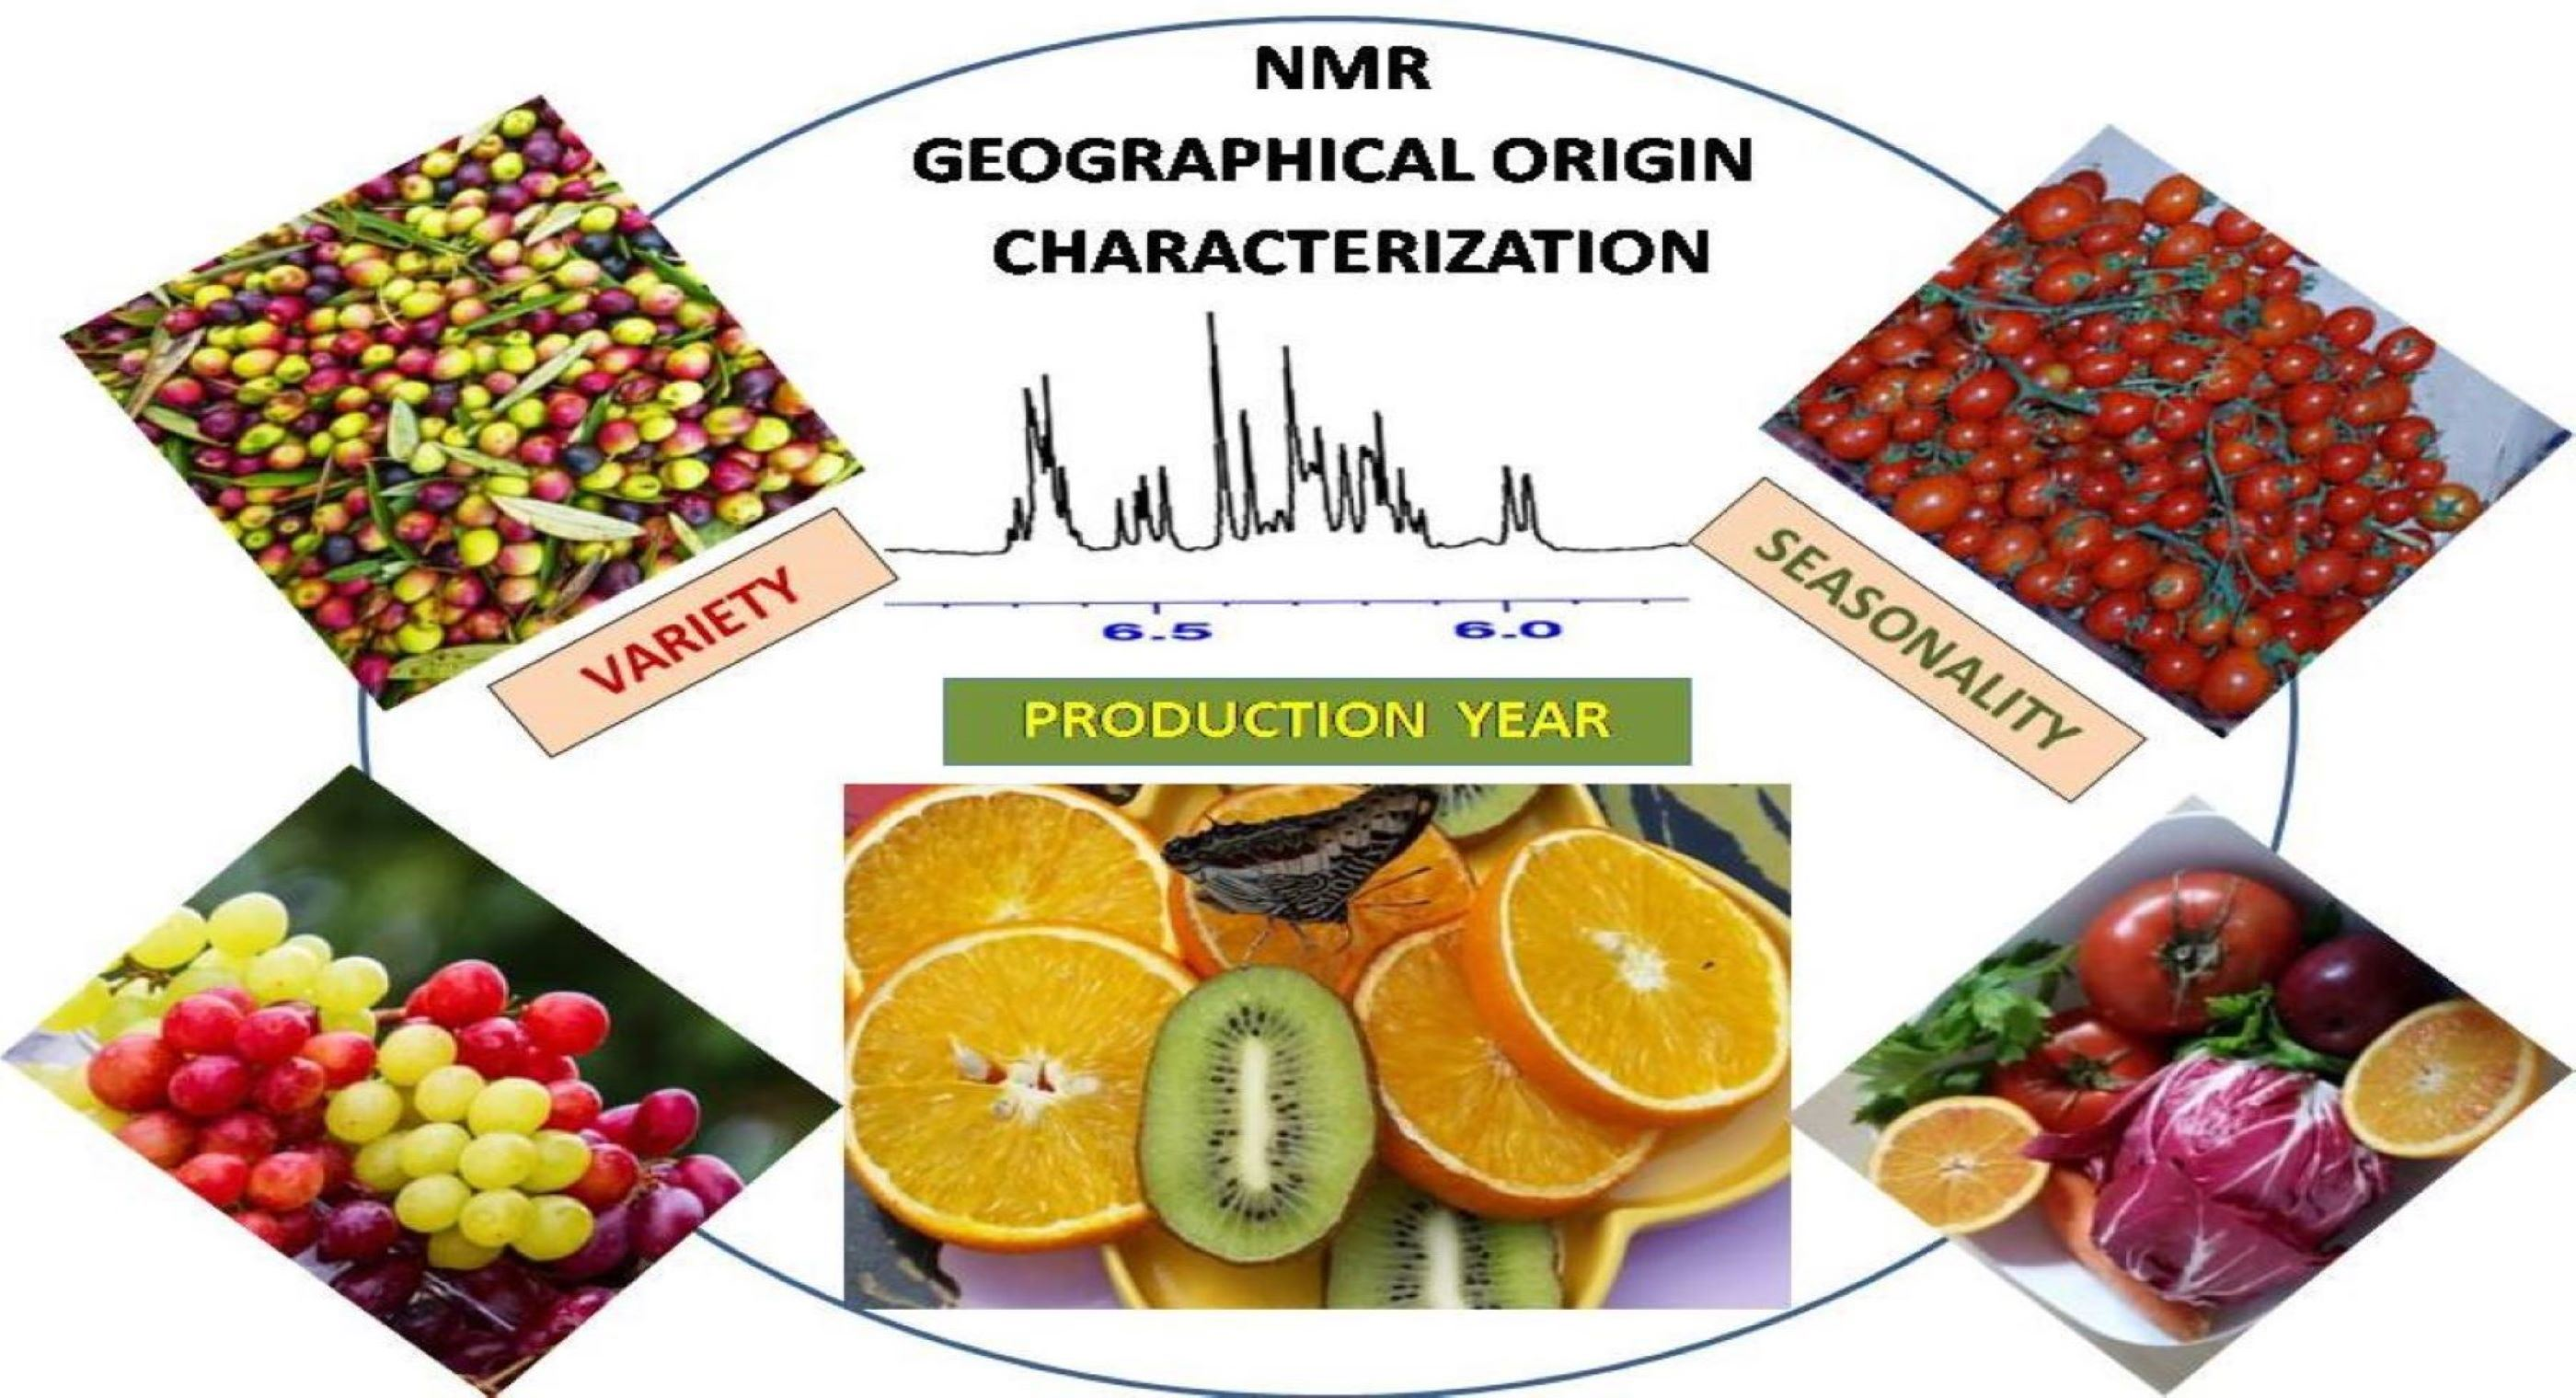
NMR Tracing of Food Geographical Origin: The Impact of Seasonality, Cultivar and Production Year on Data Analysis

1
Ministry of Education, University and Research (MIUR), 00189 Rome, Italy
2
Department of Food Safety, Nutrition and Veterinary Public Health, Istituto Superiore di Sanità (ISS), Viale Regina Elena 299, 00161 Rome, Italy
3
DG Joint Research Centre, Institute for Environment and Sustainability (IES), Via E. Fermi 2749, 21027 Ispra, Italy
*
Author to whom correspondence should be addressed.
Currently at IC Parco di Veio, Via del Fontaniletto 29/B, 00189 Rome, Italy.
Separations 2021, 8(12), 230; https://doi.org/10.3390/separations8120230
Submission received: 12 September 2021 / Revised: 10 November 2021 / Accepted: 18 November 2021 / Published: 1 December 2021

Abstract

:
The traceability of typical foodstuffs is necessary to protect high quality of traditional products. It is well-known that several factors could influence metabolites content in certified foods, but soil composition, altitude, latitude and coded production protocols constitute the territorial conditions responsible for the peculiar organoleptic and nutritional properties of labelled foods. Instead, regardless of origin, seasonality, cultivar, collection year can affect all agricultural products, so it is appropriate to include them in data analysis in order to obtain a correct interpretation of the differences linked to growing areas alone. Therefore, it is useful to use a flexible all-round technique, and NMR spectroscopy coupled with multivariate statistical analysis is considered a powerful means of assessing food authenticity. The purpose of this review is to investigate the relevance of year, cultivar, and seasonal period in the determination of food geographical origin using NMR spectroscopy. The strategy for testing these three factors may differ from author to author, but a preliminary study of cultivar or collection year effects on NMR spectra is the most popular method before starting the geographical characterization of samples. In summary, based on the available literature, the most significant influence is due to cultivar, followed by harvesting year, however seasonality is not considered a source of variability in data analysis.

Graphical Abstract

1. Introduction

Food quality is strongly affected by the peculiar conditions of production areas, which give unrepeatable organoleptic and nutritional properties to agro-products. Starting from 1992, European legislation introduced international food labels such as “Protected Geographical Indication” (PGI) in order to defend the high quality level of all typical EU productions (EEC Reg. 2081/92). Therefore, the demand for powerful analytical tools in the determination of food provenance has increased over the years. In particular, NMR spectroscopy coupled with multivariate statistical analysis is considered a powerful and effective means of investigating the metabolic profile of organic samples [1]. This approach is a suitable method, as it is able to provide the metabolite fingerprints of many foodstuffs. In fact, NMR spectroscopy allows the simultaneous monitoring of a variety of compounds in complex mixtures without severe extraction and purification techniques [1].
The metabolic profile, as detected by NMR tools, depends on the pedoclimatic conditions of production areas and on agronomic practices, but it is also affected by other factors such as seasonality, cultivar, and production year [2,3,4,5]. Therefore, sample classification based on cultivar and harvesting period (year and season, respectively) is a very useful strategy for statistical data analysis in order to obtain the correct interpretation of geographical differences linked only to provenance. Obviously, this approach requires further validation, involving more cultivars, years and, consequently, more samples, because each of these factors introduces a potential variability in the data set. The different kinds of multivariate analysis (mainly PCA, PLS-DA, kNN and Artificial Neural Network) are used to find out the relationship between all parameters and peak intensities of the NMR spectra [1,2,5,6].
The aim of the present paper is to investigate the relevance of these factors through analysis of literature dealing with the characterization of geographical origin by NMR spectroscopy. Indeed, these variables complicate the analysis of differences in agricultural products grown in different areas, but they also enrich the research by highlighting changes linked only to the production site. In particular, in this review, only the studies that take into account seasonality, cultivar or production year in food provenance investigation were selected and offered to readers. A graphical summary of the number of selected publications per year is given in Figure 1, which shows an increased interest among the scientific community in the study of interactions between certain factors and the geographical origins of foods.
The bibliographic analysis is preceded by a very brief description of the metabolite profiling of foods using high-field NMR spectroscopy and the main statistical methods for data processing.

1.1. High-Field NMR Application in Food Analysis

High-field NMR spectroscopy is applied only with active nuclei (such as 1H, 13C and 31P), and it is widely used in the origin authentication of foodstuffs [1,7,8,9,10,11,12,13,14]. In particular, in order to detect the peculiar chemical composition and to identify specific markers of foods (target analysis), proton (1H) liquid NMR spectroscopy is used for metabolite profiling with minimal sample preparation [1], but it is also applied in a non-targeted metabolite fingerprinting approach with very interesting performance [1]. In fact, using this last method, the NMR spectrum is acquired as a complete fingerprint of the sample without identifying the metabolites from the peaks, as is required in a targeted approach [1]. In addition, two-dimensional (2D) NMR experiments are used when a relevant overlap of signals prevents the complete assignment of spectrum peaks to specific molecules [1,15].
Recently, new automated NMR methodologies have been developed [16,17], so as to shorten NMR data analysis (the metabolite identification and quantitation in complex mixture) and to avoid possible mistakes due to manual manipulation in baseline and phase correction and integration [18,19]. As an example, for tracing the geographical origin of dark chocolate, NMR experiments based on a semi-automated NMR approach has been proposed with completely automated metabolite identification and quantification [20].
High-Resolution Magic Angle Spinning (HRMAS) NMR spectroscopy is an accurate and rapid alternative to the classic liquid NMR method because it makes it possible to directly examine the whole sample without compounds extraction. This very versatile technique provides high-resolution NMR data for samples containing solutions, gels and swellable solids, and in food research it has been used to analyze jams, fruit jellies and other semi-solid foods [14].
NMR metabonomics experiments consist of the following five main steps:(1) sample collection and storage, (2) sample preparation, (3) NMR spectra acquisition and processing, (4) chemometric analysis of data, (5) data interpretation (Figure 2).
Sample preparation is a highly critical step in NMR experiments, as the selection of the most suitable solvent is necessary [1], as well as the selection of the extraction time or the relative amounts of sample and extractant. In fact, the solvents can lead to overlapping of spectral peaks, complicating the signal assignment and the comparison between different spectra. Water is a widely used solvent, but a pH adjustment is necessary in order to prevent changes in the chemical shifts of some NMR signals. As for lipids, all fatty acids are soluble in hexane, but some lipophilic components such as carotenoids are completely extracted only by chloroform. Therefore, it is necessary to properly set these factors in order to optimize the results [21].
For further information, a very exhaustive review [1] was published in 2012; it thoroughly described the application of proton (1H) liquid high-field NMR to food profiling using a metabolomics approach. Moreover, the contribution of NMR spectroscopy to molecular profiling for food authenticity was described in a recent review [22]: on the basis of several studies, it was possible to indicate the specific markers for variety, geographical or botanical origin, development stage, adulteration or storage determination in different foodstuffs [22].
Finally, data platforms about food composition such as FooDB (www.foodb.ca (accessed on 11 September 2021)) have recently been developed and are now available to facilitate the determination of the largest number of food metabolites.

1.2. Multivariate Statistical Analysis

The traceability of agri-food products and the identification of the most important agri-environmental factors that influence the content of some metabolites is a topic that has greatly stimulated the research and application of appropriate and reliable analysis methodologies over the last few years.
In this review, various approaches and methodologies of statistical data analysis, have been described. The techniques are mainly applied for the classification of geographical origin of products and for the identification of cultivars/varieties [23,24,25,26,27,28,29,30,31,32,33,34,35,36,37,38,39,40,41] but also for other factors such as effect of the season [39,40] and the influence of the harvest year [2,23,42,43,44]. Before applying data analysis and classification methods, the data are often pre-processed, using the Auto-scaling [40] or Pareto-scaling techniques [3,40,45], in order to make all metabolites equally important in the data analysis.
Statistical classification techniques can mainly be divided into two groups: unsupervised and supervised methodologies. The main difference between the two techniques is that in the former, there is no a priori knowledge about the classes and the data classification rules, and this can produce less accurate results. The advantage is the lower complexity in comparison with supervised methods. The supervised methodology has the advantage that the algorithm “learns” the rules of classification from the known classes and data and the results are more accurate and reliable with respect to the unsupervised techniques.
Principal Component Analysis (PCA) is the most common unsupervised technique used in classification studies, and is often used as a preliminary step in multivariate data analysis to reduce the dimensionality of data and highlight the correlations among the samples. Generally, the outcome is represented by a two- or three-dimensional scatter plot representation, in which it is possible to highlight the existence of clusters in the data, the presence of outliers, and the most important metabolites that characterize the groups (loadings) [1].
Another unsupervised technique, often used together with PCA, is based on Hierarchical Cluster Analysis (HCA) [7,13,22,46,47,48,49]. This method built a hierarchy of clusters and: the algorithms are robust according to the input variables and they are less sensitive to the different points density of the clusters.
It is interesting to point out that also the Analysis of Variance (ANOVA) is often used in the preliminary phase of data analysis [2,5,9,10,24,25,34,36,47,48,50,51], in order to select the subset of the most significant metabolites in the classification procedure.
Over the time, the use of supervised classification techniques has increased, with the purpose of proposing an alternative method of classification, but also to complete and verify the results obtained with unsupervised techniques.
The most common multivariate statistical analysis technique used among the selected articles was Partial Least Squares Discriminant Analysis (PLS-DA) [5,12,27,28,29,30,31,32,37,42,48,49,52,53,54,55,56,57,58,59,60]. This algorithm combines dimensionality reduction and discriminating analysis building a data classification model based on discriminative variable selection. It is suitable for modeling high-dimensional data and it is distribution free. The advantage of this technique, also with respect to Linear Discriminant Analysis (LDA), is the possibility of processing large data sets in which the number of variables exceeds the number of samples. Moreover, the method can be used when the variables are correlated or when the variables are not normally distributed. Its orthogonal modification—Orthogonal Partial Least Squares Discriminant Analysis (OPLS-DA)—is also widely used [26,27,28,29,30,31,32,39,50,61,62,63,64,65,66]. This method is an extension of the PLS regression method, and it increases the classification performance in the case of high variability in each classes. However, Linear Discriminant Analysis (LDA) is still also very common as a supervised classification method [2,3,5,12,35,36,40,43,44,52,67,68]. The classification criteria are based on a linear combination of the original variables with the goal to assign the samples to the classes in an optimal way.
Other algorithms used in agri-food product recognition and classification include k-Nearest Neighbors (k-NN) [54,69], the Artificial Neural Network (ANN), and the Genetic Programming algorithm (GP) [56,70]. The k-NN method assigns each sample to the most common class of its neighbors, and the results are easily understandable. The ANNs and GP algorithms are mathematically more complex, but they have the advantage of producing a high degree of accuracy (>99%) with respect to classification, while GP produces a classification tree.
For further information about the most widely used statistical strategies in the geographical characterization of various foods, it is possible to consult Table S1 in the Supplementary Material.

2. Variety, Harvesting Yeas and Seasonality as Factors Influencing Geographical Origin Authentication

It was widely observed that various factors such as cultivar, soil composition, farming practices and climate conditions affected food composition and consequently the characterization of its geographical origin characterization. Soil composition, altitude and latitude constitute the pedoclimatic conditions which contribute to determine quality of certified foods [2]. Other factors such as agronomic techniques or growth conditions are too variable in the case of unlabeled products, because each farm adopts different agricultural practices which are instead coded through production protocols for certified foodstuffs. In fact, a study of Sicilian tomatoes [40] verified that it is possible to distinguish the PGI zone of Pachino from the not PGI areas of Gela and Licata, despite the conspicuous differences in Licata samples due to the collection farms.
Conversely, seasonality, cultivar, collection year indifferently could affect all (PGI and not PGI) productions, so these factors should be considered in data analysis. Many studies have shown the importance of cultivar, year and seasonality in the geographical characterization of foodstuffs using NMR spectroscopy [23,33,39,49,71,72,73,74]. A multifactorial analysis, based on these variables, could help in understanding spectra data in order to highlight only the geographical differences between the samples [40].
The climatic parameters, such as daylight exposure, temperature and rainfall affect agricultural products and vary considerably from year to year [50,63,71,75]. Therefore, the variability of environmental and climatic conditions, can be easily taken into account by introducing two or more years in data collection. Therefore, harvesting year become a useful parameter to verify possible annual changes in the environmental conditions, while seasonality allows one to take into account the variations related to harvesting period from autumn to summer. This factor becomes completely useless when products harvested in a single season are analyzed, such as olive oils (EVOOs) or wines. To complicate the geographical origin tracing, the cultivar effects are possibly connected with seasonal changes, and they must be evaluated in chemometric analysis [76].
As evidence of the seasonality and harvesting year significance, it was observed that, in the same farm, the tomatoes collected in different seasons had a different metabolic profile [40], such as those collected in two consecutive years [71] despite using the same production practices in both cases.
Certainly, NMR profiling has been successfully applied as a tool that can differentiate between cultivars or various botanical species ([4,29,40,58,61,76], etc.), but also to evaluate agro-products cultivated in different years or seasonal period [23,71,76]. Therefore, regarding the geographical determination of wines, the phenolic fraction obtained by XAD resin was used to classify Greek wines according to variety, region and year of production with a good performance [72].
Extensive studies have been performed to establish which NMR signals were dependent on cultivar and which on geographical provenance in the case of a valuable product like EVOO (Extra Virgin Olive Oils). In particular, oleic acid, saturated fatty acids and the total content of triacylglycerols were significant for varieties distinction [45], while linoleic acid, saturated fatty acids and minor resonances such as terpenes, squalene, aldehydes and ß sitosterol were found discriminating for geographical origin [2,36,77]. Following this strategy, several other studies on olive oils later have been published [9,30,38,45,78].
The NMR signals of phenolics. were mainly analyzed considering together cultivar and year before the geographical investigation and the collection period was found to be the most effective factor in discriminating the 221 samples of Greek EVOOs regardless of their botanical origin [23].
Conversely, the cultivar was found to significantly influence German wine (574 samples) characterization without the aid of chromatographic techniques using only NMR data and combining several steps of multivariate statistics based on targeted and non-targeted analysis [33]. The targeted analysis allowed the quantification of the principal metabolites of wines, but the whole NMR spectrum was a very complex source of information (variety, origin, vintage, technological treatments and other factors); consequently, it was necessary to also apply a non-targeted tool in order to complete samples classification [33]. In these two last papers, neglecting the differences in data analysis, a multifactorial approach was followed because variety and production year were taken in account and combined in tracing Greek EVOOs and German wines [23,33].
In the following subsections of this paper, each factor (variety, harvesting year and seasonality) was separately treated in order to highlight its relevance.

2.1. Variety

Several studies highlighted the importance of the variety for the geographical origin characterization [4,26,28,29,32,34,37,39,40,41,51,53,58,60,76,78,79,80,81]. A useful strategy may be to study how much the NMR metabolic profile is affected by different cultivars grown in the same zone before starting geographical origin characterization, from these preliminary studies, significant differences in NMR profile could be found between the various certified cultivars [31,76,78].
Conversely, without cultivar evaluation, a statistical model, based on PLS-LDA and PLS-GP, allowed the distinction only between Corsican and non-Corsican honey, and this was followed by the identification of possible Corsican honey biomarkers using a lot of selected variables corresponding to specific spectra intervals [56]. The results were significant and interesting, but the botanical effects remained hidden inside the geographical classification, and only the biomarkers of sweet chestnut, Corsican spring Maquis and Arbousier honeys were identified [70].
Instead, the approach based on a preliminary investigation of cultivar influence allows the study of link between variety and its territory helping the following geographical comparison. In particular, 19 different cultivars of olive oils from Algeria were evaluated [78] and significant variations in chemical composition were noted between the various types. Similarly, a good classification of Apulian EVOOs was obtained using 1H NMR experiments and significant differences in metabolites content between the various cultivars were found. NMR spectroscopy has been successfully applied for studying compositional differences in boreal honeys in order to protect some of the rarest and most valued Finnish honeys [4]. Aqueous and chloroform extracts were used for Finnish honeys characterization and glucose and fructose widely contributed to discrimination between the various honeys [4].
Geographical characterization is evident in two cabbage varieties grown in different regions of Korea and China [34]. Furthermore, the results also showed a clear separation between the two cultivars from China, while Korean samples were overlapped without botanical distinction. In a study of geographical characterization of Italian sweet cherries [5], a correct origin classification of samples was obtained by different statistical strategies (LDA, PLS-DA and SIMCA), without significant effects due to the three analyzed cultivars.
In these studies, the geographical origin prevails over cultivars influence, but it not possible to generalize these conclusions. In fact, in the characterization of two typical Apulian fruit juices [32], malic acid and sugar amounts were found very different in the analyzed varieties Giorgia and Ferrovia, but clearly this result was completely independent of geographical origin. In Robusta and Arabica coffee bean comparison, the differences linked with the two cultivars strongly influenced the geographical determination between samples from several origins using 13C NMR-based metabolite profiling coupled with PCA and OPLS-DA [39]. ln the quality control of Czech wines, 1H NMR spectroscopy was effective in classification of wine type and grape varieties and, in part, production area [37], but, despite the ten years of sampling, no annual evaluation was proposed. In this study, an untargeted NMR approach combined with the Random Forest algorithm was applied in order to correctly classify 13 wine grape varieties and four locations (a set of 917 bottles of Czech wines); only three wine varieties were tested for geographical origin characterization, and an incomplete discrimination of provenance was obtained [37]. In the tracing of Lambrusco wines of Modena, 2,3-butanediol, lactic and succinic acids, threonine and malic acid were found important compounds for varietal discrimination [48].
In some studies [31,66,67,82,83], cultivar evaluation by NMR data was not completely solved because more samples from certified varieties and geographical origin should be collected and analyzed to attain this purpose. In fact, due to the small number of samples, in Chae et al. [82], the second component of PCA analysis seemed to discriminate only the cultivar Choochung from other varieties of Korean rice. The rice from Sanchung and Yichon had the same genetic background, but Yichon samples contained more amino acids and sugars than ones from Sanchung and the observed differences were really connected to geographical origin. Moreover, the Basmati type, exclusively cultivated in particular areas of Himalayas and Pakistan, could be differentiated from other Asian rice and European varieties [83].
In favorable cases, associating a particular cultivar with its cultivation area, it was very easy to recognize geographical provenance, e.g., in the analysis of Bronte pistachios. In fact, only cv Napoletana was cultivated in Bronte (Sicily, Italy); consequently, it differed from the other pistachios varieties harvested in Syria, Turkey and Iran [59]. Similarly, in order to protect the raw and the toasted PGI Tonda Gentile Trilobata (TGT) from Piedmont (Italy), 1H-NMR profiling was used to differentiate it from cultivars of other geographical origin [24] and some markers such as trigonelline, amino acids and aromatic/phenolic substances permitted to distinguish TGT against the other cultivars (Romana, Giffoni, Turkish and Georgia hazelnuts).
In another study, cocoa beans of three cultivars, harvested in limited areas of Central and South America and in Africa with different fermentation conditions were analyzed in order to classify their origin and variety. The results suggested that the level of fermentation can condition metabolites composition more than botanical and geographical factors do [25], but cultivar Arriba, grown only in Ecuador, made it possible to distinguish geographical origin with certainty.
It is very interesting to consider the traceability of Argentine citrus which is conquering the European and International market [84]. For a complete classification of the provenance of citrus fruits, the Argentine varieties should be characterized in such a way as to trace them among others. Therefore, as for the hydrophilic fraction, the two Argentine zones were well discriminated and Salustiana variety was correctly differentiated in the comparison with the others. Conversely, Navelate and Navelina varieties could not be separated from each other [84].

2.2. Harvesting Year

According to Consonni et al., 2010 [62], geographical origin discrimination of Italian and Chinese tomato paste is not affected by the two analyzed production years. Similarly, in the geographical characterization of the “Greco Bianco” grape variety, the production year did not differentiate wines from two vintages [42]. Instead, succinic acid, proline and 2,3-butanediol contents were found to be discriminating in the comparison of Aglianico wines according to both vintage and geographical provenance [85]. Moreover, in according to Godelmann et al. [33], bad conditions, due to the vintage, influenced grapes quality more than technological and enological means.
Despite the five years of sampling, the vintage was not considered a meaningful parameter together with variety in the comparison between Romanian and French wines [35] and only one area in 1H-NMR spectra of samples (5.1–9.8 ppm) was found the most effective for both geographical and varietal discrimination. In Bordeaux red wines, two successive vintages could be discriminated using a specific marker linked to “vitivinicultural conditions” [86], while age and geographical origin could not be modeled for scotch whisky, since it does not have a terroir in the same way as wine [64].
In a very recent paper [71], the harvest year was found very discriminating for cherry tomatoes cultivation in Sabaudia (Latium, Italy). In fact, Sabaudia samples coming from a single farm showed a lypophilic metabolite profile completely different in the next two years of production. The significant annual differences included the entire NMR spectrum and they were compatible with samples harvested in different geographical areas. Therefore, in order to highlight annual disparities, it was necessary to carry out a preliminary statistical analysis on the Sabaudia samples prior to the geographical origin characterization [71].
In Girelli et al. [29], the four studied olive cultivars, originating from the Apulian region, did not show a similar annual behavior: Cima di Mola and Ogliarola were more affected by the production year than the other two varieties. In another article [52], olive oil samples were analyzed by PCA on the basis of the harvesting year and provenance. The results suggested that harvest year was more relevant than geographical origin. In tracing Lebanese olive oils, oleic acid showed the greatest dependence on the year of production and only one cultivation year, with extreme climatic conditions, was found to be significant [44].
Finally, it was necessary to collect 896 samples in order to discriminate Ligurian from non-Ligurian olive oils [87], and PLS-DA and SIMCA analysis was used to build up statistical models to perform this study. The prediction model built on the first collection year was used on the samples from the other two harvesting years and it showed a reduced classification ability. Despite these results, it was possible to establish that a higher terpenes content and a lower amount of saturated fatty chains characterized Ligurian olive oils compared to the other ones [86]. Previously, a similar approach was used for verifying the geographical origin of Italian olive oils collected in three years [43].

2.3. Seasonality

For several reasons, currently, seasonal effects have not been fully analyzed, but these could cause significant variations in metabolic profile irrespective of geographical origin. For example, seasonal changes were observed in the tomato fruit profiles for two varieties (cv Palmiro and Clotilde) using 1H NMR spectroscopy [88]. In particular, various cultivars could behave differently changing the seasons: in the geographical characterization of PGI Pachino cherry tomatoes, two cultivars (Naomi and Shiren) were differently affected by seasonal changes, and they showed unequal levels of lipophilic metabolites in the summer period [76]. In particular, based on a combined PCA and PLS-DA analysis, the lipid composition was found to be very significant in distinguishing winter and summer Naomi tomatoes. The PLS-DA score plot in Figure 3 shows a clear separation of the two groups of PGI Pachino samples [76].
In addition, the results of a study on eight types of Chinese honeys in three geographical areas and five production dates over a 14-month period, covering the four different seasons, are of particular relevance [66]. PCA analysis showed that the honey samples were clearly classified by production date and were divided into clusters with similar collection period, and consequently as a function of seasonality. Additionally, the honey of Corsican Maquis harvested in Autumn showed a clear seasonal trend and it had high levels of its unidentified biomarker [70].
Furthermore, in order to trace bovine milk from 10 different farms in Mugello valley (Tuscany, Italy), a total of 400 samples (40 from each farm) were collected and some changes in the lipid composition were found among the various seasonal periods [68]. Therefore, seasonality and provenance together influenced milk spectra and this effect made it difficult to recognize the origin of the samples. As a result, each collection period was taken into account separately and some features enabled the right identification of each farm [69].
In Brazil, Syrah wines produced in December showed higher amounts of glycerol, tartaric and succinic acids, while the same wines produced in July contained higher levels of proline and lactic acid [55].

3. Conclusions and Future Perspective

NMR spectroscopy is widely used to analyze complex food mixtures obtained from foodstuffs in order to verify quality and geographical origin. Using NMR tools, it is possible to trace a metabolic profile dependent on several factors including geographical origin. To verify food provenance, it is necessary to assess the contribution of cultivar, seasonality and year of production on NMR spectra of samples collected in different areas. From the study of literature, cultivar and harvesting year were recognized as the most significant interfering factors in the geographical characterization of reported agricultural foods, while seasonality was largely neglected or ignored and consequently, very few studies were available to fully evaluate the significance of this factor. Therefore, based on the literature, cultivar knowledge is indispensable for a correct interpretation of geographical differences, whereas the year of production had a significant impact only when the annual climatic conditions were extremely variable.
Finally, taking into account possible future prospects, the advantage of performing a preliminary study on the effect of cultivar and harvesting year effects should be considered in order to identify the geographical provenance of foods and to obtain a correct interpretation of differences only linked to growing areas.

Supplementary Materials

The following are available on line at https://www.mdpi.com/article/10.3390/separations8120230/s1, Table S1: Overview of the statistical approach used for food classification problems. In the table the statistical method applied (with a short definition), the type of food product involved and the reference papers are reported.

Author Contributions

All authors contributed to draft preparation, editing, and review of this manuscript. All authors have read and agreed to the published version of the manuscript.

Funding

This research received no external funding.

Institutional Review Board Statement

Not applicable.

Informed Consent Statement

Not applicable.

Data Availability Statement

Not applicable.

Acknowledgments

The opinions contained herein are the private views of the authors.

Conflicts of Interest

The authors declare no conflict of interest.

References

  1. Mannina, L.; Sorbolev, A.P.; Viel, S. Liquid state 1H high field NMR in food analysis. Prog. Nucl. Magn. Reson. Spectrosc. 2012, 66, 1–39. [Google Scholar] [CrossRef]
  2. D’Imperio, M.; Mannina, L.; Capitani, D.; Bidet, O.; Rossi, E.; Bucarelli, F.M.; Quaglia, G.B.; Segre, A.L. NMR and statistical study of olive oils from Lazio: A geographical, ecological and agronomic characterization. Food Chem. 2007, 105, 1256–1267. [Google Scholar] [CrossRef]
  3. Huo, Y.; Kamal, C.M.; Wang, J.; Liu, H.; Zhang, G.; Hu, Z.; Anwar, F.; Du, H. 1H NMR-based metabolomics for discrimination of rice from different geographical origins of China. J. Cereal Sci. 2017, 76, 243–252. [Google Scholar] [CrossRef]
  4. Kortesniemi, M.; Slupsky, C.M.; Ollikka, T.; Kauko, L.; Spevacek, A.R.; Sjövall, O.; Yang, B.; Kallio, H. 1H NMR profiling clarifies the characterization of Finnish honeys of different botanical origins. Food Res. Int. 2016, 86, 83–92. [Google Scholar] [CrossRef] [Green Version]
  5. Longobardi, F.; Ventrella, A.; Bianco, A.; Catucci, L.; Cafagna, I.; Gallo, V.; Mastrorilli, P.; Agostiano, A. Non-targeted 1HNMR fingerprinting and multivariate statistical analyses for the characterisation of the geographical origin of Italian sweet cherries. Food Chem. 2013, 141, 3028–3033. [Google Scholar] [CrossRef]
  6. Monakhova, Y.B.; Godelmann, R.; Kuballa, T.; Mushtakova, S.P.; Rutledge, D.H. Independent components analysis to increase efficiency of discriminant analysis methods (FDA and LDA): Application to NMR fingerprinting of wine. Talanta 2015, 141, 60–65. [Google Scholar] [CrossRef]
  7. Bachmann, R.; Klockmann, S.; Haerdter, J.; Fischer, M.; Hackl, T. 1H NMR spectroscopy for determination of the geographical origin of hazelnuts. J. Agric. Food Chem. 2018, 66, 11873–11879. [Google Scholar] [CrossRef]
  8. Caňo-Ochoa, S.; Ruiz-Aracama, A.; Guillén Lorén, M.D. Potential of Nuclear Magnetic Resonance for a discriminant characterization of PDOVOOs. Eur. J. Lipid Sci. Technol. 2019, 121, 1800137. [Google Scholar] [CrossRef]
  9. Consonni, R.; Cagliani, R.L. The potentiality of NMR-based metabolomics in food science and food authentication assessment. Magn. Reson. Chem. 2019, 57, 558–578. [Google Scholar] [CrossRef]
  10. Hohmann, M.; Christoph, N.; Wachter, H.; Holzrgrabe, U. 1H NMR profiling as an approach to differentiate conventionally and organically grown tomatoes. J. Agric. Food Chem. 2014, 62, 8530–8540. [Google Scholar] [CrossRef]
  11. Kosir, J.; Kocjancic, M.; Kidric, J. Wine analysis by 1D and 2D NMR spectroscopy. Analusis 1998, 26, 97–101. [Google Scholar] [CrossRef] [Green Version]
  12. Kuballa, T.; Brunner, T.S.; Thongpanchang, T.; Walch, S.G.; Lachenmeier, D.W. Application of NMR for authentication of honey, beer and spices. Curr. Opin. Food Sci. 2018, 19, 57–62. [Google Scholar] [CrossRef]
  13. Le Gall, J.; Colquhoun, I.J.; Davis, A.L.; Collins, G.J.; Verhoeyen, M.E. Metabolite Profiling of tomato (Lycopersiconesculentum) using 1H NMR Spectroscopy as a tool to detect potential unintended effects following a genetical modification. J. Agric. Food Chem. 2003, 57, 2447–2456. [Google Scholar] [CrossRef]
  14. Marcone, M.F.; Wang, S.; Albabish, W.; Nie, S.; Somnarain, D.; Hill, A. Diverse food-based application of nuclear magnetic resonance (NMR) technology. Food Res. Int. 2013, 51, 729–747. [Google Scholar] [CrossRef]
  15. Dona, A.C.; Kyriakides, M.; Scott, F.; Shephard, E.A.; Varshavi, D.; Veselkov, K.; Everett, J.R. A guide to the identification of metabolites in NMR-based metabonomics/metabolomics experiments. Comput. Struct. Biotechnol. J. 2016, 14, 135–153. [Google Scholar] [CrossRef] [Green Version]
  16. Ackermann, S.M.; Dolsophon, K.; Monakhova, Y.B.; Kuballa, T.; Reusch, H.; Thongpanchang, T.; Bunzel, M.; Lachenmeier, D.W. Automated multicomponent analysis of soft drinks using 1D 1H and 2D 1H-1H J-resolved NMR spectroscopy. Food Anal. Methods 2017, 10, 827–836. [Google Scholar] [CrossRef]
  17. Palmioli, A.; Alberici, D.; Ciaramelli, C.; Airoldi, C. Metabolomic profiling of beers: Combining 1H NMR spectroscopy and chemometric approaches to discriminate craft and industrial products. Food Chem. 2020, 327, 127025. [Google Scholar] [CrossRef]
  18. Khalili, B.; Tomasini, M.; Mattei, M.; Parera, R.M.; Sommez, R.; Krefl, D.; Rueldi, R.; Bergmann, S. Automated analysis of large-scale NMR data generates metabolomics signatures and links them to candidate metabolites. J. Proteome Res. 2019, 18, 3360–3368. [Google Scholar] [CrossRef] [Green Version]
  19. Perez, M. Autonomous driving in NMR. Magn. Reson. Chem. 2017, 55, 15–21. [Google Scholar] [CrossRef]
  20. Le Gresley, A.; Peron, J.M.R. A semi-automatic approach to the characterisation of dark chocolate by Nuclear Magnetic Resonance and multivariate analysis. Food Chem. 2019, 275, 385–389. [Google Scholar] [CrossRef]
  21. Izquierdo-Garcia, J.L.; Padro, D.; Villa, P.; Fadon, L. NMR based Metabolomics. Compr. Foodomics 2021, 2, 353–369. [Google Scholar]
  22. Sobolev, A.P.; Circi, S.; Capitani, D.; Ingallina, C.; Mannina, L. Molecular fingerprinting of food authenticity. Curr. Opin. Food Sci. 2017, 16, 59–66. [Google Scholar] [CrossRef]
  23. Agiomyrgianaki, A.; Petrakis, P.V.; Dais, P. Influence of harvest year, cultivar and geographical origin on Greek extravirgin olive oils composition: A study by 1H NMR spectroscopy and biometric analysis. Food Chem. 2012, 135, 2561–2568. [Google Scholar] [CrossRef]
  24. Caligiani, A.; Coisson, J.D.; Travaglia, F.; Acquotti, D.; Palla, G.; Palla, L.; Arlorio, M. Application of 1H NMR for the characterisation and authentication of “Tonda Gentile Trilobata” hazelnuts from Piedmont (Italy). Food Chem. 2014, 148, 77–85. [Google Scholar] [CrossRef]
  25. Caligiani, A.; Palla, L.; Acquotti, D.; Marseglia, A.; Palla, G. Application of 1H NMR for the characterisation of cocoa beans of different geographical origins and fermentation levels. Food Chem. 2014, 157, 94–99. [Google Scholar] [CrossRef]
  26. Dai, H.; Xiao, C.; Liu, H.; Hao, F.; Tang, H. Combined NMR and LC-DAD-MS analysis reveals comprehensive metabonomic variations for three phenotypic cultivars of Salvia Miltiorrhize Bunge. J. Proteome Res. 2010, 9, 1565–1578. [Google Scholar] [CrossRef]
  27. Del Coco, L.; Perri, E.; Cesari, G.; Muzzalupo, I.; Zelasco, S.; Simeone, V.; Schena, F.P.; Fanizzi, F.P. NMR-based metabolomics approach for EVOO from secular olive trees of Apulia region. Eur. J. Lipid Sci. Technol. 2013, 115, 1043–1052. [Google Scholar] [CrossRef]
  28. Girelli, C.R.; Accogli, R.; Del Coco, L.; Angilè, F.; De Bellis, L.; Fanizzi, F.P. 1H-NMR-based metabolomics profiles of different sweet melon (Cucumis melo L.) Salento varieties: Analysis and comparison. Food Res. Int. 2018, 114, 81–89. [Google Scholar] [CrossRef]
  29. Girelli, C.R.; Del Coco, L.; Fanizzi, F.P. 1H NMR spectroscopy and multivariate analysis as possible tool to assess cultivars, from specific geographical areas, in EVOOs. Eur. J. Lipid Sci. Technol. 2016, 118, 1380–1388. [Google Scholar] [CrossRef]
  30. Girelli, C.R.; Del Cocco, L.; Fanizzi, F.P. Tunisian extravirgin olive oil traceability in the EEC market: Tunisian/Italian (Coratina) EVOOs blend as a case study. Sustainability 2017, 9, 1471. [Google Scholar] [CrossRef] [Green Version]
  31. Girelli, C.R.; Del Cocco, L.; Zelasco, S.; Salimonti, A.; Conforti, F.L.; Biagianti, A.; Barbini, D.; Fanizzi, F.P. Traceability of “Tuscan PGI” extra virgin olive oils by 1H NMR metabolic profiles collection and analysis. Metabolites 2018, 8, 60. [Google Scholar] [CrossRef] [Green Version]
  32. Girelli, C.R.; De Pascali, S.A.; Del Cocco, L.; Fanizzi, F.P. Metabolic profile comparison of fruit juice from certified sweet cherry trees (Prunus avium L.) of Ferrovia and Giorgia cultivars: A preliminary study. Food Res. Int. 2016, 90, 281–287. [Google Scholar] [CrossRef]
  33. Godelmann, R.; Fang, F.; Humpfer, E.; Schütz, B.; Bansbach, M.; Schäfer, H.; Spraul, M. Targeted and non-targeted wine analysis. Differentiation of important parameters: Grape variety, geographical origin, year of vintage. J. Agric. Food Chem. 2013, 61, 5610–5619. [Google Scholar] [CrossRef]
  34. Kim, J.; Jung, Y.; Song, B.; Bong, Y.-S.; Ryu, D.H.; Lee, K.-S.; Hwang, G.S. Discrimination of cabbage (Brassica rapa ssp. pekinensis) cultivars grown in different geographical areas using 1H NMR-based metabolomics. Food Chem. 2013, 137, 68–75. [Google Scholar] [CrossRef]
  35. Magda, D.A.; Pirnau, A.; Feher, I.; Guyon, F.; Cozar, B.I. Alternative approach of applying 1H NMR in conjunction with chemometrics for wine classification. Food Sci. Technol. 2019, 109, 422–428. [Google Scholar] [CrossRef]
  36. Mannina, L.; Dugo, G.; Salvo, F.; Cicero, L.; Ansanelli, G.; Calcagni, C.; Segre, A.L. Study of the cultivar-composition relationship in Sicilian olive oils by GC, NMR, and statistical methods. J. Agric. Food Chem. 2003, 51, 120–127. [Google Scholar] [CrossRef]
  37. Mascellani, A.; Hoca, G.; Babisz, M.; Krska, P.; Kloucek, P.; Havlik, J. 1H NMR chemometric models for classification of Czech wine type and variety. Food Chem. 2021, 339, 127852. [Google Scholar] [CrossRef]
  38. Papadia, P.; DelCoco, L.; Muzzalupo, I.; Rizzi, M.; Perri, E.; Cesari, G.; Simeone, V.; Mondelli, D.; Schena, F.P.; Fanizzi, F.P. Multivariate analysis of 1H NMR spectra of genetically characterized extra virgin olive oils and growth soil correlations. J. Am. Oil. Chem. Soc. 2011, 88, 1463–1475. [Google Scholar] [CrossRef]
  39. Wei, F.; Furihata, K.; Koda, M.; Hu, F.; Kato, R.; Miyakawa, T.; Tanokura, M. 13C NMR-based metabolomics for classification of green coffee beans according to variety and origin. J. Agric. Food Chem. 2012, 60, 10118–10125. [Google Scholar] [CrossRef]
  40. Masetti, O.; Ciampa, A.; Nisini, L.; Sequi, P.; Dell’Abate, M.T. A multifactorial approach in characterizing geographical origin of Sicilian cherry tomatoes using 1H NMR profiling. Food Res. Int. 2017, 100, 623–630. [Google Scholar] [CrossRef]
  41. Girelli, C.R.; Calò, F.; Angilè, F.; Mazzi, L.; Barbini, D.; Fanizzi, F.P. 1H NMR spectroscopy to characterize Italian Extra Virgin Olive Oils blends, using statistical models and databases based on monocultivar reference oils. Foods 2020, 9, 1797. [Google Scholar] [CrossRef]
  42. Caruso, M.; Galgano, F.; Castiglione Morelli, M.A.; Viggiani, L.; Lencioni, L.; Giussani, B.; Favati, F. Chemical profile of white wines produced from ‘Greco bianco’ grape variety indifferent Italian areas by Nuclear Magnetic Resonance (NMR) and conventional physico chemical analyses. J. Agric. Food Chem. 2012, 60, 7–15. [Google Scholar] [CrossRef]
  43. Mannina, L.; Patumi, M.; Proietti, N.; Bassi, D.; Segre, A.L. Geographical characterization of Italian extra virgin olive oils using High Field 1-H NMR spectroscopy. J. Agric. Food Chem. 2001, 49, 2687–2696. [Google Scholar] [CrossRef]
  44. Merchak, N.; El Bacha, E.; Khouzam, R.B.; Rizk, T.; Akoka, S.; Bejjan, J. Geoclimatic, morphological, and temporal effects on Lebanese olive oils composition and classification: A 1H NMR metabolomic study. Food Chem. 2017, 217, 379–388. [Google Scholar] [CrossRef]
  45. Mannina, L.; Sorbolev, A.P. High resolution NMR characterization of olive oils in terms of quality, authenticity and geographical origin. Magn. Reson. Chem. 2011, 49, S3–S511. [Google Scholar] [CrossRef]
  46. Binetti, G.; Del Coco, L.; Ragone, R.; Zelasco, S.; Perri, E.; Montemurro, C.; Valentini, R.; Naso, D.; Fanizzi, F.P.; Schena, F.P. Cultivar classification of Apulian olive oils: Use of artificial neural networks for comparing NMR, NIR and merceological data. Food Chem. 2017, 219, 131–138. [Google Scholar] [CrossRef]
  47. Kokkinofta, R.I.; Theocharis, C.R. Chemometric Characterization of the Cypriot Spirit “Zivania”. J. Agric. Food Chem. 2005, 53, 5067–5073. [Google Scholar] [CrossRef]
  48. Papotti, G.; Bertelli, D.; Graziosi, R.; Silvestri, M.; Bertacchini, L.; Durante, C.; Plessi, M. Application of One and two-dimensional NMR spectroscopy for the characterization of Protected Designation of Origin Lambrusco wines of Modena. J. Agric. Food Chem. 2013, 61, 1741–1746. [Google Scholar] [CrossRef]
  49. Ritota, M.; Casciani, L.; Valentini, M. PGI chicory (Cichorium intybus L.) traceability by means of HRMAS-NMR spectroscopy: A preliminary study. J. Sci. Food Agric. 2013, 93, 1665–1672. [Google Scholar] [CrossRef]
  50. Lee, J.E.; Lee, J.B.; Chung, J.O.; Kim, H.N.; Kim, E.H.; Jung, S.; Lee, H.; Lee, S.J.; Hong, Y.S. Metabolomic unveiling of a diverse range of green tea (Camellia sinensis) metabolites dependent on geography. Food Chem. 2015, 174, 452–459. [Google Scholar] [CrossRef]
  51. Vlahov, G.; Schiavone, C.; Simone, N. Quantitative 13C NMR method using the DEPT pulse sequence for the determination of the geographical origin (DOP) of olive oils. Magn. Reson. Chem. 2001, 39, 689–695. [Google Scholar] [CrossRef]
  52. Alonso-Salces, R.M.; Moreno-Rojas, J.M.; Holland, M.V.; Reniero, F.; Guillou, C.; Héberger, K. Virgin Olive Oil authentication by multivariate analyses of 1H NMR fingerprints and δ13C and δ2H data. J. Agric. Food Chem. 2010, 58, 5586–5596. [Google Scholar] [CrossRef]
  53. Arana, V.A.; Medina, J.; Alarcon, R.; Moreno, E.; Heintz, L.; Scháfer, H.; Wist, J. Coffee’s country of origin determined by NMR: The Colombian case. Food Chem. 2015, 175, 500–506. [Google Scholar] [CrossRef]
  54. Boffo, E.F.; Tavares, L.A.; Tobias, A.C.T.; Ferreira, M.M.C.; Ferreira, A.G. Identification of components of Brazilian honey by 1H NMR and classification of its botanical origin by chemometric methods. LWT-Food Sci. Technol. 2012, 49, 55–63. [Google Scholar] [CrossRef] [Green Version]
  55. Filho, E.J.A.; Silva, L.M.A.; Ribeiro, P.R.V.; de Brito, E.S.; Zocolo, G.J.; Souza-Leǎo, P.C.; Marquez, A.T.B.; Quintela, A.L.; Larsen, F.H.; Canuto, K.M. 1HNMR and LC-MS-based metabolomic approach for evaluation for the seasonality and viticulturalpractices in wines from Sǎo Francisco River Valley, a Brazilian semi-arid region. Food Chem. 2019, 289, 558–567. [Google Scholar] [CrossRef]
  56. Donarski, J.A.; Jones, S.A.; Charlton, A.J. Application of cryoprobe 1H Nuclear Magnetic Resonance spectroscopy and multivariate analysis for the verification of Corsican honey. J. Agric. Food Chem. 2008, 56, 5451–5456. [Google Scholar] [CrossRef]
  57. Longobardi, F.; Innamorato, V.; Di Gioia, A. Geographical origin discrimination of lentils (Lens culinaris Medik.) using 1H NMR fingerprinting and multivariate statistical analyses. Food Chem. 2017, 237, 743–748. [Google Scholar] [CrossRef]
  58. Schievano, E.; Peggion, E.; Manni, S. 1H Nuclear Magnetic Resonance spectra of chloroform extracts of honey for chemometric determination of its Botanical Origin. J. Agric. Food Chem. 2010, 58, 57–65. [Google Scholar] [CrossRef]
  59. Sciubba, L.; Capuani, G.; Di Cocco, M.E.; Avanzato, D.; Delfini, M. Nuclear Magnetic Resonance analysis of water soluble metabolites allows the geographic discrimination of pistachios (Pistacia vera). Food Res. Int. 2014, 62, 66–73. [Google Scholar] [CrossRef]
  60. Tomita, S.; Nemoto, T.; Matsuo, Y.; Shoji, T.; Tanaka, F.; Nakagawa, H.; Ono, H.; Kikuchi, J.; Ohnishi-kameyama, M.; Sekiyama, Y. A NMR based, non-targeted multistep metabolic profiling revealed L-rhamnitol as a metabolite that characterised apples from geographical origins. Food Chem. 2015, 174, 163–172. [Google Scholar] [CrossRef]
  61. Belton, P.S.; Delgadillo, I.; Gil, A.M.; Roma, P.; Casuscelli, F.; Colquhoun, I.J.; Dennis, M.J.; Spraul, M. High-Field proton NMR studies of apple juices. Magn. Reson. Chem. 1997, 35, S52–S60. [Google Scholar] [CrossRef]
  62. Consonni, R.; Cagliani, R.L.; Stocchero, M.; Porretta, S. Evaluation of the production year in Italian and Chinese tomato paste for geographical determination using O2PLS models. J. Agric. Food Chem. 2010, 58, 7520–7525. [Google Scholar] [CrossRef]
  63. Culeddu, N.; Chessa, M.; Bandino, G.; Sedda, P.; Zurru, R.; Anedda, R.; Motroni, A.; Molinu, M.G.; Dettori, S.; Santona, M. Classification of monovarietal Sardinian Extra Virgin Olive Oils by 1H NMR metabolomic approach. Eur. J. Lipid Sci. Technol. 2017, 119, 1700035. [Google Scholar] [CrossRef]
  64. Kew, W.; Goodall, I.; Uhrín, D. Analysis of Scotch Whisky by 1H NMR and chemometrics yields insight into its complex chemistry. Food Chem. 2019, 298, 125052. [Google Scholar] [CrossRef] [PubMed]
  65. Rongai, D.; Sabatini, N.; Del Coco, L.; Perri, E.; Del Re, P.; Simone, N.; Marchegiani, D.; Fanizzi, F.P. 1H NMR and multivariate analysis for geographical characterization of commercial extra virgin olive oil: A possible correlation with climate data. Foods 2017, 6, 96. [Google Scholar] [CrossRef] [Green Version]
  66. Zheng, X.; Zhao, Y.; Wu, H.; Dong, J.; Feng, J. Origin Identification and Quantitative Analysis of Honeys by Nuclear Magnetic Resonance and Chemometric Techniques. Food Anal. Metod. 2016, 9, 1470–1479. [Google Scholar] [CrossRef]
  67. Lamanna, R.; Cattivelli, L.; Miglietta, M.L.; Troccoli, A. Geographical origin of durum wheat studied by 1H-NMR profiling. Magn. Reson. Chem. 2011, 49, 1–5. [Google Scholar] [CrossRef]
  68. Vlahov, G.; Del Re, P.; Simone, N. Determination of geographical origin of olive oils using 13C Nuclear Magnetic Resonance Spectroscopy. I-Classification of olive oils of Puglia region with Denomination of Protected Origin. J. Agric. Food Chem. 2003, 51, 5612–5615. [Google Scholar] [CrossRef]
  69. Tenori, L.; Santucci, C.; Meoni, G.; Morrocchi, V.; Matteucci, G.; Luchinat, C. NMR metabolomic fingerprinting distinguishes milk from different farms. Food Res. Int. 2018, 113, 131–139. [Google Scholar] [CrossRef]
  70. Donarski, J.A.; Jones, S.A.; Harrison, M.; Driffield, M.; Charlton, A.J. Identification of botanical biomarkers found in Corsicanhoney. Food Chem. 2010, 118, 987–994. [Google Scholar] [CrossRef]
  71. Masetti, O.; Nisini, L.; Ciampa, A.; Dell’Abate, M.T. 1H NMR spectroscopy coupled with multivariate analysis was applied to investigate Italian cherry tomatoes metabolic profile. J. Chemom. 2020, 34, e3191. [Google Scholar] [CrossRef]
  72. Anastasiadi, M.; Zira, A.; Magiatis, P.; Haroutounian, S.A.; Skaltsounis, A.L.; Mikros, E. 1H NMR-based metabonomics for the classification of Greek wines according to variety, region and vintage. Comparison with HPLC data. J. Agric. Food Chem. 2009, 57, 11067–11074. [Google Scholar] [CrossRef] [PubMed]
  73. Gougeon, L.; da Costa, G.; Le Mao, I.; Ma, W.; Teissedre, P.L.; Guyon, F.; Richard, T. Wine analysis and authenticity using 1H-NMR metabolomics data: Application to Chinese wines. Food Anal. Methods 2018, 11, 3425–3434. [Google Scholar] [CrossRef]
  74. Savorani, F.; Capozzi, F.; Engelsen, S.B.; Dell’Abate, M.T.; Sequi, P. Pomodoro di Pachino: An authentication study using1H-NMR and chemiometrics–protecting its P.G.I. European certification. Magn. Reson. Food Sci. 2009, 158–166. [Google Scholar]
  75. Lee, J.E.; Lee, J.B.; Chung, J.O.; Hwang, J.A.; Lee, S.J.; Lee, C.H.; Hong, Y.S. Geographical and climatic dependencies of green tea (Camellia sinensis) metabolites: A 1H NMR-based metabolomics study. J. Agric. Food Chem. 2010, 58, 10582–10589. [Google Scholar] [CrossRef] [PubMed]
  76. Masetti, O.; Ciampa, A.; Nisini, L.; Valentini, M.; Sequi, P.; Dell’Abate, M.T. Cherry tomatoes metabolic profile determined by1H-High Resolution-NMR spectroscopy as influenced by growing season. Food Chem. 2014, 162, 215–222. [Google Scholar] [CrossRef] [PubMed]
  77. Sacchi, R.; Mannina, L.; Fiordiponti, P.; Barone, P.; Paolillo, L.; Patumi, M.; Segre, A.L. Characterization of Italian extra virgin olive oils Using 1H-NMR spectroscopy. J. Agric. Food Chem. 1998, 46, 3947–3951. [Google Scholar] [CrossRef]
  78. Laincer, F.; Iaccarino, N.; Amato, J.; Pagano, B.; Pagano, A.; Tenore, G.; Tamendjari, A.; Rovellini, P.; Venturini, S.; Bellan, G.; et al. Characterization of monovarial extra virgin olive oils from the province of Béjaïa (Algeria). Food Res. Int. 2016, 89, 1123–1133. [Google Scholar] [CrossRef]
  79. Beteinakis, S.; Papachristodoulou, A.; Gogou, G.; Katsikis, S.; Mikros, E.; Halabalaki, M. NMR-based metabolic profiling of edible olives—Determination of quality parameters. Molecules 2020, 25, 3339. [Google Scholar] [CrossRef]
  80. Del Coco, L.; Mondelli, D.; Mezzapesa, G.N.; Miano, T.; De Pascali, S.A.; Girelli, C.R.; Fanizzi, F.P. Protected designation of origin extra virgin olive oils assessment by Nuclear Magnetic Resonance and multivariate statistical analysis: “Terra di Bari”, an Apulian (South east Italy) case study. J. Am. Oil Chem. Soc. 2016, 93, 373–381. [Google Scholar] [CrossRef]
  81. LeGall, J.; Colquhoun, I.J.; Defernez, M. Metabolite profiling using1H NMR spectroscopy for quality assessment of green tea, Camellia sinensis (L.). J. Agric. Food Chem. 2004, 52, 692–700. [Google Scholar] [CrossRef] [PubMed]
  82. Chae, Y.K.; Kim, S.H. Discrimination of rice products by geographical origins and cultivars by two-dimensional NMR spectroscopy. Bull. Korean Chem. Soc. 2016, 37, 1612–1617. [Google Scholar] [CrossRef]
  83. Monakhova, Y.B.; Rutledged, D.N.; Roßmanne, A.; Waiblingerf, H.U.; Mahlera, M.; Ilsea, M.; Kuballa, T.; Lachenmeier, D.W. Determination of rice type by 1H NMR spectroscopy in combination with different chemometric tools. J. Chemom. 2014, 28, 83–92. [Google Scholar] [CrossRef]
  84. Salazar, M.O.; Pisano, P.L.; Sierra, M.G.; Ricardo, L.E. NMR and multivariate data analysis to assess traceability of argentinecitrus. Microchem. J. 2018, 141, 264–270. [Google Scholar] [CrossRef]
  85. Viggiani, L.; Castiglione Morelli, M.A. Characterization of wines by Nuclear Magnetic Resonance: A work study on wines from the Basilicata region in Italy. J. Agric. Food Chem. 2008, 56, 8273–8279. [Google Scholar] [CrossRef]
  86. Gougeon, L.; da Costa, G.; Guyon, F.; Richard, T. 1H NMR metabolomics applied to Bordeaux red wines. Food Chem. 2019, 301, 125257. [Google Scholar] [CrossRef]
  87. Mannina, L.; Marini, F.; Gobbino, M.; Sobolev, A.P.; Capitani, D. NMR and chemometrics in tracing European olive oils: Thecase study of Ligurian samples. Talanta 2010, 80, 2141–2148. [Google Scholar] [CrossRef]
  88. Deborde, C.; Maucourt, M.; Baldet, P.; Bernillon, S.; Biais, B.; Talon, G.; Ferrand, C.; Jacob, D.; Ferry-Dumazet, H.; de Daruvar, A.; et al. Proton NMR quantitative profiling for quality assessment of greenhouse grown tomato fruit. Metabolomics 2009, 5, 183–198. [Google Scholar] [CrossRef]
Figure 1. A graphical summary of the selected papers that take into account seasonality, cultivar or production year in investigation of food provenance per year.
Separations 08 00230 g001
Figure 2. Schematic depiction of a typical NMR metabonomics experiment in food analysis.
Separations 08 00230 g002
Figure 3. PLS-DA score plot (t2 vs. t1) of 1H-NMR measurements in Naomi Pachino tomatoes seasonal comparison (Masetti et al., 2014).
Separations 08 00230 g003
Publisher’s Note: MDPI stays neutral with regard to jurisdictional claims in published maps and institutional affiliations.

