Article

Validated Modernized Assay for Foscarnet in Pharmaceutical Formulations Using Suppressed Ion Chromatography Developed through a Quality by Design Approach

1
Diduco AB, Tvistevägen 48C, 90736 Umeå, Sweden
2
Department of Chemistry, University of Prishtina, 10000 Prishtina, Kosovo
3
Department of Chemistry, Umeå University, 90187 Umeå, Sweden
*
Author to whom correspondence should be addressed.
Present address: Faculty of Bioscience & Engineering, KU Leuven, 3001 Leuven, Belgium.
Separations 2021, 8(11), 209; https://doi.org/10.3390/separations8110209
Submission received: 22 September 2021 / Revised: 5 October 2021 / Accepted: 11 October 2021 / Published: 5 November 2021
(This article belongs to the Special Issue Innovation of Analysis Methods in Pharmaceutical Chemistry)

Abstract

:
Inspired by the United States Pharmacopoeia (USP) “monograph modernization” initiative, we developed and validated an assay for foscarnet sodium injection solution (“foscavir”), following quality by design (QbD) principles, incorporating design of experiments (DoE) and multivariate data analysis to establish the design space and robust setpoint of the method. The resulting analytical procedure was based on ion chromatography (IC) with suppressed conductivity detection, employing an isocratic carbonate–bicarbonate eluent system. The assay was successfully validated at the robust setpoint conditions, according to the guidelines established by the International Council for Harmonization (ICH). The linear range stretched at least from 5 to 100 mg/L with high repeatability (relative standard deviation, RSD ≤ 0.3%) both at the target concentration (60 mg/L) and at 50% and 150% from this level. Special attention was given to establish a rugged assay that would be easily transferable between laboratories, and the recorded recoveries of 98.2–100.5% for both the formulated drug product and the drug substance during intermediate precision evaluation at different analysis situations indicated that this mission was accomplished. A multivariate assessment of intermediate precision data acquired using an experimental design scheme revealed that the assay was not adversely affected by any of the situation variables, including the use of different liquid chromatography instrument types, regardless of if they were constructed from inert materials or stainless steel that had been passivated, even though such problems have been reported in several previous methods for analysis of foscarnet.

Graphical Abstract

1. Introduction

The concept of quality by design (QbD) in chemical analysis method development is becoming increasingly demanded by regulatory bodies to mitigate risks and optimize the performance of quality control protocols applied in pharmaceutical manufacturing [1,2,3]. While analytical QbD is neither an entirely new nor unique approach and largely is based on tools that for long have been applied in chemical analysis [1], the structured concept still catalyzes a change of mindset and thus influence how separation method development is performed in laboratories, thus leading to better fit-for-purpose analysis procedures. Most published examples of applied QbD in liquid chromatography (LC) contexts are concerning reversed-phase (RP) mode [1,2,4], with some recent cases of hydrophilic interaction (HILIC) separation [5,6,7]. However, publications of QbD applied to ion chromatography (IC) seem to be very scarce or even non-existent despite the increased importance of IC in pharmaceutical quality control [8].
Slightly more than a decade ago, the United States Pharmacopoeia (USP) initiated the “monograph modernization” project [9] to highlight dated analysis protocols of components in approved pharmaceutical products, where the application of more modern approaches and techniques would have the potential to increase quality and certainty of the chemical analyses. Today, the list contains more than one thousand entries [10], and among them is the call for monograph methods for foscarnet sodium injection solution.
The polymerase inhibitor foscarnet (trisodium phosphonoformate hexahydrate) is an antiviral medication used to combat herpes viruses [11], including drug-resistant cytomegalovirus, and may be used to treat patients with late-stage HIV as part of salvage therapy [12,13]. The foscarnet molecule was first synthesized by the Swedish chemist Paul Nylén in 1924 [14] and later developed by AstraZeneca into a medication that was approved in 1991 under the brand name foscavir [15]. In 2010, Clinigen acquired the global rights to the drug [13], and earlier this year, the first generic version was introduced by Fresenius Kabi [16], who also has been manufacturing the drug for Clinigen [17]. The drug is approved in the European Union, USA, Japan, Australia, Mexico, and several additional countries [13], and it is available as a pH neutralized solution which is to be administered by controlled intravenous infusion, typically slowly and in a diluted form [16,17]. The assay for foscarnet sodium hexahydrate in the present version of the USP monograph [18] and corresponding analysis procedures in European Pharmacopoeia [19] uses a non-specific methodology based on titration with dilute sulfuric acid and a potentiometric endpoint determination and is thus not entirely suitable for pharmaceutical formulations such as injection solutions that may contain additional, potentially interfering, ionic species.
The present paper aims to address this gap and thus describes the development of an assay for foscarnet injection solution according to QbD principles involving a structured approach with design of experiments (DoE) and multiple probability Monte Carlo simulations to determine the method design space [20] using commercial software [21]. The analytical procedure was based on suppressed IC and was validated at the conditions representing the robust setpoint of the method. To satisfy pharmacopoeia requirements, method performance demands were aligned with recommendations from the United States Food and Drug Administration (FDA) [22], and validation was performed according to the Q2(R1) guidelines established by the International Council for Harmonization (ICH) [23]. Multivariate data analysis was performed on intermediate precision validation results acquired according to a DoE scheme in order to discover any systematic discrepancies between different operators, time of analysis, and between LC instruments constructed from different materials. Preliminary results from this study have previously been presented at scientific conferences [24,25].

2. Materials and Methods

2.1. Chemicals and Reagents

Sodium carbonate (≥99.5%) and sodium bicarbonate (≥99.5%) were from Merck (Darmstadt, Germany). Foscarnet sodium (secondary standard, certified reference material), foscarnet impurity B (EP reference standard), phosphate, sodium hydroxide solution (50%), and chloride standard for IC (1000 mg/L) were all from Sigma-Aldrich (Steinheim, Germany). Sodium phosphite dibasic pentahydrate (98%) was from Acros Organics (Geel, Belgium). Hydrochloric acid (37%, analytical reagent) was from VWR (Fontenay-sous-Bois, France). All water used in the study was ultrapure ‘Type I’ water produced by a Millipore (Bedford, MA, USA) Ultra-Q purification system and had a resistivity of ≥18 MΩ·cm at 25 °C.

2.2. Sample Preparation

All stock solutions and standards were prepared by weight in plastic containers constructed from polypropylene (PP) or polyethene (PE) that had been rinsed with water before use. Foscarnet stock solution was prepared by dissolving 50 mg of foscarnet sodium in 50 mL water. Stock solutions were further diluted in water to calibration standard concentrations ranging from 5 mg/L to 100 mg/L. Stock solution of disodium phosphite 1000 mg/L was prepared by dissolving 10 mg of sodium phosphite dibasic pentahydrate in 10 mL of water and then further diluted to 10 mg/L for analysis. Stock solution of foscarnet impurity B 200 mg/L was prepared in water and thereafter diluted to 20 mg/L standard solution for analysis.
The synthetic formulated drug product, foscarnet sodium injection solution 24 mg/mL (“foscavir”), was prepared by dissolving 960 mg of foscarnet sodium in 20 mL of water, where after the pH of the solution was adjusted to 7.4 using 1 M of hydrochloric acid, and the final volume of the solution was adjusted to 40 mL using deionized water added by weight. Then, the “foscavir” 24 mg/mL solution was diluted in water to the required concentrations for method validation.

2.3. Instrumentation

All chromatographic experiments were performed on a 250 × 4.0 mm Shodex IC SI-90 4E column (Showa Denko, Tokyo, Japan), and post-column eluent suppression was accomplished using a Xenoic® XAMS suppressor (Diduco AB, Umeå, Sweden) coupled to either an ASUREX-A100 (during development) or an ASUREX-A200 (during optimization and validation) automatic regenerator (Diduco AB). All interconnecting eluent flow paths between the point of injection and detection were constructed from minimum lengths of 1/16 inch OD, 0.25 mm ID poly(ether-ether-ketone), PEEK, tubing (Biotech AB, Onsala, Sweden), and a tee-piece fitting (swept volume 14 µL) equipped with a 100 psi (7 bar) pressure relief valve that was placed between the column and the suppressor.
Method development and part of the validation experiments (intermediate precision) were carried out using a PEEK-based Metrohm 761 Compact IC system (Metrohm AG, Herisau, Switzerland) and its build-in conductivity detector. Sample injection to the compact IC system was accomplished with the built-in manual injector during method development and using a Triathlon 900 autosampler (Spark Holland B.V., Emmen, The Netherlands) during validation. The experimental design and the majority of the validation were carried out on a stainless steel-based Shimadzu HPLC system (Kyoto, Japan), consisting of a SCL-10Asp system controller, a SIL-10A auto injector, two LC-20AD LC pumps, a CTO-10ACvp column oven, and a CDD-10Avp conductivity detector. The pump heads and flow path of the Shimadzu system had been passivated by a consecutive rinsing with dilute formic acid and phosphate at increased temperature according to established guidelines [26,27]. Different serial number XAMS suppressors were used in the two different suppressed IC systems during validation.
System control and acquisition of chromatographic data were accomplished using either IC net 2.3 SR6 software (Metrohm AG, Herisau, Switzerland) or LCsolution 1.25 (Shimadzu). Chromatographic parameters were calculated within the software where the tailing factor was defined according to USP, i.e., at 5% of the maximum peak height.
All eluents were prepared by weight and stored in 1 or 2-L Xenoic® EQAX polypropylene (PP) eluent bottles, which during eluent withdrawal were protected from carbon dioxide in ambient air by EQAX-TC1 trap cartridges (Diduco AB). Samples and standards were injected from 1.5 mL TopSert short thread PP vials (Merck KGaA, Darmstadt, Germany), except during method development when manual loop filling was performed using PP/PE syringes. The injection volume was in all cases 20 µL.
Weighing was performed on either an AG204 analytical balance or a PB3002 precision balance (both Mettler Toledo, Schwerzenbach, Switzerland). Determination of pH was accomplished using a Mettler Toledo SevenMulti equipped with a DG 115-SC combined glass electrode after careful two-point calibration using fresh calibration solutions.

2.4. Software

Experimental design and multivariate data analysis were performed using MODDE 13.0 software (Sartorius Stedim Analytic AB, Umeå, Sweden) according to the user instructions [21].

2.5. Validation Procedures

Specificity of the assay was investigated by injecting synthetic drug product “foscavir” solution (24 mg/mL) that had been diluted 400 times in water to 60 mg/L. Linearity was determined using seven standard solutions of foscarnet prepared at 5 mg/L, 10 mg/L, 20 mg/L, 40 mg/L, 60 mg/L, 80 mg/L, and 100 mg/L. The repeatability of the assay was evaluated both for the drug substance foscarnet and for the synthetic drug product “foscavir” by determining the relative standard deviation of recoveries at three different concentration levels, 30 mg/L, 60 mg/L, and 90 mg/L (corresponding to 50%, 100% and 150% of the target concentration), with three replicates at each level. The method accuracy was assessed in a similar manner by determining the recovery of a total of 9 samples of the synthetic drug product “foscavir” solution diluted to 30 mg/L, 60 mg/L, and 90 mg/L that was analyzed in triplicate. To evaluate method intermediate precision (ruggedness), three different test solutions of foscarnet standard solutions at 30 mg/L, 60 mg/L, and 90 mg/L were injected by different operators on different IC systems during three different days.

3. Results and Discussion

3.1. Method Goals and Circumstances

The first step of any structured development of a chemical analysis protocol, and definitively when following a QbD approach, is to establish the requirements of the final method and the circumstances under which it will be applied, and then to assess the chemical properties of the analyte and the other species in the sample. After that, a review of prior knowledge in the scientific literature, regarding the quantification of similar analytes in comparable samples, may assist in the selection of a suitable analytical technique and provide a starting point of conditions for method development and optimization. This knowledge is also used for risk assessment of the selected analysis technique and its conditions and for planning of strategies for risk mitigation.
Since the aim of this study was to develop an assay for foscarnet sodium injection solution, the method must be able to quantify foscarnet in the range of 24 mg/mL (or lower if dilution is applied before analysis) while simultaneously being able to discriminate between other species in the pharmaceutical formulation to ensure specificity for foscarnet. These requirements call for a separation step in the analytical procedure, and according to FDA guidelines [22], the chromatographic resolution (Rs) from the closest peak must then be at least 2, the analyte peak should have a retention factor (k’) above 2, a theoretical plate number (N) not less than 2000, and the tailing should not exceed 2. Naturally, the assay must also be reproducible and easily transferable between different instruments, analysts, and laboratories. It is further desirable that an assay method is quick and simple to perform and does not require expensive new equipment or complicated procedures.
Foscarnet (Figure 1) is a triprotic acid with pKa values of 0.49, 3.41, and 7.27 [28,29], and thus, it is multiply negatively charged at neutral pH and within most of the practical pH range. In the sodium hexahydrate salt form, foscarnet has a molecular weight of 300.0 g/mol [18], and the molecule is remarkably hydrophilic, as depicted by its predicted [30] negative logD value of −7.1 at neutral pH and spanning from −1.2 to −9.0 in the 0–14 pH range. Thus, the solubility in organic solvents is very low [29,31] but amounts to 5 wt % in water at pH 7 [32]. Its intrinsic light absorption capabilities are poor, and it has been concluded that wavelengths of 205 nm or less would be required to achieve sufficient analytical detection sensitivity [29,31]. Foscarnet has been reported to form complexes with several metal ions [33], and therefore, it often shows poor peak shapes during liquid chromatographic separations [29,31,33,34,35,36] and may adsorb to surfaces during sample preparation [35] unless precautions have been taken. Foscarnet is known to degrade into phosphate and phosphite (see Figure 1) while releasing carbon dioxide [28,37], especially in acidic aqueous solutions. A potential by-product from foscarnet synthesis is 1-ethoxy-1-hydroxyphosphinecarboxylic acid 1-oxide, which is registered as impurity B (see Figure 1) in pharmacopoeia methods [18,19].
The scientific literature does contain several published methods for the separation and analysis of foscarnet and other phosphonates [29,31]. The first example employed ion exchange separation, using a silica-based anion exchange column, an acetic acid eluent, and post-column reaction detection [34]. A later example of anion exchange separation used a polymethacrylate-based column using nitric acid eluent and conductivity detection [36]. Both these procedures utilized multi-acidic eluent additives such as citric acid [34] and succinic acid [36] in millimolar concentrations to mask strong interactions and achieve acceptable peak shapes. Other analysis protocols have been based on ion-pair reversed-phase liquid chromatographic separations with electrochemical detection (coulometry and amperometry) [33,35] or with ultra-violet light absorption detection [37,38,39] (presumably of the ion-pair complex), utilizing low amounts of sulfuric acid or pyrophosphoric acid as eluent additives to accomplish the needed peak shape improvement. More recent examples have exploited high pH suppressed ion chromatography with hydroxide gradient elution [40] and avoided the need for peak shape improving eluent additives by utilizing IC instruments where the pump heads, flow path, and column body were constructed from PEEK rather than being based on stainless steel.
The most attractive separation mode for our target analyte foscarnet that has such a hydrophilic character and multiple anionic properties was concluded to be suppressed IC. In this mode, we could fully benefit from its triple negative charge at higher pH versus the fewer charges of all the related compounds, including the degradation products phosphate and phosphite, the impurity B, and the chloride present in the pharmaceutical formulation. We further selected an eluent suppressor setup that can be combined with any instrument system for LC or IC and then passivated the flow path [26,41,42] if the instrument was based on stainless steel. As separation material, a rather low-capacity hydrophilic polyvinylalcohol-based anion exchanger in a PEEK column hardware (250 × 4 mm, 37 µeq/column) was selected to avoid the need for particularly strong eluents and limit the risk of peak deformation. The rather large particle size (9 µm) of this material would not necessarily be a drawback in the present context despite resulting in lower peak efficiency. It would give limited column pressure drop, thus possibly allowing faster flow rates to cut run times, and the larger peak volumes would make the method less sensitive to system dead volume and thus allow smooth method transfer between different instrument setups. An aqueous eluent system with a combination of carbonate and bicarbonate salts (with hydroxide as pH modifier if required) was favored, since such eluents are more resistant to sample pH effects due to their inherent buffer capacity, and they are typically easy to prepare and use routinely in isocratic mode with any type of LC instrument. To ensure perfect retention stability and avoid increasing noise and background levels, the eluent was prepared and stored in polypropylene plastic bottles and protected from ambient carbon dioxide by forcing all air entering the eluent bottle to pass through a cartridge containing a color-indicating carbon dioxide adsorption material. For details of the instrument setup and procedures, we refer to the Materials and Methods section.

3.2. Screening of Eluent Conditions

The initial screening of eluent conditions for separation of foscarnet from its related compounds phosphate, phosphite, and impurity B was accomplished with eluents with equal concentrations of sodium carbonate and sodium bicarbonate ranging from 5 mM to 10 mM of each salt. In addition, we screened higher pH conditions by employing a pure carbonate eluent and a pure hydroxide eluent. Although being present in the pharmaceutical formulation, chloride was not injected explicitly during this screening, since its single charge will force it to elute well before the other multiple charged related compounds and thus not constitute a risk of interference if foscarnet already is separated from phosphate, phosphite, and impurity B. Similarly, not all of the related compounds were injected with each eluent if some of the stipulated criteria already had failed.
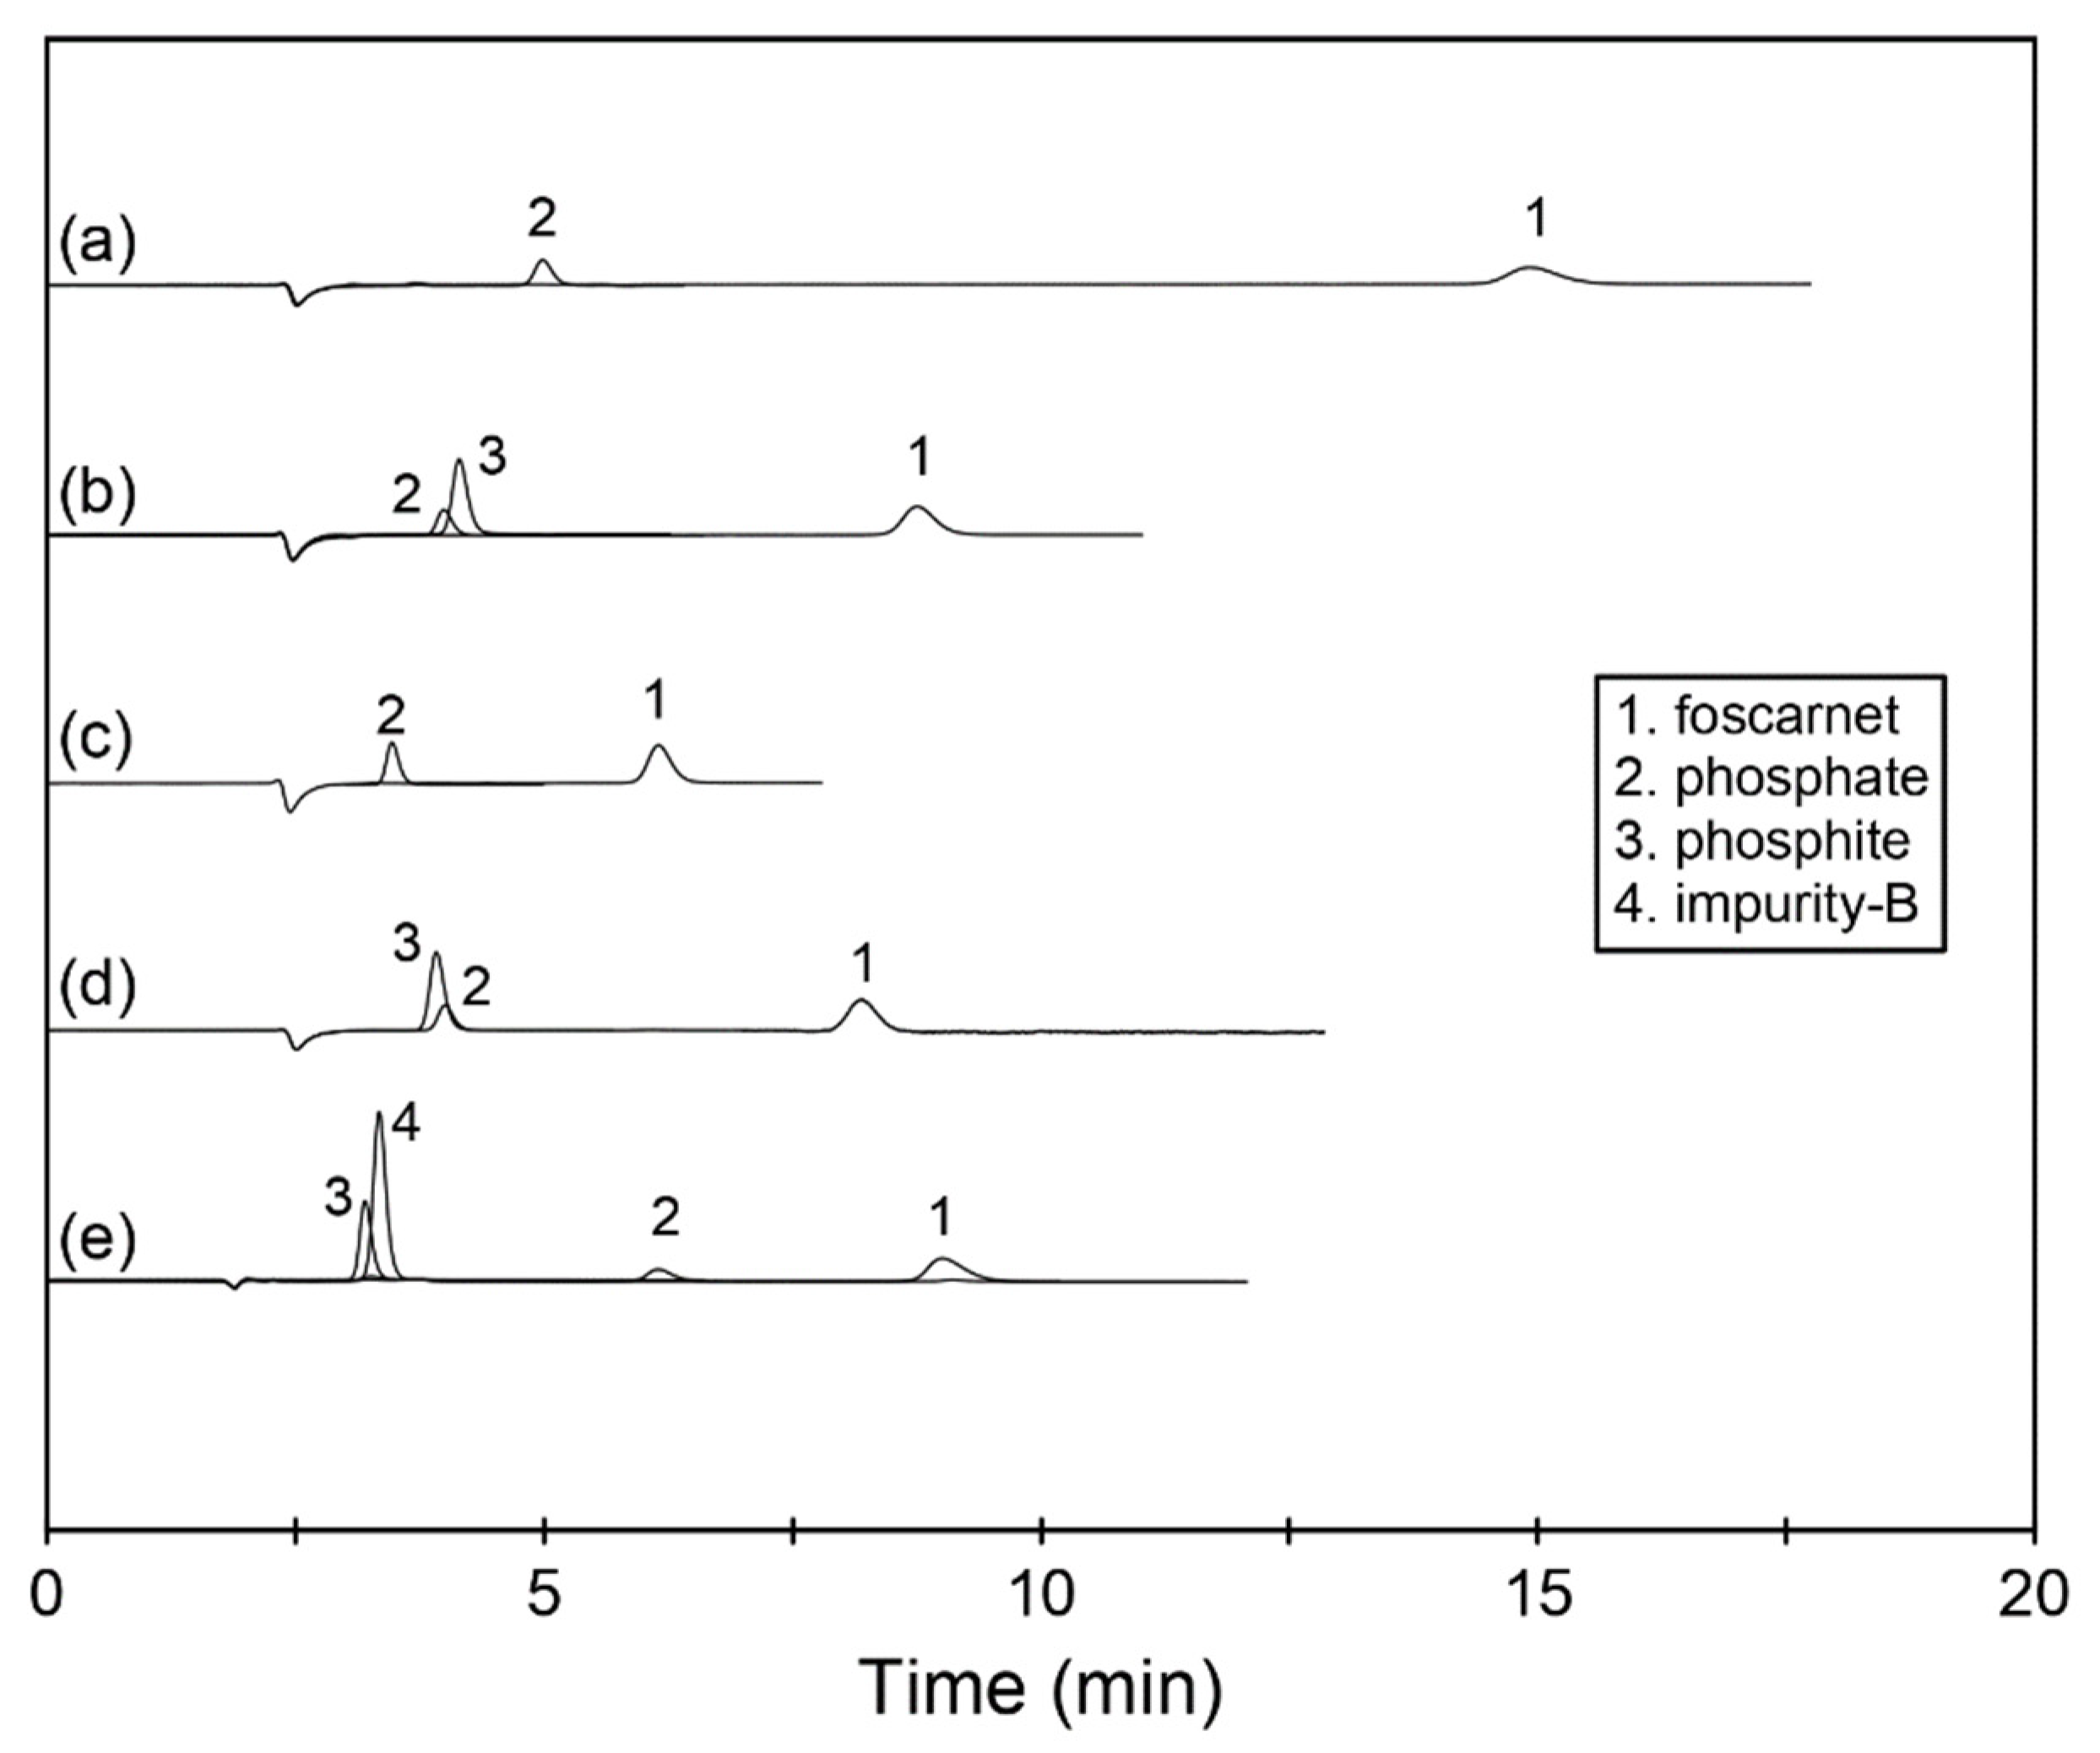
With all tested eluents, the foscarnet peak was well separated from all related compounds and displayed very good peak shape with acceptable efficiency; see Figure 2 and Table 1. However, the resolution criteria of >2 [22] was not fully met with the pure hydroxide eluent. The weakest eluent with 5 mM Na2CO3 and 5 mM NaHCO3 resulted in a retention time close to 15 min, which was deemed too long for an assay. The eluent containing 10 mM Na2CO3 and 10 mM NaHCO3 was too strong, as it resulted in a retention factor well below 2.0, which is a recommended minimum criterion [22]. However, the eluent with 7.5 mM Na2CO3 and 7.5 mM NaHCO3 did result in a separation that tentatively seemed to meet all the stipulated method criteria.
Since we wanted to better understand the possibilities of separation selectivity manipulation for foscarnet and for its related compounds that largely co-eluted with the first three eluents, two additional conditions with higher pH were explored. The eluent with 10 mM Na2CO3 resulted in a retention for foscarnet that was comparable to the bicarbonate–carbonate eluent containing 7.5 mM of each component. The selectivity between phosphate and phosphite changed slightly though, and the two species incompletely changed their elution order; see Figure 2. The reason for this behavior was concluded to be the further partial ionization among the population of phosphate ions.
Although the third pKa value for phosphate is 12.32 [43], and the dominating ionization form in both eluents (at pH 10.3 and 11.1) therefore is the double charged HPO42− ion, the increase in the proportion of triply charged molecules in the eluent with higher pH is probably responsible for this slight selectivity shift. Since neither phosphite nor impurity B can be ionized further than to a double negative charge, their selectivity appeared not to change with the modification of eluent pH.
The effect of additional ionization of phosphate from the double-charged HPO42− to the triply charged PO43− ion was even more evident when the eluent pH was increased even further to pH 12.6. With the 40 mM NaOH used to establish this pH, the retention for foscarnet, phosphite, and impurity B changed somewhat due to a change in the dominating eluting ion from carbonate to hydroxide, whereas the retention for phosphate changed dramatically, and it now eluted well separated from both foscarnet and the coeluted pair of phosphite plus impurity B. However, an unfortunate consequence of this change in pH was that the foscarnet peak started to show more tailing and thus broadened and lost separation efficiency.
Although not a focus of this study, these experiments also made it evident that to separate all the impurities with suppressed IC using carbonate–bicarbonate eluents, another column with additional selectivity features would be necessary. Our preliminary multivariate selectivity model for columns in suppressed IC [44,45] suggests that such a column should be a bit more hydrophobic to manage that type of separation.

3.3. Studying the Effect of Method Conditions Using Design of Experiments

As found in the screening experiments above, the mobile phase containing 7.5 mM Na2CO3 and 7.5 mM NaHCO3 provisionally appeared to meet the target criteria of the method. However, to better understand how the different method parameters contributed to the quality attributes of the method, an experimental design was performed around these experimental conditions. In addition to concentration of the two mobile phase components, the eluent flow rate and column temperature were included as method parameters (factors) in the design, as detailed in Table 2.
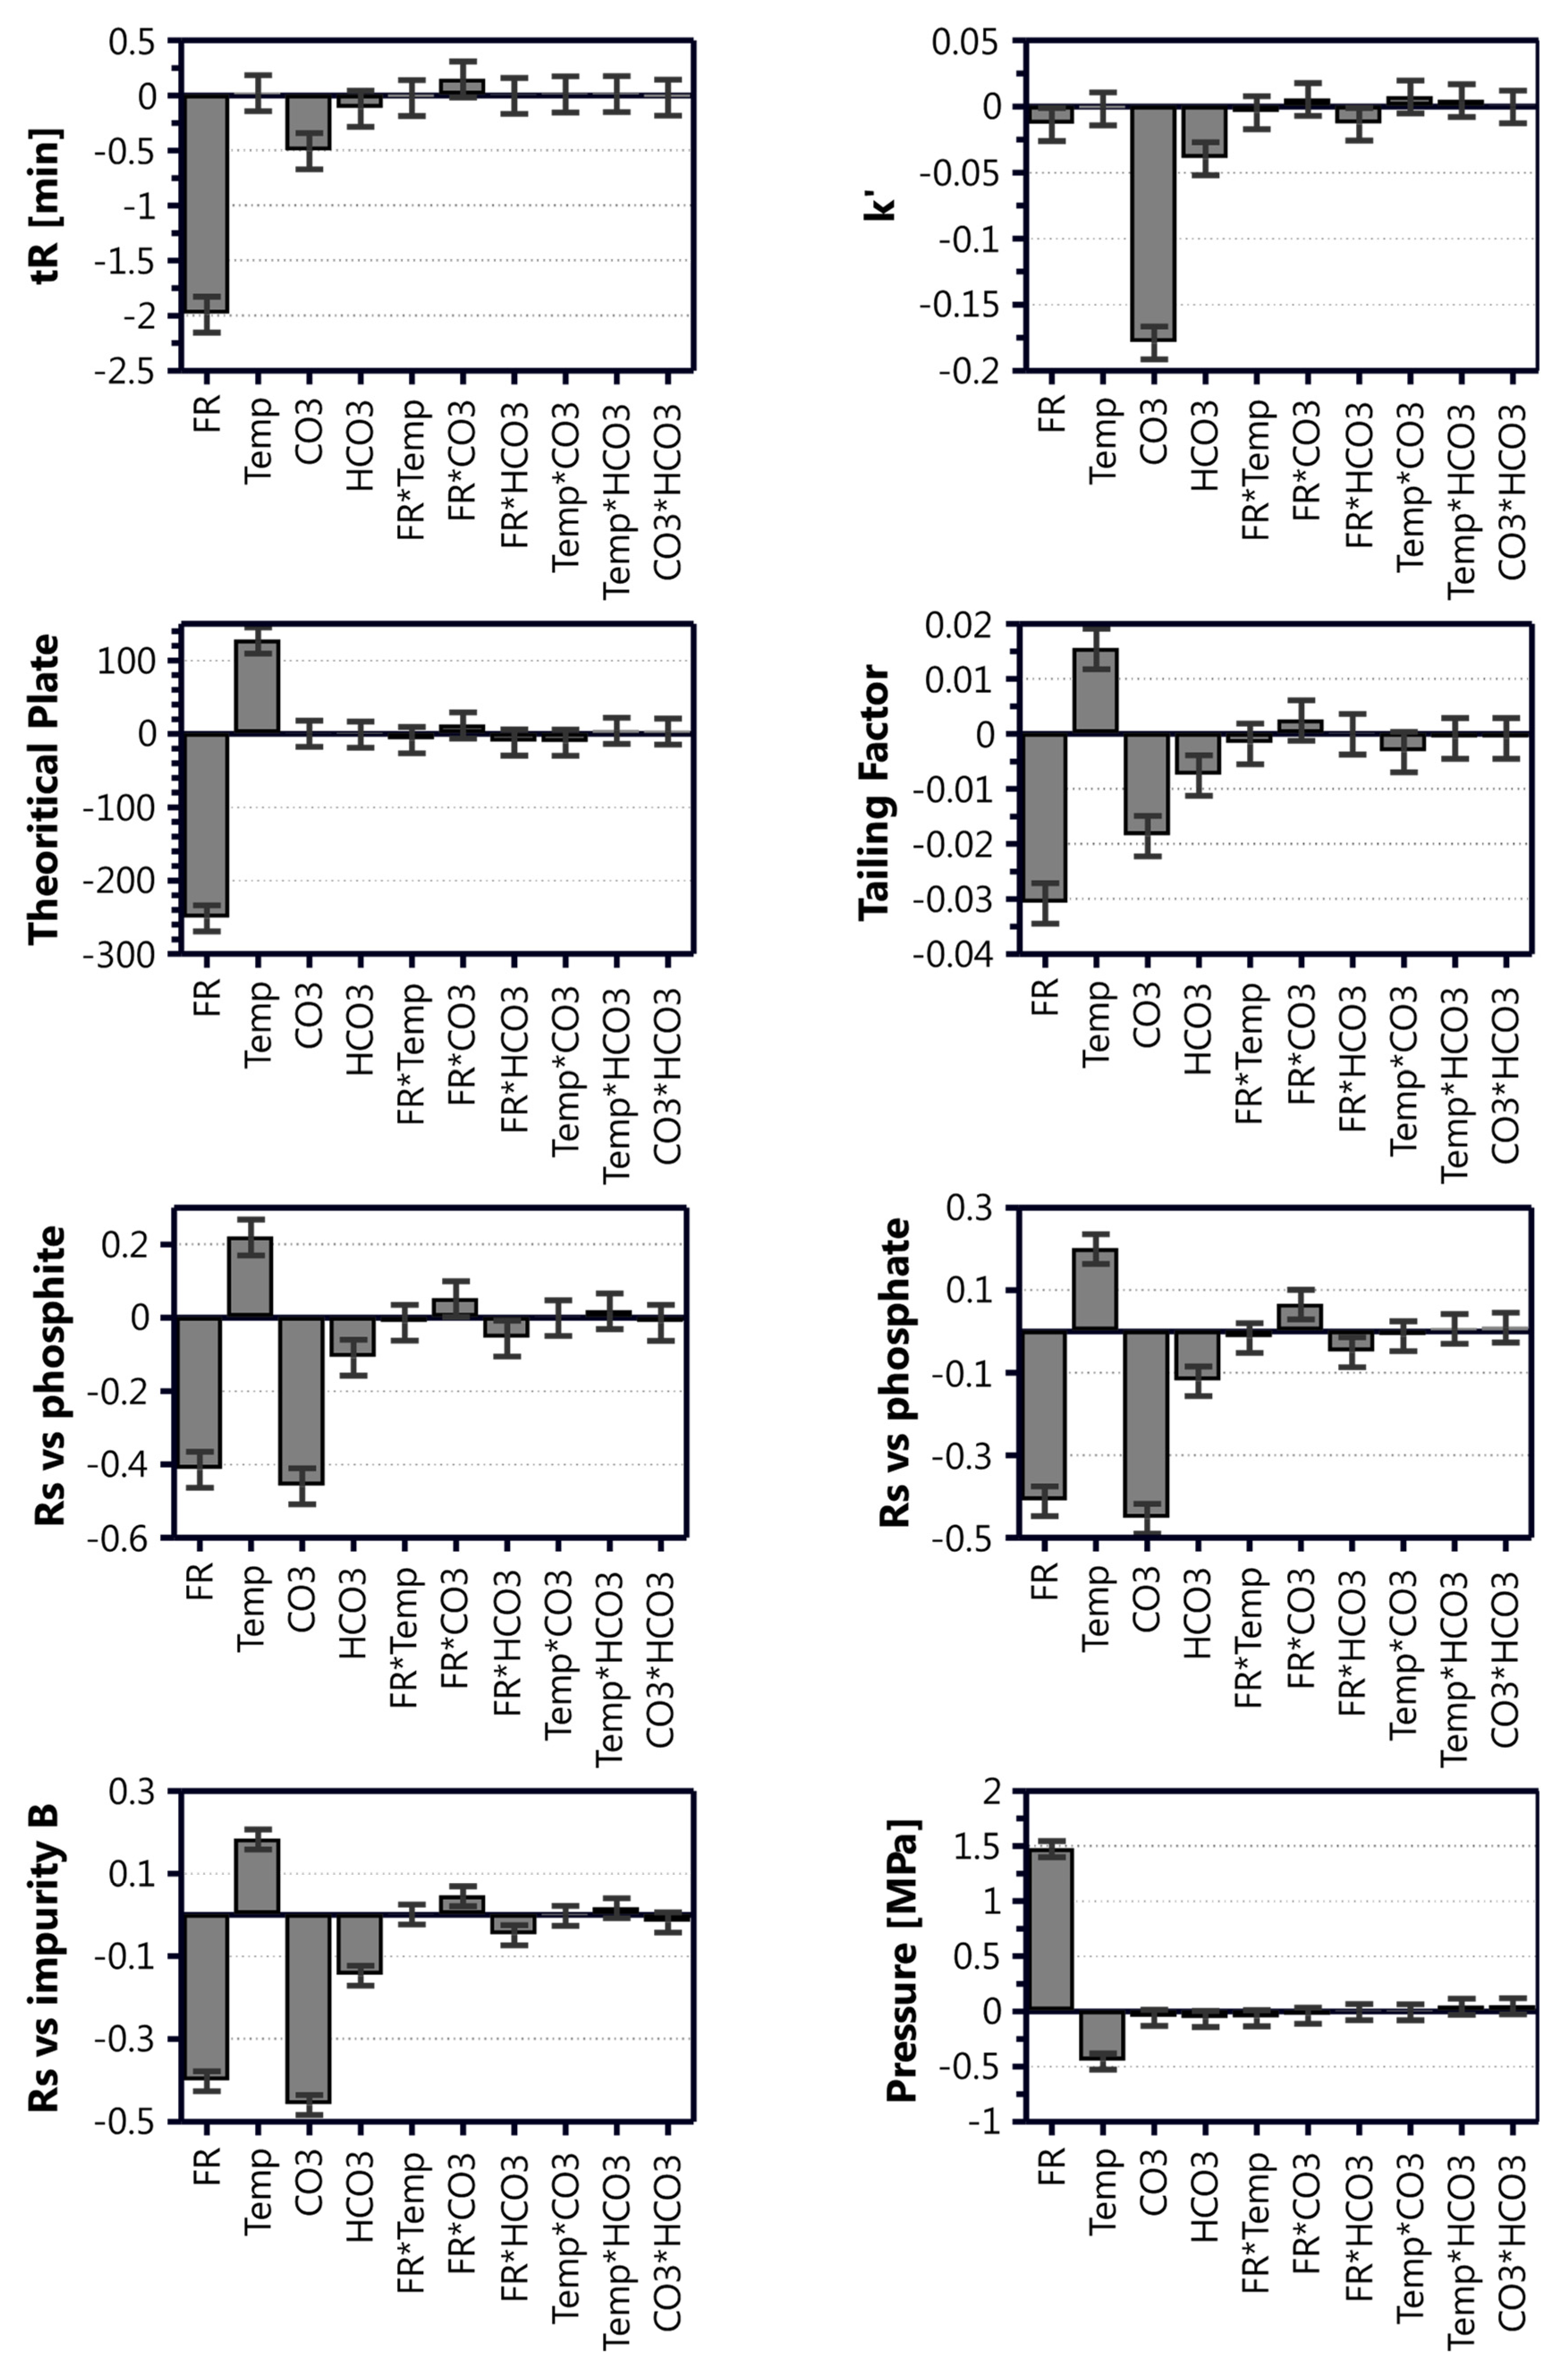
The eight quality attributes (responses) that were monitored included foscarnet retention time and retention factor, foscarnet peak efficiency and tailing, column back-pressure, and resolution between foscarnet and its related compounds phosphite, phosphate, and impurity B, respectively. The resulting full factorial design with four factors at two levels consisted of 19 experimental conditions in total, including three center point experiments. After performing these experiments in a fully randomized manner, the resulting data were subjected to multiple linear regression modeling to calculate the coefficients of each factor (method parameter) and their interactions to generate each type of response (the different quality parameters). The summary of fit for the model is outlined in Table 3, and the contributions of the different model coefficients and their interactions are illustrated in Figure 3.
In general, the data were highly reproducible, and most of the modeled quality control attributes showed excellent fit to the data and very high predictability, as manifested by the R2 and Q2 values displayed in Table 3. The tailing factor showed a slightly inferior model fit compared to the other quality control attributes, although it still displayed a good data fit with R2 just below 0.99 and an adequate predictability with Q2 above 0.88.
Inspection of the model coefficient plots in Figure 3 disclose the relative impact of the different parameters (factors) on the model attributes (responses). From this plot, it was clear that the interaction terms for all responses either were insignificant or very small in comparison to the single factor terms. The retention time was strongly affected by the flow rate and mobile phase composition, and the concentration of Na2CO3 had about four times stronger effect than NaHCO3. Higher concentrations of Na2CO3 and NaHCO3 reduced the retention time and retention factor, whereas the effect of temperature was insignificant on these attributes. The foscarnet peak was less tailing at higher flowrate and higher carbonate concentration, whereas higher temperature led to increased peak tailing. Low flow rate and high temperature within the studied range led to reduced peak efficiency with an increase in the number of theoretical plates, which is in good agreement with chromatographic theory [46]. The effect of the method parameters on the resolution of foscarnet to the related substances was quite similar across the different species. Better resolution was achieved when using a higher temperature, lower flow rate, and lower eluent salt concentrations, where the flow rate and Na2CO3 concentration had the most significant effect.

3.4. Method Optimization and Design Space Evaluation

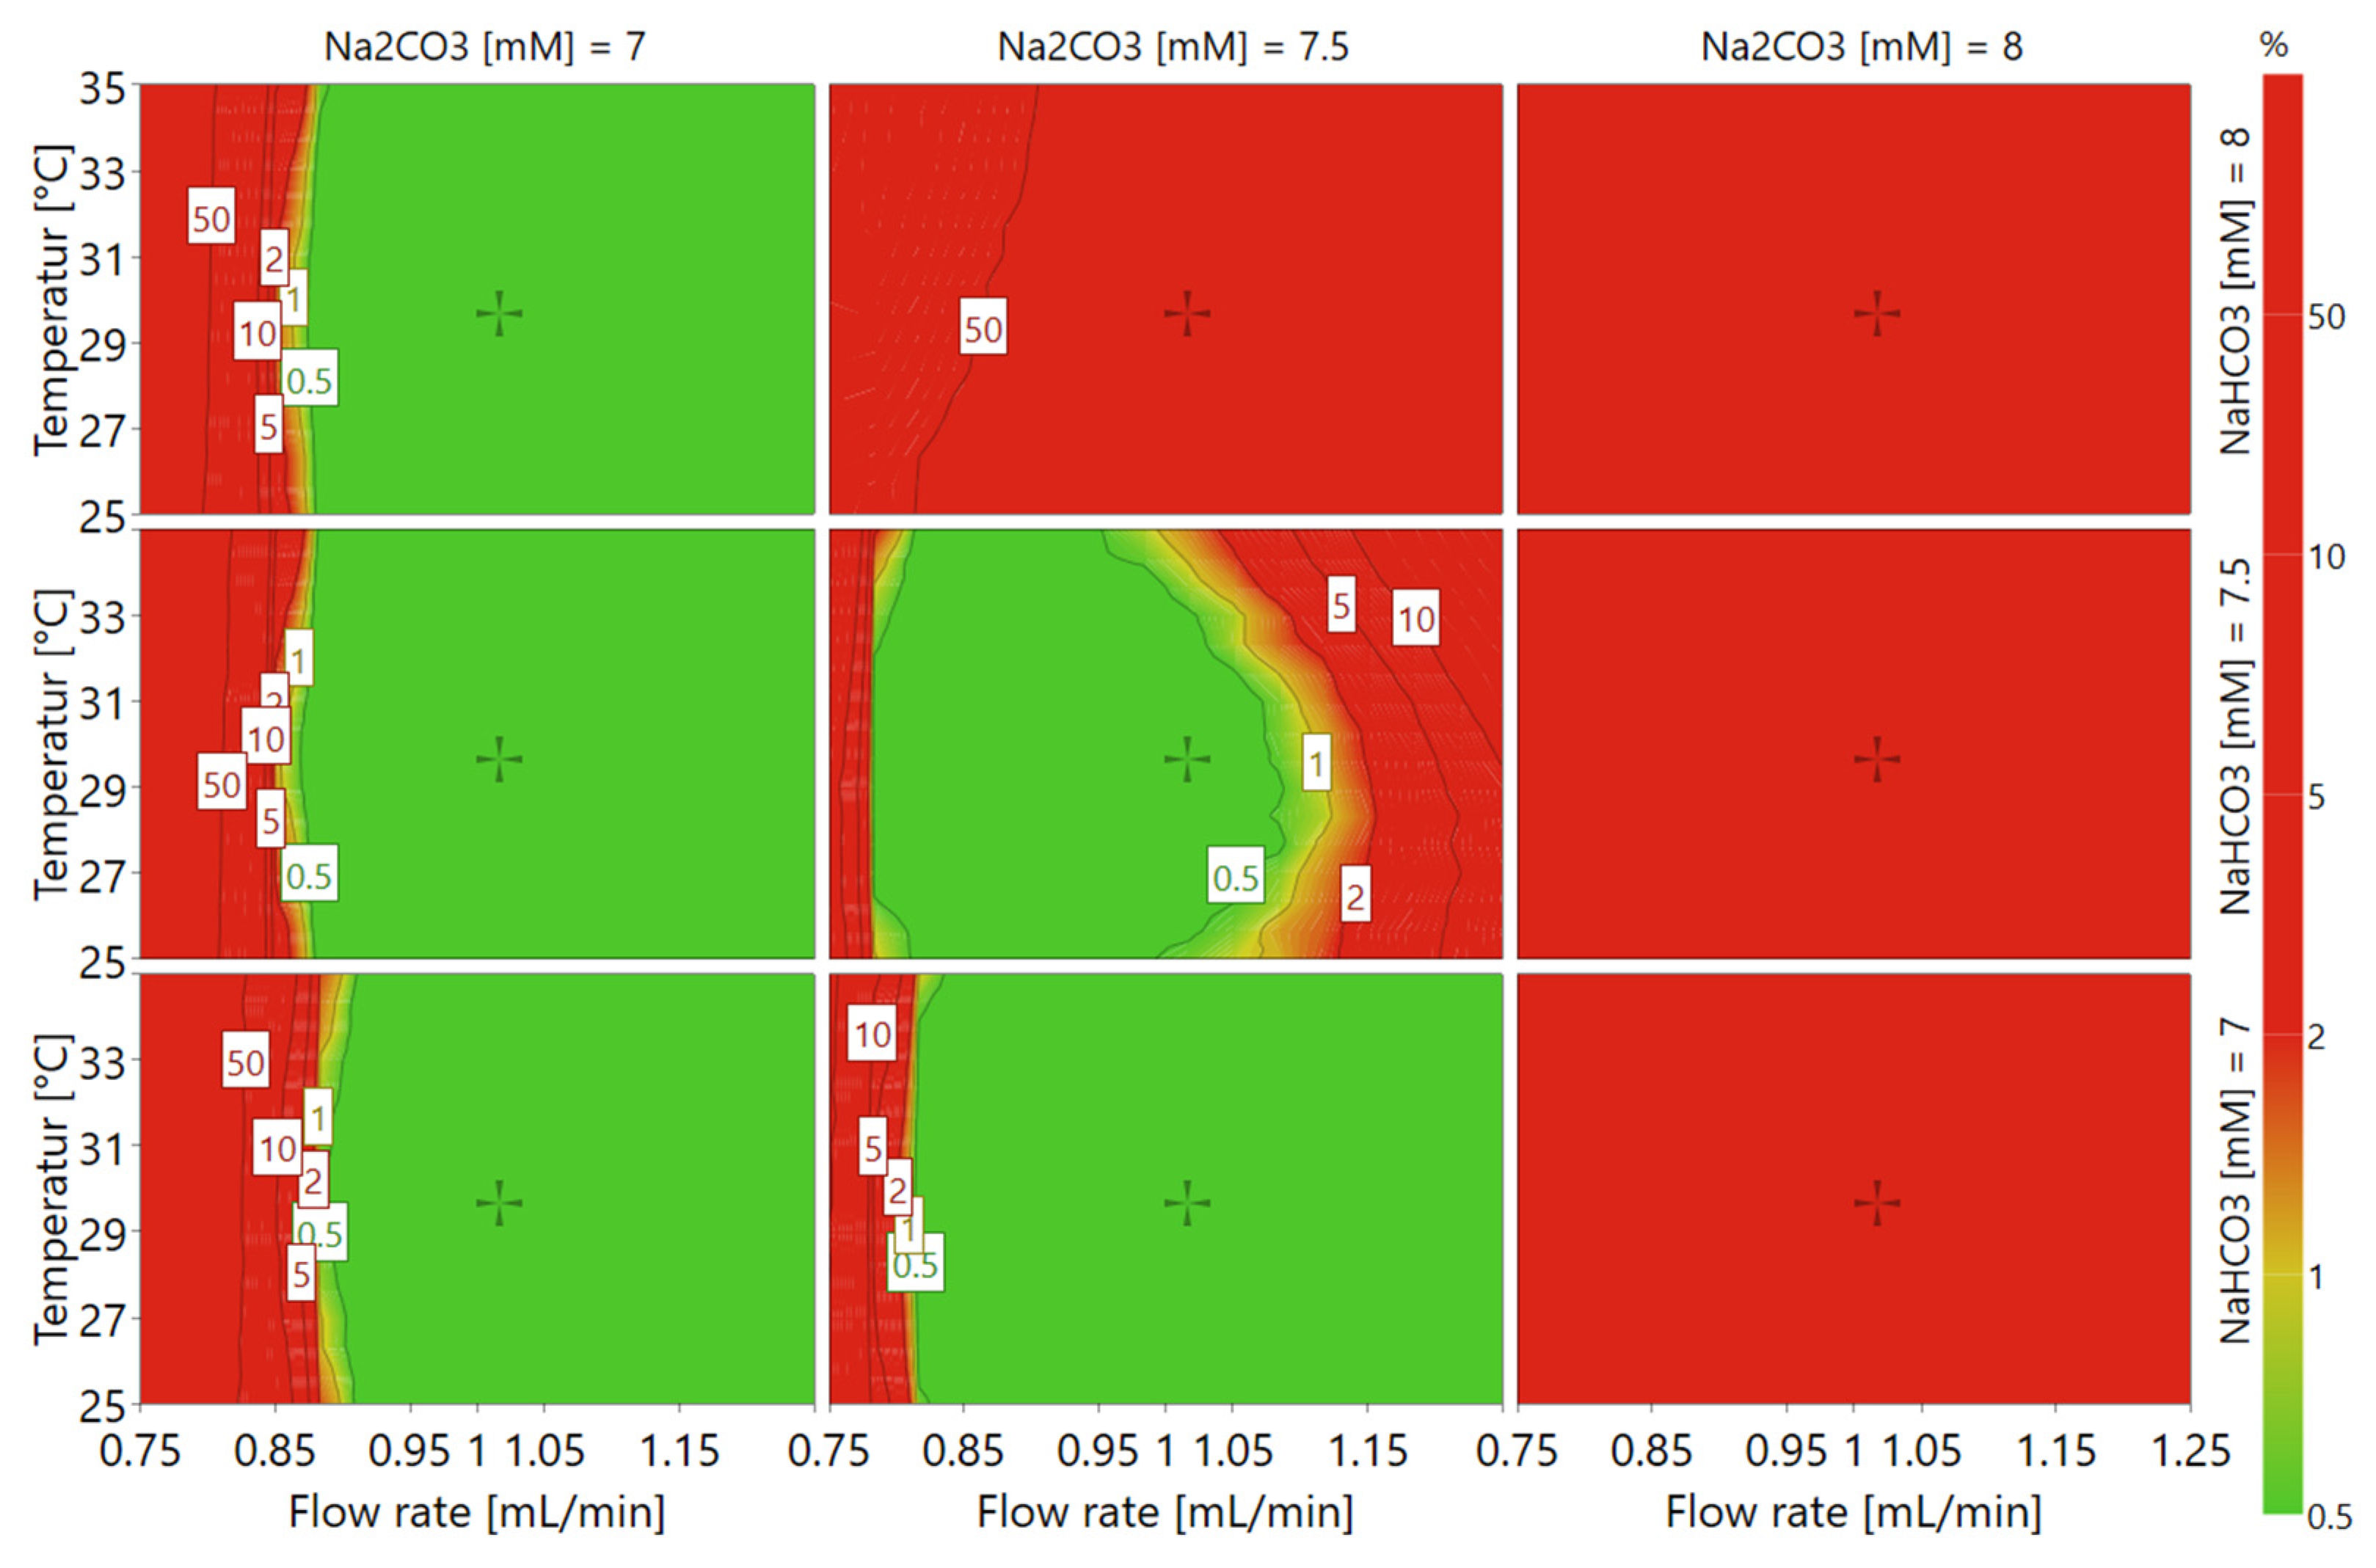
The limiting criteria for method optimization was set according to the FDA [22]; i.e., the retention factor and resolution should be more than 2, the tailing factor should be less than 2, and the number of theoretical plates should be more than 2000. The back-pressure limit was set according to the manufacturer specification for the applied column, which states below 10 MPa. The desired retention time was set to below 10 min, since the aim was to arrive at a quick assay method. Following the criteria set above, as summarized in Table 4, the design space was calculated utilizing multiple probability Monte Carlo simulations within the employed software [21] based on data from the experimental design. As illustrated by the resulting design space plot (Figure 4), conditions with high Na2CO3 concentration or low flow rate would likely result in the method failing to meet the set criteria and should thus be avoided, as represented by the red colored area. On the contrary, low eluent buffer salt concentrations and moderate flow rate assure that the method criteria would be met within most of the temperature range, as illustrated by the green colored area.
Since a short analysis time and good peak shape are highly desired in an assay, a method optimization was performed with the target to minimize the retention and tailing factor while maximizing the retention factor by utilizing the “find robust setpoint” calculation within the commissioned multivariate software [21]. The other attributes were not considered during this optimization, since the experimental results for these attributes always met the method criteria. The resulting optimum and robust setpoint values, plus the factor contributions and the predicted quality control attributes, are all listed in Table 5. In order to simplify the assay setup and make it easy to transfer between different operators and laboratories, we tweaked the operating conditions slightly by rounding the value of flowrate to 1.0 mL/min, the concentrations of Na2CO3 and NaHCO3 to 7.3 mM, and the temperature to 30 °C, which thus constitutes the conditions at which the method was validated. This condition did also show a very high probability of success within the design space (cf. Figure 4).

3.5. Method Validation

The developed method for the assay of foscarnet in injection solution was finally validated for specificity, linearity, accuracy, precision, and ruggedness, according to the principles set by the ICH [23] and adapted by the USP [47], using the procedures described in the materials and methods section. This involved comparing the results for foscarnet standard to that of the pharmaceutical formulation (“foscavir”), which is an aqueous solution that contains foscarnet plus chloride from pH adjustment by hydrochloric acid [17].

3.5.1. Specificity

During the method development above, it was shown that the resolution between foscarnet and all the related substances was well above 2, but it was not explicitly verified that the foscarnet peak was unaffected by chloride, which would be present in the foscarnet injection solution formulation. Therefore, the separation of the two species was tested, and as displayed in Table 6, the foscarnet peak had a resolution of more than 11 to the chloride peak, showing that foscarnet could be quantified independently of chloride.

3.5.2. Linearity and Range

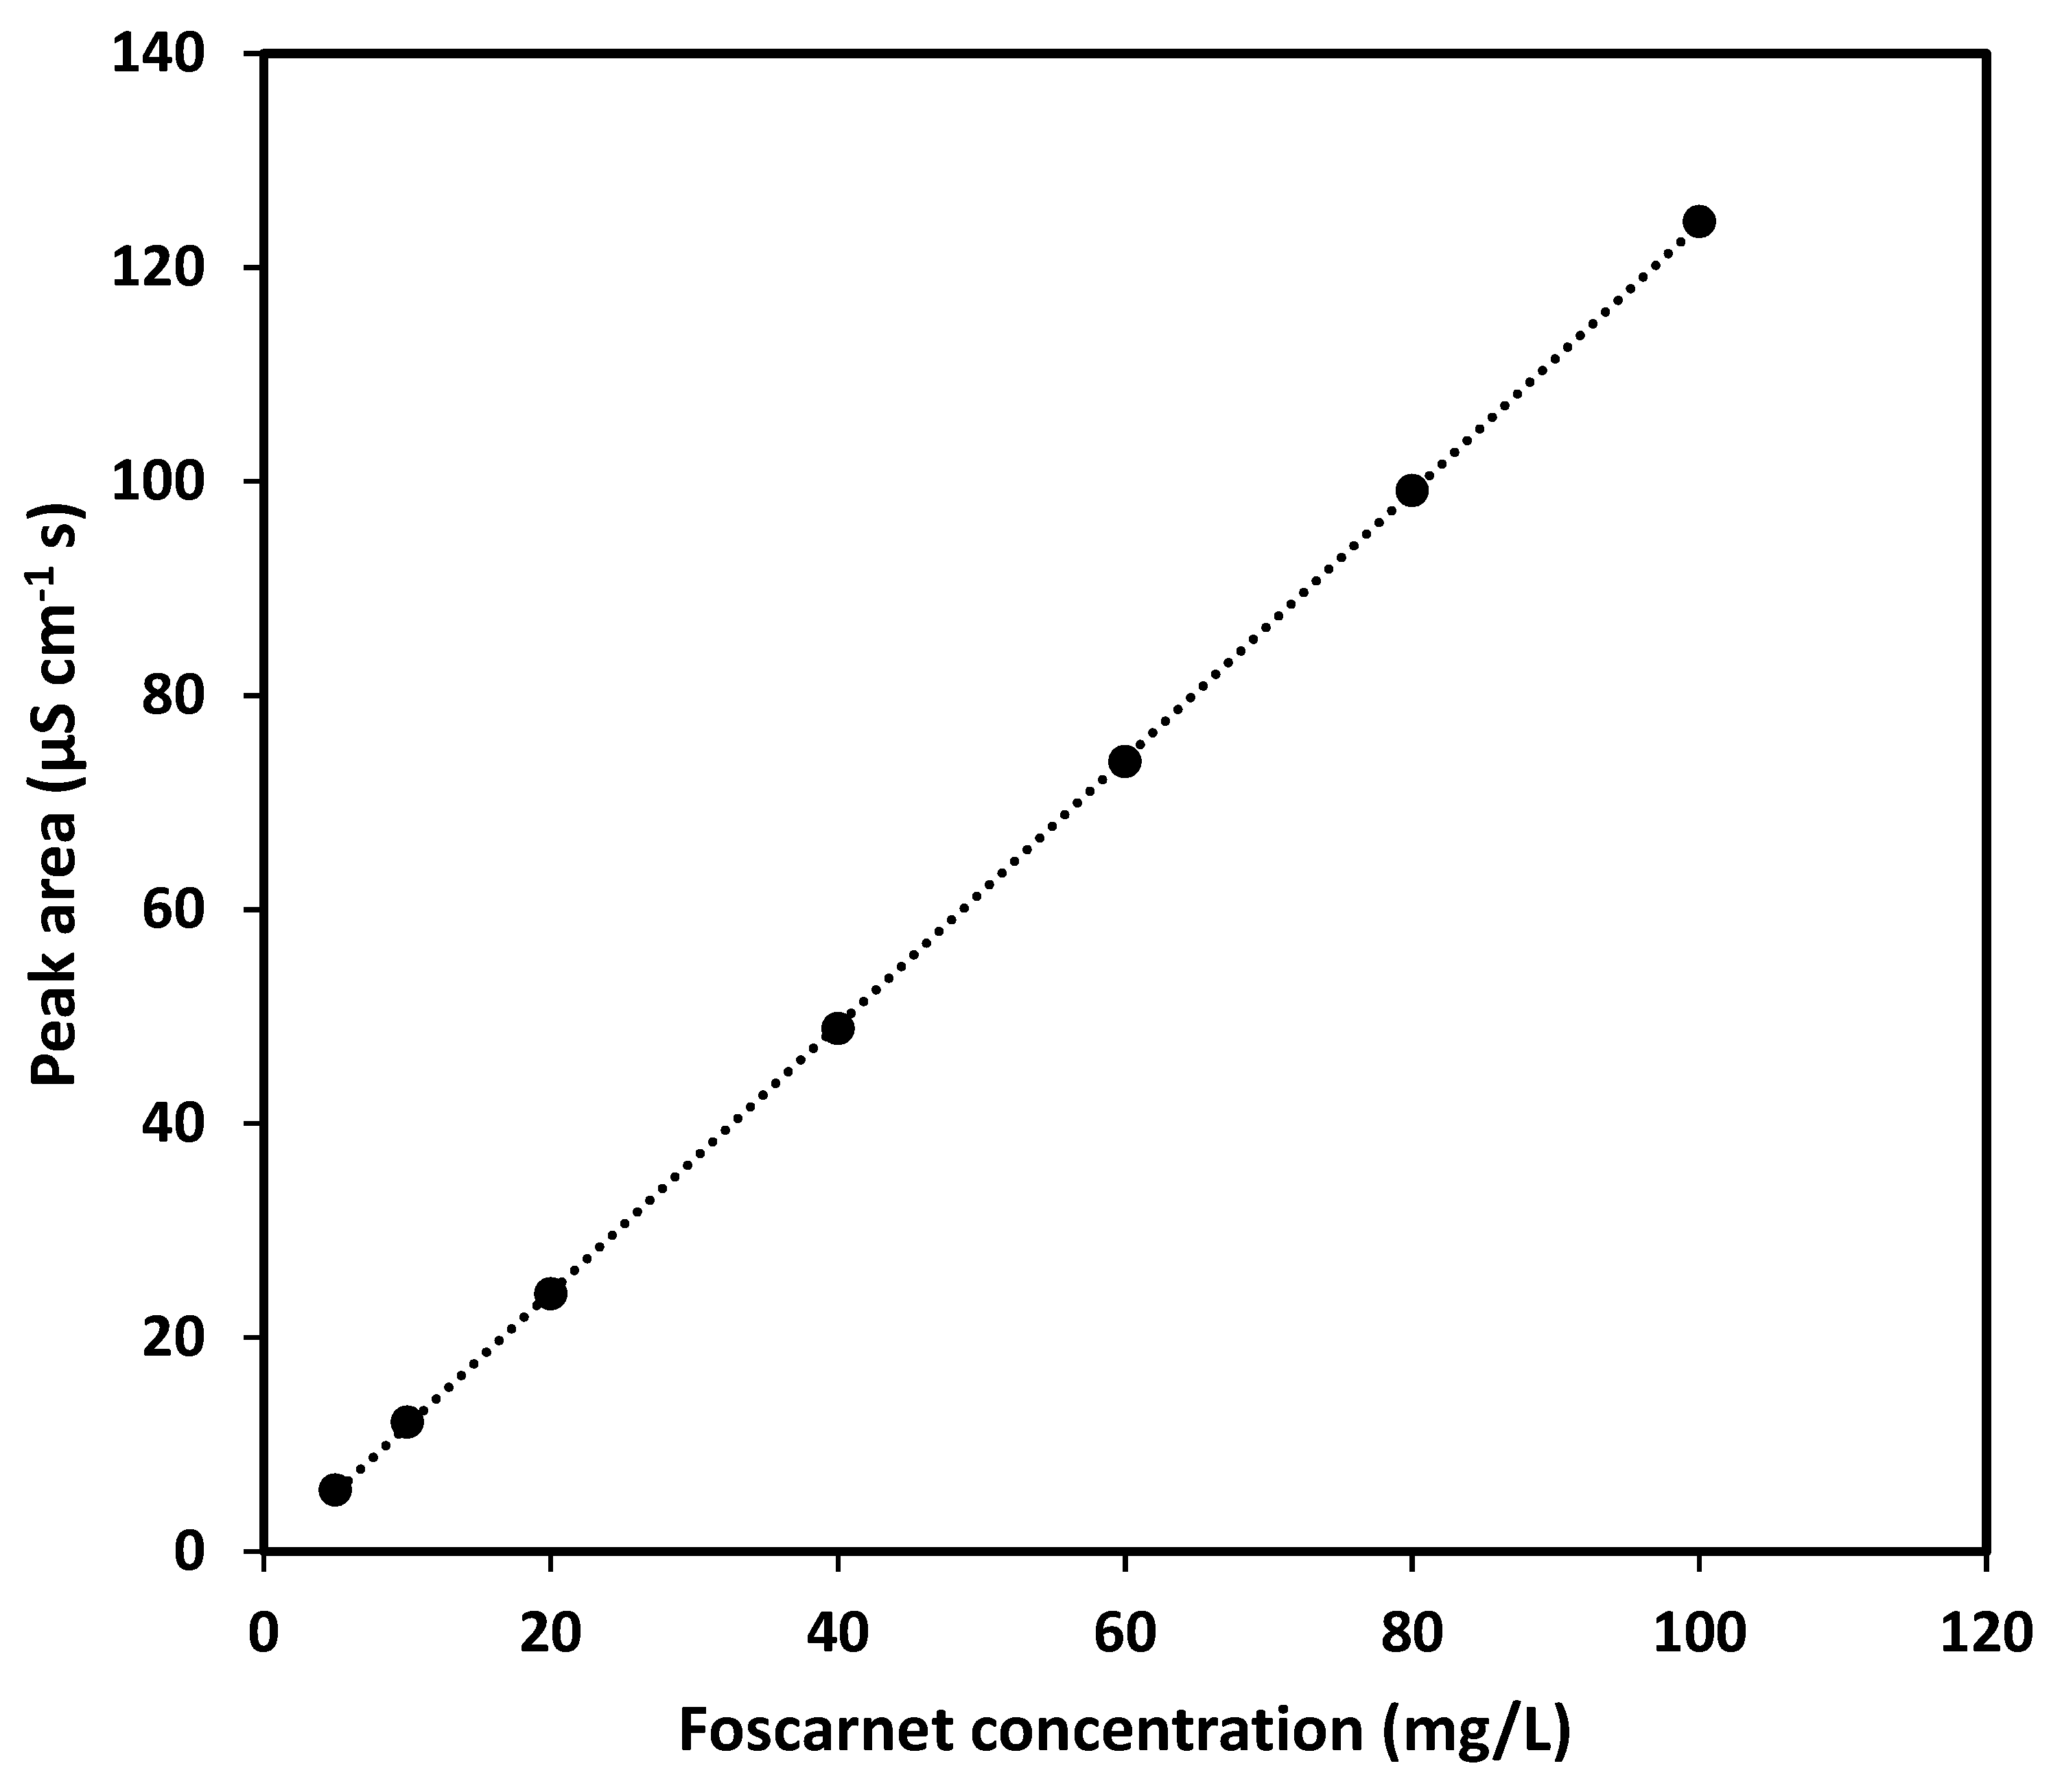
The linearity of foscarnet response was investigated in the range from 5 to 100 mg/L using seven concentration levels. The recorded calibration plot of peak area response of the foscarnet peak versus the prepared concentration of foscarnet showed an exceptionally good linearity with the regression coefficient equal to 1.000, see Figure 5. The linear regression equation was y = 1.247x + 0.726, where y is the peak area response (µS·cm−1·s) and x is the concentration (mg/L) of foscarnet in the sample. The relative standard deviation (RSD) of the slope and intercept were 0.27% and 26%, respectively. The target concentration (100% level) of the assay was selected to 60 mg/L, where the intercept was less than 1% of the response and the range from 50% to 150% was fully covered by the linear calibration range.

3.5.3. Repeatability and Accuracy

The repeatability and accuracy of the method were validated both for the pure foscarnet drug substance in water and for the formulated foscarnet drug product (“foscavir”) injection solution. For each type, a total of nine determinations were performed at three different levels (50%, 100%, and 150%) with three replicates at each level (Table 7). The recoveries for both the formulated drug product and the drug substance, at all concentration levels, were in the range of 98.9–100.2%, with a very high repeatability (RSD ≤ 0.3%). It should be noted that we used an even larger spread of concentration levels in this validation compared to what is required by FDA, ICH, and USP (80–120%) [22,23,47], but accuracy and repeatability were still well within the recommended limits (98–102% and 1%, respectively).

3.5.4. Intermediate Precision

The ruggedness, i.e., the intermediate precision, of the assay was validated by monitoring the recovery while the analysis conditions were varied in a structured manner according to a DoE incorporating two operators, two instruments (stainless steel and inert), three days, and three different concentration levels (50%, 100%, and 150%), which were designed to spot and quantify systematic variations. All 72 experiments were executed, and the resulting data are collected in Table 8. It was noted that despite the variation of conditions, the intermediate precision was well within the recommended levels. The recoveries of the drug substances and formulated drug product varied in the range of 98.3–100.5% (RSD = 0.5%) and 98.2–100.3% (RSD = 0.6%), respectively. These results also again confirm the specificity in the quantification of foscarnet in the presence of chloride.
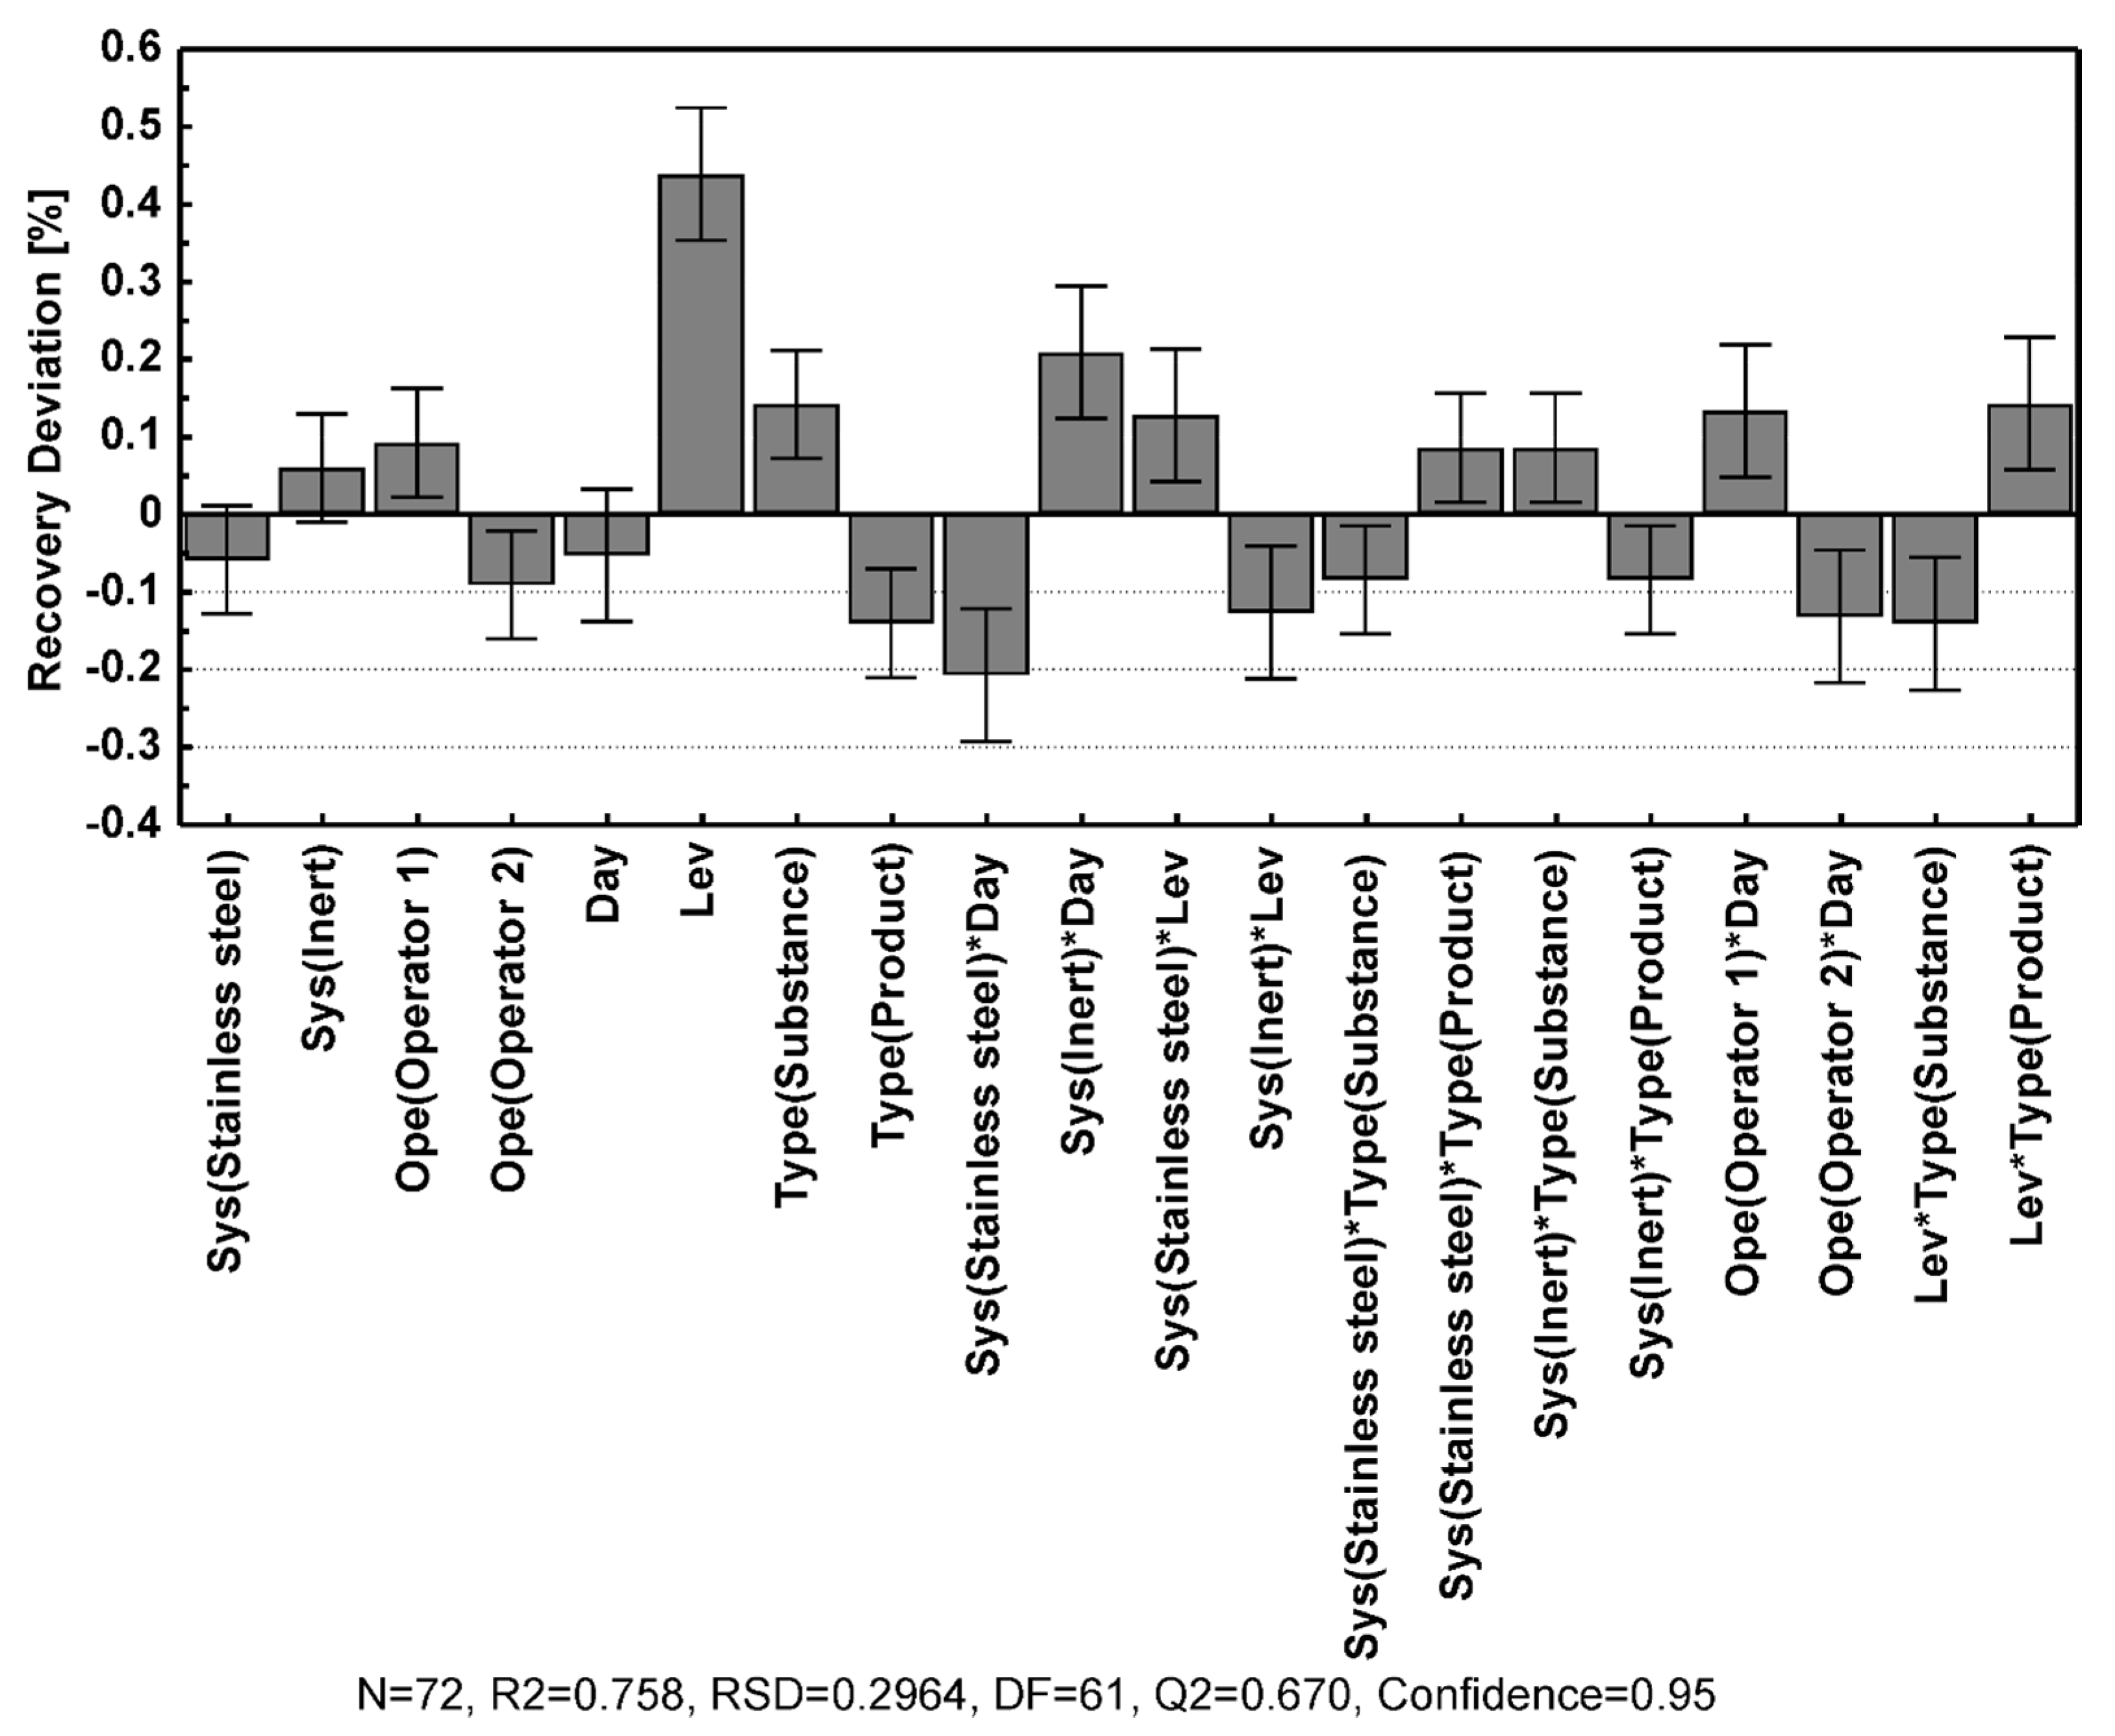
Since these experiments were conducted according to an experimental design, the specific contribution from each analysis condition to deviation from the average recovery could be assessed through the coefficient plot of the multi-linear regression model constructed from the systematized data. As displayed in Figure 6, the concentration level had the highest influence on recovery, where the higher level resulted in somewhat increased recovery; however, the total effect was about 0.43% and thus still within the acceptable range. The sample type (drug substance or drug product) was also a significant effect where the drug substance tended to provide a slightly higher recovery than the formulated drug product. However, the difference was very small (≤0.15%) and could be due to the uncertainty of preparation. The operator had a certain influence on the recovery; however, the effect was very small (<0.1%). The system type and inter-day conditions were both insignificant and did thus not have any effect on the recovery results.
The good results from the repeatability study (RSD ≤ 0.3%) together with the data from the intermediate precision experiments and its related coefficient analysis showing low influence from both random and systematic variation all suggest that the developed assay has a high overall precision at the optimized operation conditions and will likely be straightforward to transfer between different laboratories.

4. Conclusions

An assay for the determination of foscarnet in pharmaceutical formulations such as injection solutions was successfully developed, risk assessed, and validated using QbD approaches. The analytical procedure was proven to have good accuracy and high precision concerning both repeatability and intermediate precision that would meet the criteria in the ICH guidelines and recommendations from regulatory authorities. The assay showed a good inter-day stability and was compatible with both stainless steel and inert ion chromatography systems.
In a wider perspective, QbD approaches are expected to grow in importance because they allow risk mitigation during the development of chemical analysis procedures that should be validated against pharmacopoeia requirements. Thus, this work may serve as a case study on how suppressed ion chromatography methods can be developed and optimized using DoE and how this can impact the determination and visualization of the design space where methods are expected to be successfully validated. The additional experimental design and multivariate data evaluation applied during the validation step in this work show how such approaches can reveal sources of systematic errors or allow conclusions of their absence. This adds valuable information about how different operating circumstances impact the analytical result and thus may manifest how transferable an analysis procedure could be between different laboratories.

Author Contributions

Conceptualization, T.J. and N.P.D.; Methodology, N.P.D. and A.S.; Validation, A.S. and N.P.D.; Investigation, G.H., A.S. and N.P.D.; Data Curation, N.P.D., A.S. and G.H.; Writing—Original Draft Preparation, T.J. and N.P.D.; Writing—Review and Editing, T.J., N.P.D., A.S. and G.H.; Supervision, T.J. and N.P.D.; Project Administration, T.J.; Funding Acquisition, T.J. All authors have read and agreed to the published version of the manuscript.

Funding

This research received no external funding.

Data Availability Statement

Data generated in this study is contained within the article.

Acknowledgments

Solomon Tesfalidet at Umeå University and Avni Berisha at University of Prishtina are acknowledged for admitting Gjani Hulaj to a scholarship within the Erasmus+ International Credit Mobility program (2016-1-SE01-KA107-022000), which allowed him to study at Umeå University and contribute to this project. Anders Bengtsson at Atotech Skandinavien and Mohammad Khaytan at Metrohm Nordic are acknowledged for donation of the decommissioned compact IC system that was restored into service by our laboratory and used by Gjani Hulaj during the scouting experiments.

Conflicts of Interest

Several of the authors are associated with a commercial entity that provide education support, method development services, and products for ion chromatography and other liquid chromatographic techniques, but this is not considered to constitute a conflict of interest for the present study.

References

  1. Orlandini, S.; Pinzauti, S.; Furlanetto, S. Application of quality by design to the development of analytical separation methods. Anal. Bioanal. Chem. 2013, 405, 443–450. [Google Scholar] [CrossRef]
  2. Vogt, F.G.; Kord, A.S. Development of quality-by-design analytical methods. J. Pharm. Sci. 2011, 100, 797–812. [Google Scholar] [CrossRef] [PubMed]
  3. Reid, G.L.; Morgado, J.; Barnett, K.; Harrington, B.; Wang, J.; Harwood, J.; Fortin, D. Analytical quality by design in pharmaceutical development. Am. Pharm. Rev. 2013, 16, 144191. [Google Scholar]
  4. Kromidas, S. (Ed.) Optimization in HPLC. Concepts and Strategies; WILEY-VCH: Weinheim, Germany, 2021. [Google Scholar]
  5. Candioti, L.V.; Zan, M.M.; Cámara, M.S.; Goicoechea, H.C. Experimental design and multiple response optimization. Using the desirability function in analytical methods development. Talanta 2014, 124, 123–138. [Google Scholar] [CrossRef] [PubMed]
  6. Taraji, M.; Haddad, P.R.; Amos, R.I.J.; Talebi, M.; Szucs, R.; Dolan, J.W.; Pohl, C.A. Method development in hydrophilic interaction liquid chromatography for pharmaceutical analysis using a combination of quantitative structure–retention relationships and design of experiments. Anal. Chem. 2017, 89, 1870–1878. [Google Scholar] [CrossRef] [PubMed]
  7. Kasagic-Vujanovic, I.; Jancic-Stojanovic, B. Quality by Design oriented development of hydrophilic interaction liquid chromatography method for the analysis of amitriptyline and its impurities. J. Pharm. Biomed. Anal. 2019, 173, 86–95. [Google Scholar] [CrossRef]
  8. Bhattacharyya, L.; Rohrer, J.S. Applications of Ion Chromatography for Pharmaceutical and Biological Products, 1st ed.; John Wiley & Sons: Hoboken, NJ, USA, 2012; pp. xi–xii. [Google Scholar]
  9. Santos, L.M.; Davani, B.; Anthony, C.M.; Clark, J.E. USP Monograph Modernization Initiative. Am. Pharm. Rev. 2015, 18, 173161. [Google Scholar]
  10. USP Modernization and Priority New Monograph Lists. Available online: www.usp.org/get-involved/partner/modernization-priority-new-monograph-lists (accessed on 12 April 2021).
  11. Biron, K.K. Antiviral drugs for cytomegalovirus diseases. Antiviral Res. 2006, 71, 154–163. [Google Scholar] [CrossRef]
  12. Canestri, A.; Ghosn, J.; Wirden, M.; Marguet, F.; Ktorza, N.; Boubezari, I.; Dominguez, S.; Bossi, P.; Caumes, E.; Calvez, V.; et al. Foscarnet salvage therapy for patients with late-stage HIV disease and multiple drug resistance. Antivir. Ther. 2006, 11, 561–566. [Google Scholar]
  13. Medscape Medical News. Available online: www.medscape.com/viewarticle/763619 (accessed on 27 May 2021).
  14. Nylén, P. Beitrag zur kenntnis der organischen phosphorverbindungen. Ber. Dtsch. Chem. Ges. 1924, 57, 1023–1038. [Google Scholar] [CrossRef]
  15. Pink Sheet. Informa Pharma Intelligence. Available online: Pink.pharmaintelligence.informa.com/PS019316/ASTRAs-FOSCAVIR-FOSCARNET-FOR-TREATING-CYTOMEGALOVIRUS-RETINITIS-IN-AIDS-PATIENTS-UNANIMOUSLY-RECOMMENDED-FOR-APPROVAL-BY-FDA-ADVISORY-COMMITTEE (accessed on 27 May 2021).
  16. Fresenius Kabi Introduces First-Ever Generic for Foscavir® (Foscarnet Sodium) Injection. Available online: www.fresenius-kabi.com/us/news/fresenius-kabi-introduces-first-ever-generic-for-foscavir (accessed on 27 May 2021).
  17. Package Leaflet: Information for the User. Foscavir® 24 mg/mL. Solution for Infusion. Clinigen Healthcare. November 2020. Available online: www.medicines.org.uk/emc/files/pil.874.pdf (accessed on 27 May 2021).
  18. United States Pharmacopeia and National Formulary (USP43-NF38), Foscarnet Sodium; United States Pharmacopeial Convention: Rockville, MD, USA, 2020; pp. 2037–2039.
  19. European Pharmacopoeia (Ph. Eur. 10.0). Monograph 01/2017:1520, Foscarnet Sodium Hexahydrate; Council of Europe: Strasbourg Cedex, France, 2019; pp. 2706–2708.
  20. Rozet, E.; Lebrun, P.; Debrus, B.; Boulanger, B.; Hubert, P. Design Spaces for analytical methods. Trends Anal. Chem. 2013, 42, 157–167. [Google Scholar] [CrossRef]
  21. User Guide to Modde 12; Sartorius Stedim Data Analytics AB: Umeå, Sweden, 2017.
  22. Reviewer Guidance, Validation of Chromatographic Methods; United States Food and Drug Administration—Center for Drug Evaluation and Research: Silver Spring, MD, USA, 1994.
  23. ICH Harmonized Tripartite Guideline. Validation of Analytical Procedures: Text and Methodology. Q2(R1); International Council for Harmonisation: Geneva, Switzerland, 2005. [Google Scholar]
  24. Hulaj, G.; Dinh, N.P.; Jonsson, T. Modernization of monograph methods for analysis of small anions in pharmaceutical formulations using suppressed ion chromatography. In Proceedings of the 1st International Conference for Ion Analysis (ICIA 2018), Berlin, Germany, 9–13 September 2018. [Google Scholar]
  25. Hulaj, G.; Dinh, N.P.; Berisha, A.; Jonsson, T. New monograph methods for analysis of some small anions in three different pharmaceutical formulations using suppressed ion chromatography. In Proceedings of the 3rd Joint Science Congress of Materials and Polymers (ISCMP 2019), Pristina, Kosovo, 12–14 September 2019. [Google Scholar]
  26. Guidelines: Passivation of Stainless Steel-Based HPLC and IC Instruments. Available online: Diduco.com/media/2021/02/Passivation_of_stainless_steel-based_HPLC_and_IC_instruments.pdf (accessed on 27 May 2021).
  27. Is There Any HPLC Passivation Procedure Available for Sensitive Applications like e.g. Analysis of Some Proteins, Pyrophosphates etc. or for Applications Using Ion Exchange Columns? Available online: www.agilent.com/cs/library/Support/Documents/Passivation%20for%20ILC.pdf (accessed on 27 May 2021).
  28. Warren, S.; Williams, M.R. The acid-catalysed decarboxylation of phosphonoformic acid. J. Chem. Soc. B 1971, 618–621. [Google Scholar] [CrossRef]
  29. Ba, B.B.; Saux, M.C. Separation methods for antiviral phosphorus-containing drugs. J. Chromatogr. B 2001, 764, 349–362. [Google Scholar] [CrossRef]
  30. ChemAxon LogD Predictor. Available online: Disco.chemaxon.com/calculators/demo/plugins/logd/ (accessed on 27 May 2021).
  31. Riley, C.M.; Ault, J.M., Jr.; Klutman, N.E. Chromatographic methods for the bioanalysis of antiviral agents. J. Chromatogr. B 1990, 531, 295–368. [Google Scholar] [CrossRef]
  32. Claro, C.; Ruiz, R.; Cordero, E.; Pastor, M.T.; López-Corté, L.F.; Jiménez-Castellanos, M.R.; Lucero, M.J. Determination and pharmacokinetic profile of liposomal foscarnet in rabbit ocular tissues after intravitreal administration. Exp. Eye Res. 2009, 88, 528–534. [Google Scholar] [CrossRef]
  33. Pettersson, K.J.; Nordgren, T.; Westerlund, D. Determination of phosphonoformate (foscarnet) in biological fluids by ion-pair reversed-phase liquid chromatography. J. Chromatogr. B 1989, 488, 447–455. [Google Scholar] [CrossRef]
  34. Forsman, U.; Andersson, M.; Törnros, H. Ion-exchange chromatography with post-column reaction for the analysis of phosphonoformate, phosphite and phosphate. J. Chromatogr. 1986, 369, 151–157. [Google Scholar] [CrossRef]
  35. Hassanzadeh, M.K.; Aweeka, F.T.; Wu, S.; Jacobson, M.A.; Gambertoglio, J.G. Determination of phosphonoformic acid in human plasma and urine by high-performance liquid chromatography with electrochemical detection. J. Chromatogr. B 1990, 525, 133–140. [Google Scholar] [CrossRef]
  36. Den Hartigh, J.; Langebroek, R.; Vermeij, P. Ion-exchange liquid chromatographic analysis of bisphosphonates in pharmaceutical preparations. J. Pharm. Biomed. Anal. 1993, 11, 977–983. [Google Scholar] [CrossRef]
  37. Bundgaard, H.; Mørk, N. Kinetics of the decarboxylation of foscarnet in acidic aqueous solution and its implication in its oral absorption. Int. J. Pharm. 1990, 63, 213–218. [Google Scholar] [CrossRef]
  38. Woods, K.; Steinmann, W.; Bruns, L.; Neels, J.T. Stability of foscarnet sodium in 0.9% sodium chloride injection. Am. J. Hosp. Pharm. 1994, 51, 88–90. [Google Scholar] [CrossRef]
  39. García, J.; Márquez, A.; Ruiz, R.; López, L.F.; Claro, C.; Lucero, M.J. Determination of foscarnet (trisodium phosphonoformate) in pharmaceutical preparations by high-performance liquid chromatography with ultraviolet detection. Biomed. Chromatogr. 2006, 20, 1024–1027. [Google Scholar] [CrossRef] [PubMed]
  40. Chen, J.; Zhong, X.; Yu, Y. Determination of foscarnet sodium injection and its related substance by ion chromatography. Chin. Pharm. J. 2012, 47, 1658–1660. [Google Scholar]
  41. Collins, K.E.; Collins, C.H.; Bertran, C.A. Stainless steel surfaces in LC systems, Part I—Corrosion and erosion. LCGC N. Am. 2000, 18, 600–608. [Google Scholar]
  42. Collins, K.E.; Collins, C.H.; Bertran, C.A. Stainless steel surfaces in LC systems, Part II—Passivation and practical recommendations. LCGC N. Am. 2000, 18, 688–692. [Google Scholar]
  43. Heynes, W.M. CRC Handbook of Chemistry and Physics, 97th ed.; CRC Press: Boca Raton, FL, USA, 2017; pp. 5–87. [Google Scholar]
  44. Dinh, N.P.; Shkodra, B.; Jonsson, T. Comprehensive characterization of columns for suppressed anion chromatography. In Proceedings of the 45th International Symposium on High Performance Liquid Phase Separations and Related Techniques (HPLC 2017), Prague, Czech Republic, 18–22 June 2017. [Google Scholar]
  45. Jonsson, T. Multivariate characterization of retention and selectivity for columns used in suppressed anion chromatography. In Proceedings of the 1st International Conference for Ion Analysis (ICIA 2018), Berlin, Germany, 9–13 September 2018. [Google Scholar]
  46. Poole, C.F. The Essence of Chromatography, 1st ed.; Elsevier: Amsterdam, The Netherlands, 2003. [Google Scholar]
  47. United States Pharmacopeia and National Formulary (USP43-NF38), General Chapter <1225>, Validation of Compendial Procedures; United States Pharmacopeial Convention: Rockville, MD, USA, 2020.
Figure 1. Foscarnet and related compounds, shown in their fully ionized forms without counterions.
Separations 08 00209 g001
Figure 2. Chromatograms recorded during the screening of eluent conditions, using (a) 5 mM Na2CO3 + 5 mM NaHCO3, (b) 7.5 mM Na2CO3 + 7.5 mM NaHCO3, (c) 10 mM Na2CO3 + 10 mM NaHCO3, (d) 10 mM Na2CO3, (e) 40 mM NaOH. Analyte concentrations; foscarnet 20 mg/L, phosphate 5 mg/L, phosphite 10 mg/L, impurity-B 20 mg/L.
Separations 08 00209 g002
Figure 3. Coefficient plots for the full factorial design modeled around the provisionally optimum method conditions. The boxes indicate the relative impact of the coefficient on the model, while the whiskers show the uncertainty of the coefficient value, and consequently, if the uncertainty exceeds the value, that coefficient will be considered insignificant. The star (*) indicates interaction terms between different variables.
Separations 08 00209 g003
Figure 4. Design space illustrating optimum range of method conditions. The cross mark represents projection of the calculated robust set point. Colors and labels indicate the calculated percent probability of failure.
Separations 08 00209 g004
Figure 5. Calibration line for foscarnet prepared at seven concentration levels from 5 to 100 mg/L.
Separations 08 00209 g005
Figure 6. Coefficient plot for the autotune model of the correlation between recovery and analysis conditions. The boxes indicate the relative impact of the coefficient on the model, while the whiskers show the uncertainty of the coefficient value, and consequently, if the uncertainty exceeds the value, that coefficient will be considered insignificant. The star (*) indicates interaction terms between different variables.
Separations 08 00209 g006
Table 1. Summary of conditions and results from initial screening of eluents for development of foscarnet assay.
EluentpH 1tR 2Tailing 3Rs 4N 5
5 mM Na2CO3 + 5 mM NaHCO310.34.251.215.143698
7.5 mM Na2CO3 + 7.5 mM NaHCO310.32.541.214.143416
10 mM Na2CO3 + 10 mM NaHCO310.31.511.183.803178
10 mM Na2CO311.12.271.123.743372
40 mM NaOH12.63.751.381.662751
1 Calculated pH value from eluent composition. 2 Retention factor for foscarnet. 3 Tailing factor calculated according to USP definition. 4 Resolution between foscarnet and phosphate. 5 Efficiency expressed as number of theoretical plates.
Table 2. Studied ranges of critical method parameters.
Critical Method Parameter (Factor)AbbreviationLowHigh
[Na2CO3] (mM)CO378
[NaHCO3] (mM)HCO378
Flow rate (mL/min)FR0.751.25
Temperature (°C)Temp2535
Table 3. Summary of fit for the model of the recorded method quality control attributes.
Quality Control Attribute (Response)R2Q2Reproducibility
Retention time, tR0.9910.9751.0000
Retention factor, k’0.9930.9361.0000
Tailing factor0.9880.8840.9998
Theoretical plates, N0.9940.9660.9999
Resolution to phosphite0.9920.9280.9997
Resolution to phosphate0.9960.9591.0000
Resolution to impurity B0.9980.9820.9994
Back-pressure0.9970.9810.9961
Table 4. Set quality attribute ranges, criteria, and objectives for foscarnet peak characteristics during design space evaluation.
Critical Quality AttributeMinimizeMaximizeCriteriaObjective
Retention time, tR 10≤10 minMinimize
Retention factor, k’25>2Inside
Tailing factor 2<2Minimize
Theoretical plates, N2000 >2000Maximize
Resolution to phosphite2 >2Maximize
Resolution to phosphate2 >2Maximize
Resolution to impurity B2 >2Maximize
Back-pressure 10<10 MPaMinimize
Table 5. Calculated robust setpoint method conditions, including factor contributions and predicted quality control attributes.
ParameterValueContributionAttributeValue
Flow rate1.0245.6%Retention time, tR8.03
Temp.29.716.5%Retention factor, k’2.12
Na2CO37.2729.4%Tailing factor1.34
NaHCO37.338.5%Theoretical plates, N2890
Resolution to phosphite8.73
Resolution to phosphate9.16
Resolution to impurity B8.36
Back-pressure6.97
Table 6. Specificity of foscarnet peak and its relation to chloride peak.
PeaktR 1k’ 2Tailing 3Rs 4N 5
Chloride3.260.321.29-2876
Foscarnet7.842.181.2711.373104
1 Retention time in minutes. 2 Retention factor. 3 Tailing factor calculated according to USP definition. 4 Resolution to foscarnet. 5 Efficiency expressed as number of theoretical plates.
Table 7. Recovery and repeatability of foscarnet in different samples at different concentrations.
Sample TypeLevelRecoveryRSD
Drug substance (foscarnet)50%99.0%0.2%
100%99.5%0.1%
150%100.2%0.3%
Drug product (“foscavir”)50%98.9%0.3%
100%99.0%0.3%
150%100.1%0.1%
Table 8. Recovery at various conditions during validation of assay intermediate precision.
Analysis ConditionsDrug Substance (Foscarnet)Drug Product (“Foscavir”)
SystemOperatorDay50%100%150%50%100%150%
11199.4%99.8%100.2%98.9%99.3%100.3%
11299.1%99.0%99.8%98.5%98.9%100.0%
11398.6%99.2%99.8%98.5%99.1%99.9%
12199.1%99.4%100.1%98.7%99.2%99.9%
12298.8%99.1%100.0%99.1%99.2%100.0%
12398.3%98.7%99.5%98.4%98.5%99.5%
21199.0%99.5%99.8%98.5%98.9%100.0%
21299.6%99.2%99.4%98.7%98.4%99.6%
213100.5%100.4%100.2%99.6%99.5%100.2%
22199.8%99.5%99.8%98.7%99.3%99.7%
22299.2%99.1%99.7%98.2%99.0%99.4%
22399.5%99.2%99.8%98.3%99.2%99.6%
Publisher’s Note: MDPI stays neutral with regard to jurisdictional claims in published maps and institutional affiliations.