Communication

Expanding Antineoplastic Drugs Surface Monitoring Profiles: Enhancing of Zwitterionic Hydrophilic Interaction Methods

*
Author to whom correspondence should be addressed.
Separations 2022, 9(2), 34; https://doi.org/10.3390/separations9020034
Submission received: 10 January 2022 / Revised: 26 January 2022 / Accepted: 27 January 2022 / Published: 29 January 2022
(This article belongs to the Special Issue Innovation of Analysis Methods in Pharmaceutical Chemistry)

Abstract

:
Antineoplastic drugs are a wide and heterogeneous group of substances that, as universally known, can cause highly severe toxic effects to whoever is exposed. From an occupational safety point of view, surface contaminations inside preparation and administration units are a growing issue and therefore require the development and implementation of sensible and fast monitoring methods. The unlikelihood of a unique all-embracing chromatography, able to correctly retain and separate each analyte led to the need to create an orthogonal normal phase analysis, which might be able to fill the gaps in the more common reversed-phase ones. An existing hydrophilic interaction method has thus been expanded to 6 other drugs and applied to real samples after an evaluation of its performances. The experimental data were then used to evaluate the possibility of estimating reliable relationships between the chromatographic retention and the chemical-structural features of the drugs under analysis.

1. Introduction

The global antineoplastic drug (AD) market had reached 105.4 billion USD in the year 2019 and is expected to grow at a CAGR of 6.7% between 2020 and 2027. This development can be attributed to favorable government measures as well as a rising interest in R&D [1].
The presence of high throughput monitoring methods, along with their continuous update, is a growing necessity due to the severe toxic effects which can be caused by ADs exposure, especially in hospital environments [2,3,4]. Furthermore, the recent recommendation from the European Biosafety Network to keep the surface contamination of ADs under the threshold value of 100 pg/cm2, along with the threshold limit value-surface level (TLV-SL), a new category of the limit value referred to assess surface contamination, introduced by the American Conference of Governmental Industrial Hygienists (ACGIH), put stress on the need of robust analytical methods which might soon be required for accreditation procedures [5,6].
The extremely difficult task of pharmacologically addressing cancerous cells led the development of ADs to the diversification of therapeutical pathways through the years. This has meant the presence, among the ADs ranks, of a wide and heterogeneous group of substances: from small and simple alkylating metal complexes, such as cisplatin, to large and complicated natural alkaloids, such as vincristine or paclitaxel. This chemical variety creates a complex and challenging task for the simultaneous analysis of ADs profiles. Especially concerning the sample pre-treatment, which, to obtain the complete ADs panel for every single sample, must be working for all the analytes at the same time. Thus, any purification or derivatization step, which would only be useful for a part of the substances, should be avoided. A good compromise has been found in the wipe sampling test, which is at the time being the sampling method of election for surface contamination monitoring [7,8,9,10,11,12].
Considering the overmentioned limit for surface contamination, and the need for the identification of a wide variety of compounds, the analytical method of choice would be liquid chromatography coupled to tandem mass spectrometry. Although the use of a polar C18 reversed-phase column led to great results in previous studies [13], it is reasonable to think that the use of a unique chromatographic column to evaluate all the possible analytes won’t be possible any time soon. It is thus necessary to expand the analytical monitoring methods to fit the growing number of commonly used ADs, and to obtain complementary chromatographic methods suitable for the insertion of newly introduced drugs. By the same token, a hydrophilic interaction liquid chromatography (HILIC) method had been previously developed for the analysis of platinum-based antineoplastic drugs (PtADs) [14].
Approximately at the same time when Alpert introduced the HILIC technique [15], Huber et al. reported that a crucial step for the success of so-called “solvent generated” liquid-liquid chromatography (LLC) was attributed to the correct selection of suitable adsorbent [16]. Zwitterionic separation materials—launched in 2002 by Knut Irgum from his company SeQuant® AB, acquired in 2008 from Merck GmbH—are uniquely characterized by carrying both positive and negative charges on the surface. The electrostatic interactions between the two oppositely charged groups in proximity to the stoichiometric ratio relatively weaken the interactions with the charged analytes. Jack Kirkland after the initial work of Horváth and Lipsky [17], produced the first generation of core-shell particles [18], which are now becoming universally accepted [19,20] for LLC. In 2011 Agilent came up with the new 2.7 µm Poroshell 120® with a proprietary bonding technique [21] recently applied for zwitterionic chemistry.
This study aimed to test the possibility to extend the HILIC-Z method, previously optimized for PtADs, to other substances that had not given satisfactory chromatographic results on the reversed-phase one, to create an orthogonal direct phase chromatography and thus cover all the commonly used ADs. In order to do so, considering the limitations encountered with the use of HILIC-Z columns, such as wide peak width and low theoretical plates number, an attempt to change the additive salt from ammonium formate to ammonium fluoride has been made, based on literature evidence [22].
Furthermore, a preliminary Quantitative Structure-Retention Relationships (QSRRs) analysis has been carried out to search for reliable relationships between the molecular structures of the antineoplastic drugs under study and their retention factors, which could be eventually used to evaluate the further applicability of the HILIC-Z method to new substances.

2. Materials and Methods

2.1. Chemicals

Ultra-high-performance liquid chromatography/mass spectrometry (UHPLC/MS) grade acetonitrile, water, and methanol absolute were all purchased from Biosolve Chimie SARL (Dieuze, France). Formic acid ammonium salt (≥99.0%) MS grade, ammonium fluoride salt (≥99.9%), toluene (≥99.9%) HPLC grade, 5-chlorouracil (99.0%)—selected as internal standard (IS)—, 5-azacytidine (≥98.0%) HPLC grade, 5-fluorouracil (≥99.0%) HPLC grade, carboplatin, cisplatin, dacarbazine, gemcitabine hydrochloride (≥98.0) HPLC grade, mitoxantrone hydrochloride, and oxaliplatin—selected as chemical standards—were all purchased from Merck KgaA (Darmstadt, Germany).
A mixture consisting of methanol:water 50:50 (v/v), from now on indicated as desorption solution (DS), was used to elute the wipe samples [23].
In order to build the calibration curves, the pharmaceutical preparations carboplatin 10 mg/mL, cisplatin 1 mg/mL, cytarabine 100 mg/mL, and gemcitabine 100 mg/mL were purchased from Accord Healthcare (Milan, Italy), oxaliplatin 5 mg/mL from Sun Pharmaceutical Industries Ltd. (Milan, Italy), 5-fluorouracil 5 mg/100 mL from Teva Pharmaceutical Industries (Milan, Italy), 5-azacytidine 25 mg/mL from Zentiva (Prague, Czech Republic), dacarbazine 500 mg from Medac GmbH (Wedel, Germany) and mitoxantrone 2 mg/mL from Baxter S.p.A. (Rome, Italy).

2.2. Instruments

The LC system consists of a Shimadzu Nexera X2 equipped with a DGU-20A5R degasser unit, two LC-30AD pumps, SIL-30AC autosampler, CBM-20A system controller, SPD-M20A diode array detector, and CTO-20AC column oven. The tandem mass spectrometry system was a Shimadzu LCMS 8050 triple quadrupole equipped with an electrospray source (ESI). Instrument control and data acquisition were carried out using the software LabSolution® ver. 5.97 (Shimadzu Corp., Kyoto, Japan).
Climatic Cabinet Sartorius SCC400L (GEASS S.R.L., Torino, Italy) was used to weight Internal Standard, chemical standards, ammonium formate, and fluoride salts.
The stability of mitoxantrone was evaluated with a Shimadzu UV-1900 spectrophotometer, the absorbance measurements were made over the wavelength range of 400–800 nm using 1 cm path length quartz cuvettes. Data were recorded and elaborated with UVProbe 2.70 software(Shimadzu Corp., Kyoto, Japan).

2.3. Standard Solutions and Calibration Levels

Stock solutions of gemcitabine, cytarabine, dacarbazine, mitoxantrone, 5-azacytidine, 5-fluorouracil, carboplatin, oxaliplatin, and 5-chlorouracil (IS) were prepared at 1 mg/mL using DS, while cisplatin was prepared at the same concentration using water. All the stock solutions were stored at −20 °C. The MS parameters were optimized using a working solution of each analyte at the concentration of 2 µg/mL prepared from the stock solutions in DS.
The calibration mixture of analytes (MixADs solution) was prepared by adding 10 µL of each Pharmaceutical stock solution and diluted to 10 mL with DS to obtain 1 µg/mL concentration for all the compounds, with the exception of 40 µg/mL concentration for cisplatin. The IS solution was made by diluting its stock solution with DS up to 1 µg/mL.
A six-level calibration curve for each analyte was prepared by adding 10 µL of IS work solution, a proper volume of MixADs and diluting with DS to reach the final volume of 1 mL. By following this procedure, the analyte concentrations of the calibration solutions were: 0, 10, 20, 30, 40, 50 ng/mL exception made by cisplatin which was 0, 400, 800, 1200, 1600, 2000 ng/mL. Three levels of internal quality control solutions (IQC) were prepared by diluting MixADs with DS, to obtain 15 ng/mL (low level), 25 ng/mL (medium level) and 45 ng/mL (high level) for each analyte, and 600 ng/mL (low level), 1000 ng/mL (medium level) and 1800 ng/mL (high level) for cisplatin, respectively. Each IQC solution contained IS in a concentration of 10 ng/mL.

2.4. Sample Preparation

The matrix effect (ME) was evaluated preparing two sets of six replicate samples for each analyte [24]. The Set1 was obtained by desorbing blank wipes with 2 mL of DS, transferring 1.92 mL of this solution in a vial, and adding 80 µL of MixADs, while the Set2 was prepared by diluting 80 µL of MixADs solution with 1.92 mL of DS.
Each solution was filtered through a 0.2 µm GHP Acrodisc® syringe filter (Pall Corporation, New York, NY, USA) before analysis.
As reported in previous papers [23], a wipe consists of a 5 × 5 cm nonwoven fabric gauze wetted with 500 µL of DS, used to swab 20 × 20 cm areas contaminated by ADs in hospital drug preparation and administration units. The analytes are desorbed from the wipe with 2 mL of the DS containing 10 ng/mL of IS.

2.5. Chromatography and Instrument Parameters

Concerning the chromatography, an Agilent® Poroshell 120 HILIC-Z 2.1 × 100 mm, 2.7 µm particles size (Agilent Technologies, Santa Clara, CA, USA) column was used. The mobile phase consisted of a 90:10 acetonitrile/water mixture added with 20 mM ammonium formate. The mobile phase was also tested by replacing the ammonium formate salt with a concentration of 2 mM of ammonium fluoride. Each mobile phase was sonicated for 15 min to clear the solution from dissolved gasses and avoid gas bubbles in the LC pumps. The eluent was delivered isocratically at a flow rate of 0.6 mL/min, in a total run time of 9 min.
To evaluate the void time needed to calculate the retention factor (k), the dimensions of the water layer adsorbed on the surface of HILIC-Z stationary phase had been taken into account. For this purpose, an analyte that is not retained with normal phase chromatography, such as toluene, has been tested [25]. The toluene 5 mg/mL solution was thus evaluated utilizing the final MRM analysis mobile phase as solvent, which is ACN 90%, H2O 10% with 20 mM ammonium formate. Ten injections were repeated to establish the retention time of the unretained analyte. Toluene was detected at a wavelength of 254 nm by a photodiode array detector (PDA).
Sample injection was carried on using a co-injection pretreatment program, consisting in three drawings of 2 µL from the sample vial alternated by three drawings of 6 µL from another vial containing acetonitrile. The column oven was maintained at 30 °C for each run. The settings of the ESI source, alternatively operating in positive and negative ion mode, were the following: interface voltage 3 kV, nebulizing gas flow 3 L/min, heating gas flow 10 L/min, interface temperature 300 °C, desolvation temperature 526 °C, desolvation line temperature 250 °C, heat block temperature 400 °C and drying gas flow 10 L/min.

2.6. MS/MS Experiments

Positive scan spectra of the 2 µg/mL solutions of 5-azacitidine, dacarbazine, gemcitabine, mitoxantrone, and cytarabine and negative scan spectra for 5-fluorouracil and 5-chlorouracil were acquired in a range from 100 to 500 m/z with a scan time of 0.100 s.
The fragmentation of each molecule in a m/z range from 50 to 500 with a scan time of 0.100 s using argon as collision gas was examinated by the product ion scan (PIS) spectra of the analytes’ 2 µg/mL solutions. Each solution was analyzed via flow injection analysis by increasing collision energies: from 5 to 55 V. The relative intensity values of each signal present in the MS/MS spectra were used to create the collision breakdown curves. For what concerns oxaliplatin, carboplatin and cisplatin, the fragmentations used were the same reported in previous works [14].
The LC-MS/MS analysis was performed in multiple reaction monitoring (MRM) using a dwell time of 26 msec. The transition ions and energies are reported in Table 1.

2.7. Performance Evaluation of LC-MS/MS Methods

Three sets of calibration and IQC solutions were freshly prepared and analyzed every day for six days to evaluate the interday repeatability of the method, whereas for the intraday repeatability six sets were prepared and analyzed in a single day. Calibration curves were obtained by plotting the peak area ratios (PAR), between analyte and ISTD quantitation ions, versus the nominal concentration of the calibration solution. A linear regression analysis was applied to obtain the best fitting function between the calibration points. Limits of detection and quantitation (LOD and LOQ) were calculated according to the International Conference on Harmonization (ICH) guidelines using the approach based on the standard deviation of blanks and slope of the regression [26].
The method precision was evaluated through the relative standard deviation (RSD%) of the replicate analysis of low, medium and high levels of IQC. The accuracy was determined through the ratio between the determined and added amounts expressed as a percentage.
Matrix effect was calculated for each analyte by comparing the mean results of Set1 and Set2 formerly described according to the following formula:
M E   ( % ) = S e t 1 S e t 2 × 100
The Internal standard has been added to Set1 and Set2 to check chromatographic and injection conditions but has not been used for the evaluation of ME.

2.8. Mitoxantrone Stability Evaluation

To evaluate the stability of mitoxantrone a 50 ng/mL solution in DS was prepared with the addition of 10 ng/mL of IS and analyzed at 0, 0.5, 1, 3, 5, 14 h delay from the preparation by LC/MS. The procedure has been repeated three times and the mean values are reported in Section 3.
In order to confirm this evaluation, an attempt with UV-VIS spectrometer was made. A mitoxantrone working solution at 100 µg/mL was prepared from the stock solution in DS and kept at room temperature between the recording of the spectra, which were recorded at 0, 1, 2, 3, and 6 h delay from the preparation.

2.9. Quantitative Structure-Retention Relationships (QSRRs)

Quantitative Structure-Retention Relationship (QSRR) methods aim at empirically linking the molecular structures of chemicals to their chromatographic retention behaviour through statistical models, which can be used to predict the retention properties of new substances and gain a better understanding of the chromatographic separation mechanism.
The QSRR workflow required the following steps: (1) the molecular structures of the nine compounds and the internal standard were encoded as strings in SMILES format [27]; (2) the 3D atomic coordinates of each molecular structure were calculated by structure embedding using the ETKDG method [28]; (3) the molecular geometry was optimized in the RDKit module [29] by the MMFF94 [30] force field with 200 iterations, selecting the minimum energy conformation; (4) the atomic partial charges were computed by means of the web-based tool Atomic Charge Calculator [31] using the B3LYP/6-311G/NPA approach [32]. The structural and physicochemical features of chemicals were then encoded through the following 18 molecular descriptors: molecular weight (MW), hydrophilic factor (Hy) [33], total topological polar surface area (TPSA) [34] and 15 charge descriptors (qpmax, qnmax, Qpos, Qneg, Qtot, Qmean, Q2, RPCG, RNCG, SPP, TE1, TE2, PCWTE1, PCWTE2, LDI) [35,36,37,38,39,40,41]. These descriptors were selected on the basis of the literature review and calculated by the software Dragon 7 [42].
The relationships between the HILIC-Z retention factor and the 18 molecular descriptors were evaluated by means of Principal Component Analysis (PCA) [43] and Ordinary Least Squares (OLS) regression.

3. Results

3.1. Chromatographic Conditions

The substitution of ammonium formate with ammonium fluoride did not bring a significant difference to the chromatogram. So, the formate salt has thus been selected for the method considering is easier handling.
The obtained chromatograms, reported in Figure 1, display a fair separation between the analytes. The partial overlapping that occurred is easily worked around by MS/MS analysis. Dacarbazine and 5-fluorouracil show lower retention, which is still considered acceptable. Each compound presents a wide but symmetric peak, except for mitoxantrone which shows an abundant tailing.
The values of retention time, peak width, theoretical plates number, and retention factor are reported in Table 2.

3.2. Mass Spectrometry

The most abundant signal of the unmodified molecules cluster was chosen as precursor ion for the MS/MS analysis.
The data obtained from product ion scan analysis were used to build collision breakdown curves for each molecule, which can be seen in Figure S1 in the supplementary material. The analysis of these results allowed the selection of the most suitable product ions and their optimal collision energy (CE), which were then used to set up the MRM methods given in Table 1 in Section 2.

3.3. Method Validation

3.3.1. Calibration Curves

Since actual contaminations in hospital environment are caused by pharmaceutical preparations spilling, containing excipients which may cause a great variability to the analyte signal, the preparation has been used instead of pure standards to create the calibration curves, to display a truer view of the compounds’ response.
The linear regression data along with LOD and LOQ values obtained for each analyte are reported in Table 3 and Table 4.

3.3.2. Matrix Effect and Recovery

The results for matrix effect are shown in Table S1. The obtained values highlight a strong increasing in signal for gemcitabine and a quenching effect for dacarbazine and 5-fluorouracil.

3.3.3. Accuracy and Precision
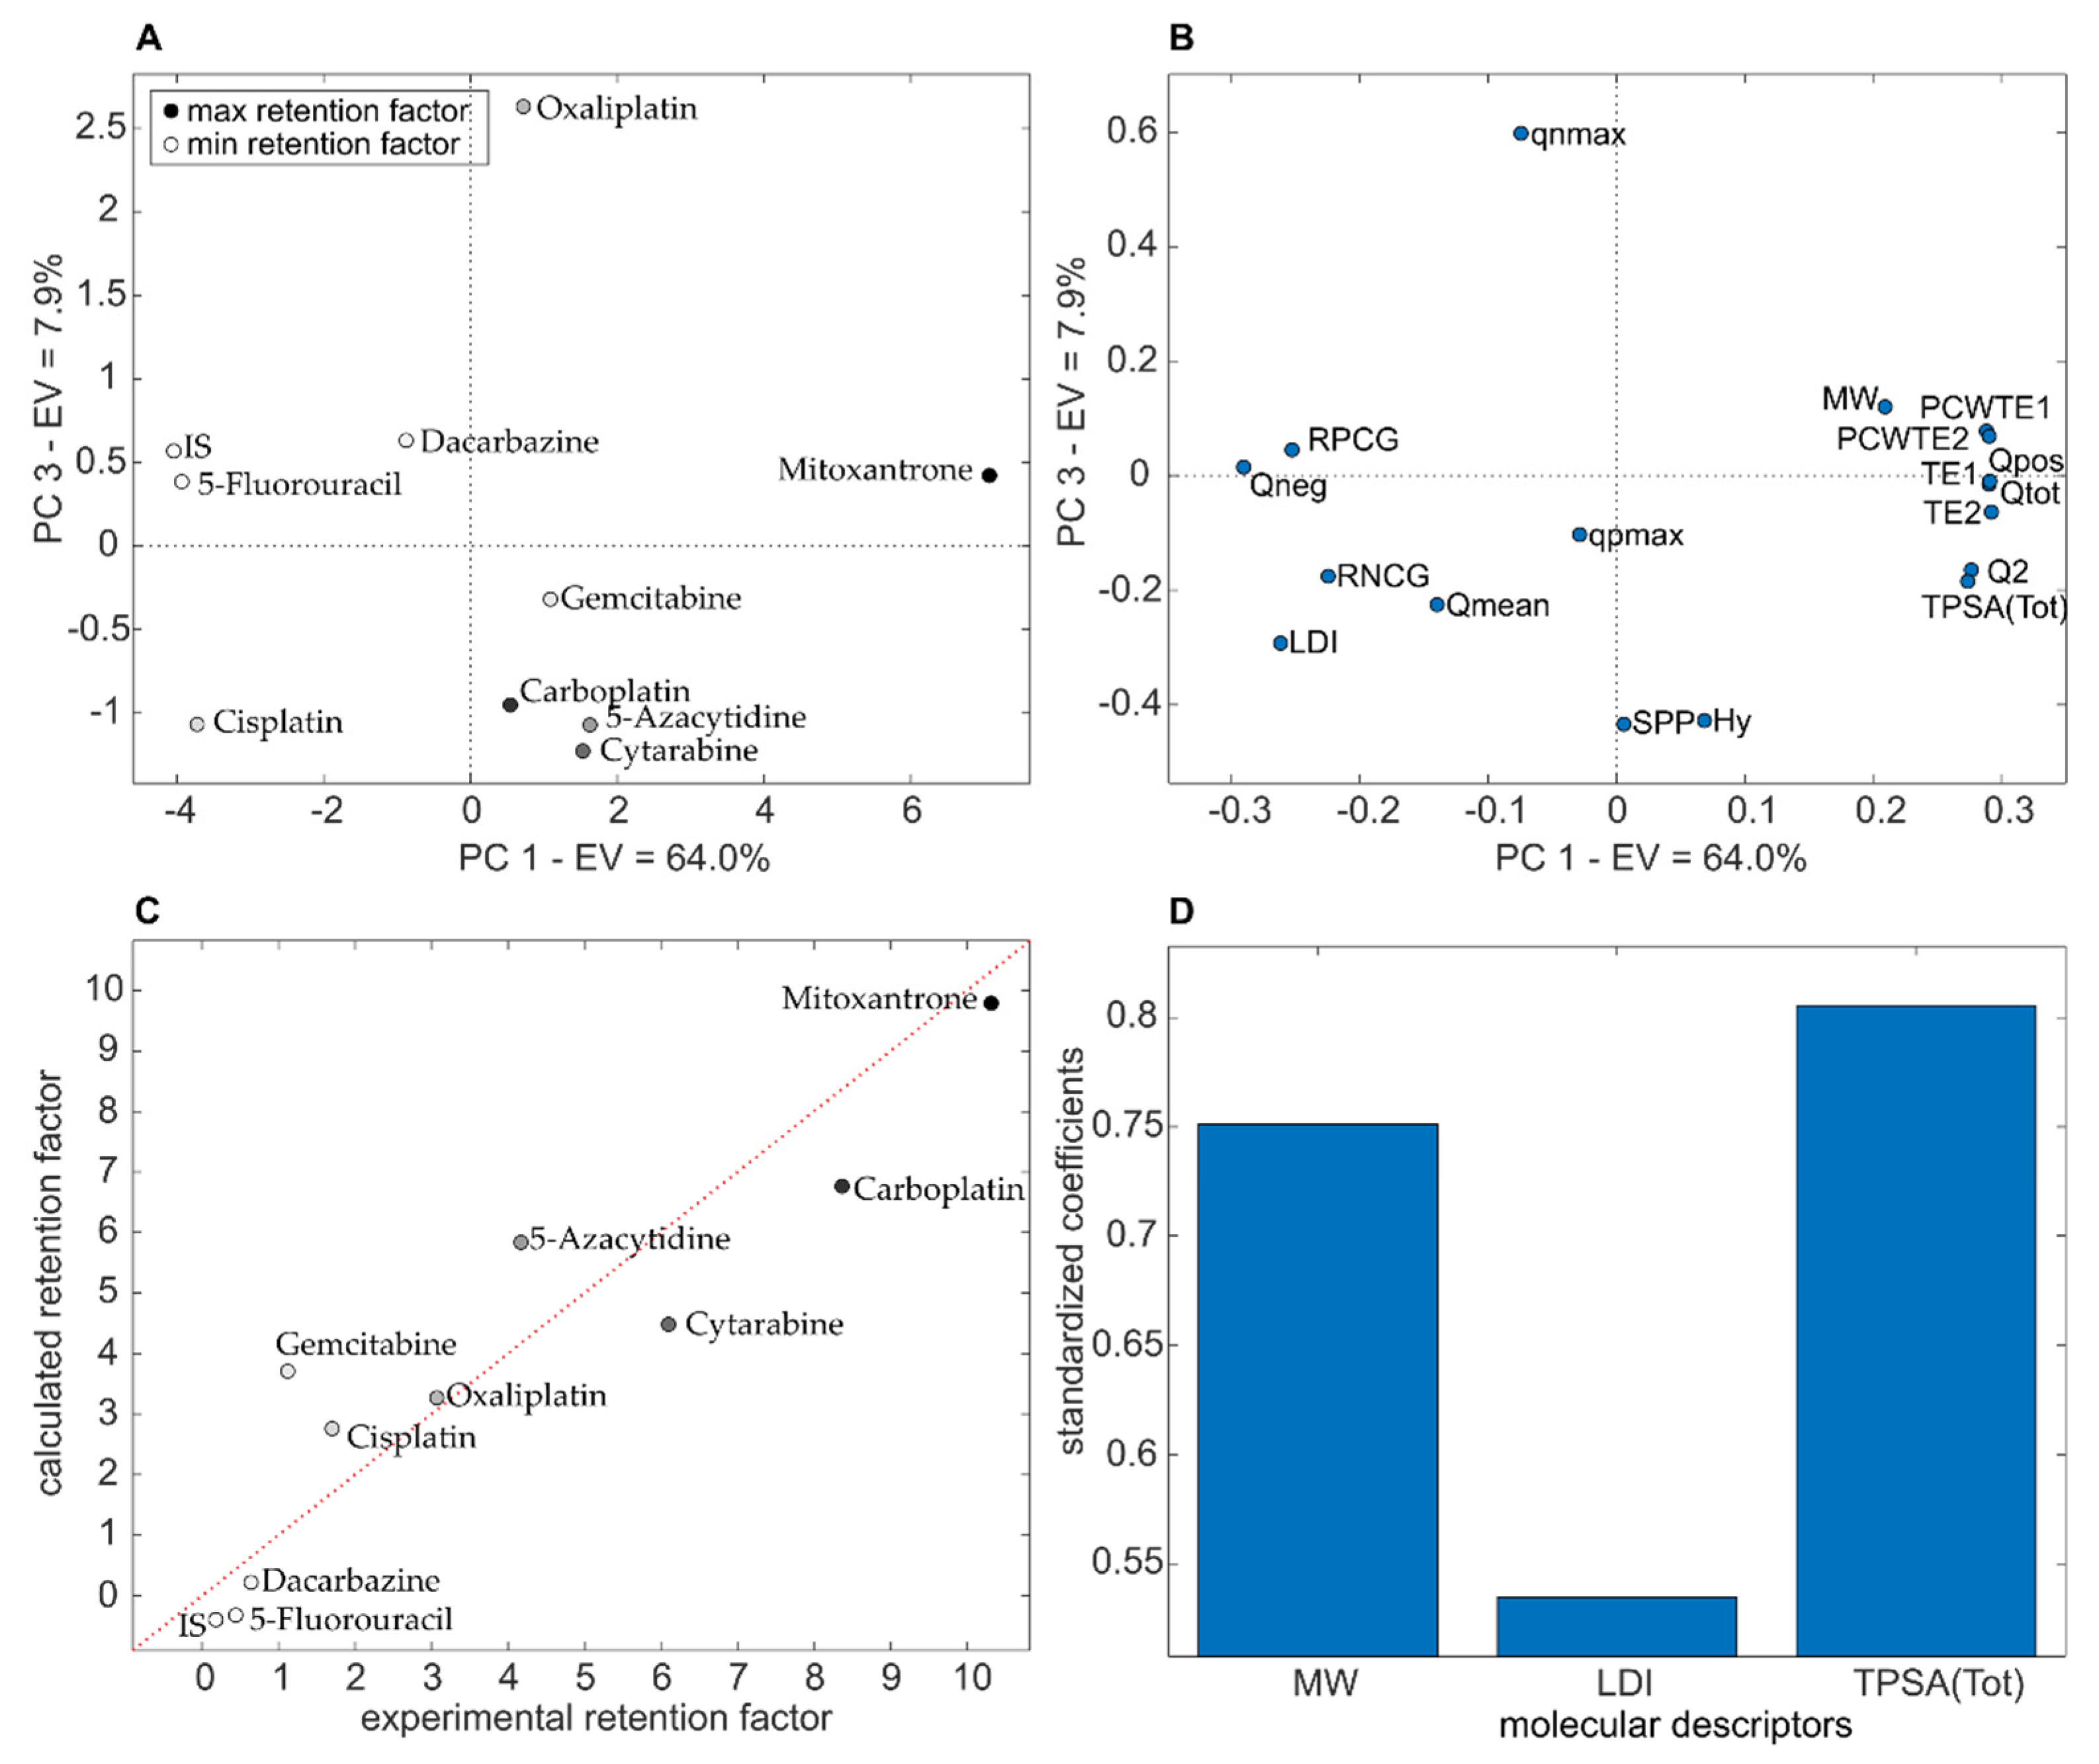
Table S2 shows the accuracy and precision values obtained for the three IQC levels during validation. The obtained results are precision (expressed as RSD) between 5 and 16% and accuracy (expressed as experimental-theoretical concentration ratio) between 90 and 109%.

3.4. QSRR Results

The unsupervised data exploration was performed by PCA on 18 molecular descriptors encoding electronic and steric properties of the chemicals. Data were autoscaled before calculation. The main PCA results are shown in Figure 2. In particular, the score plot (Figure 2A) allowed a preliminary qualitative evaluation of the relationships between molecular structure features of ADs and intraday retention factor, while the corresponding loading plot (Figure 2B) allowed to understand which descriptors are mainly responsible for the retention behaviour of chemicals.
The results of OLS regression analysis on the same data set are reported in Figure 2C,D, which show the experimental versus predicted retention factors and the standardised coefficients of the regression model based on three molecular descriptors (MW, LDI and TPSA), respectively.

3.5. Real Sample Analysis

The method was tested on real samples from an ADs surface contamination monitoring campaign in a hospital administration unit.
From a panel of 82 samples, 28 end-shift wipes showed contamination of the daily used drugs, 21 of which were greater than 100 pg/cm2.

3.6. Mitoxantrone Stability

The data obtained by UV-VIS and LC-MS/MS measurements highlighted the fact that mitoxantrone presents poor stability in DS and leads to the degradation of the molecule. The spectra recorded by UV-VIS reported in Supplementary Material Figure S2 showed a higher absorbance in the shoulder of the absorption band at 570 nm and also in the main peaks at 610 nm and 658 nm, probably due to the modification of the anthraquinone scaffold.

4. Discussion

The ambitious project to create a universal ADs contamination monitoring method surely requires many steps to be set up, mostly due to the wideness of chemistries presented by the ADs class and to the not easy task to select the right stationary phase. Although the importance of reversed-phase chromatographic columns and the developments made by manufacturers to extend their use to hydrophilic compounds, the growing interest in biological molecules (metabolomics, proteomics, etc.) and the increasing tendency of drugs development to mimic proteic structures, is bringing the need for advancement of HILIC columns, which ought to be increasingly performant. HILIC needs to be studied and deeply analyzed in order to build a wider knowledge of its retention mechanisms and which chemical properties and factors affect them. To this aim, a preliminary attempt to obtain useful information on the structural and physicochemical characteristics associated with this group of molecules in HILIC-Z retention has been carried out through the QSRR approach.
The unsupervised PCA allowed the qualitative assessment of the relationship between the molecular structure of ADs and their retention factors. In particular, the coloring of the compounds according to the retention factor (Figure 2A) indicates that the first principal component (PC1) mainly explains the retention behavior, with negative scores associated to low retention factors, while positive intermediate and high PC1 scores characterize molecules with high retention factors. Looking at PCA loadings (Figure 2B), the descriptors that influence PC1 are global molecular properties that account both for steric and electronic effects. In particular, molecular weight (MW), polar surface area (TPSA) and some charge descriptors have high positive loading on PC1 and direct correlation with the retention factor. Among these charge descriptors, there are the total absolute charge Qtot and the total squared charge Q2, which are measures of molecular polarity, and the topographic electronic descriptor TE2 [37,38], which is the sum of the absolute differences between atomic charges over all pairs of bonded atoms. On the contrary, the descriptors that most determine PC3 (i.e., the maximum negative charge qnmax, the hydrophilic factor Hy [36] and the submolecular polarity parameter SPP [36]) encode electronic properties that rely on the presence of specific atom types or groups in the molecule.
A preliminary attempt to quantitatively relate molecular descriptors and retention factor was carried out through supervised regression analysis with the OLS method coupled with variable selection. The variable selection was carried out by trying all the possible combinations up to three of the 18 molecular descriptors available. The final best regression model, with molecular weight MW, local dipole index LDI (i.e., average of the atomic charge differences over all bonded atom pairs [40,41] and topological polar surface area TPSA [34] as the independent variables, showed encouraging performance (Figure 2C), with R2 of 0.85 (root-mean-square error RMSE equal to 1.3) and Q2 leave-one-out cross-validation of 0.68 (RMSE in cross-validation equal to 1.9). The standardized regression coefficients of the three descriptors (Figure 2D) are positive and indicate that they all contribute positively, to a different extent, to the retention factor.
As expected, the limited number of tested molecules could only provide preliminary results. However, the expanded ADs panel and the gained expertise will be used for further investigations regarding ADs’ interaction with HILIC columns.
For what concerns the analytical method, the obtained chromatographic profile succeeds in separating satisfactorily the analytes, which is particularly important in the case of 5-azacytidine. In fact, its chromatogram shows an interference due to the presence of cytarabine, whose monoisotopic mass only differs by 1 Da, causing cytarabine isotopic cluster to be mistaken for 5-azacytidine during the precursor selection in a low-resolution mass spectrometer such as a quadrupole. Moreover, their similar molecular structure causes the formation of similar fragment ions, further complicating the distinction.
Minor flaws, such as the mitoxantrone tailing and the lower retention of 5-fluorouracil and dacarbazine, are accepted for the sake of keeping a unique sample treatment method, which is crucial to be able to evaluate the entire ADs panel during the same sampling campaign.
Attempts have been made to reduce peak width and increase chromatographic resolution. The use of ammonium fluoride, which has been successfully applied to zwitterionic HILIC separation [22], brought unsatisfactory results for this set of molecules. Improvements in ionization and peak width have been observed only for few compounds and were not promising enough to justify the inconveniences that the use of fluoride brings. In fact, its use requires dedicated columns, which cannot be reconverted to the use of other salts, and meticulous washing needed before and after its use when working with acid additives, because of the formation of small amounts of damaging hydrofluoric acid inside the chromatographic instrument.
After the performance evaluation began a rapid degradation of mitoxantrone was observed, which led to the stability evaluation reported in Section 3.6. These tests highlighted the instability of mitoxantrone in water-based solutions at neutral pH, previously studied by Gomez-Canela et al. [44]. It is thus impossible, under these circumstances, to create a real quantification method for this analyte and its calibration, precision, accuracy and ME data have not been reported. However, the obtained MRM method and chromatographic results have been considered useful and added to the monitoring method to obtain qualitative results. For future studies, the same method might be converted to mitoxantrone quantification by modifying the DS pH.
As for the other analytes the performance evaluation showed good repeatability both for the chromatographic results and linear regressions, with a quantification error lower than ±10% and LOQ values in the order of ng/mL or lower, and thus fit for the purpose.

Supplementary Materials

The following are available online at https://www.mdpi.com/article/10.3390/separations9020034/s1, Figure S1: Collision breakdown curves obtained from PIS analysis reporting collision energy CE (V) versus percentage abundance. CE values for 5-Fluorouracil and 5-Chlorouracil are to be considered as negative. The listed values reported in each spectra legend are respectively precursor and product ions. Figure S2: Overlapped UV-VIS spectra of mitoxantrone recorded in the range 400–800 nm at 1,2,3,4 and 6 h delay from the preparation of the solution. Table S1: Data results for matrix effect (ME). Table S2: Data results of precision and accuracy for the three CQI levels.

Author Contributions

Conceptualization, S.D., D.S., E.B., D.B.; methodology, D.S., E.B., G.C., L.T.; formal analysis, D.S., E.B., C.V., V.C.; investigation, G.C.; resources, N.M., L.T.; writing—original draft preparation, S.D., D.S., E.B., C.V., D.B., V.C.; writing—review and editing, F.G., N.M., G.A.; visualization, G.A.; supervision, G.A.; project administration, G.A. All authors have read and agreed to the published version of the manuscript.

Funding

This research received no external funding.

Institutional Review Board Statement

Not applicable.

Conflicts of Interest

The authors declare no conflict of interest.

References

  1. Global Anticancer Drugs Market to Record 6.7% CAGR through 2027. Available online: https://www.biospace.com/article/global-anticancer-drugs-market-to-record-6-7-percent-cagr-through-2027/ (accessed on 14 November 2021).
  2. Dranitsaris, G.; Johnston, M.; Poirier, S.; Schueller, T.; Milliken, D.; Green, E.; Zanke, B. Are health care providers who work with cancer drugs at an increased risk for toxic events? A systematic review and meta-analysis of the literature. J. Oncol. Pharm. Pract. 2005, 11, 69–78. [Google Scholar] [CrossRef] [PubMed]
  3. Mahmoodi, M.; Soleyman-Jahi, S.; Zendehdel, K.; Mozdarani, H.; Azimi, C.; Farzanfar, F.; Safari, Z.; Mohagheghi, M.-A.; Khaleghian, M.; Divsalar, K.; et al. Chromosomal aberrations, sister chromatid exchanges, and micronuclei in lymphocytes of oncology department personnel handling anti-neoplastic drugs. Drug Chem. Toxicol. 2016, 40, 235–240. [Google Scholar] [CrossRef] [PubMed]
  4. Villarini, M.; Gianfredi, V.; Levorato, S.; Vannini, S.; Salvatori, T.; Moretti, M. Occupational exposure to cytostatic/antineoplastic drugs and cytogenetic damage measured using the lymphocyte cytokinesis-block micronucleus assay: A systematic review of the literature and meta-analysis. Mutat. Res. 2016, 770, 35–45. [Google Scholar] [CrossRef] [PubMed]
  5. Directive 2004/37/EC of the European Parliament and of the Council of 29 April 2004 on the Protection of Workers from the Risks Related to Exposure to Carcinogens or Muta-Gens at Work (Sixth Individual Directive within the Meaning of Article 16(1) of Council Directive 89/391/EEC). Available online: https://eur-lex.europa.eu/LexUriServ/LexUriServ.do?uri=OJ:L:2004:229:0023:0034:EN:PDF (accessed on 9 December 2021).
  6. European BioSafety Network. 2016. Preventing Occupational Exposure to Cytotoxic and Other Hazardous Drugs European Policy Recommendations. Available online: https://www.europeanbiosafetynetwork.eu/wp-content/uploads/2016/05/Exposureto-Cytotoxic-Drugs_Recommendation_DINA4_10-03-16.pdf (accessed on 9 December 2021).
  7. Kibby, T. A review of surface wipe sampling compared to biologic monitoring for occupational exposure to antineoplastic drugs. J. Occup. Environ. Hyg. 2017, 14, 159–174. [Google Scholar] [CrossRef] [PubMed]
  8. Jeronimo, M.; Colombo, M.; Astrakianakis, G.; Hon, C.-H. A surface wipe sampling and LC–MS/MS method for the simultaneous detection of six antineoplastic drugs commonly handled by healthcare workers. Anal. Bioanal. Chem. 2015, 407, 7083–7092. [Google Scholar] [CrossRef] [PubMed]
  9. Dugheri, S.; Bonari, A.; Pompilio, I.; Boccalon, P.; Tognoni, D.; Cecchi, M.; Ughi, M.; Mucci, N.; Arcangeli, G. Analytical strategies for assessing occupational exposure to antineoplastic drugs in healthcare workplaces. Med. Pract. 2018, 69, 589–604. [Google Scholar] [CrossRef] [PubMed]
  10. Lee Walton, A.M.; Bush, M.A.; Douglas, C.E.; Allen, D.H.; Polovich, M.; Spasojevic, I. Surface Contamination With Antineoplastic Drugs on Two Inpatient Oncology Units. Oncol. Nurs. Soc. Forum 2020, 47, 263–273. [Google Scholar] [CrossRef] [PubMed]
  11. Chabut, C.; Bussières, J.-F. Characteristics of wipe sampling methods for antineoplastic drugs in North America: Comparison of six providers. Pharm. Technol. Hosp. Pharm. 2020, 5. [Google Scholar] [CrossRef]
  12. Mucci, N.; Dugheri, S.; Farioli, A.; Garzaro, G.; Rapisarda, V.; Campagna, M.; Bonari, A.; Arcangeli, G. Occupational exposure to antineoplastic drugs in hospital environments: Potential risk associated with contact with cyclophosphamide- and ifosfamide contaminated surfaces. Med. Pract. 2020, 71, 519–529. [Google Scholar] [CrossRef]
  13. Dugheri, S.; Mucci, N.; Squillaci, D.; Marrubini, G.; Bartolucci, G.; Melzi, C.; Bucaletti, E.; Cappelli, G.; Trevisani, L.; Arcangeli, G. Developing a Fast Ultra-High-Performance Liquid Chromatography–Tandem Mass Spectrometry Method for High-Throughput Surface Contamination Monitoring of 26 Antineoplastic Drugs. Separations 2021, 8, 150. [Google Scholar] [CrossRef]
  14. Dugheri, S.; Mucci, N.; Mini, E.; Squillaci, D.; Marrubini, G.; Bartolucci, G.; Bucaletti, E.; Cappelli, G.; Trevisani, L.; Arcangeli, G. Characterization and Separation of Platinum-Based Antineoplastic Drugs by Zwitterionic Hydrophilic Interaction Liquid Chromatography (HILIC)-Tandem Mass Spectrometry, and Its Application in Surface Wipe Sampling. Separations 2021, 8, 69. [Google Scholar] [CrossRef]
  15. Alpert, A.J. Hydrophilic-interaction chromatography for the separation of peptides, nucleic acids and other polar compounds. J. Chromatogr. A 1990, 499, 177–196. [Google Scholar] [CrossRef]
  16. Huber, J.F.K.; Pawlowska, M.; Markl, P. Selection of the solid support-a crucial step for the realization of solvent generated liquid-liquid chromatography. J. Chromatogr. A 1990, 500, 257–280. [Google Scholar] [CrossRef]
  17. Horváth, C.; Lipsky, S.R. Column design in high pressure liquid chromatography. J. Chromatogr. Sci. 1969, 7, 109–116. [Google Scholar] [CrossRef]
  18. Kirkland, J.J. Controlled surface porosity supports for high-speed gas and liquid chromatography. Anal. Chem. 1969, 41, 218–220. [Google Scholar] [CrossRef]
  19. DeStefano, J.J.; Langlois, T.J.; Kirkland, J.J. Characteristics of superficially-porous silica particles for fast HPLC: Some performance comparisons with sub-2-µm particles. J. Chromatogr. Sci. 2008, 46, 254–260. [Google Scholar] [CrossRef] [PubMed] [Green Version]
  20. Gritti, F.; Guiochon, G. Comparison between the efficiencies of columns packed with fully and partially porous C18-bonded silica materials. J. Chromatogr. A 2007, 1157, 289–303. [Google Scholar] [CrossRef] [PubMed]
  21. Chen, W.; Wei, T.-C. Superficially Porous Particles and Methods of Making and Using Same. U.S. Patent 7,846,337 B2, 7 December 2010. [Google Scholar]
  22. Narduzzi, L.; Royer, A.-L.; Bichon, E.; Guitton, Y.; Buisson, C.; Le Bizec, B.; Dervilly-Pinel, G. Ammonium Fluoride as Suitable Additive for HILIC-Based LC-HRMS Metabolomics. Metabolites 2019, 9, 292. [Google Scholar] [CrossRef] [Green Version]
  23. Dugheri, S.; Bonari, A.; Pompilio, I.; Boccalon, P.; Mucci, N.; Arcangeli, G. A new approach to assessing occupational exposure to antineoplastic drugs in hospital environments. Arh. Hig. Rada Toksikol. 2018, 69, 226–237. [Google Scholar] [CrossRef] [Green Version]
  24. Matuszewski, B.K.; Constanzer, M.L.; Chavez-Eng, C.M. Strategies for the assessment of matrix effect in quantitative bioanalytical methods based on HPLC-MS/MS. Anal. Chem. 2003, 75, 3019–3030. [Google Scholar] [CrossRef]
  25. Greco, G.; Grosse, S.; Letzel, T. Study of the retention behavior in zwitterionic hydrophilic interaction chromatography of isomeric hydroxy- and aminobenzoic acids. J. Chromatogr. A 2012, 1235, 60–67. [Google Scholar] [CrossRef] [PubMed]
  26. Validation of Analytical Procedures: Text and Methodology Q2(R1). Available online: https://database.ich.org/sites/default/files/Q2%28R1%29%20Guideline.pdf (accessed on 8 December 2021).
  27. Weininger, D.; Weininger, A.; Weininger, J.L. SMILES. 2. Algorithm for generation of unique SMILES notation. J. Chem. Inf. Comput. Sci. 1989, 29, 97–101. [Google Scholar] [CrossRef]
  28. Riniker, S.; Landrum, G.A. Better Informed Distance Geometry: Using What We Know To Improve Conformation Generation. J. Chem. Inf. Comp. Sci. 2015, 55, 2562–2574. [Google Scholar] [CrossRef] [PubMed]
  29. RDKit: Open-Source Cheminformatics. Available online: http://www.rdkit.org (accessed on 22 December 2021).
  30. Halgren, T.A. Merck molecular force field. I. Basis, form, scope, parameterization, and performance of MMFF94. J. Comput. Chem. 1996, 17, 490–519. [Google Scholar] [CrossRef]
  31. Ionescu, C.-M.; Sehnal, D.; Falginella, F.L.; Pant, P.; Pravda, L.; Bouchal, T.; Vařeková, R.S.; Geidl, S.; Koča, J. AtomicChargeCalculator: Interactive Web-based calculation of atomic charges in large biomolecular complexes and drug like molecules. J. Cheminform. 2015, 7, 50. [Google Scholar] [CrossRef] [Green Version]
  32. Geidl, S.; Bouchal, T.; Raček, T.; Vařeková, R.S.; Hejret, V.; Křenek, A.; Abagyan, R.; Koča, J. High-quality and universal empirical atomic charges for chemoinformatics applications. J. Cheminform. 2015, 7, 59. [Google Scholar] [CrossRef] [Green Version]
  33. Todeschini, R.; Vighi, M.; Finizio, A.; Gramatica, P. SAR & QSAR. Environ.Res. 1997, 7, 173–193. [Google Scholar]
  34. Ertl, P.; Rohde, B.; Selzer, P. Fast Calculation of Molecular Polar Surface Area as a Sum of Fragment-Based Contributions and Its Application to the Prediction of Drug Transport Properties. J. Med. Chem. 2000, 43, 3714–3717. [Google Scholar] [CrossRef]
  35. Stanton, D.T.; Jurs, P.C. Development and Use of Charged Partial Surface Area Structural Descriptors in Computer Assissted Quantitative Structure Property Relationship Studies. Anal. Chem. 1990, 62, 2323–2329. [Google Scholar] [CrossRef]
  36. Kaliszan, R.; Osmialowski, K.; Tomellini, S.A.; Hsu, S.-H.; Fazio, S.D.; Hartwick, R.A. Non-empirical descriptors of sub-molecular polarity and dispersive interactions in reversed-phase HPLC. Chromatographia 1985, 20, 705–708. [Google Scholar] [CrossRef]
  37. Osmialowski, K.; Halkiewicz, J.; Radecki, A.; Kaliszan, R. Quantum chemical parameters in correlation analysis of gas—Liquid chromatographic retention indices of amines. J. Chromat. 1985, 346, 53–60. [Google Scholar] [CrossRef]
  38. Katritzky, A.R.; Gordeeva, E.V. Traditional topological indexes vs electronic, geometrical, and combined molecular descriptors in QSAR/QSPR research. J. Chem. Inf. Comput. Sci. 1993, 33, 835–857. [Google Scholar] [CrossRef] [PubMed]
  39. Osmialowski, K.; Halkiewicz, J.; Kaliszan, R. Quantum chemical parameters in correlation analysis of gas-liquid chromatographic retention indices of amines II. Topological electronic index. J. Chromat. 1986, 361, 63–69. [Google Scholar] [CrossRef]
  40. Clare, B.W.; Supuran, C.T. Carbonic anhydrase activators. 3: Structure-activity correlations for a series of isozyme II activators. J. Pharm. Sci. 1994, 83, 768–773. [Google Scholar] [CrossRef] [PubMed]
  41. Karelson, M.; Lobanov, V.S.; Katritzky, A.R. Quantum-Chemical Descriptors in QSAR/QSPR Studies. Chem. Rev. 1996, 96, 1027–1043. [Google Scholar] [CrossRef] [PubMed]
  42. Kode srl. Dragon Version 7.0.6. 2016. Available online: https://chm.kode-solutions.net (accessed on 22 December 2021).
  43. Bro, R.; Smilde, A.K. Principal Component Analysis. Anal. Methods 2014, 6, 2812–2831. [Google Scholar] [CrossRef] [Green Version]
  44. Gómez-Canela, C.; Campos, B.; Barata, C.; Lacorte, S. Degradation and toxicity of mitoxantrone and chlorambucil in water. Int. J. Environ. Sci. Technol. 2015, 12, 633–640. [Google Scholar] [CrossRef] [Green Version]
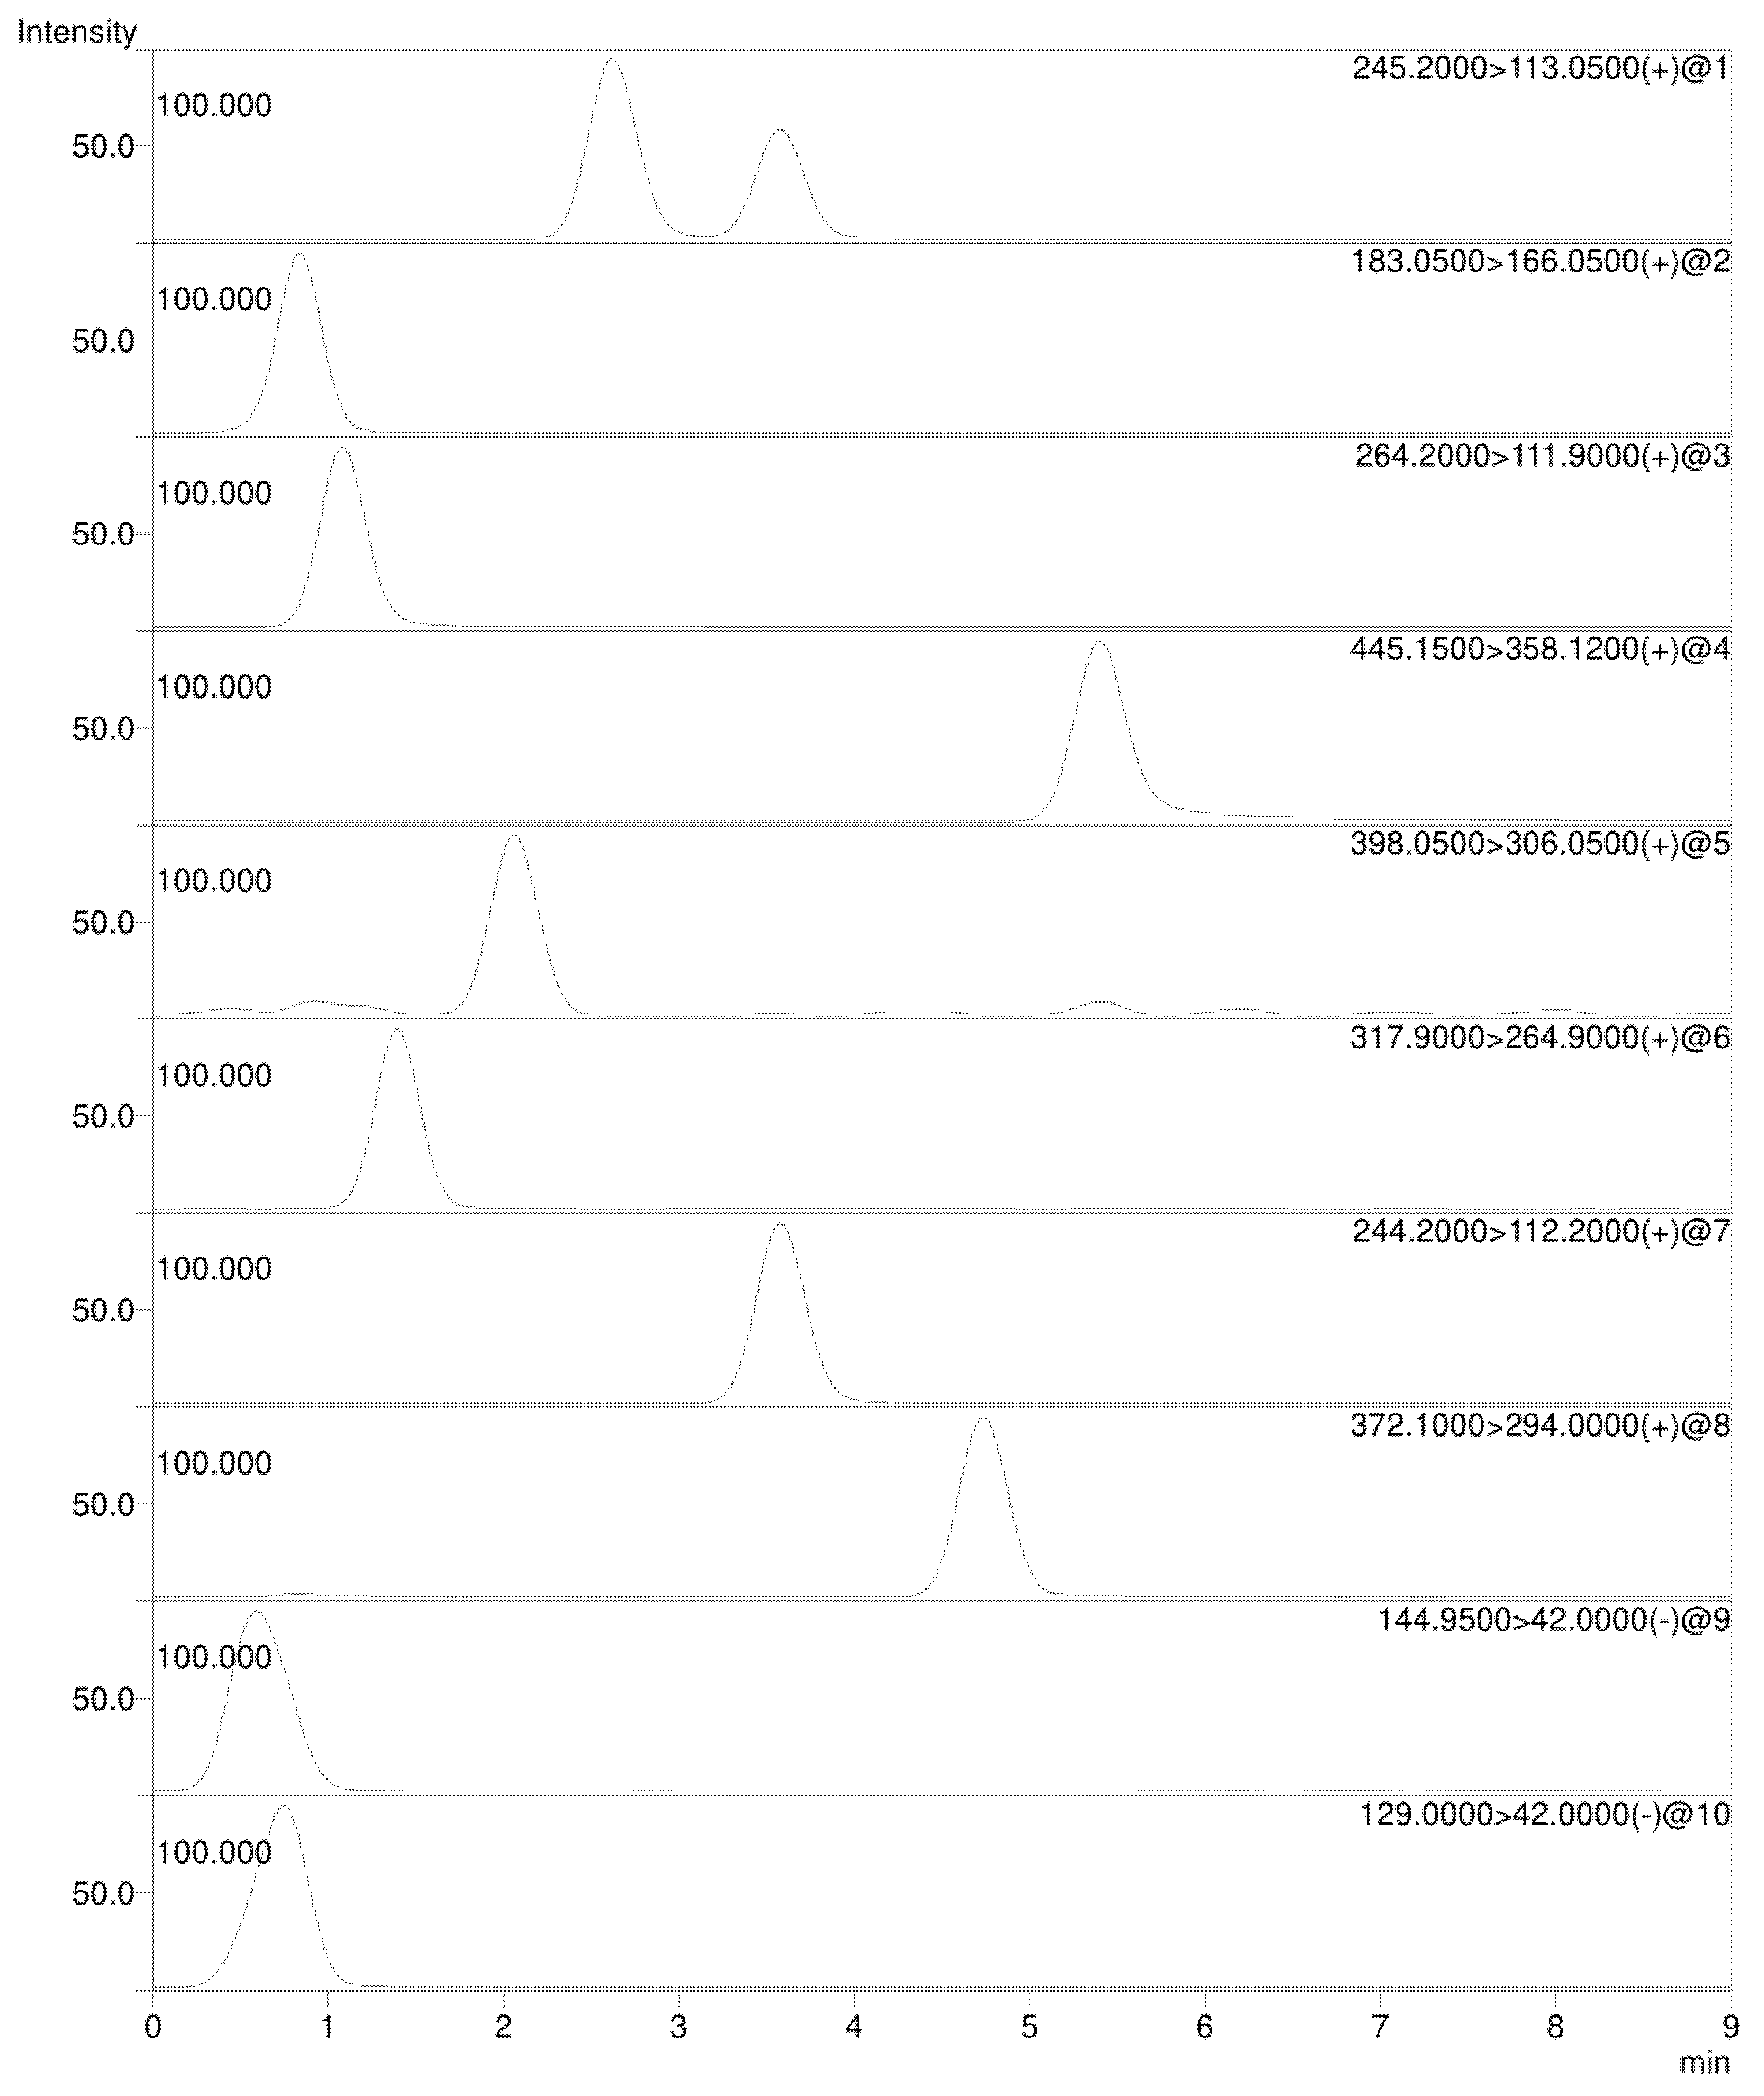
Figure 1. Stacked view of the experimental chromatogram. LEGEND: 1, 5-azacytidine; 2, dacarbazine; 3, gemcitabine; 4, mitoxantrone; 5, oxaliplatin; 6, cisplatin; 7, cytarabine; 8, carboplatin; 9, 5-chlorouracil; 10, 5-fluorouracil.
Separations 09 00034 g001
Figure 2. PCA and OLS regression results. (A) score and (B) loading plots showing the first (PC1) versus the third (PC3) principal component (total explained variance (EV) 71.9%); (C) experimental versus predicted retention factor plot and (D) standardized coefficients of the OLS model. Molecules are colored in a greyscale on the basis of their retention factor (white: minimum, black: maximum).
Separations 09 00034 g002
Table 1. Optimized parameters set in MRM mode, showing the quantifier and qualifier ions for each analyte with the corresponding collision energy utilized.
CompoundPrecursor Ion SpeciesPrecursor Ion (m/z)Quantifier Ion (m/z) [CE (V)]Qualifier Ion (m/z) [CE (V)]
ISTD[M − H]-144.942.0 [17.0]65.8 [28.5]
5-Azacytidine[M + H]+245.2113.0 [−10.0]86.0 [−30.0]
Dacarbazine[M + H]+183.0166.0 [−13.0]123.0 [−19.0]
Gemcitabine[M + H]+264.2111.9 [−17.0]95.1 [−42.0]
Mitoxantrone[M + H]+445.188.0 [−26.0]358.1 [−20.0]
Cytarabine[M + H]+244.2112.2 [−15.0]94.1 [−43.0]
5-Fluorouracil[M − H]-129.042.0 [19.0]59.2 [23.0]
Oxaliplatin[M + H]+398.0306.0 [−28.0]96.0 [−25.0]
Cisplatin[M + NH4]+317.9264.9 [−15.0]300.7 [−15.0]
Carboplatin[M + H]+372.1294.0 [−18.0]248.0 [−35.0]
Table 2. Show the analytes retention time (RT) and their relative standard deviation (RSD), the calculated plates number (N), and the retention factor (k).
Interday
CompoundRT (min)RT RSDWidth1/2 (min)Width RSDTfTf RSDAfAf RSDN (Plates)k
5-Azacytidine2.7260.3%0.3261.8%1.00.8%1.081%3874.4
Dacarbazine0.8420.2%0.2930.5%0.91.0%0.902%460.7
Gemcitabine1.0890.2%0.2980.3%1.01.0%1.061%741.1
Mitoxantrone5.6211.8%0.52924.3%1.810.7%3.2010%63410.1
Cisplatin1.3860.2%0.2920.4%1.00.1%1.030%1251.7
Cytarabine3.7540.2%0.3191.5%1.00.5%1.051%7696.4
Carboplatin4.9180.2%0.3291.3%1.00.3%1.051%12378.7
Oxaliplatin2.1100.2%0.3140.8%1.00.2%1.040%2513.1
IS0.5941.4%0.3651.6%1.11.5%1.223%150.2
5-Fluorouracil0.7320.6%0.3692.1%0.91.9%0.854%220.4
Intraday
5-Azacytidine2.6300.5%0.3181.6%1.01.3%1.062%3784.2
Dacarbazine0.8340.2%0.2930.5%0.91.2%0.912%450.6
Gemcitabine1.0770.3%0.2980.6%1.00.3%1.040%721.1
Mitoxantrone5.7572.9%0.48424.0%2.061.3%2.8844%78510.3
Cisplatin1.3720.3%0.2940.6%1.00.6%1.031%1201.7
Cytarabine3.6120.4%0.3131.5%1.00.8%1.031%7386.1
Carboplatin4.7640.3%0.3241.3%1.02.8%1.043%11948.4
Oxaliplatin2.0710.2%0.3151.0%1.00.6%1.031%2403.1
IS0.6022.0%0.3691.5%1.12.1%1.184%150.2
5-Fluorouracil0.7300.7%0.3652.5%0.90.8%0.841%220.4
Table 3. Linear regressions data obtained for each analyte.
Interday
CompoundSlope (PAR/ng/mL)Intercept (PAR)R2r
5-Azacytidine0.0370.0120.99700.9985
Dacarbazine9.17612.8940.99600.9980
Gemcitabine1.1610.0650.99770.9988
Mitoxantrone----
Cisplatin0.0040.1490.99810.9990
Cytarabine4.559−11.2840.98840.9942
Carboplatin0.2070.0940.99790.9989
Oxaliplatin0.059−0.0120.99850.9992
5-Fluorouracil0.1020.0320.99800.9990
Intraday
5-Azacytidine0.037−0.0050.99960.9998
Dacarbazine8.96312.5290.99500.9975
Gemcitabine1.079−0.0770.99950.9997
Mitoxantrone----
Cisplatin0.0050.1310.99850.9992
Cytarabine5.942−15.0640.99010.9950
Carboplatin0.0480.0220.99960.9998
Oxaliplatin0.063−0.0070.99960.9998
5-Fluorouracil0.1090.0290.99960.9998
Table 4. LOD and LOQ values obtained for each analyte.
CompoundLOD (ng/mL)LOQ (ng/mL)
5-Azacytidine0.230.70
Dacarbazine0.030.10
Gemcitabine0.090.28
Mitoxantrone--
Cisplatin9.8629.58
Cytarabine0.020.06
Carboplatin0.912.73
Oxaliplatin0.120.35
5-Fluorouracil0.050.15
Publisher’s Note: MDPI stays neutral with regard to jurisdictional claims in published maps and institutional affiliations.

