Article

Isolation and Identification of Non-Conjugated Linoleic Acid from Processed Panax ginseng Using LC-MS/MS and 1H-NMR

1
Bio Research Institutes, CJ CheilJedang, Suwon 16495, Korea
2
Food Research Institutes, CJ CheilJedang, Suwon 16495, Korea
*
Author to whom correspondence should be addressed.
Separations 2021, 8(11), 208; https://doi.org/10.3390/separations8110208
Submission received: 15 October 2021 / Revised: 26 October 2021 / Accepted: 29 October 2021 / Published: 4 November 2021

Abstract

:
Black ginseng exhibits numerous pharmacological activities due to higher and more diverse ginsenosides than unprocessed white ginseng. The ginsenoside derivatives have been investigated in order to determine their chemical structures and pharmacological activities. We found a peak which was increased 10-fold but unidentified in the methanol extracts of a black ginseng product. The unknown peak was tracked and identified as linoleic acid rather than a ginsenoside derivative using liquid chromatography–tandem mass spectrometry (LC-MS/MS) and nuclear magnetic resonance (NMR) spectroscopy. NMR analysis confirmed no presence of conjugated linoleic acids. Ginsenoside profiles and linoleic acid contents in black ginseng products were quantified using LC-MS/MS. Linoleic acid content was more directly proportional to the number of applied thermal cycles in the manufacturing process than any ginsenosides.

1. Introduction

Black ginsengs are made from white Panax ginseng roots, steamed and dried for nine cycles based on traditional recipes [1]. The process has led to chemical changes in the secondary metabolites and the Maillard reaction in black ginseng [2,3]. Thus, black ginseng has various unique derivatives of ginsenosides not found in white ginseng [4], which have been proposed to be responsible for the enhanced pharmacological activity of black ginseng [5].
Ginsenosides Rb1, Rb2, Rc, Rd, Re, and Rg1 are usually found as significant components in white ginseng [6]. These ginsenosides undergo chemical reactions during the steaming process, such as hydrolysis of sugar moieties and subsequent dehydration that yield Rg3, F2, compound K, Rh2 [7]. Ginsenoside Rg3 can be further dehydrated to Rk1 and Rg5 in black ginseng, and more derivatives are produced from the ginsenosides Rg1 and Rg2 through hydrolysis and dehydration reactions [8]. Thus, the chemical structures of the derivatives can be identified not only using various mass spectrometric analyses but also using the knowledge of possible reactions such as glycosidic bond cleavage and dehydration. Studies have shown that the number of identified ginsenosides increased to 234, including 67 potential new ones in Panax notoginseng, using HPLC–Q-TOF-MS [9] and to 646 ginsenosides from stems and leaves of P. ginseng using linear ion-trap/Orbitrap mass spectrometry [10]. These ginsenosides are responsible for the potential health-promoting effects of commercial ginseng products [11]. Numerous studies have demonstrated the therapeutic effects of individual ginsenosides against, for example, cardiovascular disease, diabetes, neurodegenerative disease, and cancer [12,13,14,15].
Sensitive and accurate mass spectrometric techniques, such as multiple reaction monitoring (MRM), have been developed to identify ginsenoside profiles of ginseng products [16]. However, the contents and quantities of ginsenosides in processed ginseng products vary according to the recipes used [7]. Thus, it may also be essential to accurately monitor ginsenoside profiles in the manufacturing process of ginseng products. Accordingly, the internal standard method and the standard addition method were developed to quantitively analyze ginsenosides in commercial ginseng products using LC-MS/MS [17].
Recently, we found a peak which increased 10-fold but was unidentified in the methanol extract of a black ginseng product produced by repeated steaming and drying of fresh ginseng roots. The unknown peak did not match any known derivatives of ginsenosides. Sometimes the sudden appearance of unknown compounds can be a crucial finding. It is especially meaningful in analyzing health food products because the unknown compounds may be helpful or harmful. However, identifying the unknown compounds is always challenging as it requires highly delicate and time-consuming steps to figure out what they are. The unknown compounds can be identified and quantified using various analytical techniques (MS, NMR, etc.) [18]. Thus, the unknown peak was tracked in this study using LC-MS/MS and NMR spectroscopy. LC-MS/MS was used for quantitative analysis of ginsenosides and fatty acids in the ginseng samples during the manufacturing process.

2. Materials and Methods

2.1. Materials

Black ginseng used in this study was made by repeated steaming and drying of fresh ginseng roots by CJ Cheiljedang Co. Ltd. (Seoul, Korea). HPLC grade acetonitrile and methanol and other analytical grade chemicals were purchased from Fluka (Milwaukee, WI, USA).

2.2. Sample Preparation

One gram of pulverized black ginseng was extracted with 25 mL of 70% methanol for 2 h in an ultrasonic bath at 70 °C. It was centrifuged at 3000 rpm, and the supernatant was filtered through a 0.4 μm membrane filter.

2.3. Liquid Chromatography of Ginseng Extracts

Ginsenoside compounds were determined according to the method applied as previously described [19]. An HPLC system (Alliance, Waters Co., Milford, MA, USA) composed of photo diode array (PDA) detector and fraction collector was slightly modified to be suitable for a large amount of ginseng extract to be injected into the instrument to speed up fractionation. The chromatographic separation was performed on a Capcell Pak ACR C18 column (4.6 mm × 250 mm, 3μm, Osaka Soda co. Osaka, Japan) at 40 °C. Elution was performed with 0.1% formic acid in water (A) and 0.1% formic acid in acetonitrile (B) at a flow rate of 1.0 mL/min with a solvent gradient (vol.%), as follows: 0–0.5 min (26% B), 3.5 min (32% B), 8.5 min (32% B), 20.0 min (35% B), 35.0 min (35% B), 45.0 min (55% B), 53.0 min (65% B), 53.1 min (90% B), 60.0 min (90% B), 60.1 min (26% B) and 70.0 min (26% B). The sample injection volume was 10.0 μL, and data was acquired at 203 nm.

2.4. Liquid Chromatography and Tandem Mass Spectrometry (LC-MS/MS)

The LC-MS/MS system was composed of an ESI-Q-Tof tandem MS spectrometer (Xevo G2 XS, Waters Co., Milford, MA, USA). The analytical column was a HSS T3 Column (2.1 mm × 150 mm, 1.8 μm, Waters Co., Milford, MA, USA). The gradient elution (vol.%) used a two-solvent system consisting of 0.1% formic acid in water (A) and 0.1% formic acid in acetonitrile (B) and was applied as follows: 0–0.5 min (15% B), 14.5 min (26% B), 15.5 min (32% B), 18.5 min (38% B), 24.0 min (40% B), 27.0 min (50% B), 31 min (50% B), 35.0 min (80% B), 37.0 min (80% B), 39.0 min (100% B), 42.0 min (100% B), 42.1 min (15% B) and 47.0 min (15% B). The flow rate was set at 0.25 mL/min and the column oven temperature was kept at 40 °C. The compound was separated and passed through the PDA detector and then infused into the ESI interface.
The capillary voltage, cone voltage, cone gas flow, source temperature, and desolvation gas flow were set to 2.8 kV, 30 V, 200 L/hr, 150 °C, and 600 L/h, respectively. MS/MS spectra were obtained for structural elucidation of the unknown peak as the collision energy (CE) was ramped up from 20 V to 40 V. The Elemental Composition calculator of MassLynxTM ver. 4.1 software (Waters Co., Milford, MA, USA) was also used to calculate the elemental compositions, with a mass error tolerance up to 5 ppm [20]. Additional analyses were performed for structural elucidation, such as MS/MS and NMR. Finally, features obtained via MS and NMR were queried on various publicly available databases of known compounds, such as METLIN and HMDB, and the structure of the unknown peak was verified by matching each experimental spectrum to a library of previously identified spectra.
Ginsenoside profiles and linoleic acid contents were analyzed for the ginseng samples at each cycle of the steaming and drying process with a selected ion monitoring (SIM) method, as listed in Table 1. Formic acid adduct ion [M-H+HCOOH] was monitored because much higher signal abundance was observed than with deprotonated ion [M-H] [21]. The raw data were processed using QuanLynxTM in MassLynxTM ver. 4.1 software (Waters Co., Milford, MA, USA).
The fatty acid analysis was carried out according to the MRM method using a triple quadrupole mass spectrometer (TQD) as a detector. The MRM transition of linoleic acid and palmitic acid was 279.2 > 279.2 and 255.2 > 255.2 and the CE was set to 10 V [22]. The raw data was processed using TargetLynxTM in MassLynxTM ver. 4.1 software (Waters Co., Milford, MA, USA).

2.5. Nuclear Magnetic Resonance Analysis

The 1H-NMR spectrum of the isolated compound was characterized by several salient regions of unsaturated fatty acid. The 1H NMR spectrum was recorded on a Bruker AVANCE III 400 MHz spectrometer in CDCl3 solvent systems; all chemical shifts were reported in parts per million (ppm, δ). For each sample, 18 scans were recorded with the following parameters: spectrum resolution 0.39 Hz/point; spectral width, 6393.862 Hz; relaxation delay 20 s; acquisition time 2.56 s; a 90° pulse was used to obtain the maximum sensitivity.

3. Results

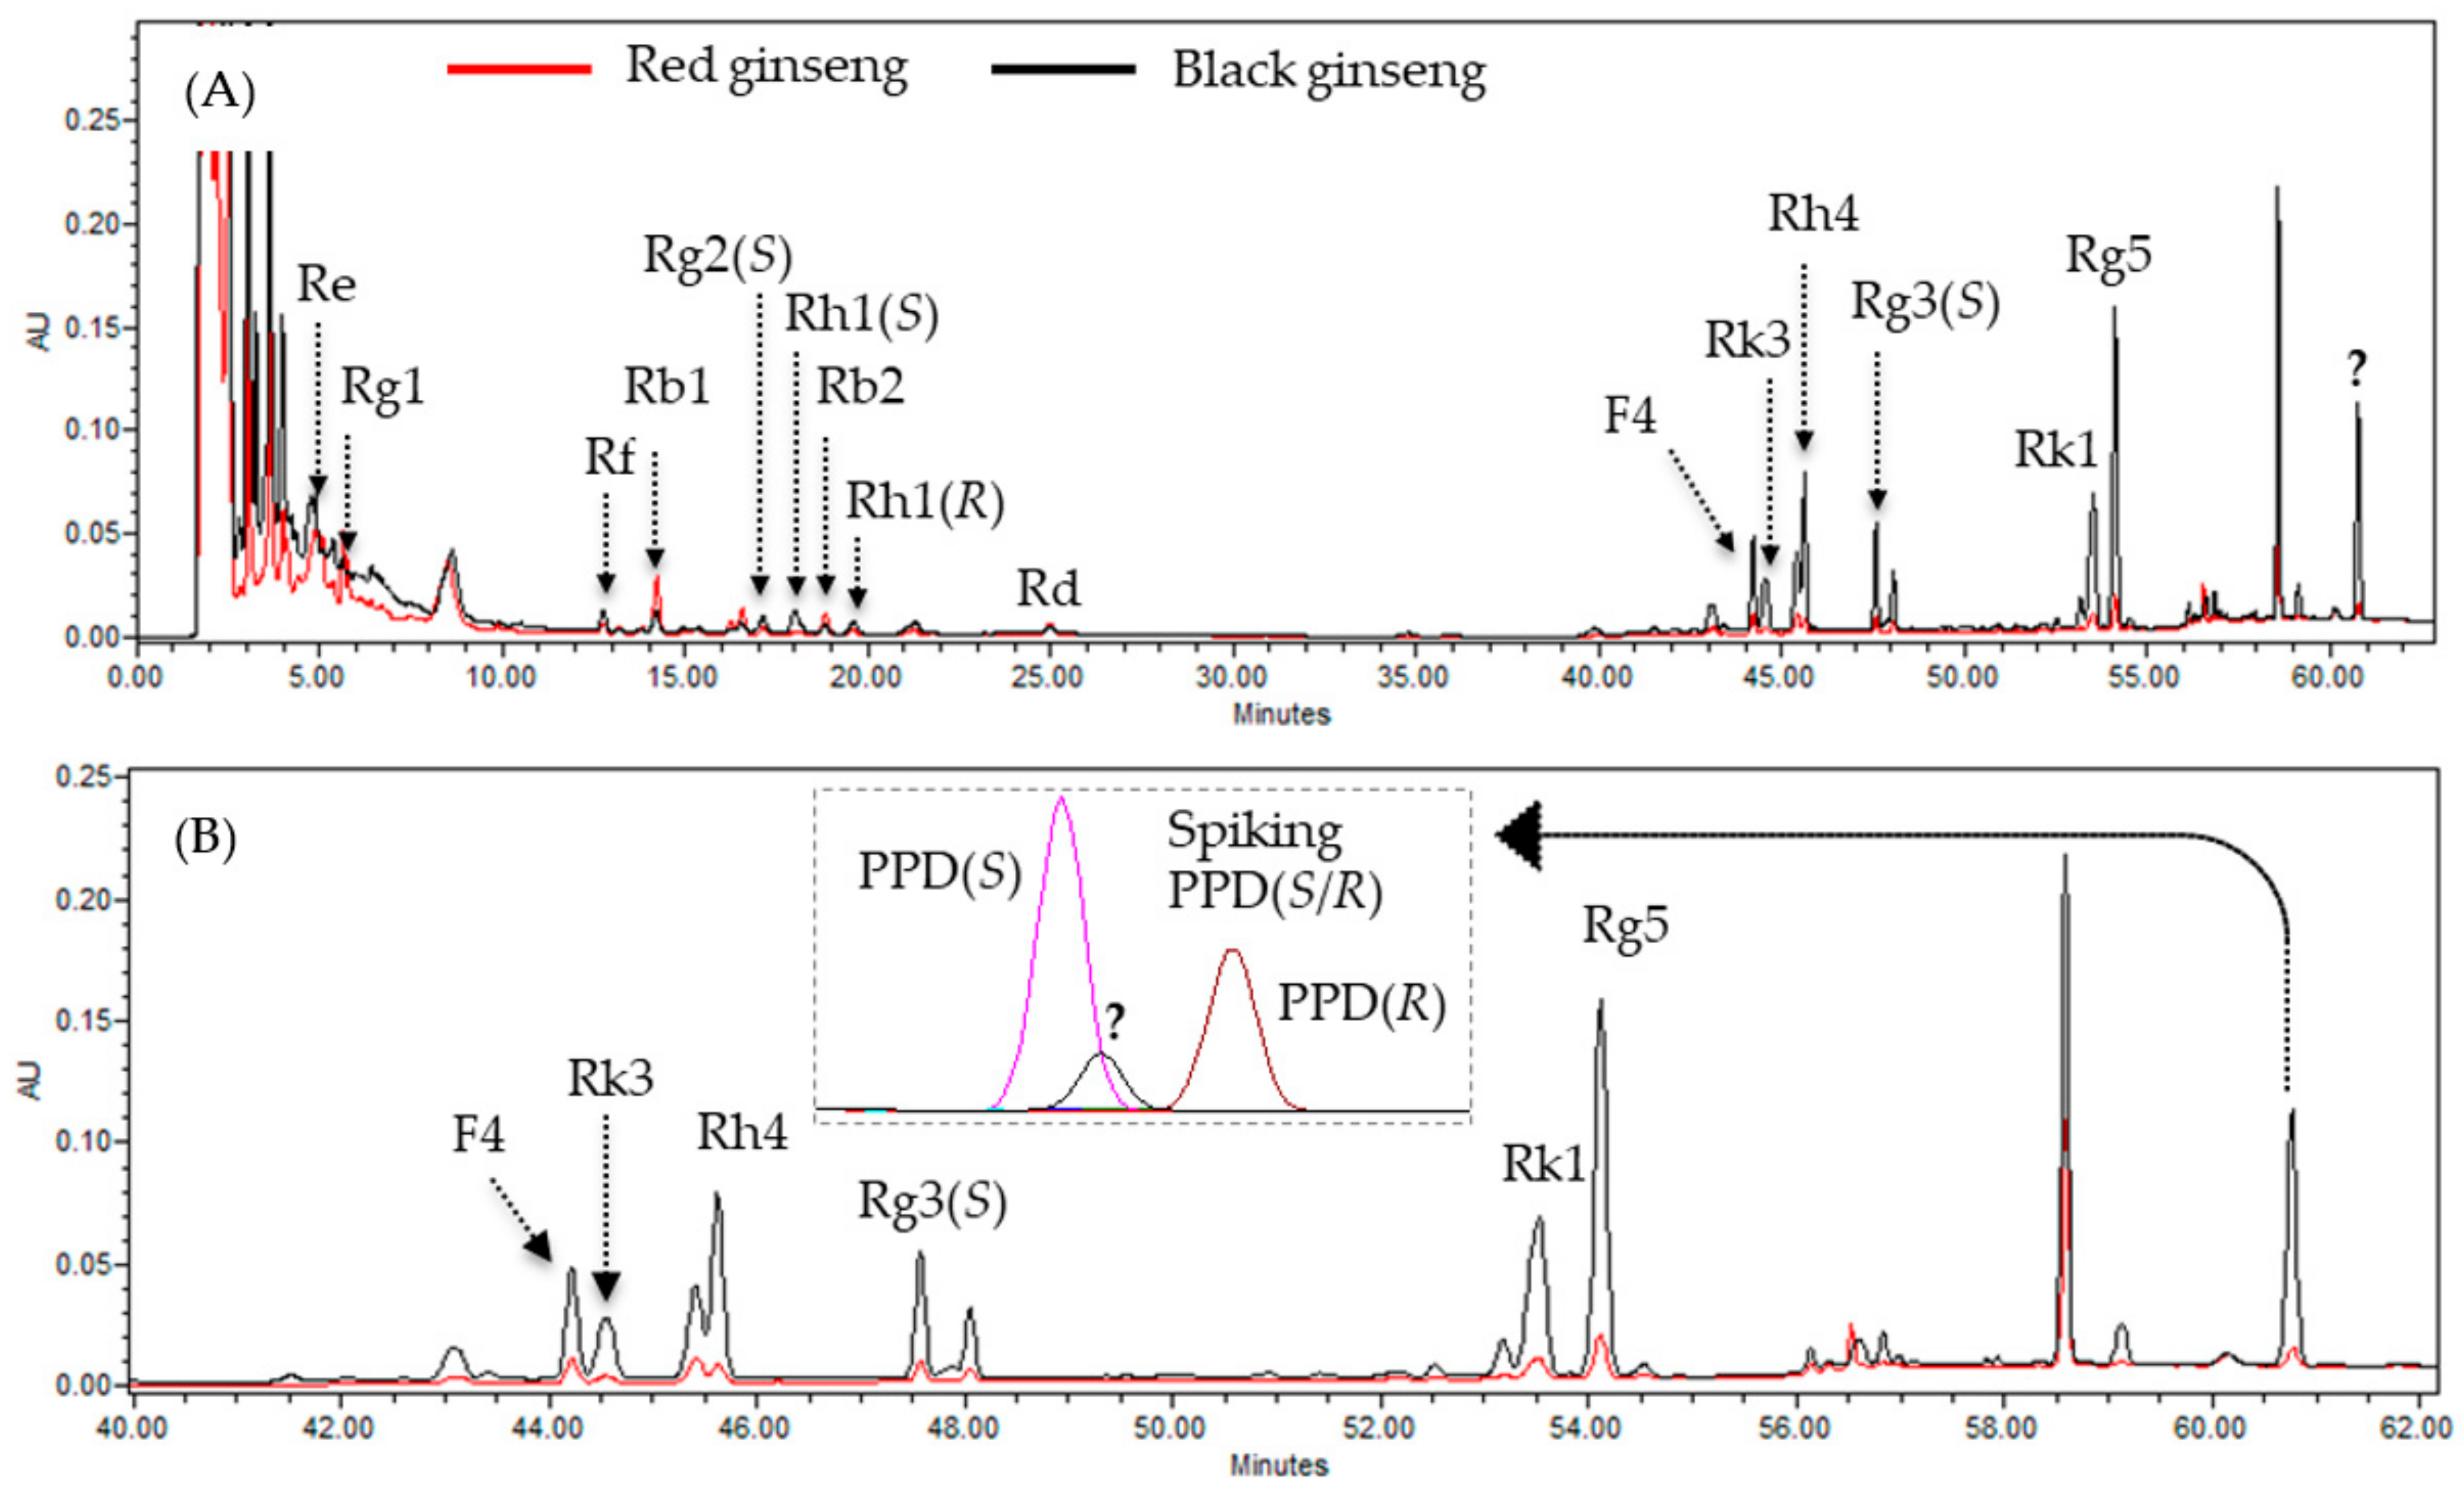
3.1. Identification of the Unidenfied Peak in a Steam-Processed Ginseng Product

The HPLC chromatogram of a steam-processed ginseng product using an ACR C18 column shows a series of distinctive ginsenoside peaks, for example, Rh4, Rg3, Rk1, Rk3, F4, and Rg5, as shown in Figure 1A. The ginsenoside profiles agree well with the results obtained in previous comparative analyses between raw and processed ginsengs [8,23]. We found an unknown HPLC peak at 61 min, with ten-fold increased intensity in the extract of a black ginseng product after the ninth repetitive steaming and drying process. Thus, protopanaxadiol (PPD), the most non-polar compound among ginsenosides, was considered a potential candidate for the unknown peak, since it appeared at the end of the solvent gradient. A C18 HPLC chromatogram showed that the unknown peak had a similar retention time as the reference compound 20(S)-PPD. However, further repeated HPLC analysis confirmed that the unknown peak had a different retention time from both 20(S)-PPD and 20(R)-PPD in Figure 1B.
The mass spectrum extracted from the HPLC peak eluting at 61 min showed a major ion at m/z 279.23 in the negative ion mode, which can be seen in Figure 2A. This corresponded to the theoretical mass of a pseudo-molecular ion [M-H] of C18H32O2, based on the isotope abundance using MassLynxTM software with 1.8 ppm mass accuracy. Its fragmentation yielded ions at m/z 261.19 in the subsequent MS/MS analysis, as in Figure 2B. The ion fragment at m/z 261.19 matches well with the pseudo-molecular ion of [M-H-H2O], as the loss of H2O is expected in fatty acids after collision activation in a tandem mass spectrometer [24]. Accordingly, candidates for the unknown peak at 61 min were narrowed down to linoleic acid and conjugated linoleic acids based on the mass data and the mass spectral information resource on food constituents, FoodDB (http://foodb.ca/ (accessed on 6 February 2021)).

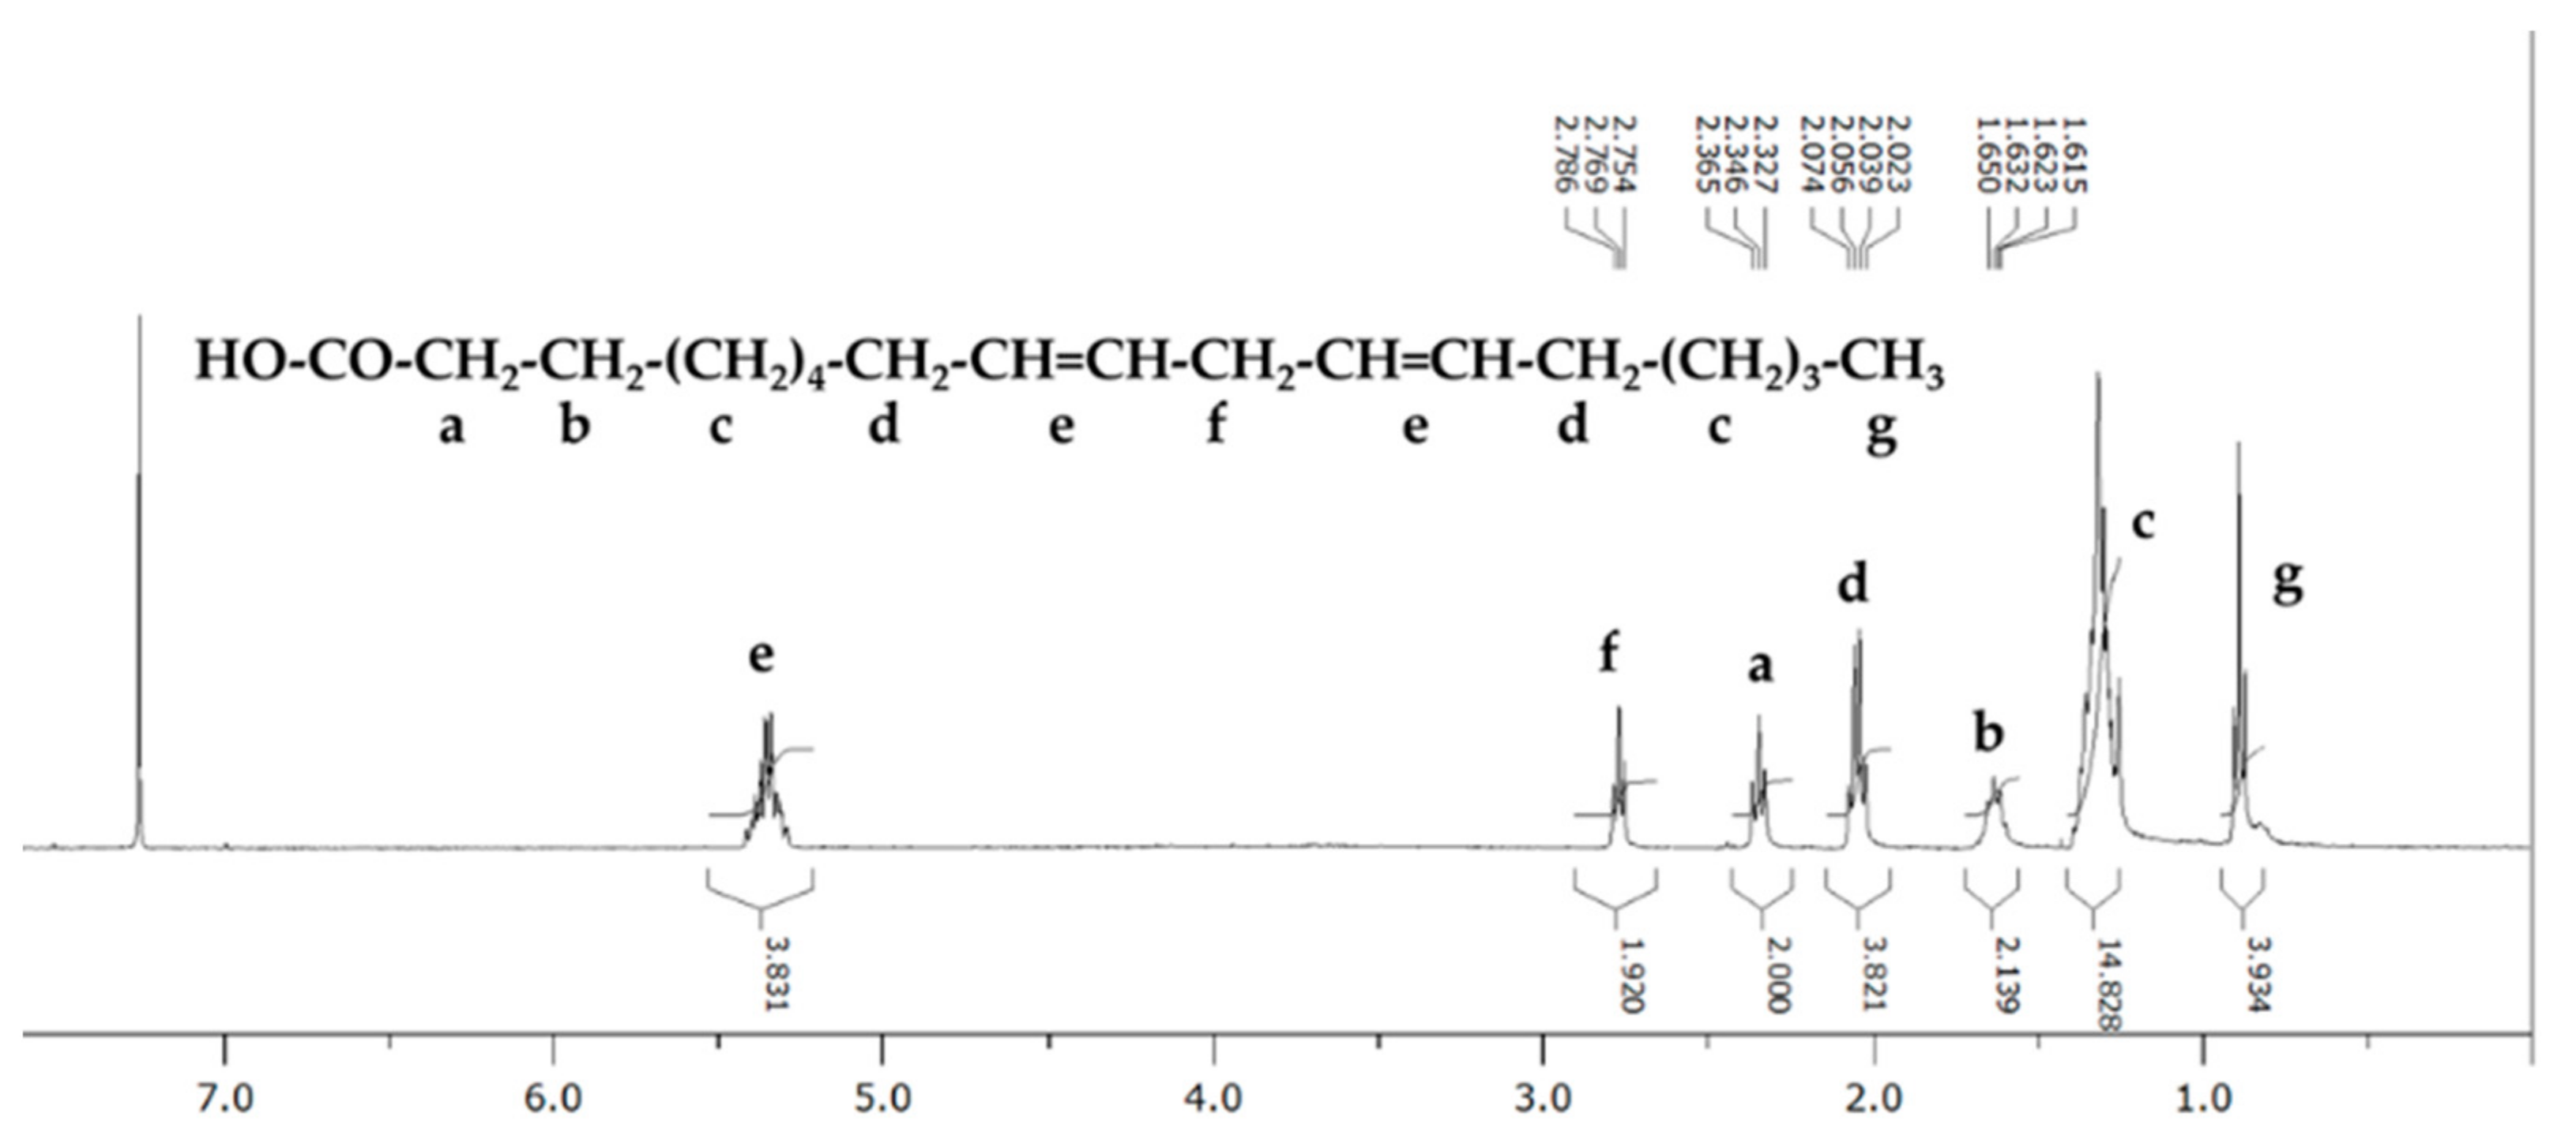
3.2. Further Identification of the Candidate Using NMR

The HPLC peak at 61 min was collected from the HPLC elution several times and concentrated under reduced pressure. It was dissolved in CDCl3 and analyzed using NMR spectroscopy. Figure 3 and Figure S1 contains the 1H NMR spectrum of a representative fractionated sample (the peak at 61 min) of black ginseng. This spectrum shows resonance peaks for the terminal methyl groups, allylic methylene and bis-allylic methylene at 0.8–0.9, 2.0–2.1, and 2.7–2.8 ppm, respectively, and a distinct peak for the olefinic protons at 5.3–5.4 ppm. Table 2 shows that the chemical shift values match well with those of linoleic acid in the 1H-NMR spectra database HMDB (http://hmdb.ca/ (accessed on 30 May 2021)) [25]. The NMR spectrum also indicates that the peak integration values of allylic, bis-allylic, and olefinic hydrogen were 3.889, 1.915, and 3.866, respectively. These results also agree well with the theoretical integration values for the corresponding protons at the ratio 4:2:4 of linoleic acid [26]. Linoleic acid is a cis–cis dienoic acid with the chemical shift value of allylic methylene proton at 2.72 ppm, which cis–trans and trans–trans dienoic acids have at 2.77 and 2.61 ppm, respectively [26]. Unlike linoleic acid, the olefinic protons in conjugated linoleic acids have different chemical shifts due to the adjacent diene structure, as listed in Table 2 [27]. The NMR results show that the unknown peak does not contain any conjugated linoleic acids. Accordingly, the mass fragmentation and 1H NMR analysis revealed that the unknown peak was linoleic acid (cis-9, cis-12-octadecadienoic acid).

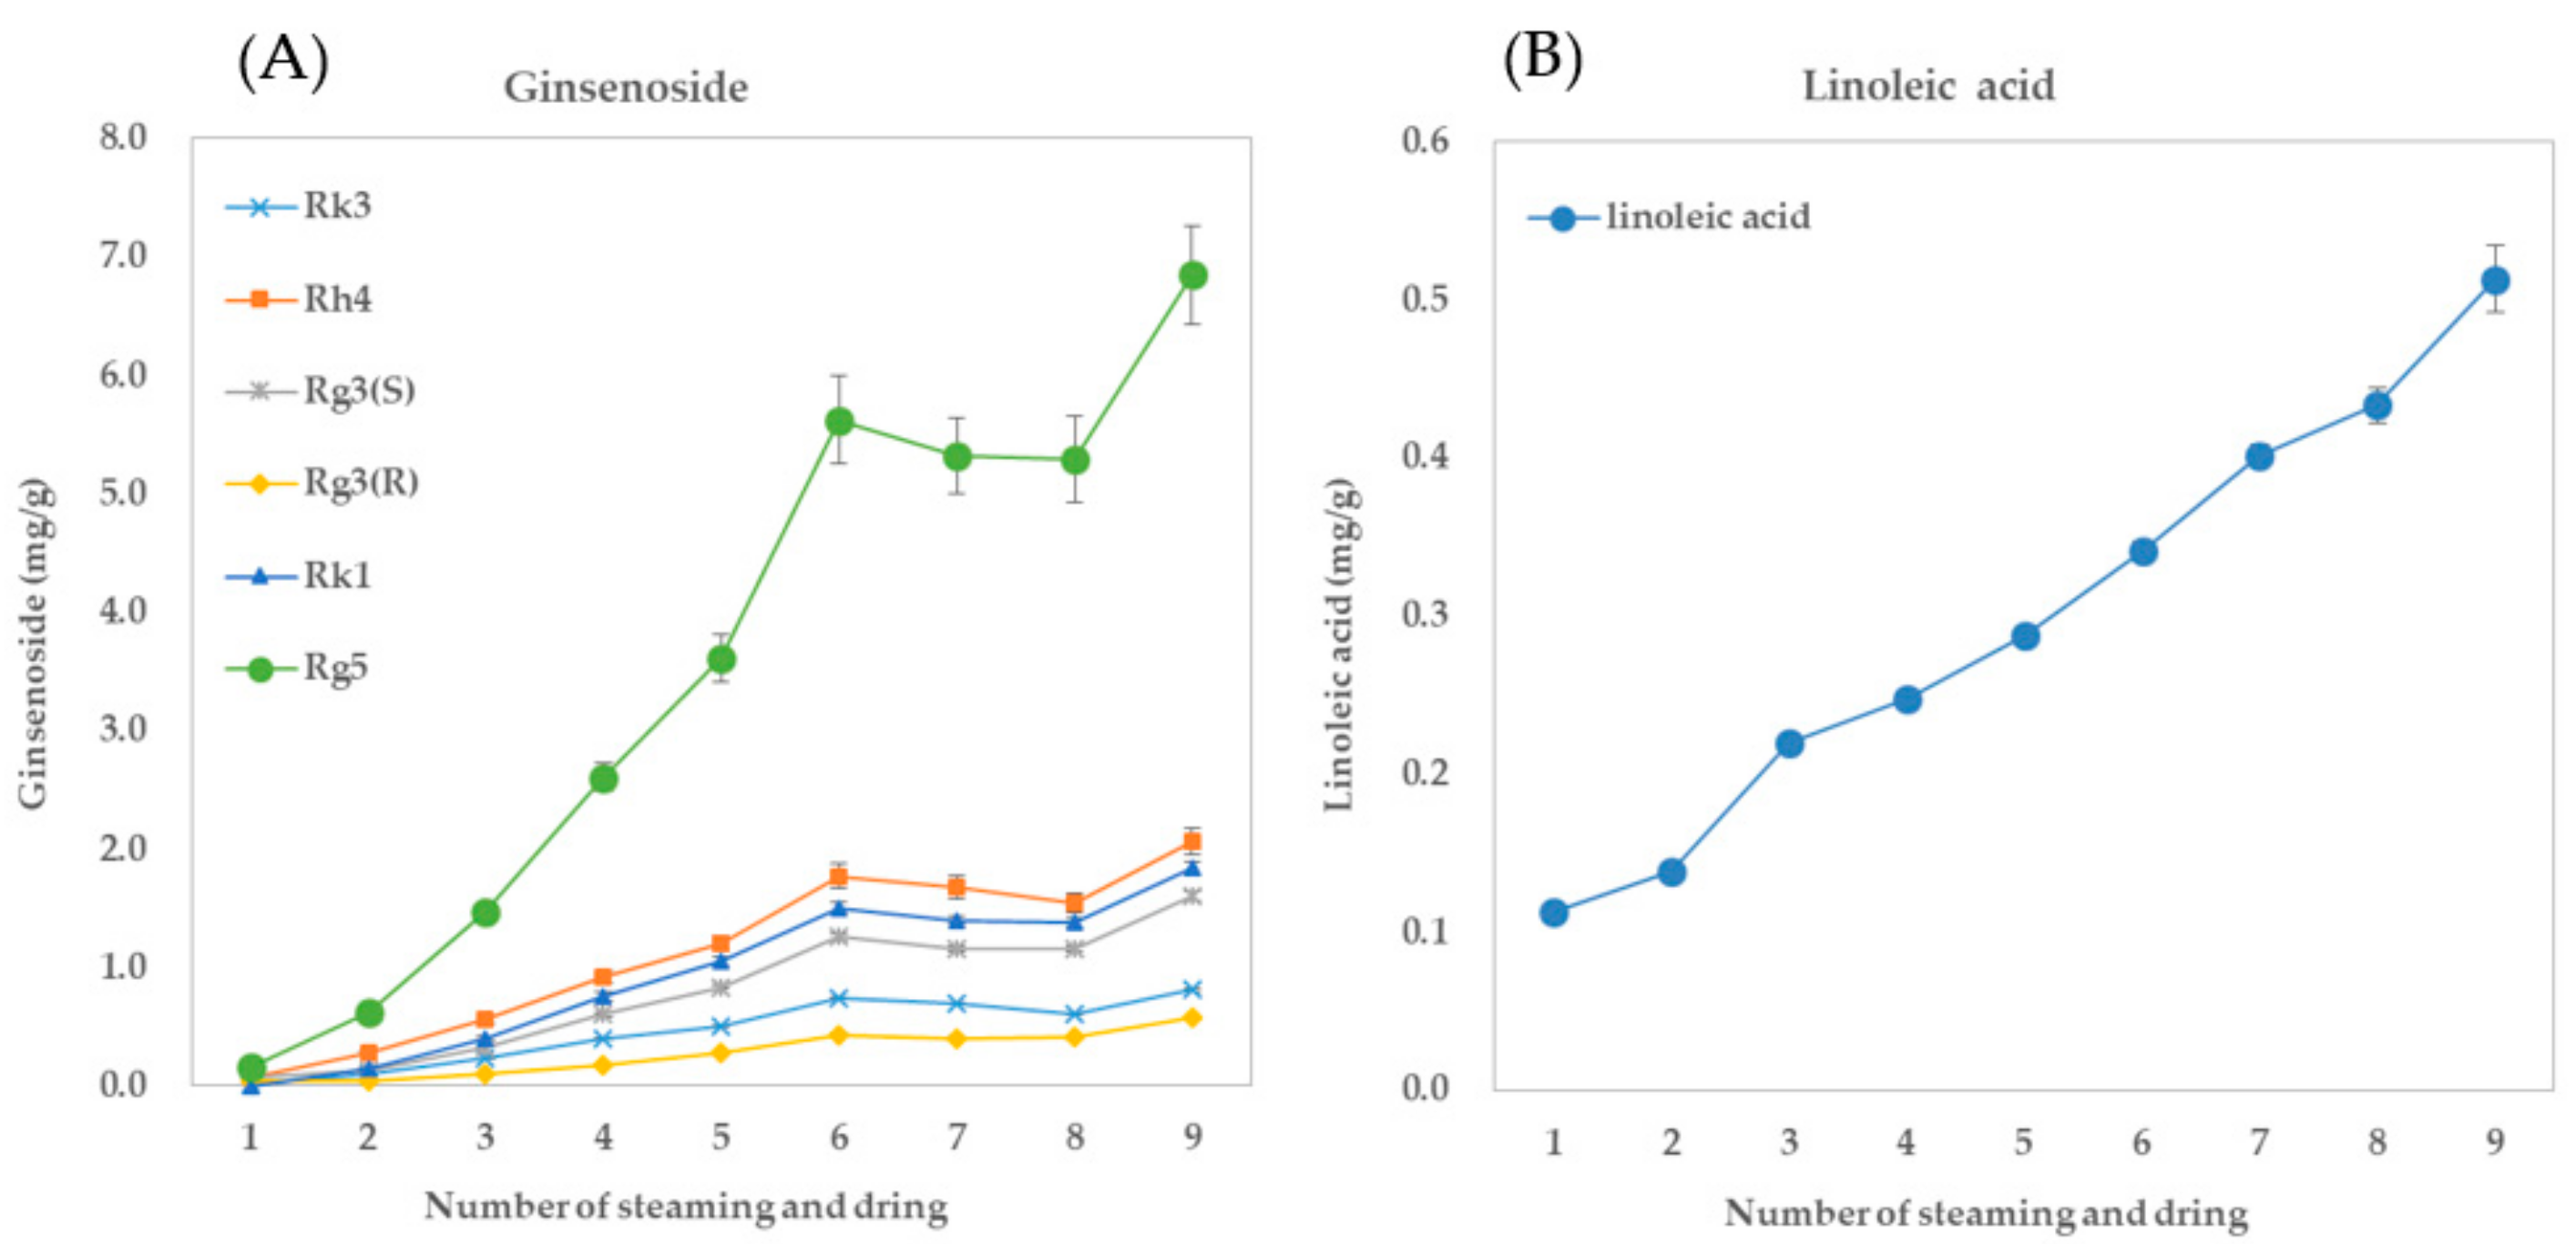
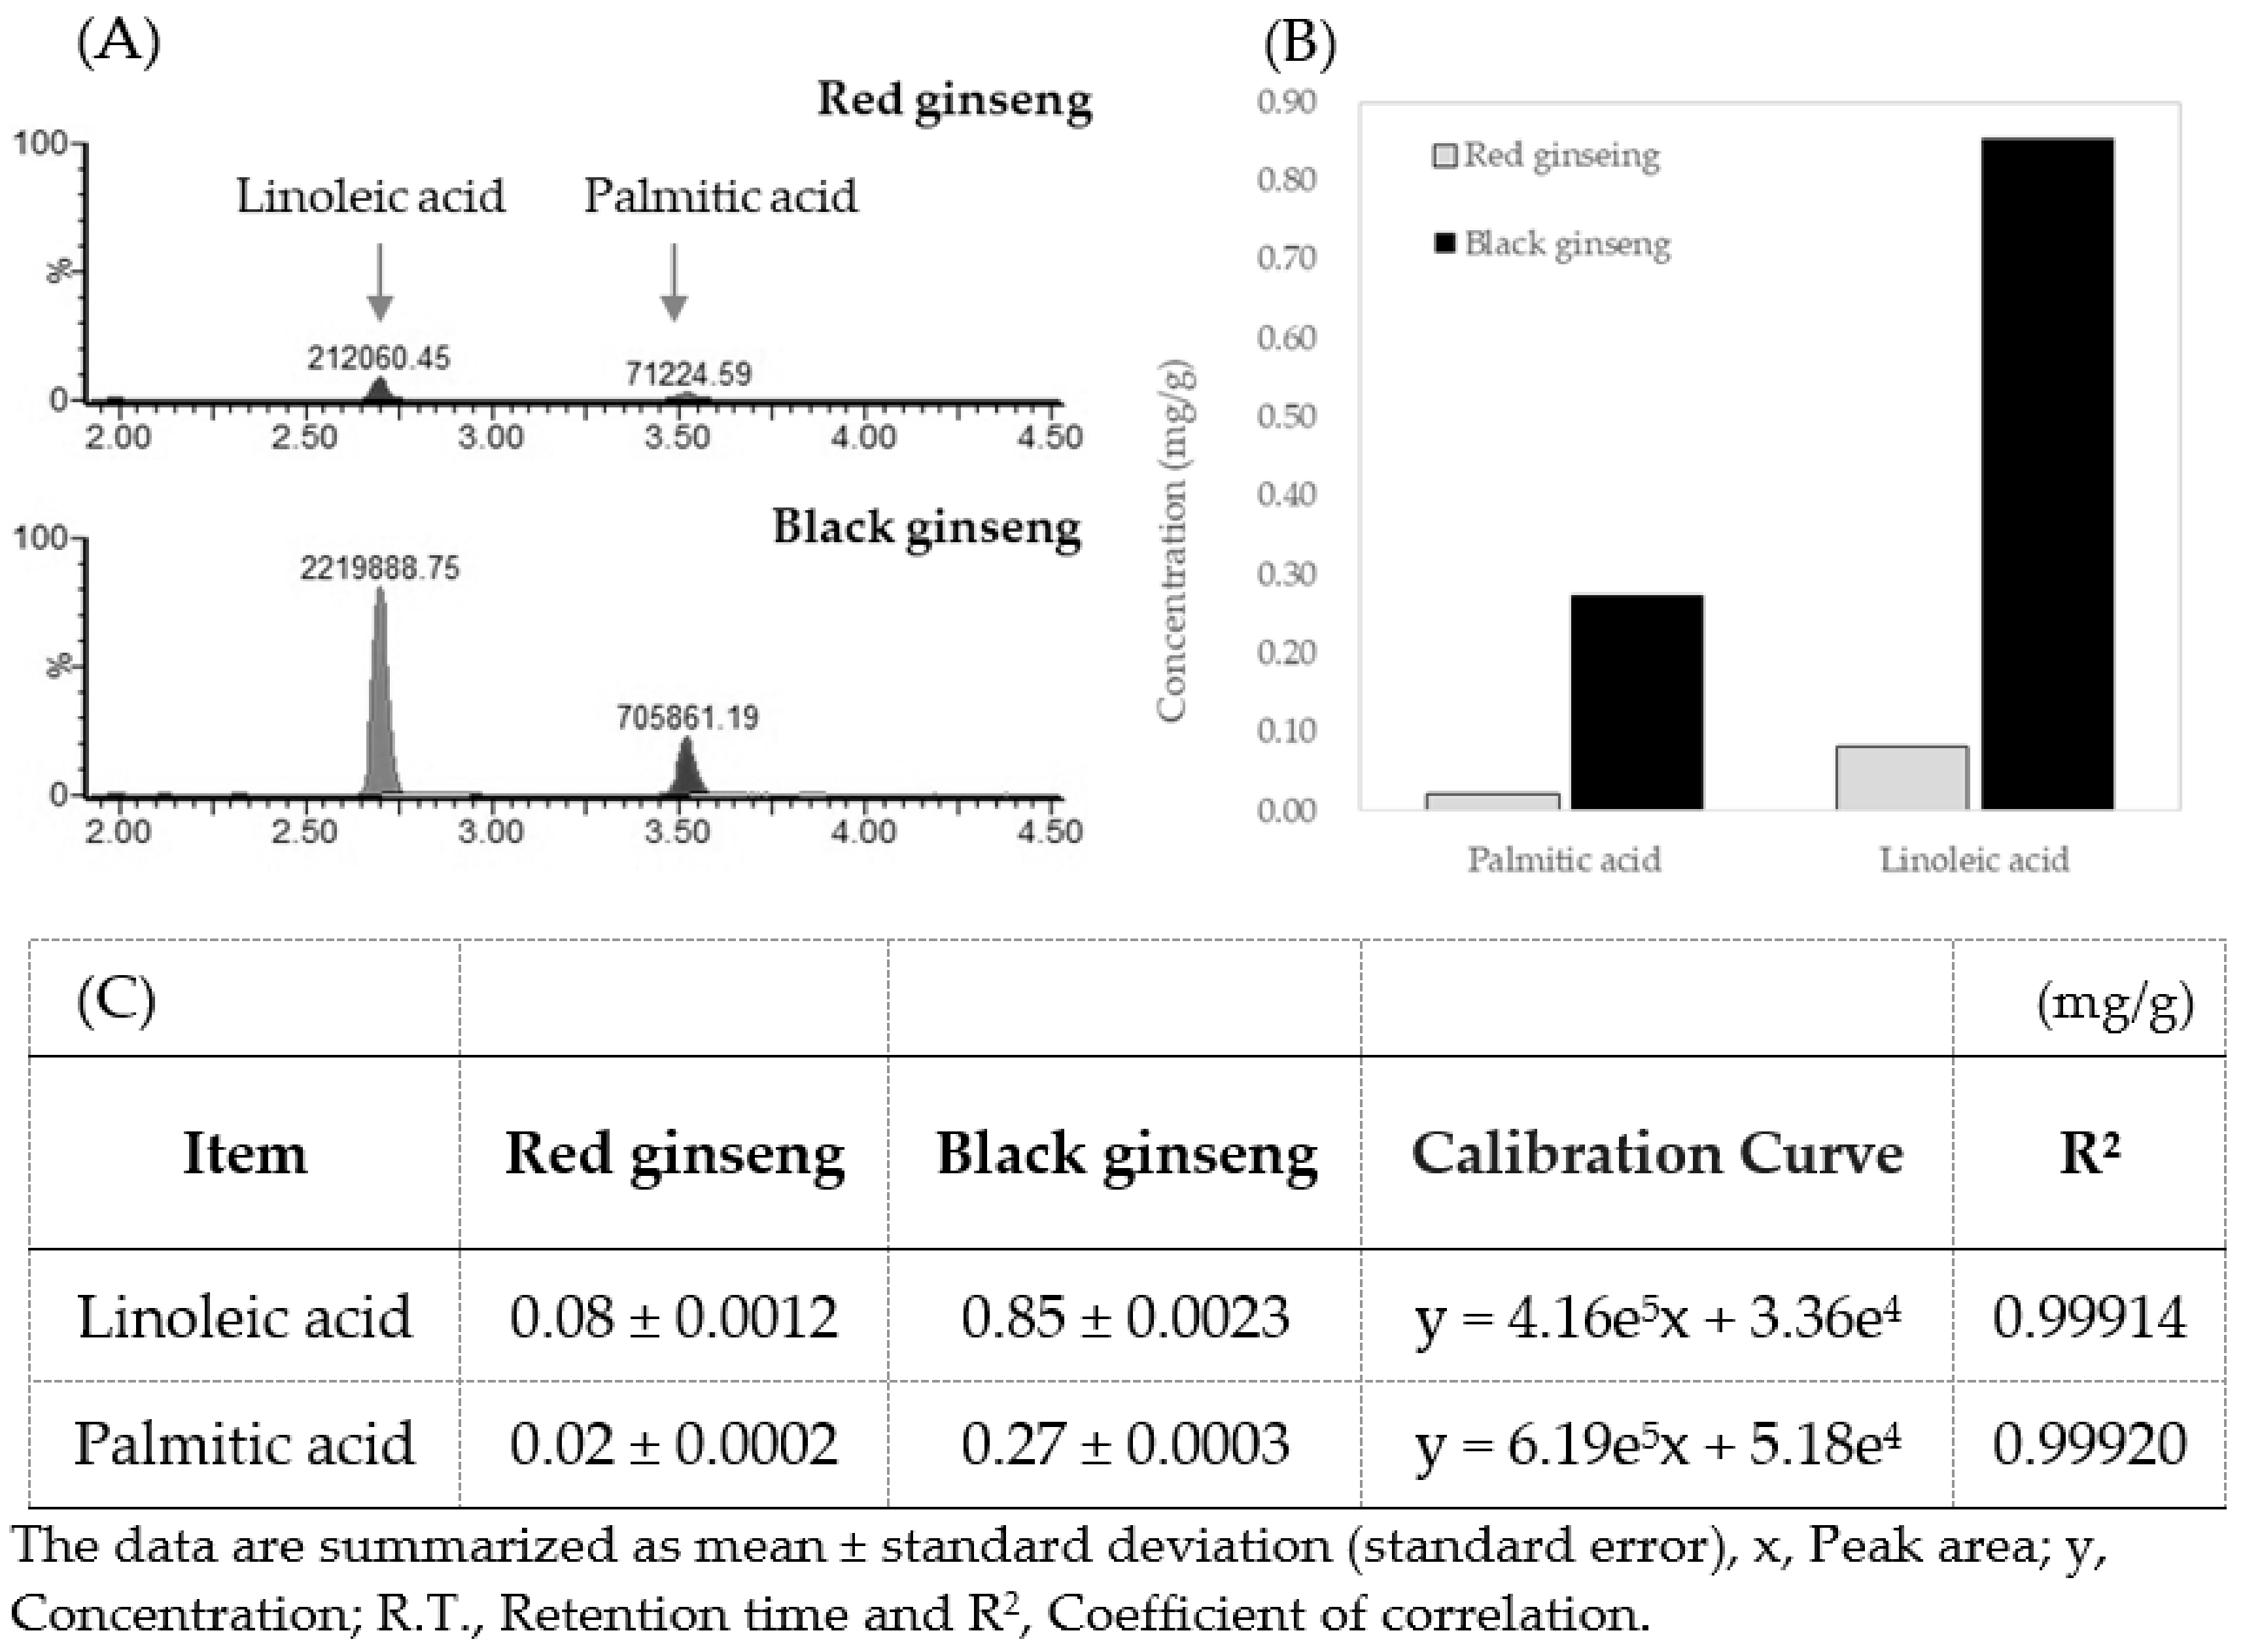
3.3. Quantitation of Linoleic Acid and Palmitic Acid in Processed Ginseng

All the methanol extracts of ginseng products at each cycle of the steaming and drying process were analyzed to quantify ginsenosides. The ginsenoside profiles are shown in Figure 4A and Table 3. Ginsenoside derivatives, Rk1, Rg3 (S/R), Rh4, Rk3 and Rg5increased proportionally to the number of hydrothermal cycles. Rk3 and Rg3 (S) increased with the number of cycles and reached a plateau after the sixth treatment, while Rg5 and Rh4 also increased with steaming but decreased after the sixth treatment, suggesting that dynamic cleavage and isomerization reactions of ginsenosides occurred with steaming and drying. However, linoleic acid increase was monotonous with the hydrothermal cycles, as seen in Figure 4B. Ginsenoside contents vary by year and region similar to other agricultural products, and also vary in the different parts of ginseng [28]. Accordingly, linoleic content can be a more reliable indicator of the number of hydrothermal treatments.
Since both linoleic acid and palmitic acid account for more than 80% of the fatty acids in ginseng root [29], the two representative compounds were quantified. The same methanol extracts used for the quantification of ginsenosides were also analyzed for linoleic acid using the LC-MS/MS with SIM method. Figure 4 shows that linoleic acid content was directly proportional to the number of steamings. The respective contents of linoleic acid and palmitic acid in the methanol extracts of black ginseng products reached 0.85 and 0.27 mg/g (Figure 5, result of another sample set with Figure 4). These results show that free fatty acid content more accurately reflects the hydrothermal history of the manufacturing process of black ginseng products compared to ginsenosides.

4. Discussion

We demonstrated in this study that linoleic acid increased significantly in black ginseng products made by a hydrothermal process under atmospheric pressure. Although the unknown HPLC peak eluting almost at the end of the solvent gradient in an ordinary HPLC separation can be confused with PPD, which is the most non-polar ginsenoside, we successfully showed that it is not a ginsenoside but rather linoleic acid by using analytical techniques such as LC-MS/MS and NMR. In addition, free fatty acids are known to usually increase in processed foods such as baked potato [30] and cooked pork [31]; thus, the hydrothermal degradation of lipids seems responsible for the increased free fatty acid content of black ginseng products.
The quantitation of ginsenosides and free fatty acids was carried out from the same methanol extract samples of black ginseng products. Linoleic acid was directly proportional to the number of hydrothermal treatments, suggesting that it can be a marker compound for black ginseng products. Since methanol extraction is a simple and rapid method for sample preparation, it can be used for monitoring the progress of black ginseng production. An internal standard is usually required for the quantitation of ginsenosides in commercial ginseng products [17]. Thus, linoleic acid could serve as an innate standard as well as a chemical time stamp for black ginseng products.
Determination of free fatty acid content is usually performed using gas chromatography and tandem mass spectrometry (GC-MS/MS). However, fatty acids require derivatization prior to GC analysis, which is time-consuming and may cause rearrangement of the fatty acids during the derivatization reaction [32]. Fatty acid methyl esters arise not only from free fatty acids but also from intact complex lipids [33]. Moreover, GC-MS analysis of low volatility, long-chain fatty acids (>C24) is problematic even after fatty acid methyl ester derivatization [33]. Therefore, the MRM method using LC separation is helpful for the quantitative analysis of free fatty acids for simplified analysis.

Supplementary Materials

The following are available online at https://www.mdpi.com/article/10.3390/separations8110208/s1, Figure S1: 1H NMR spectra overlay of the commercial linoleic acid (A) and a representative fractionated sample (peak at 61 minutes) of black ginseng (B). 1H NMR spectrum of linoleic acid (Cas.No. 60-33-3, MilliporeSigma, St. Louis, MO, USA) was exactly same with fractionated sample. The magnified spectrum of olefinic hydrogen is indicated by the dotted rectangle.

Author Contributions

Conceptualization, J.J. and T.-K.K.; methodology, T.-K.K. and C.L.; software, T.-K.K. and C.L.; validation, T.-K.K. and C.L.; formal analysis, T.-H.N.; investigation, T.-K.K., C.L. and J.J.; resources, K.-S.K. and Y.-K.S.; data curation, J.J. and T.-K.K.; writing—original draft preparation, J.J.; writing—review and editing, J.J. and T.-K.K.; visualization, J.J. and T.-K.K.; supervision, J.J.; project administration, S.-H.Y. (Seok-Hun Yun); funding acquisition, K.K. and S.-H.Y. (Seok-Hwan Yoon). All authors have read and agreed to the published version of the manuscript.

Funding

This research was financially supported by the CJ CheilJedang Corporation.

Institutional Review Board Statement

Not applicable.

Informed Consent Statement

Not applicable.

Data Availability Statement

The data presented in this study are available on request from the corresponding author.

Acknowledgments

The authors thank for the support from CJ BLOSSOM PARK.

Conflicts of Interest

The authors are employees of the CJ CheilJedang Corporation. However, the founding sponsors had no role in the performance of the experiments, in the collection, analyses, interpretation, validation, or visualization of data, or in the writing of the original draft.

References

  1. Metwaly, A.M.; Lianlian, Z.; Luqi, H.; Deqiang, D. Black Ginseng and Its Saponins: Preparation, Phytochemistry and Pharmacological Effects. Molecules 2019, 24, 1856. [Google Scholar] [CrossRef] [Green Version]
  2. Zhu, L.; Luan, X.; Dou, D.; Huang, L. Comparative Analysis of Ginsenosides and Oligosaccharides in White Ginseng (WG), Red Ginseng (RG) and Black Ginseng (BG). J. Chromatogr. Sci. 2019, 57, 403–410. [Google Scholar] [CrossRef] [PubMed]
  3. Jin, Y.; Kim, Y.; Jeon, J.; Wang, C.; Min, J.; Noh, H.; Yang, D. Effect of White, Red And Black Ginseng On Physicochemical Properties And Ginsenosides. Plant Foods Hum. Nutr. 2015, 70, 141–145. [Google Scholar] [CrossRef]
  4. Sun, B.; Gu, L.; Fang, Z.; Wang, C.; Wang, Z.; Lee, M.; Li, Z.; Li, J.; Sung, C. Simultaneous Quantification of 19 Ginsenosides in Black Ginseng Developed from Panax Ginseng By HPLC–ELSD. J. Pharm. Biomed. Anal. 2009, 50, 15–22. [Google Scholar] [CrossRef]
  5. Yang, Y.; Ju, Z.; Yang, Y.; Zhang, Y.; Yang, L.; Wang, Z. Phytochemical Analysis of Panax Species: A Review. J. Ginseng Res. 2021, 45, 1–21. [Google Scholar] [CrossRef] [PubMed]
  6. Lee, S.; Bae, B.; Park, H.; Ahn, N.; Cho, B.; Cho, Y.; Kwak, Y. Characterization of Korean Red Ginseng (Panax Ginseng Meyer): History, Preparation Method, and Chemical Composition. J. Ginseng Res. 2015, 39, 384–391. [Google Scholar] [CrossRef] [PubMed] [Green Version]
  7. Sun, B.; Xu, M.; Li, Z.; Wang, Y.; Sung, C. UPLC-Q-TOF-MS/MS Analysis for Steaming Times-Dependent Profiling of Steamed Panax Quinquefolius and Its Ginsenosides Transformations Induced by Repetitious Steaming. J. Ginseng Res. 2012, 36, 277–290. [Google Scholar] [CrossRef] [Green Version]
  8. Sun, B.; Pan, F.; Sung, C. Repetitious Steaming-Induced Chemical Transformations and Global Quality of Black Ginseng Derived from Panax Ginseng by HPLC-ESI-MS/Msn Based Chemical Profiling Approach. Biotechnol. Bioprocess Eng. 2011, 16, 956–965. [Google Scholar] [CrossRef]
  9. Lai, C.; Tan, T.; Zeng, S.; Qi, L.; Liu, X.; Dong, X.; Li, P.; Liu, E. An Integrated High Resolution Mass Spectrometric Data Acquisition Method for Rapid Screening of Saponins in Panax Notoginseng (Sanqi). J. Pharm. Biomed. Anal. 2015, 109, 184–191. [Google Scholar] [CrossRef] [PubMed]
  10. Qiu, S.; Yang, W.; Shi, X.; Yao, C.; Yang, M.; Liu, X.; Jiang, B.; Wu, W.; Guo, D. A Green Protocol for Efficient Discovery of Novel Natural Compounds: Characterization of New Ginsenosides from the Stems and Leaves of Panax Ginseng as A Case Study. Anal. Chim. Acta 2015, 893, 65–76. [Google Scholar] [CrossRef] [PubMed]
  11. Ratan, Z.; Haidere, M.; Hong, Y.; Park, S.; Lee, J.; Lee, J.; Cho, J. Pharmacological Potential of Ginseng and Its Major Component Ginsenosides. J. Ginseng Res. 2021, 45, 199–210. [Google Scholar] [CrossRef] [PubMed]
  12. Kim, J. Pharmacological and Medical Applications of Panax Ginseng and Ginsenosides: A Review for Use in Cardiovascular Diseases. J. Ginseng Res. 2018, 42, 264–269. [Google Scholar] [CrossRef]
  13. Bai, L.; Gao, J.; Wei, F.; Zhao, J.; Wang, D.; Wei, J. Therapeutic Potential of Ginsenosides as An Adjuvant Treatment for Diabetes. Front. Pharmacol. 2018, 9, 423. [Google Scholar] [CrossRef] [PubMed] [Green Version]
  14. Rajabian, A.; Rameshrad, M.; Hosseinzadeh, H. Therapeutic Potential of Panax Ginseng and Its Constituents, Ginsenosides and Gintonin, in Neurological and Neurodegenerative Disorders: A Patent Review. Expert Opin. Ther. Pat. 2018, 29, 55–72. [Google Scholar] [CrossRef] [PubMed]
  15. Sodrul, I.; Wang, C.; Chen, X.; Du, J.; Sun, H. Role of Ginsenosides in Reactive Oxygen Species-Mediated Anticancer Therapy. Oncotarget 2018, 9, 2931–2950. [Google Scholar] [CrossRef] [PubMed]
  16. Lee, J.; Han, H.; Yuan, X.; Park, E.; Lee, J.; Kim, J. A Rapid, Simultaneous and Quantitative Analysis of 26 Ginsenosides in White and Red Panax Ginseng Using LC–MS/MS. Appl. Biol. Chem. 2021, 64, 13. [Google Scholar] [CrossRef]
  17. Uhr, L.; Chen, Y.; Sit, D.; Li, P. Ginsenosides in Commercial Ginseng Products Analyzed by Liquid Chromatography-Tandem Mass Spectrometry. ISRN Anal. Chem. 2014, 2014, 486842. [Google Scholar] [CrossRef] [Green Version]
  18. Boiteau, R.; Hoyt, D.; Nicora, C.; Kinmonth-Schultz, H.; Ward, J.; Bingol, K. Structure Elucidation of Unknown Metabolites in Metabolomics by Combined NMR and MS/MS Prediction. Metabolites 2018, 8, 8. [Google Scholar] [CrossRef] [PubMed] [Green Version]
  19. Park, H.; In, G.; Han, S.; Lee, M.; Kim, S.; Kim, K.; Cho, B.; Han, G.; Chang, I. Simultaneous Determination of 30 Ginsenosides in Panax Ginseng Preparations Using Ultra Performance Liquid Chromatography. J. Ginseng Res. 2013, 37, 457–467. [Google Scholar] [CrossRef] [Green Version]
  20. De Vijlder, T.; Valkenborg, D.; Lemière, F.; Romijn, E.; Laukens, K.; Cuyckens, F. A Tutorial in Small Molecule Identification via Electrospray Ionization-Mass Spectrometry: The Practical Art of Structural Elucidation. Mass Spectrom. Rev. 2018, 37, 607–629. [Google Scholar] [CrossRef] [PubMed]
  21. Wilson, W.; Sander, L. Method Development for the Certification of a Ginsenoside Calibration Solution via Liquid Chromatography with Absorbance and Mass Spectrometric Detection. J. Chromatogr. A 2018, 1574, 114–121. [Google Scholar] [CrossRef]
  22. Cífková, E.; Holčapek, M.; Lísa, M.; Ovčačíková, M.; Lyčka, A.; Lynen, F.; Sandra, P. Nontargeted Quantitation of Lipid Classes Using Hydrophilic Interaction Liquid Chromatography–Electrospray Ionization Mass Spectrometry with Single Internal Standard and Response Factor Approach. Anal. Chem. 2012, 84, 10064–10070. [Google Scholar] [CrossRef]
  23. Wan, J.; Fan, Y.; Yu, Q.; Ge, Y.; Yan, C.; Alolga, R.; Li, P.; Ma, Z.; Qi, L. Integrated Evaluation of Malonyl Ginsenosides, Amino Acids and Polysaccharides in Fresh and Processed Ginseng. J. Pharm. Biomed. Anal. 2015, 107, 89–97. [Google Scholar] [CrossRef]
  24. Murphy, R. Tandem Mass Spectrometry of Lipids: Molecular Analysis of Complex Lipids, Chapter 1. Fatty Acids; The Royal Society of Chemistry: Cambridge, UK, 2015; pp. 1–39. [Google Scholar] [CrossRef]
  25. Wishart, D.; Knox, C.; Guo, A.; Eisner, R.; Young, N.; Gautam, B.; Hau, D.; Psychogios, N.; Dong, E.; Bouatra, S.; et al. HMDB: A Knowledgebase for The Human Metabolome. Nucleic Acids Res. 2009, 37, D603–D610. [Google Scholar] [CrossRef]
  26. Alexandri, E.; Ahmed, R.; Siddiqui, H.; Choudhary, M.; Tsiafoulis, C.; Gerothanassis, I. High Resolution NMR Spectroscopy as A Structural and Analytical Tool for Unsaturated Lipids in Solution. Molecules 2017, 22, 1663. [Google Scholar] [CrossRef]
  27. Purcell, J.; Morris, S.; Susi, H. Proton Magnetic Resonance Spectra of Unsaturated Fatty Acids. Anal. Chem. 1966, 38, 588–592. [Google Scholar] [CrossRef]
  28. Jin, Y.; Kim, K.; Lim, T.; Jang, M.; Cho, C.; Rhee, Y.; Hong, H. Effects of Fresh Ginseng Size and Shape on Quality of Black Ginseng. Korean J. Food Nutr. 2016, 29, 610–617. [Google Scholar] [CrossRef] [Green Version]
  29. Lee, Y.; Im, D.; Yang, J.; Noh, D.; Kim, K.; Oh, S.; Choi, K.; Cha, Y. Study on the Qualitative Discrimination of White, Red, and Black Ginseng Extract. Korean J. Food Nutr. 2011, 24, 138–143. [Google Scholar] [CrossRef] [Green Version]
  30. Maga, J.; Twomey, J.; Cohen, M. Effect of Baking Methods on the Fatty Acid Composition of Potatoes. J. Food Sci. 1977, 42, 1669–1670. [Google Scholar] [CrossRef]
  31. Hur, S.; Lee, S.; Moon, S.; Lee, S. In Vitro Effects of Cooking Methods on Digestibility of Lipids and Formation of Cholesterol Oxidation Products in Pork. Korean J. Food Sci. Anim. Resour. 2014, 34, 280–286. [Google Scholar] [CrossRef] [Green Version]
  32. Trufelli, H.; Famiglini, G.; Termopoli, V.; Cappiello, A. Profiling of Non-Esterified Fatty Acids In Human Plasma Using Liquid Chromatography-Electron Ionization Mass Spectrometry. Anal. Bioanal. Chem. 2011, 400, 2933–2941. [Google Scholar] [CrossRef] [PubMed]
  33. Dołowy, M.; Pyka, A. Chromatographic Methods in the Separation of Long-Chain Mono- And Polyunsaturated Fatty Acids. J. Chem. 2015, 2015, 1–20. [Google Scholar] [CrossRef] [Green Version]
Figure 1. HPLC chromatograms of (A) red ginseng and black ginseng prepared after the first and ninth cycle of steaming and drying, respectively, and (B) a magnified chromatogram. The result of the spiking test with reference standard (PPD(S), PPD(R)) is indicated in the dotted rectangle, and reveals that the distinctive peak (?) was not derived from ginsenosides.
Separations 08 00208 g001
Figure 2. (A) The MS spectrum of the unknown peak with a significant difference, and (B) the magnified MS/MS spectrum obtained through fragmentation using collision-induced dissociation mode. The precursor ion ([M-H] = 279.23) was not fully fragmented. The most abundant fragment ion was [M-H] = 261.19. The structure of the fragment ion was predicted with MassFragment™ software.
Separations 08 00208 g002
Figure 3. 1H NMR spectrum of a representative fractionated sample (peak at 61 min) of black ginseng.
Separations 08 00208 g003
Figure 4. The profiles of ginsenosides (Rk1, Rg3 (S/R), Rh4, Rk3 and Rg5) (A) and linoleic acid (B) during the manufacturing process of black ginseng. The results show that linoleic acid contents appeared to more accurately reflect hydrothermal history than ginsenosides in the manufacturing of black ginseng products.
Separations 08 00208 g004
Figure 5. Chromatographic comparison of free fatty acid content in red ginseng and black ginseng (A). A ten-fold increase in free fatty acid content was observed in methanol extracts of black ginseng compared to red ginseng (B). The results of quantitative analysis of free fatty acids with MRM method using TQD (C).
Separations 08 00208 g005
Table 1. Selected ion monitoring conditions of ninth repetitive steaming for ginsenosides and linoleic acid.
ItemMolecular FormulaMolecular Weight[M-H
+HCOOH]
R.T. (min)Calibration CurveR2
Rk1C42H70O12 + HCOOH766.49811.4934.68y = 1.13e5x + 6.61e30.99654
Rg3(S)C42H72O13 + HCOOH784.50829.5030.34y = 1.25e5x + 5.52e30.99840
Rg3(R)C42H72O13 + HCOOH784.50829.5030.80y = 1.73e5x + 2.38e30.99919
Rh4C36H60O8 + HCOOH620.43665.4328.65y = 6.61e4x + 7.56e20.99988
Rk3C36H60O8 + HCOOH620.43665.4328.15y = 1.07e5x + 3.07e30.99900
Rg5C42H70O12 + HCOOH766.49811.4934.93y = 4.13e4x + 1.71e30.99985
Linoleic acidC18H32O2280.24279.2339.64y = 1.19e6x + 3.41e40.99914
x, Peak area; y, Concentration; R.T., Retention time and R2, Coefficient of correlation.
Table 2. The chemical shift values of the unknown peak at 61 min, linoleic acid, linolelaidic acid, 10(E), 12(Z)-conjugated linoleic acid, 9(E), 11(E)-conjugated linoleic acid and 9(Z), 11(Z)-conjugated linoleic acid.
ProtonsThis StudyHMDB Chemical Shift (ppm)
Linoleic AcidLinolelaidic Acid10(E), 12(Z)-CLA*9(E), 11(E)-CLA*9(Z), 11(Z)-CLA*
Olefinic5.28–5.435.375.325.32, 5.69, 5.97, 6.345.59, 6.035.47, 6.27
bis-Allylic methylene2.772.772.61---
Alpha-carbon2.352.352.302.18, 2.132.292.30
Allylic methylene2.052.031.942.032.032.15
Beta carbon1.69–1.571.631.621.611.611.62
Alkyl carbon1.20–1.401.291.321.301.311.30
Terminal methyl0.880.880.900.880.880.88
CLA*: Conjugated linoleic acid.
Table 3. Amounts of ginsenosides in fresh ginseng main root extracts after treatment by ninth repetitive steaming and drying.
[mg/g]
Number of Steaming and DringGinsenosidesLinoleic Acid
Rk1Rg3(S)Rg3(R)Rh4Rk3Rg5
10.01 ± 0.000.08 ± 0.000.04 ± 0.000.07 ± 0.010.01 ± 0.000.16 ± 0.010.11 ± 0.00
20.14 ± 0.010.14 ± 0.000.05 ± 0.000.27 ± 0.010.10 ± 0.000.62 ± 0.030.14 ± 0.00
30.40 ± 0.020.33 ± 0.010.11 ± 0.000.56 ± 0.030.23 ± 0.001.47 ± 0.070.22 ± 0.00
40.76 ± 0.030.60 ± 0.010.18 ± 0.000.92 ± 0.050.39 ± 0.012.61 ± 0.130.25 ± 0.00
51.06 ± 0.040.84 ± 0.020.28 ± 0.001.20 ± 0.070.50 ± 0.013.61 ± 0.200.29 ± 0.00
61.51 ± 0.041.26 ± 0.030.43 ± 0.021.78 ± 0.100.75 ± 0.015.62 ± 0.370.34 ± 0.01
71.40 ± 0.041.16 ± 0.030.40 ± 0.011.68 ± 0.100.69 ± 0.015.33 ± 0.320.40 ± 0.01
81.38 ± 0.041.16 ± 0.020.41 ± 0.011.54 ± 0.080.60 ± 0.015.29 ± 0.370.43 ± 0.01
91.84 ± 0.051.60 ± 0.040.58 ± 0.012.07 ± 0.110.81 ± 0.016.85 ± 0.420.51 ± 0.02
The data are summarized as mean ± standard deviation (standard error).
Publisher’s Note: MDPI stays neutral with regard to jurisdictional claims in published maps and institutional affiliations.

