Abstract
(1) Background: Ethanol precipitation is widely used in the manufacturing traditional Chinese medicines (TCMs). Insufficient mixing of ethanol solution and concentrate usually results in the coating loss of active ingredients. However, there is no index for quantitative evaluation of the mixing in ethanol precipitation. Therefore, this study aimed to define an index for quantitative evaluation of the mixing effect in ethanol precipitation of TCMs. (2) Methods: The concept and requirements of a mixing indicator were proposed. The mass percentage of concentrate fully mixed with ethanol solution (well-mixing ratio, WMR) was used as an index to evaluate the mixing effect. The formula for calculation of WMR was derived. The utility of the WMR was evaluated on stirring devices and a micromesh mixer. (3) Results: Increasing stirring speed, decreasing total solid content of the concentrate, and decreasing the diameter of the ethanol solution droplets all resulted in higher retention rates for lobetyolin and higher WMR. The WMR increased with the increasing flow rate of the concentrate and ethanol solution in the micromesh mixer. The mixing of ethanol solution and concentrate was better when using a micromesh mixer with a smaller internal mixing zone. The results revealed that WMR could be used to quantitatively characterize the mixing of concentrate and ethanol solution, although it has some limitations. (4) Conclusions: The proposed index WMR could guide quality control of the TCM ethanol precipitation process. This study represents a new contribution to improving ethanol precipitation equipment, optimizing process parameters, and enhanced properties of concentrate for TCM enterprises.
1. Introduction
As a simple and effective way to remove impurities, ethanol precipitation has been extensively applied in foods and herbal products for the purification process. Because of its simple operation and solvent safety, approximately 20% of prescription preparations and single-flavor preparations included in the Chinese Pharmacopoeia (first volume, 2020 edition) are subjected to ethanol precipitation to remove impurities [1]. Ethanol solution is introduced into the TCM concentrate, which effectively removes proteins [2], polysaccharides [3], and tannins [4], thus improving the purity of active ingredients in the supernatant. For example, the purity of total chlorogenic acid in Lonicerae Japonicae Flos [5] and hydroxysafflor yellow A [6] in Carthami Flos were improved obviously after ethanol precipitation. In addition, pectins can be purified from food by ethanol precipitation in the food industry [7,8].
The loss of active ingredients often occurs in industrial production [9]. Previous research indicated that a large number of phenolic acids were lost from Salvia miltiorrhiza concentrate in the process of industrial ethanol precipitation, and the loss ratios for danshensu, salvianolic acid B, and salvianolic acid D were even more than 50% [10,11]. A considerable number of domestic scholars have found that the active ingredients of siwu decoction [12], shuanghuanglian preparation [13], ganmaoling concentrate [14], huangqi concentrate [15], and biqiu granules [16] were lost to varying degrees in the ethanol precipitation process. To date, few foreign scholars have studied the ethanol precipitation process used with TCMs. However, Koh et al. [17] also demonstrated that rutin and tannic acid were lost in the refinement of sweet tea concentrate by the ethanol precipitation process.
It is generally considered that there are at least three reasons for the loss of active ingredients in ethanol precipitation [18], namely, coating, precipitation, and degradation. Precipitation loss is due to the low solubility of active ingredients in the supernatant [19,20,21]. In degradation loss, active ingredients generate other ingredients due to chemical reactions occurring during ethanol precipitation. The reason for coating loss is the insufficient mixing of ethanol solution and concentrate. The high viscosity of concentrate, large density difference of concentrate and ethanol solution, and a large amount of solid precipitate are the main factors resulting in the difficulties in mixing [20,21].
It is essential to improve the mixing of concentrate and ethanol solution to reduce losses arising from the coating. To the best of our knowledge, equipment factors [22], process parameters [23], and raw material characteristics [24] influence the mixing effect. Equipment factors include the mixing mode, size and shape of the stirring blade, and so on. The process operation parameter is principally the speed of ethanol solution addition. Generally, slower ethanol solution addition speed is more favorable. The total solid content of concentrate, concentrate pH, ethanol concentration [25,26], and material properties greatly impact the mixing effect. Although extensive research has been carried out on the ethanol precipitation process, there has been little discussion of a quantitative evaluation of the mixing effect. In this situation, it is impossible to judge whether the equipment, process parameters, and raw material properties have been optimized to enable full mixing of the ethanol solution and concentrate. Therefore, it is particularly important to find a method that can evaluate the mixing effect of ethanol solution and concentrate.
This research was designed to put forward an evaluation index, that is, a method for determining the proportion of the concentrate sufficiently mixed with ethanol solution (well-mixing ratio, WMR). This evaluation index was adopted to quantitatively evaluate the mixing of concentrate and ethanol solution in the process of ethanol precipitation. First, the hypothesis presented in this work was based on the principle of mass conservation, and a quantitative formula was derived for the new evaluation index. Second, Codonopsis Radix (dangshen), a widely used herbal medicinal material with the pharmacological roles of antioxidant [27] and antitumor agent [28], was employed as an example. The indicator of mixing condition was determined by the desorption method. Finally, using fundamental data from the research group’s previous work [22], single-factor experiments were performed with stirring devices and the micromesh mixer. The influences of ethanol addition mode, the droplet size of the concentrate and ethanol solution, stirring speed, the total solid content of the concentrate, and flow rate when using the micromixer on the mixing effect were investigated. On this basis, the use of the new index to evaluate quantitatively mixing was investigated, results were analyzed, and shortcomings were noted.
2. Derivation of Quantitative Evaluation Index
2.1. Features of Mixing Condition Indicator
Many previous researchers have studied the influence of ethanol content in the supernatant, concentrate density, standing time of the mixture, and ethanol consumption as ethanol precipitation indicators [29,30,31,32]. Most of these studies took the retention rate of active ingredients as one of the optimization goals. When the concentrate and the ethanol solution are insufficiently mixed, the rapidly generated precipitate will coat some of the concentrate, which prevent the active ingredients from dissolving into the ethanol solution. Nevertheless, the low retention of active ingredients was not necessarily the result of coating loss. The lower solubilities of the active ingredients in ethanol solution and chemical reactions could also reduce the retention. In addition, it has been experimentally demonstrated that precipitates adsorb small amounts of supernatant. This phenomenon ultimately led to a reduction in the retention of active ingredients. For this reason, there are limitations in the evaluation of coating loss with the retention rate for active ingredients.
A mixing condition indicator can either be a certain component in the concentrate or a component added to indicate the mixing degree of ethanol solution and concentrate. The mixing condition indicator is a component with high solubility in the ethanol solution. Therefore, the precipitation loss will not occur for the mixing condition indicator in the ethanol precipitation process. The mixing condition indicator is also a component chemically stable in the ethanol precipitation process. Therefore, the total amount of a mixing condition indicator should remain constant before and after ethanol precipitation. If the total amount of the mixing condition indicator significantly decreased after ethanol precipitation, the coating loss probably occurs. If a mixing condition indicator can be found in the ethanol precipitation system, the mixing degree of ethanol solution and concentrate can be quantitatively determined.
2.2. Derivation of WMR Calculation Formula
Component A was used as the mixing condition indicator used to derive the formula for the WMR. According to the principle of conservation of mass in the Codonopsis Radix ethanol precipitation system, there are:
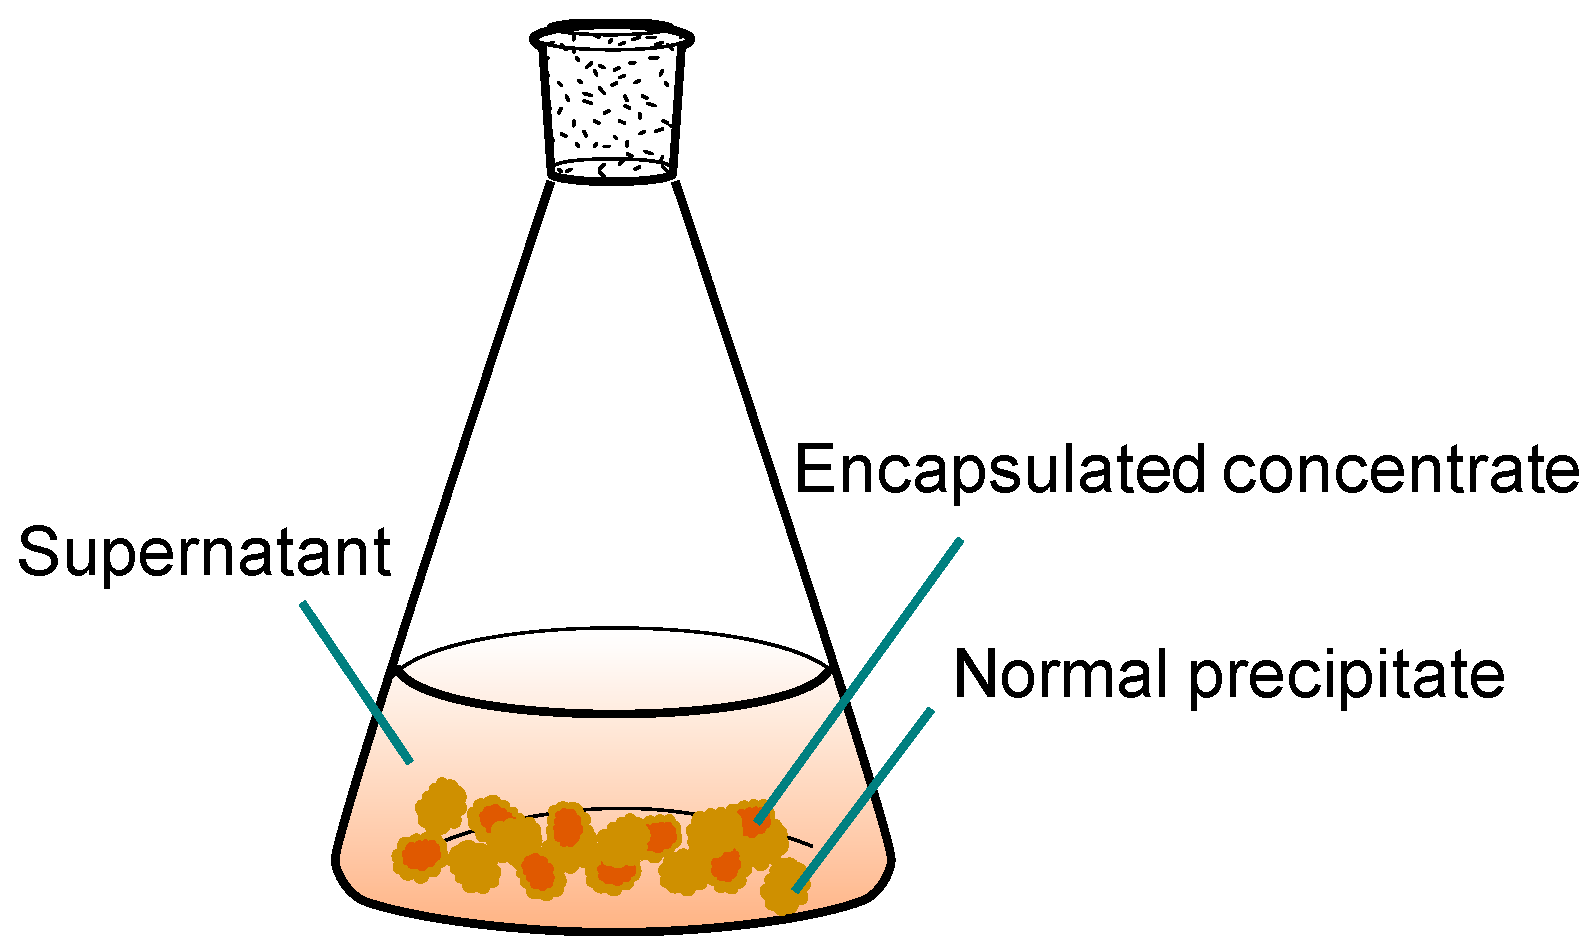
where m0, m1, m2, and m3 represent the concentrate mass, ethanol mass, the total mass of the supernatant, and the total mass of precipitate, respectively. It was assumed that the precipitate consisted of normal precipitate and encapsulated concentrate in the precipitate. Normal precipitate produces dried precipitate and precipitate-adsorbed supernatant. A schematic diagram of the coating phenomenon is shown in Figure 1.

Figure 1.
Schematic diagram of the coating phenomenon.
According to mass conservation of the precipitate in Figure 2, there is:
where m4 and m5 represent the mass of dried precipitate and the mass of the precipitate-absorbed supernatant, respectively. WMR is the evaluation index, and it represents the mass percentage of concentrate fully mixed with ethanol solution.

Figure 2.
Illustration of mass distribution before and after ethanol precipitation.
According to mass conservation of total solid content in the ethanol precipitation system, there is:
where S0 and S2 represent the total solid contents of the concentrate and supernatant, respectively. According to mass conservation for the mixing condition indicator, component A, there is:
where C0 and C2 represent the content of component A in the concentrate and the content of component A in the supernatant, respectively. From Formulas (1)–(4), there is:
The retention rate of component A was defined as . Based on its physical meaning, is calculated as:
Formula (6) was substituted into Formula (5), and the method for calculating the WMR with the retention rate was obtained. This method is shown in Formula (7).
If the WMR is 0%, the concentrate is completely encapsulated. At this time, S2 is zero, and it can be shown that m1 is zero. The physical meaning is that when ethanol is not consumed, it can be regarded as an indicator of complete coating. The concentrate can be regarded as a completely encapsulated precipitate, and components can be partially dissolved when ethanol solution is added. If the WMR is 100%, the concentrate and ethanol solution are completely mixed. In that case, Formula (8) can be obtained:
where m1 represents the mass of ethanol consumption, m0 × (1−S0) represents the water contained in the concentrate, and m1S2 represents total solid contained in the supernatant. If a dried precipitate with no supernatant adsorbed on the surface could be obtained, then the above three items would add up to the theoretical mass of the supernatant. Because m2 is the mass of the supernatant actually measured, when the concentrate and ethanol solution are completely mixed without coating, the retention rate depends on the amount of precipitate-absorbed supernatant.
3. Materials and Methods
3.1. Chemicals and Reagents
The electronic balance used was a model XS105 (Mettler-Toledo, Greifensee, Switzerland). Syringe needles were purchased from Hangzhou Chengdian Experimental Equipment Co., Ltd. (Hangzhou, Zhejiang, China). Reference substance lobetyolin (batch number: 180307, purity > 98%) used for HPLC analysis was purchased from Shanghai Ronghe Pharmaceutical Technology Co., Ltd. (Shanghai, China). Absolute ethanol and 95% ethanol were purchased from Zhejiang Evergreen Chemical Co., Ltd. (Hangzhou, Zhejiang, China). HPLC-grade acetonitrile was purchased from Merck (Darmstadt, Germany). HPD-100 resin was purchased from Cangzhou Baoen Adsorption Material Technology Co., Ltd. (Cangzhou, Hebei, China). Ultrahigh-purity water was produced using a water purification system (Milli-Q, Millipore, Burlington, MA, USA). Codonopsis Radix (batch number: 191022) was purchased from Anhui Bozhou Yuanfengtang Agricultural and Sideline Products Distribution Co., Ltd. (Bozhou, Anhui, China). Codonopsis Radix was identified as the dried root of Codonopsis pilosula (Franch.) Nannf. by Dr. Gong Xingchu and deposited at the Smart Pharmaceutical Laboratory, Pharmaceutical Informatics Institute, College of Pharmaceutical Sciences, Zhejiang University, Hangzhou, China.
3.2. Preparation of Codonopsis Radix Water Extract Concentrate
Codonopsis Radix was refluxed with water at a ratio of 1:8 (m/v) for 0.5 h. The water extracts were collected by filtration with an oil-free vacuum filter pump (DP-01, Shanghai Leigu Instrument Co., Ltd., Shanghai, China). Codonopsis Radix was refluxed with water at a ratio of 1:6 (m/v) for 0.5 h again to obtain another water extract. After filtration, the two filtrates were mixed. The mixtures were concentrated with a rotary evaporator (V-100, BUCHI Labortechnik AG, Flawil, Switzerland). The relative density of the concentrate was measured by weighing 5 mL of concentrate. All experiments were repeated three times. The concentration process was completed when the relative density approximately of the concentrate was 1.2 g/mL (The total solid content was about 60%). The samples with different solid content concentrate were obtained by diluting with water in the study.
3.3. Analytical Methods
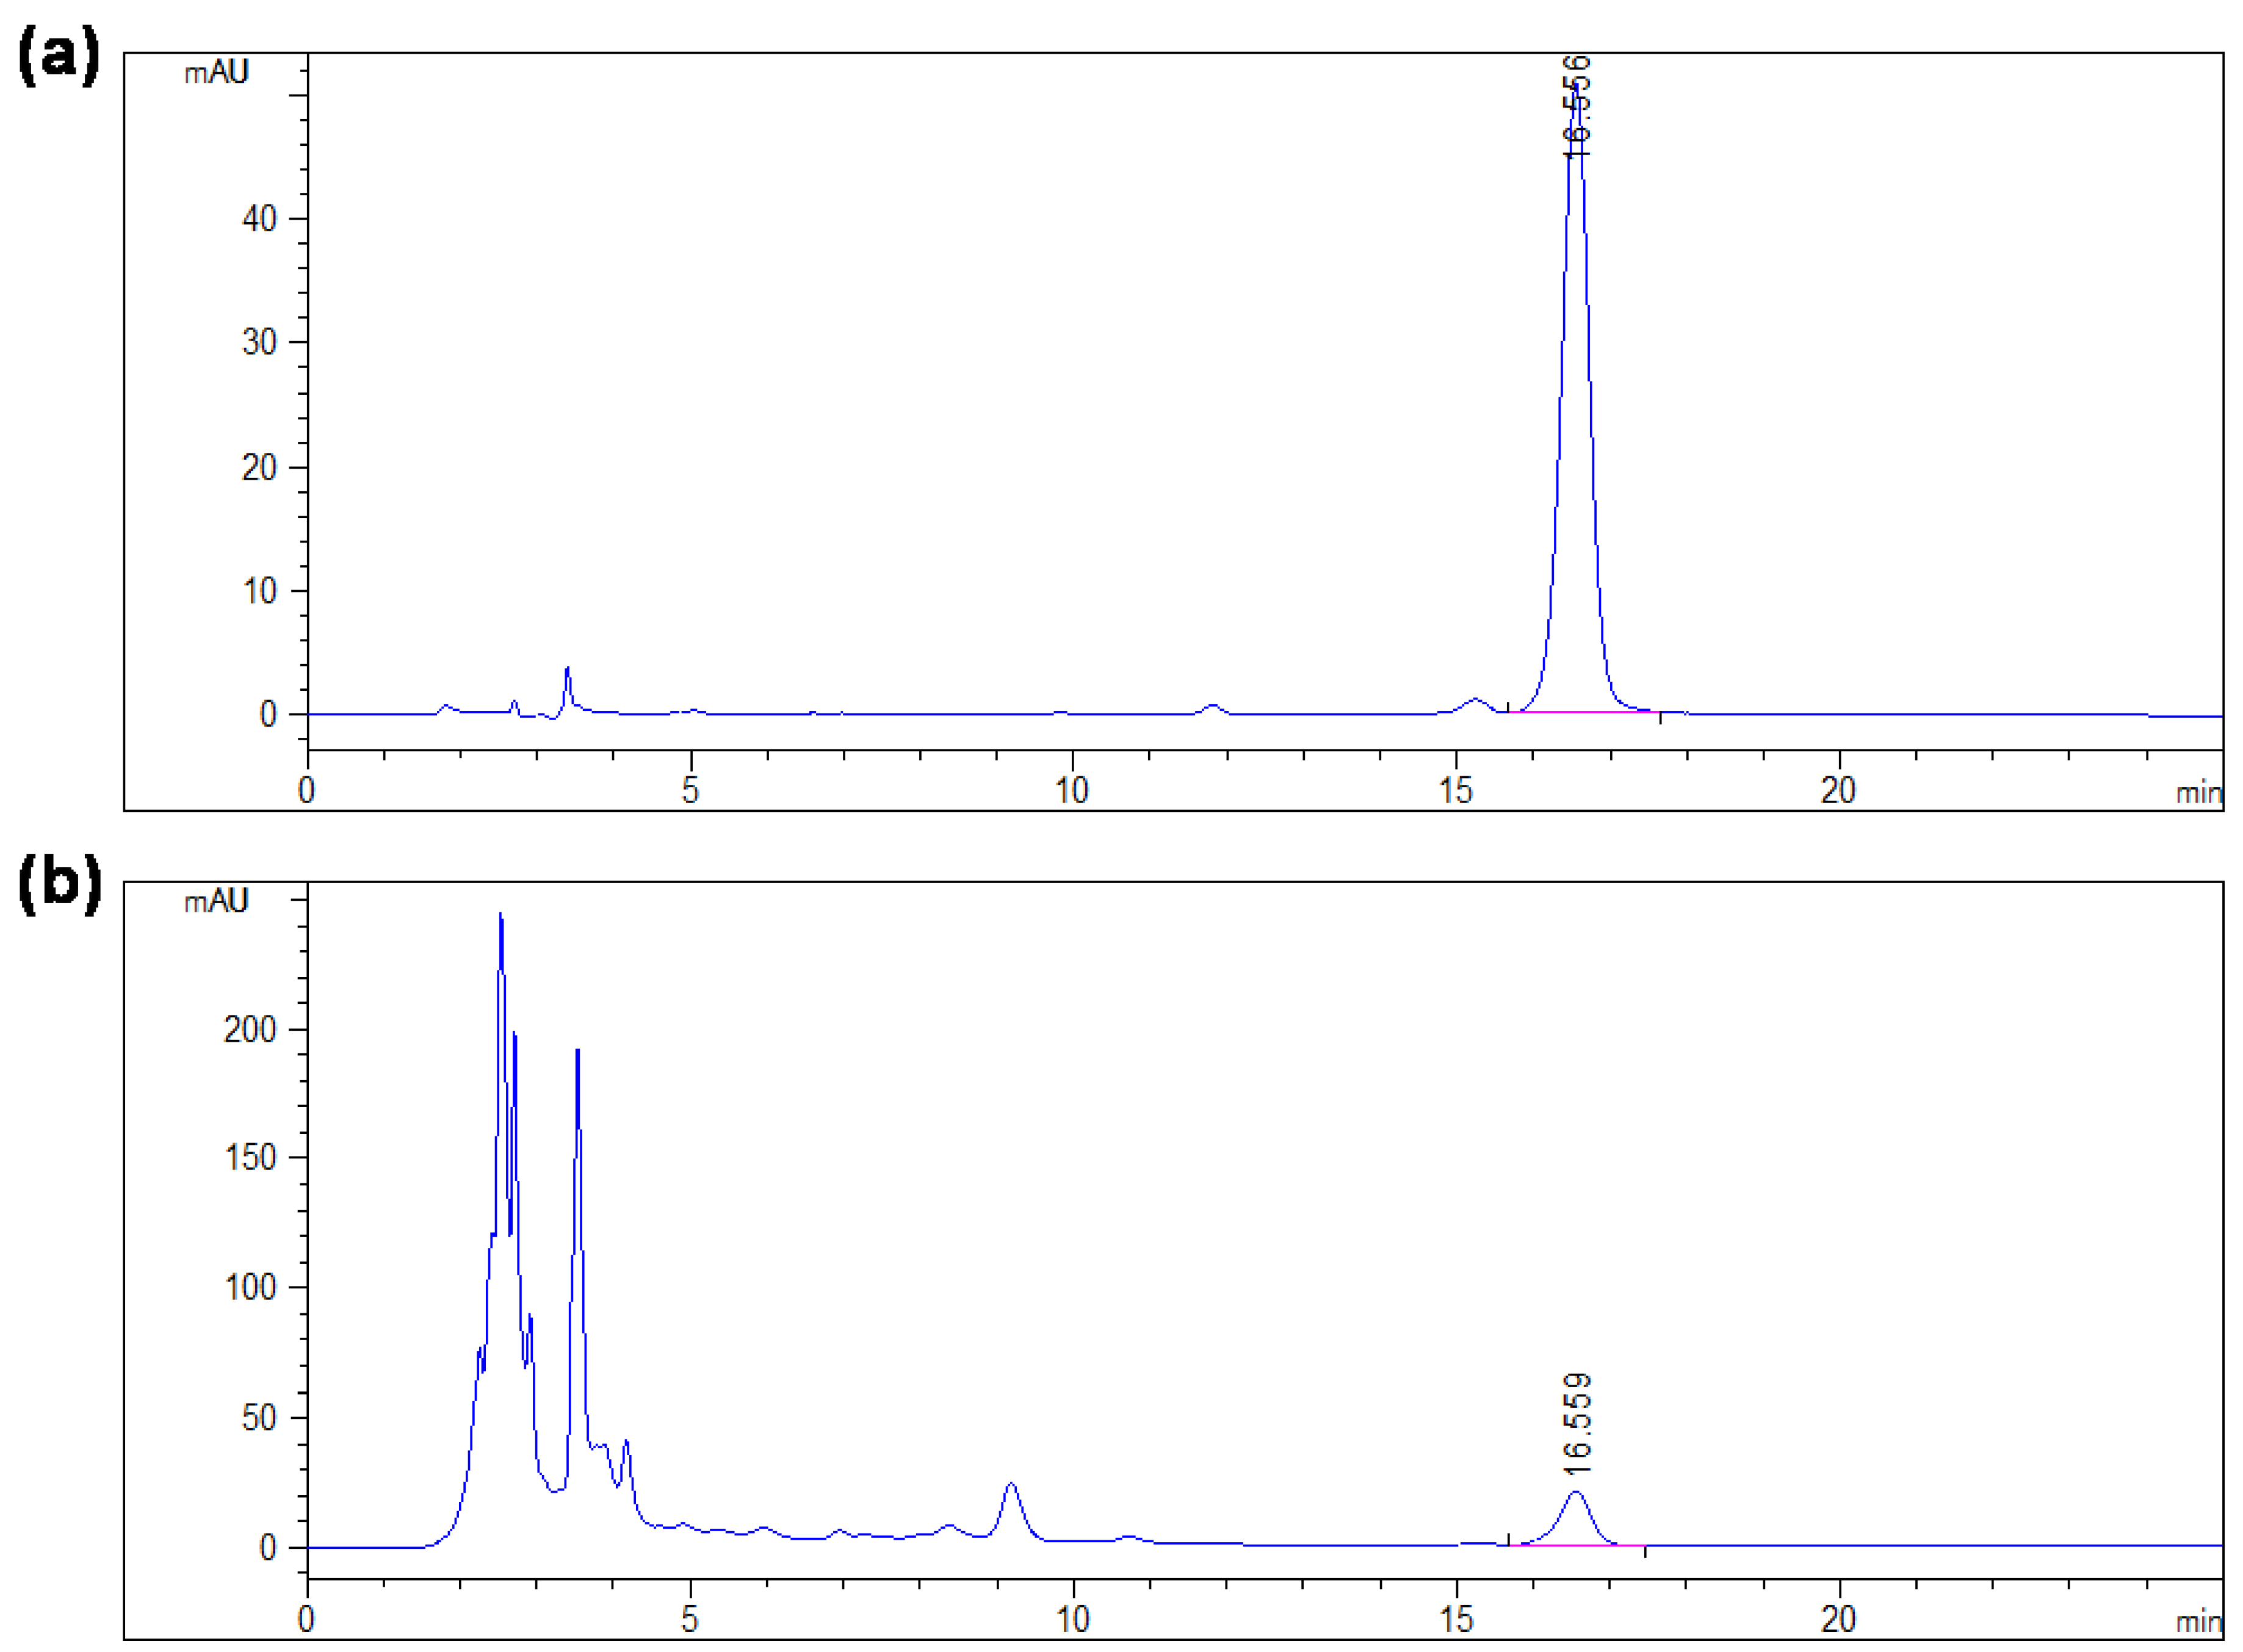
The established HPLC method was used to determine lobetyolin content [33]. An HPLC system (1100, Agilent Technologies, Santa Clara, CA, USA) equipped with a variable wavelength detector (G1314C), a quaternary pump (G1311A), a column thermostat (G1316A), an automatic liquid sampler (G1313A), and a degasser (G1322A) was used for all measurements. Chromatographic separation was carried out at 30 °C on a Zorbax SB-C18 column (250 mm × 4.6 mm, 5 μm particle size). The flow rate of the mobile phases containing acetonitrile (B) and water (A) is 1.0 mL/min. The isocratic elution was set performed using 80% A, and the total runtime is 25 min. The sample volume injected was 10 μL, and the detection wavelength was 269 nm. After each run, the chromatographic system was set to 100% B and balanced for 10 min with a 1.0 mL/min flow rate. Representative HPLC chromatograms of the supernatant sample and the reference standard sample are presented in Appendix A, Figure A1. The supernatant (2.0 g) was diluted with 50% methanol-water in a 5 mL volumetric flask. The concentrate (0.5 g) were diluted with 30% methanol-water in a 5 mL volumetric flask.
The total solid content was determined using a gravimetric method. The supernatant or the concentrate was placed into a weighing bottle dried to a constant mass. Samples were dried at 105 °C for 3.0 h using a drying oven (DHG-9146A, Shanghai Jinghong Experimental Equipment Co., Ltd., Shanghai, China) and then incubated in a desiccator for 0.5 h. Their masses were determined, and the total solid content in the samples were calculated.
3.4. Determination of the Mixing Condition Indicator
Previous studies have demonstrated that the retention rate of lobetyolin in the supernatant was higher than 90% when using the optimized ethanol precipitation process [22,34], which indicated that little lobetyolin was lost during the ethanol precipitation process. Therefore, lobetyolin might be regarded as a potential indicator of the mixing situation. However, it was still necessary to confirm that the content of lobetyolin showed little difference before and after ethanol precipitation, i.e., its solubility in the supernatant was large enough to avoid precipitation loss.
A total of 15.0 g of Codonopsis Radix concentrate containing 45% total solid content was placed into a conical bottle, and 37.5 g of 95% (v/v) ethanol solution was added. The mixtures were stirred for 30 min with a magnetic stirrer (JJ-IA, Changzhou Yunhua Electrical Appliance Co., Ltd., Changzhou, Zhejiang, China) and filtered under vacuum. Then the supernatant and a precipitate were obtained. The precipitate was dried to a constant mass at 105 °C for 3.0 h using a drying oven, and the mass of supernatant adsorbed by the precipitate was calculated. The total lobetyolin content in the supernatant and precipitate was analysed referencing the analytical method of Section 3.3, then compared with that in the concentrate. There is no obvious degradation loss in the ethanol precipitation process if the latter is not different from the former.
Direct detection of the solubility of lobetyolin in different concentrations of ethanol requires more reference substances, and the experiments will be expensive. Therefore, this study utilized the desorption method to indirectly determine solubility trends with different ethanol concentrations [35].
The desorption method was as follows: 91.0 g of concentrate was diluted with 454.0 g ultrahigh-purity water and then mixed well by a magnetic stirrer. 70 mL of HPD-100 resin was immersed with 90% (v/v) ethanol solution in a beaker for 12 h. The resin was washed 5 times with water. The diluted Codonopsis Radix concentrate was adsorbed with 70 mL HPD-100 resin. The mixture of concentrate and resin was stirred for 3 h and filtered. After that, the resin was collected by filtration. Then each 10 g of wet resin was contact with 20 mL of desorption solution composed of different ethanol concentrations (0%, 30%, 50%, 70%, and 90%, v/v) for 3 h under stirring. After that, the desorption solutions were collected by filtration. The lobetyolin concentrations of desorption solution were determined. If the lobetyolin amount increased with increasing ethanol concentration, it indirectly illustrated that the solubility of lobetyolin increased with increasing ethanol concentration.
3.5. Single-Factor Experiments with Stirring Devices
Single-factor experiments were performed with the stirring devices to evaluate the utility of the evaluation index. The stirring devices are shown in Figure 3. Two addition modes were used in ethanol precipitation experiments: ethanol solution was added dropwise to the concentrate, and concentrate was added dropwise to the ethanol solution. Different silicone tubes and syringe needles were used to control the droplet sizes of the concentrate and ethanol solution. Their inner diameter (ID), outer diameter (OD), and droplet diameters are listed in Table 1. Droplet shapes were captured by a smartphone camera (iPhone 8, Apple Inc., Cupertino, CA, USA). Droplet diameters were calculated based on the known OD of the syringe needle and silicone hose. Total solid content of the concentrate was 50%, and 95% ethanol solution or the concentrate was pumped into the Erlenmeyer flask with a peristaltic pump (BT300-2J, Changzhou Runhua Electric Co., Ltd., Changzhou, Zhejiang, China). The mass ratio of ethanol solution to concentrate (ECR) was 1.5 (g/g). A magnetic stirrer completed the mixing of ethanol solution and concentrate with a stirring speed of 400 rpm. The total time of ethanol solution addition and stirring after the addition was 30 min. After ethanol precipitation, the mixture was filtered under vacuum, and the supernatant was collected.

Figure 3.
Schematic diagram for adding ethanol solution dropwise into the concentrate under stirring. When adding concentrate dropwise into ethanol solution, the position of ethanol solution and concentrate was exchanged.

Table 1.
Conditions for single-factor experiments on stirring devices.
3.6. Single-Factor Experiments with the Micromesh Mixer
A schematic diagram of the micromesh mixer device is shown in Figure 4. It mainly consists of two polytetrafluoroethylene (PTFE) plates (40 × 40 × 12 mm3), one PTFE micromesh (20 × 10 × 1.5 mm3), and a silicone gasket. The silicone gasket was placed between two PTFE plates. A micromesh with a 0.6 mm diameter was placed in the middle of the micromixer. The mixing chamber was 16 mm in length, 8 mm in width, and 2.5 mm in depth. Ethanol solution was the continuous phase, and the concentrate was the dispersed phase. The continuous phase was pumped into the micromesh mixer by an advection pump (2PB-20005II, Beijing Xingda Technology Development Co., Ltd., Beijing, China). The dispersed phase was pumped into the micromesh mixer by a gear pump (CT3001F, Baoding Reef Fluid Technology Co., Ltd., Baoding, Hebei, China). The ECR was controlled at 1.5 (g/g), and mixtures were collected in an Erlenmeyer flask. 30.0 g of Codonopsis Radix concentrate with a total solid content of 54% was mixed with 45.0 g of 95% (v/v) ethanol solution at flow rates of 40 mL/min, 60 mL/min, and 80 mL/min. Three tests were performed at each flow rate. After the mixtures were collected, they were immediately stirred for 5 min with a stirring speed of 300 rpm to prevent the precipitation from heaping.

Figure 4.
Schematic diagram of the micromesh mixer device.
4. Results
4.1. Results of Determination for Mixing Condition Indicator
The total content of lobetyolin in the supernatant and precipitate after ethanol precipitation was analyzed and then compared with that in the concentrate before ethanol precipitation. It was found that the former was 99.4% of the latter, indicating that the total content of lobetyolin remained unchanged in the process of ethanol precipitation. Therefore, degradation loss could be ignored.
Figure 5 shows lobetyolin concentration data with different ethanol concentrations. The lobetyolin concentration increased with ethanol concentration, which indicated that a higher ethanol concentration caused dissolution of more lobetyolin. The results further demonstrated that the higher the ethanol concentration was, the higher the lobetyolin solubility [36]. Theoretically, precipitation loss of lobetyolin probably did not occur due to an increase of lobetyolin solubility after adding ethanol solution. If a large amount of lobetyolin loss was observed after ethanol precipitation, the loss should have been due to coating loss. Therefore, lobetyolin was regarded as a mixing condition indicator for the Codonopsis Radix ethanol precipitation system in follow-up studies.

Figure 5.
Lobetyolin concentration with varying ethanol concentration.
4.2. Results of Ethanol Precipitation with Stirring Devices
It can be seen from Figure 6 (the raw data can be seen from Supplementary Materials Table S1) that when the ethanol solution was added dropwise to the concentrated solution, the retention rate of lobetyolin in the supernatant was higher than 72.3%, and the calculated WMR value was higher than 87.0%. It suggests that dropwise addition of ethanol solution to the concentrate had a better mixing effect than dropwise addition of concentrate to ethanol solution. This result is consistent with the actual production steps. The explanation for the above result was that when drops of ethanol solution were added to the concentrate, the ethanol content in the system gradually increased, precipitation gradually occurred, and this was conducive to full mixing. On the other hand, when concentrate was added dropwise into the ethanol solution, the initial ethanol content of the system was extremely high. The amount of precipitation generated per unit mass of concentrate was higher at the beginning than at the end of ethanol addition. This situation was more prone to the coating phenomenon. With increasing droplet diameters, the retention rate of lobetyolin and the WMR decreased. Overall, these results showed that reducing the droplet diameter was beneficial for reducing the mixing scale and improving the mixing effect.

Figure 6.
Results of lobetyolin retention rates and WMR values on different addition modes. The numbers below the droplet are the outer diameter sizes of the syringe needle or the silicone tube.
The influences of stirring speed and total solid content of the concentrate on ethanol precipitation process were investigated in the authors’ previous research [22]. The ethanol precipitation was carried out by adding ethanol solution dropwise into the concentrate with a syringe needle (ID: 3.1 mm, OD: 6.2 mm). In this section, obtained data previously was remodeled. Data were substituted into Formula (7), and the WMR was obtained with different stirring speeds and concentrate total solid content, as shown in Figure 7 (the raw data can be seen from Supplementary Materials Table S2). The higher the stirring speed was, the higher the WMR and the more sufficient the concentrate mixing with ethanol solution. With decreasing total solid content, the mixing effect was enhanced. When the total solid content of concentrate was 45%, and the stirring speed reached 300 rpm, the WMR value was close to 1.0, which meant that the concentrate was fully mixed with ethanol. At this point, the WMR value was almost unchanged when the stirring speed was increased. These results demonstrated that the WMR well reflected the mixing of concentrate and ethanol solution.

Figure 7.
WMR values at different stirring speeds (200, 300, 400 and 500 rpm) and different total solid content of the concentrate (45%, 55%, and 60%) on stirring devices. The results are expressed as mean ± standard deviations, n = 3.
4.3. Results of Ethanol Precipitation with a Micromesh Micromixer
From the experiment results of droplet diameter on the mixing effect, it was known that the mixing effect was improved by decreasing the diameters of ethanol solution droplets, thus reducing coating loss. Therefore, a micromesh was put into the micromixer to carry out ethanol precipitation experiments. WMR values and lobetyolin retention rates under different concentrate flow rate on the micromesh mixer are shown in Figure 8 (the raw data can be seen from Supplementary Materials Table S3). WMR values showed an upward trend with increasing concentrate flow rate, consistent with the result obtained with the stirring devices. The WMR values with the micromesh mixer were approximately 100%, and this indicated that increasing the flow rate improved the mixing effect on contact and reduced the loss of active components simultaneously. Surprisingly, lobetyolin retention rates were approximately 15% lower than the WMR values, indicating that the precipitate possibly adsorbed approximately 15% of the supernatant.

Figure 8.
WMR values and lobetyolin retention rates under different concentrate flow rate on the micromesh mixer. The results are expressed as mean ± standard deviations, n = 3.
4.4. The Analysis of WMR Value Calculated with the Previous Dataset
In this study, the previous dataset [22] for the membrane dispersion micromixer was substituted into Formula (7), and the calculated WMR values are shown in Figure 9 (raw data can be seen from Supplementary Materials Tables S4–S7). WMR was improved by reducing the membrane pore size, mixing chamber width and depth, and increasing the concentrate flow rate. With a fixed concentrate flow rate, as Figure 9b shows, no significant differences in WMR were found by increasing ECR. Figure 9c shows a comparison of WMR values for the membrane dispersion micromixer and for stirring devices. With increasing total solid content in the concentrate, the WMR value for the membrane dispersion micromixer was significantly higher than for stirring devices.

Figure 9.
WMR values under different membrane pore size, mixing chamber width, mixing chamber depth (a), concentrate flow rate, ECR (b), and total solid content of the concentrate (c) on a membrane dispersion micromixer. The results are expressed as mean ± standard deviations, n = 3.
5. Discussions
5.1. Relationship between WMR Values and Total Solid Removal Rates
The total solid removal rate is also one of the evaluation indexes used with the ethanol precipitation process, and it partially characterizes the ability to remove impurities. The calculation is as shown in Formula (9) [37]:
where m and DM are the mass and total solid content, respectively. Subscripts S and C represent the supernatant and concentrate, respectively. To better understand the relationship between the WMR value and the total solid removal rate, the linear formula was used to fit the linear relationship between them. The dataset to be fitted was from the current studies and previous dataset. According to the fitting results shown in Table 2 and Figure 10, negative values mean that the higher the WMR was, the lower the total solid removal rate. The fitting results revealed that the total solid were dissolved in the supernatant to the extent possible after the concentrate and ethanol were fully mixed. The fitting results show that the higher the degree of fully mixing the concentrate and ethanol solution, the higher the total solid content in the supernatant, further indicating that more components are dissolved in the supernatant. The R2 values of the two linear fittings shown were less than 0.75, which indicated that in addition to ECR, other important factors, such as concentrate properties, affected the WMR and total solid removal rate.
Table 2.
Linear fitting results for total solid removal rate and WMR.

Figure 10.
Relationship between the WMR value and total solid removal rate: □ represents the data from this work; ● and ■ represent the data from Pan, J.; Shao, J.; Qu, H.; Gong, X, ethanol precipitation of Codonopsis Radix concentrate with a membrane dispersion micromixer; published by J. Clean. Prod, 2020.
5.2. Deficiency of the Index
The index WMR was used to quantitatively evaluate the mixing situation of ethanol solution and concentrate, and the proportion of active components lost due to coating. According to the assumptions described in Section 2.2, the WMR should be positively correlated with the retention rate and slightly exceed the retention rate. Experimental data for an ECR of 1.5 were extracted. The linear formula was used to describe the linear relationship between lobetyolin retention rate and WMR. According to the results shown in Table 3 and Figure 11, when the WMR was more than 40%, the linear relationship between the retention rate and WMR was good, with R2 = 0.9075. The value of was less than 1.0, which indicated that the WMR value was higher than the lobetyolin retention rate. As the retention rate did not reflect the content of lobetyolin in the supernatant adsorbed by precipitation, the WMR value was greater than the lobetyolin retention rate, which was consistent with the assumptions used for the WMR calculation derived in this study. When the WMR was less than 40%, the linear relationship between the retention rate and WMR was also good, with R2 = 0.9849. However, the value of was greater than 1.0, indicating that the WMR was less than the lobetyolin retention rate. This result was inconsistent with the previous assumption. The reasons may be as follows: according to the hypotheses used to define the new evaluation index, precipitation was divided into normal precipitate and the concentrate encapsulated in the precipitate. The supernatant was not included in the precipitation. When the WMR was low, the coating loss was serious. The precipitate may encapsulate part of the supernatant.
Table 3.
Linear fitting results for lobetyolin retention rate and WMR.

Figure 11.
Relationship between WMR and lobetyolin retention rate: ○ represents the data from this work; ● and ■ represent the data from Pan, J.; Shao, J.; Qu, H.; Gong, X, ethanol precipitation of Codonopsis Radix concentrate with a membrane dispersion micromixer; published by J. Clean. Prod, 2020.
Another limitation of this study is that an indicator of mixing conditions must be found for the ethanol precipitation system. Without a suitable indicator, it would be difficult to calculate the WMR.
6. Conclusions
In this study, a new index was proposed for quantitative evaluation of the mixing of concentrate and ethanol solution in the ethanol precipitation process. The index is WMR, which denotes the mass percentage of concentrate fully mixed with ethanol. The higher the WMR was, the higher the proportion of concentrate and ethanol solution that was fully mixed. The concept and requirements of a mixing condition indicator were put forward, and a formula for the WMR was derived. Lobetyolin was verified as a mixing condition indicator in the ethanol precipitation of Codonopsis Radix concentrate.
It was found that dropwise addition of ethanol solution to the concentrate showed better mixing than the dropwise addition of concentrate to the ethanol solution. Reducing the droplet diameters of concentrate and ethanol improved the mixing effect. When using a micromixer to mix an ethanol solution and a concentrate, reducing the pore size and the size of the mixing chamber improved the WMR. Increasing the two-phase flow rate also led to higher WMR values. Lobetyolin retention rate increased as WMR increased.
The results were consistent with expectations indicating that the WMR could quantitatively characterize the concentrate and ethanol solution mixing. The research also helps to solve the long-standing problem of indistinguishability between coating loss and precipitation loss on ethanol precipitation. It provides a beneficial foundation for improving the quality control of ethanol precipitation process.
Supplementary Materials
The following are available online at https://www.mdpi.com/article/10.3390/separations8100181/s1, Table S1: WMR values, total solid removal rate, lobetyolin retention rates on different addition modes. Table S2: WMR values under different stirring speeds (200, 300, 400, and 500 rpm) and different total solid content of the concentrate (45%, 55%, and 60%) on stirring devices. Table S3: WMR values, total solid removal rate, lobetyolin retention rates under different concentrate flow rates on the micromesh mixer. Table S4: WMR values under different membrane pore sizes on a membrane dispersion micromixer. Table S5: WMR values under different mixing chamber widths on a membrane dispersion micromixer. Table S6: WMR values under different mixing chamber depths on a membrane dispersion micromixer. Table S7: WMR values under different concentrate flow rates, ECR on a membrane dispersion micromixer.
Author Contributions
Conceptualization, X.G.; investigation, J.P. and Y.T.; data curation, J.P. and Y.T.; writing—original draft preparation, Y.T. and J.P.; writing—review and editing, X.G. and Y.T.; supervision, X.G. and H.Q.; funding acquisition, X.G. and H.Q. All authors have read and agreed to the published version of the manuscript.
Funding
This research was funded by the National S&T Major Project of China (2018ZX09201011-002), the Basic Public Welfare Research Program of Zhejiang Province (LGG18H280001), and the National Project for Standardization of Chinese Materia Medica (ZYBZH-C-GD-04).
Data Availability Statement
The data presented in this study are available on Supplementary Materials.
Conflicts of Interest
The authors declare no conflict of interest.
Abbreviations
TCMs: traditional Chinese medicines; HPLC: high performance liquid chromatography; WMR: the mass percentage of concentrate fully mixed with ethanol solution (well-mixing ratio); ECR: the mass ratio of ethanol solution to concentrate; ID: inner diameter; OD: outer diameter.
Appendix A

Figure A1.
Typical HPLC chromatogram of the reference standard and the supernatant sample. (a) HPLC chromatogram of the lobetyolin. (b) HPLC chromatogram of the supernatant.
Figure A1.
Typical HPLC chromatogram of the reference standard and the supernatant sample. (a) HPLC chromatogram of the lobetyolin. (b) HPLC chromatogram of the supernatant.
References
- State Pharmacopoeia Commission. Pharmacopoeia of the People’s Republic of China; China Medical Science Press: Beijing, China, 2020. [Google Scholar]
- Lee, H.; Gupta, R.; Kim, S.; Wang, Y.; Rakwal, R.; Agrawal, G.; Kim, S. Abundant storage protein depletion from tuber proteins using ethanol precipitation method: Suitability to proteomics study. Proteomics 2015, 15, 1765–1769. [Google Scholar] [CrossRef] [PubMed]
- Yan, J.; Wang, C.; Yu, Y.; Wu, L.; Chen, T.; Wang, Z. Physicochemical characteristics and in vitro biological activities of polysaccharides derived from raw garlic (Allium sativum L.) bulbs via three-phase partitioning combined with gradient ethanol precipitation method. Food Chem. 2021, 339, 128081. [Google Scholar] [CrossRef]
- Gong, X.; Li, Y.; Qu, H. Removing tannins from medicinal plant extracts using an alkaline ethanol precipitation process: A case study of Danshen injection. Molecules 2014, 19, 18705–18720. [Google Scholar] [CrossRef] [PubMed] [Green Version]
- Lu, X. Studies on Ethanol Precipitation and Countercurrent Extration Refining Processes of Lonicerae Japonicae Flos and Artemisiae Annuae Herba Water Extract. Master’s Thesis, Zhejiang University, Hangzhou, China, 2014. [Google Scholar]
- Yuan, J. Optimization of Alcohol Precipitation Process for Extract of Carthamus Tinctorius and Salvia Miltiorrhiza and Investigation on the Encapsulated Loss Phenomena. Master’s Thesis, Zhejiang University, Hangzhou, China, 2011. [Google Scholar]
- Zhang, T.; Guo, X.; Meng, H.; Tang, X.; Ai, C.; Chen, H.; Lin, J.; Yu, S. Effects of bovine serum albumin on the ethanol precipitation of sugar beet pulp pectins. Food Hydrocoll. 2020, 105, 105813. [Google Scholar] [CrossRef]
- Guo, X.; Meng, H.; Zhu, S.; Tang, Q.; Pan, R.; Yu, S. Developing precipitation modes for preventing the calcium-oxalate contamination of sugar beet pectins. Food Chem. 2015, 182, 64–71. [Google Scholar] [CrossRef] [PubMed]
- Tai, Y.; Shen, J.; Luo, Y.; Qu, H.; Gong, X. Research progress on the ethanol precipitation process of traditional Chinese medicine. Chin. Med. 2020, 15, 84. [Google Scholar] [CrossRef] [PubMed]
- Gong, X.; Li, Y.; Guo, Z.; Qu, H. Control the effects caused by noise parameter fluctuations to improve pharmaceutical process robustness: A case study of design space development for an ethanol precipitation process. Sep. Purif. Technol. 2014, 132, 126–137. [Google Scholar] [CrossRef]
- Zhao, F.; Li, W.; Pan, J.; Qu, H. Process characterization for ethanol precipitation of Salviae miltiorrhizae Radix et Rhizoma (Danshen) using 1H NMR spectroscopy and chemometrics. Process Biochem. 2021, 101, 218–229. [Google Scholar] [CrossRef]
- Zhou, F.; Li, J.; He, Y.; Mu, R.; Fu, C. Simultaneous determination of eight components in Siwu decoction by HPLC and analysis of transmitting of the components in water extraction and ethanol precipitation process. Chin. J. Pharm. Anal. 2019, 39, 983–991. [Google Scholar]
- Jiang, M.; Zhang, X.; Shao, F.; Shang, Y.; Yang, M.; Liu, R.; Mei, H. Effect of ethanol to material ratio on ethanol precipitation and sediment morphology of Shuanghuanglian preparation. Chin. Tradit. Herb. Drugs 2020, 51, 4954–4959. [Google Scholar]
- Pan, H.; Deng, H.; Chen, Z.; Zhang, Y.; Wang, L. Study on balance of process of alcohol precipitation of ganmaoling granules. Chin. J. Chin. Mater. Med. 2016, 41, 1376–1379. [Google Scholar]
- Shao, F.; Yu, M.; Jiang, M.; Yang, M.; Shang, Y.; Liu, R.; Zhang, X. Establishment of determination of fractal dimension of ethanol-precipitated flocs of two root medicinal herbs. Chin. J. Exp. Tradit. Med. Form. 2019, 25, 103–107. [Google Scholar]
- Zhang, Y.; Liu, L.; Chang, X.; Wu, Y.; Xiao, W.; Hu, J.; Chao, E. Optimization of alcohol precipitation technology of Biqiu granules based on index components and pharmacodynamics. Chin. J. Chin. Mater. Med. 2016, 41, 4598–4604. [Google Scholar]
- Koh, G.; Chou, G.; Liu, Z. Purification of a water extract of Chinese sweet tea plant (Rubus suavissimus S. Lee) by alcohol precipitation. J. Agric. Food Chem. 2009, 57, 5000–5006. [Google Scholar] [CrossRef] [Green Version]
- Gong, X.; Huang, S.; Jiao, R.; Pan, J.; Li, Y.; Qu, H. The determination of dissociation constants for active ingredients from herbal extracts using a liquid–liquid equilibrium method. Fluid Phase Equilibr. 2016, 409, 447–457. [Google Scholar] [CrossRef]
- Xu, R.; Cong, Y.; Zheng, M.; Chen, G.; Chen, J.; Zhao, H. Solubility and modeling of hesperidin in cosolvent mixtures of ethanol, isopropanol, propylene glycol, and n-propanol + water. J. Chem. Eng. Data 2018, 63, 764–770. [Google Scholar] [CrossRef]
- Mo, F.; Ma, J.; Zhang, P.; Zhang, D.; Fan, H.; Yang, X.; Zhi, L.Q.; Zhang, J. Solubility and thermodynamic properties of baicalein in water and ethanol mixtures from 283.15 to 328.15 K. Chem. Eng. Commun. 2019, 208, 183–196. [Google Scholar] [CrossRef]
- Shen, Y.; Farajtabar, A.; Xu, J.; Wang, J.; Xia, Y.; Zhao, H.; Xu, R. Thermodynamic solubility modeling, solvent effect and preferential solvation of curcumin in aqueous co-solvent mixtures of ethanol, n-propanol, isopropanol and propylene glycol. J. Chem. Thermodyn. 2019, 131, 410–419. [Google Scholar] [CrossRef]
- Pan, J.; Shao, J.; Qu, H.; Gong, X. Ethanol precipitation of Codonopsis Radix concentrate with a membrane dispersion micromixer. J. Clean. Prod. 2020, 251, 119633. [Google Scholar] [CrossRef]
- Pan, J.; Tai, Y.; Qu, H.; Gong, X. Optimization of membrane dispersion ethanol precipitation process with a set of temperature control improved equipment. Sci. Rep. 2020, 10, 19010. [Google Scholar] [CrossRef] [PubMed]
- Pan, J.; He, S.; Zheng, J.; Shao, J.; Li, N.; Gong, Y.; Gong, X. The development of an herbal material quality control strategy considering the effects of manufacturing processes. Chin. Med. 2019, 14, 38. [Google Scholar] [CrossRef] [Green Version]
- Zhang, H.; Yan, A.; Gong, X.; Qu, H. Study on quality indicators for concentration process of supernatant obtained in first ethanol precipitation in production of Danshen injection. Chin. J. Chin. Mater. Med. 2011, 36, 1436–1440. [Google Scholar]
- Yan, A.; Gong, X.; Qu, H. Method for discriminating key quality control indicators of concentrated solution before traditional Chinese medicine ethanol precipitation. Chin. J. Chin. Mater. Med. 2012, 37, 1558–1563. [Google Scholar]
- Zou, Y.; Zhang, Y.; Paulsen, B.; Rise, F.; Chen, Z.; Jia, R.; Li, L.X.; Song, X.; Feng, B.; Tang, H.; et al. Structural features of pectic polysaccharides from stems of two species of Radix Codonopsis and their antioxidant activities. Int. J. Biol. Macromol. 2020, 159, 704–713. [Google Scholar] [CrossRef]
- Bailly, C. Anticancer properties of lobetyolin, an essential component of Radix Codonopsis (Dangshen). Nat. Prod. Bioprospect. 2021, 11, 143–153. [Google Scholar] [CrossRef]
- Tai, Y.; Qu, H.; Gong, X. Design space calculation and continuous improvement considering a noise parameter: A case study of ethanol precipitation process optimization for Carthami Flos extract. Separations 2021, 8, 74. [Google Scholar] [CrossRef]
- Li, B.; Kang, Q.; Chen, C.; Wang, Y.; Zhao, Y.; He, B.; Wu, Q. Optimization of alcohol precipitation technology for Fufang Shuanghua oral liquid based on FAHP-entropy method. Cent. South Pharm. 2019, 17, 414–419. [Google Scholar]
- Zhu, Y.; Yu, S.; Zhang, X.; Zhou, C.; Wei, J. Optimization of alcohol-precipitation technology for Fufang Roucongrong Mixture by AHP combined with orthogonal test. China Pharm. 2019, 22, 1257–1260. [Google Scholar]
- Zhang, L.; Gong, X.; Qu, H. Optimizing the alcohol precipitation of Danshen by response surface methodology. Sep. Purif. Technol. 2013, 48, 977–983. [Google Scholar] [CrossRef]
- Xu, Z.; Huang, W.; Gong, X.; Ye, T.; Qu, H.; Song, Y.; Liu, D.; Wang, G. Design space approach to optimize first ethanol precipitation process of Dangshen. Chin. J. Chin. Mater. Med. 2015, 40, 4411–4416. [Google Scholar]
- Peng, Y.; Lei, C.; Tang, Y.; Zhou, L.; Xia, X. Effects of Chitosan Flocculation Clarification Process and Alcohol Precipitation Process on Water Extract of Codonopsis Radix. Chin. J. Inform. Tradit. Chin. Med. 2017, 24, 81–84. [Google Scholar]
- Deineka, V.; Deineka, L.; Sidorov, A.; Kostenko, M.; Blinova, I. Estimating the solubility of anthocyanins using cartridges for solid-phase extraction. Russ. J. Phys. Chem. A 2016, 90, 861–863. [Google Scholar] [CrossRef]
- Zhang, X.; Chen, W.; Zeng, Y.; Mi, S.; Wang, Q.; Li, K.; Zhang, L. The synthesis and identification of Codonopsis Pilosula polyferose. Acta Chin. Med. Pharmacol. 2011, 39, 77–81. [Google Scholar] [CrossRef] [Green Version]
- Gong, X.; Wang, S.; Li, Y.; Qu, H. Separation characteristics of ethanol precipitation for the purification of the water extract of medicinal plants. Sep. Purif. Technol. 2013, 107, 273–280. [Google Scholar] [CrossRef]


Publisher’s Note: MDPI stays neutral with regard to jurisdictional claims in published maps and institutional affiliations. |
© 2021 by the authors. Licensee MDPI, Basel, Switzerland. This article is an open access article distributed under the terms and conditions of the Creative Commons Attribution (CC BY) license (https://creativecommons.org/licenses/by/4.0/).