
1,2-Propylene Glycol: A Biomarker of Exposure Specific to e-Cigarette Consumption

Abstract

1. Introduction
2. Materials and Methods
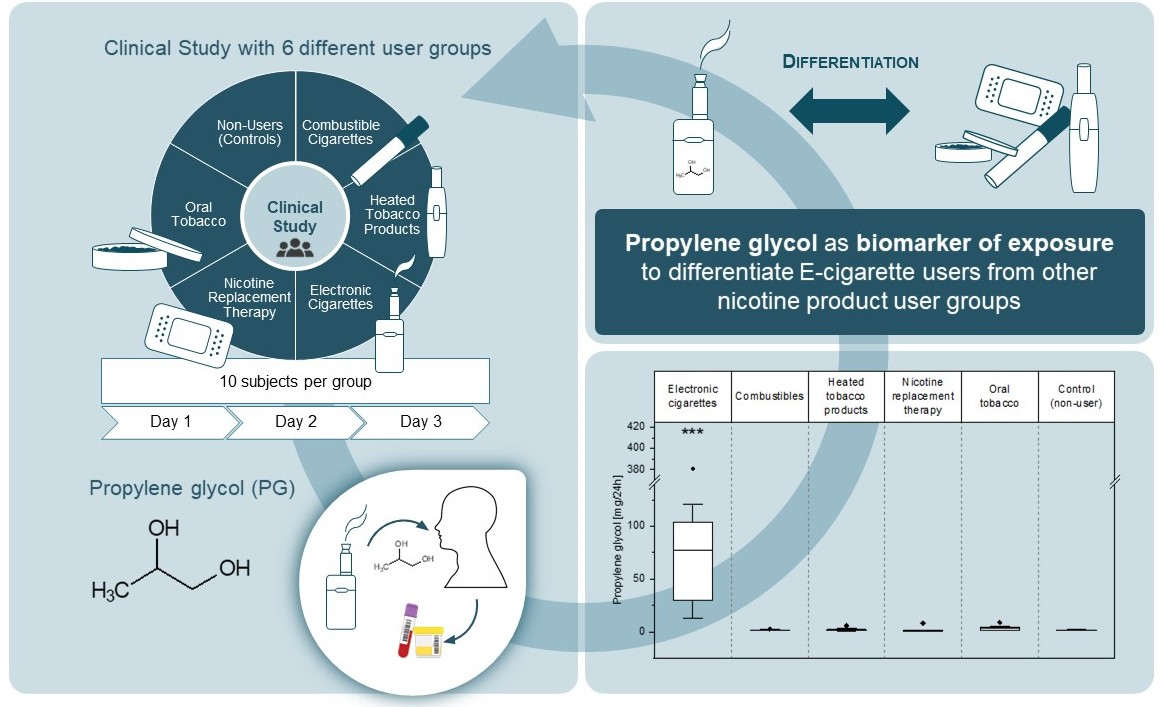
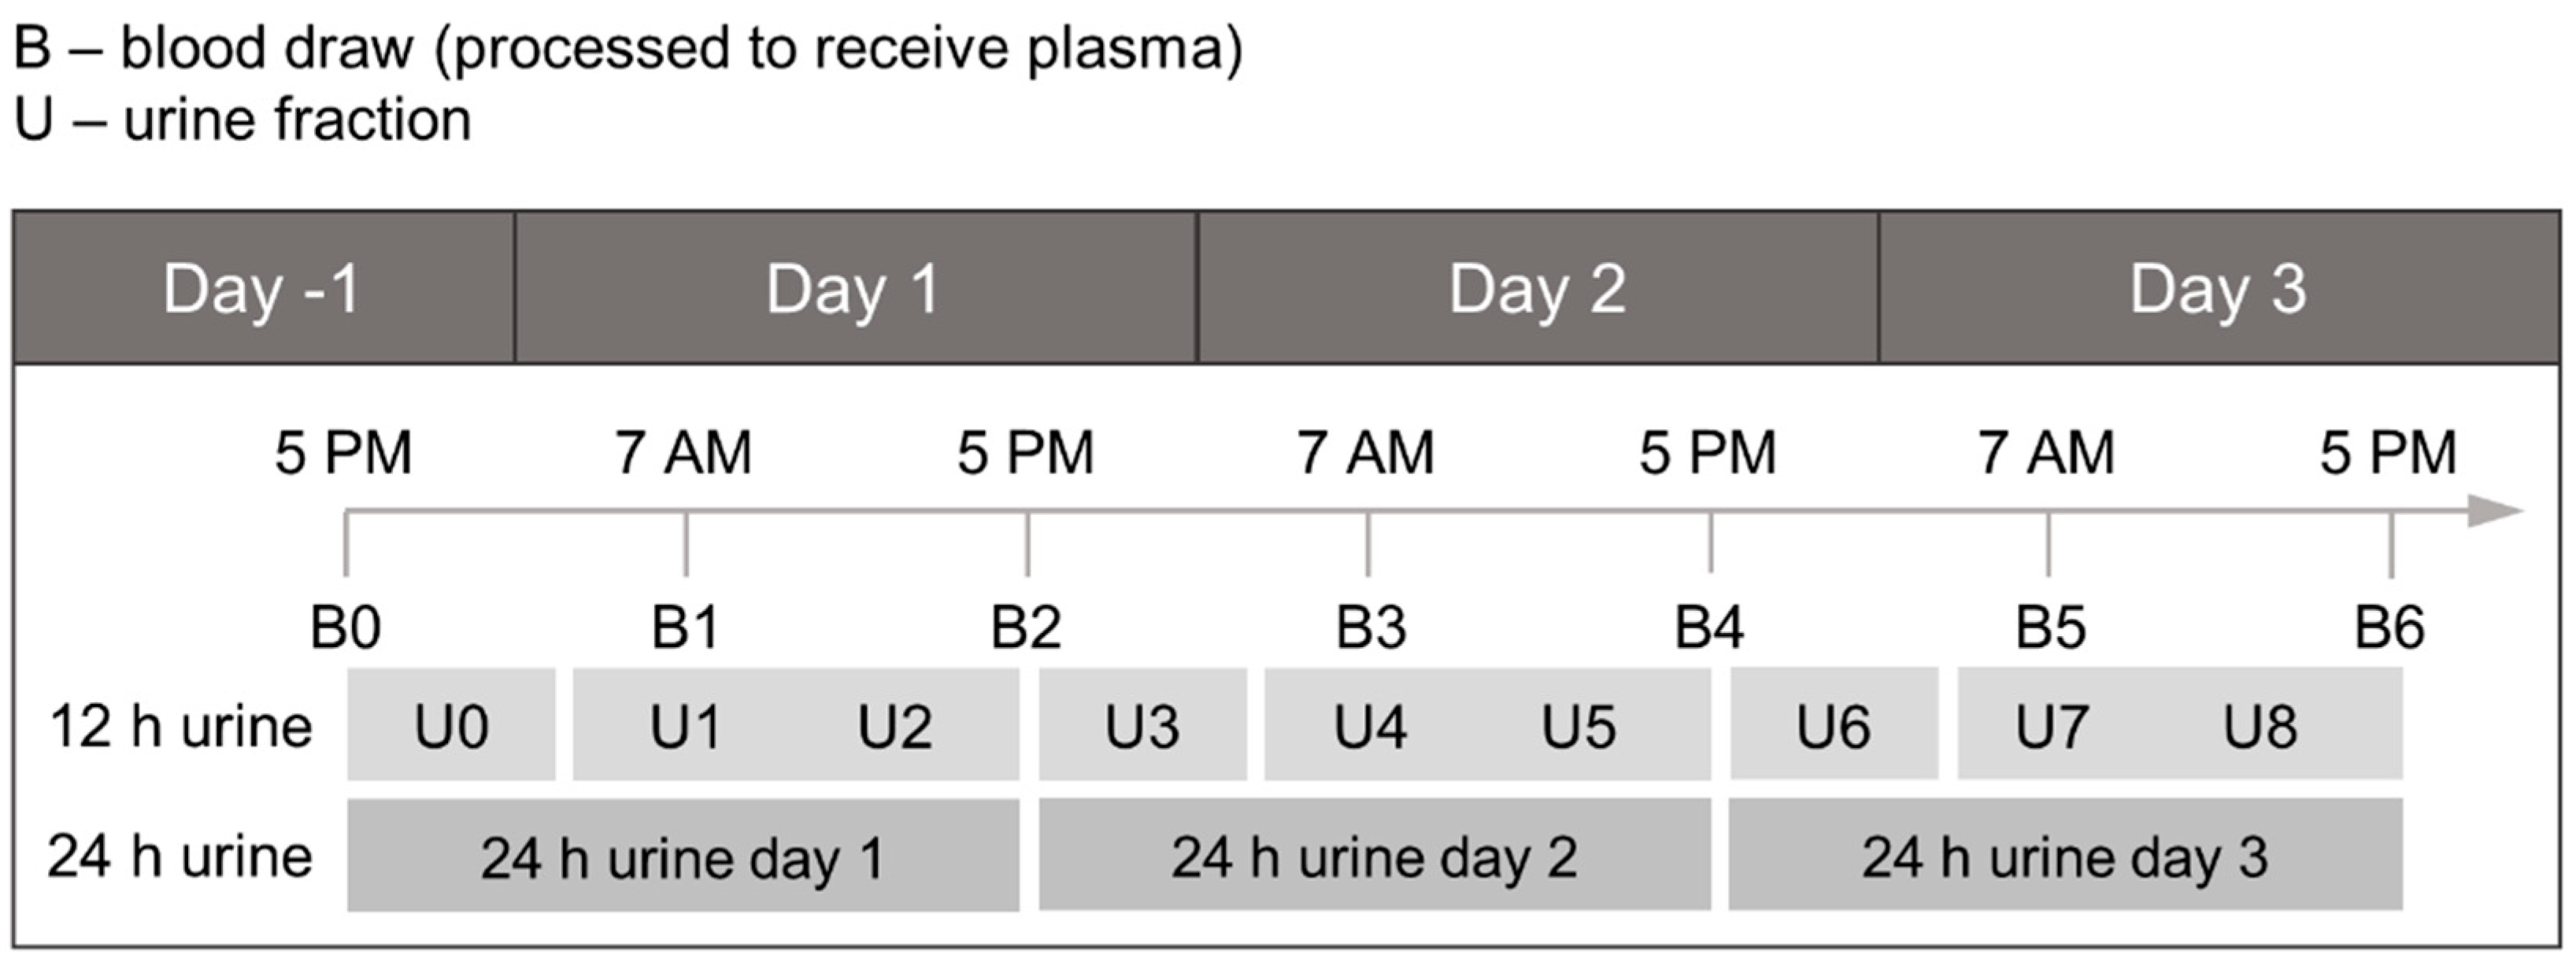
2.1. Study Design
2.2. Reagents and Chemicals
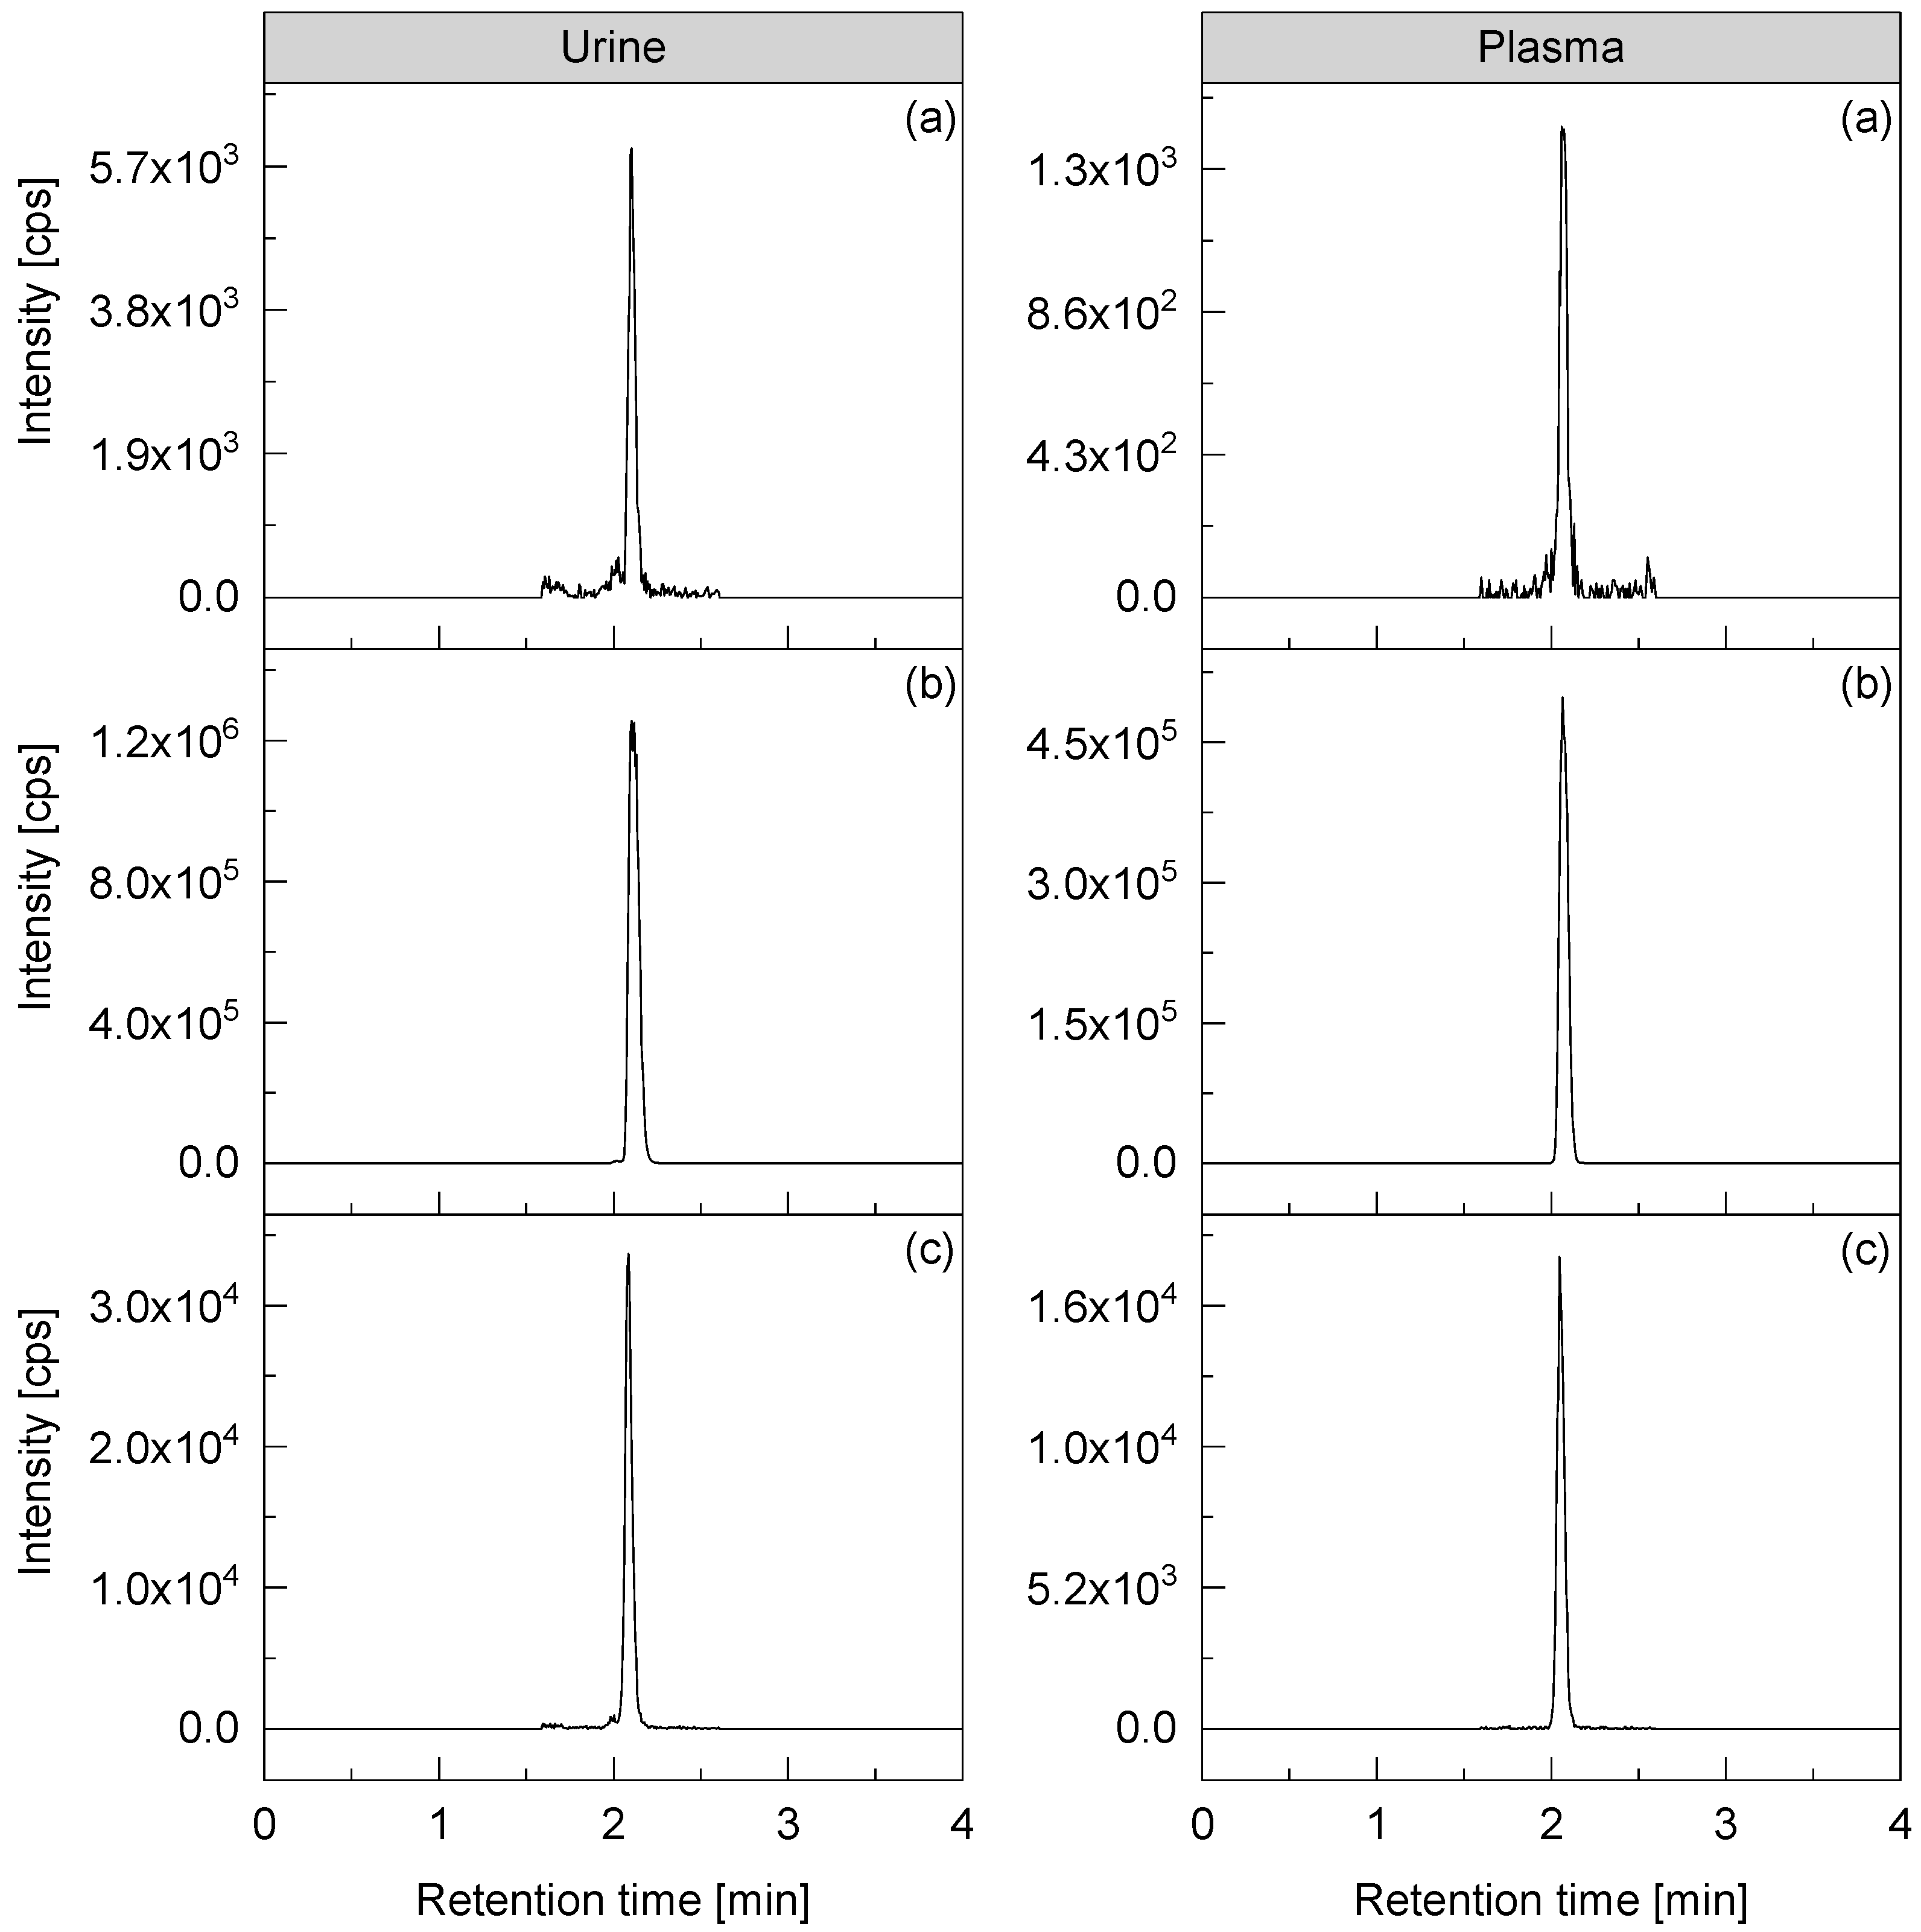
2.3. Analytical Method
2.4. Data Evaluation
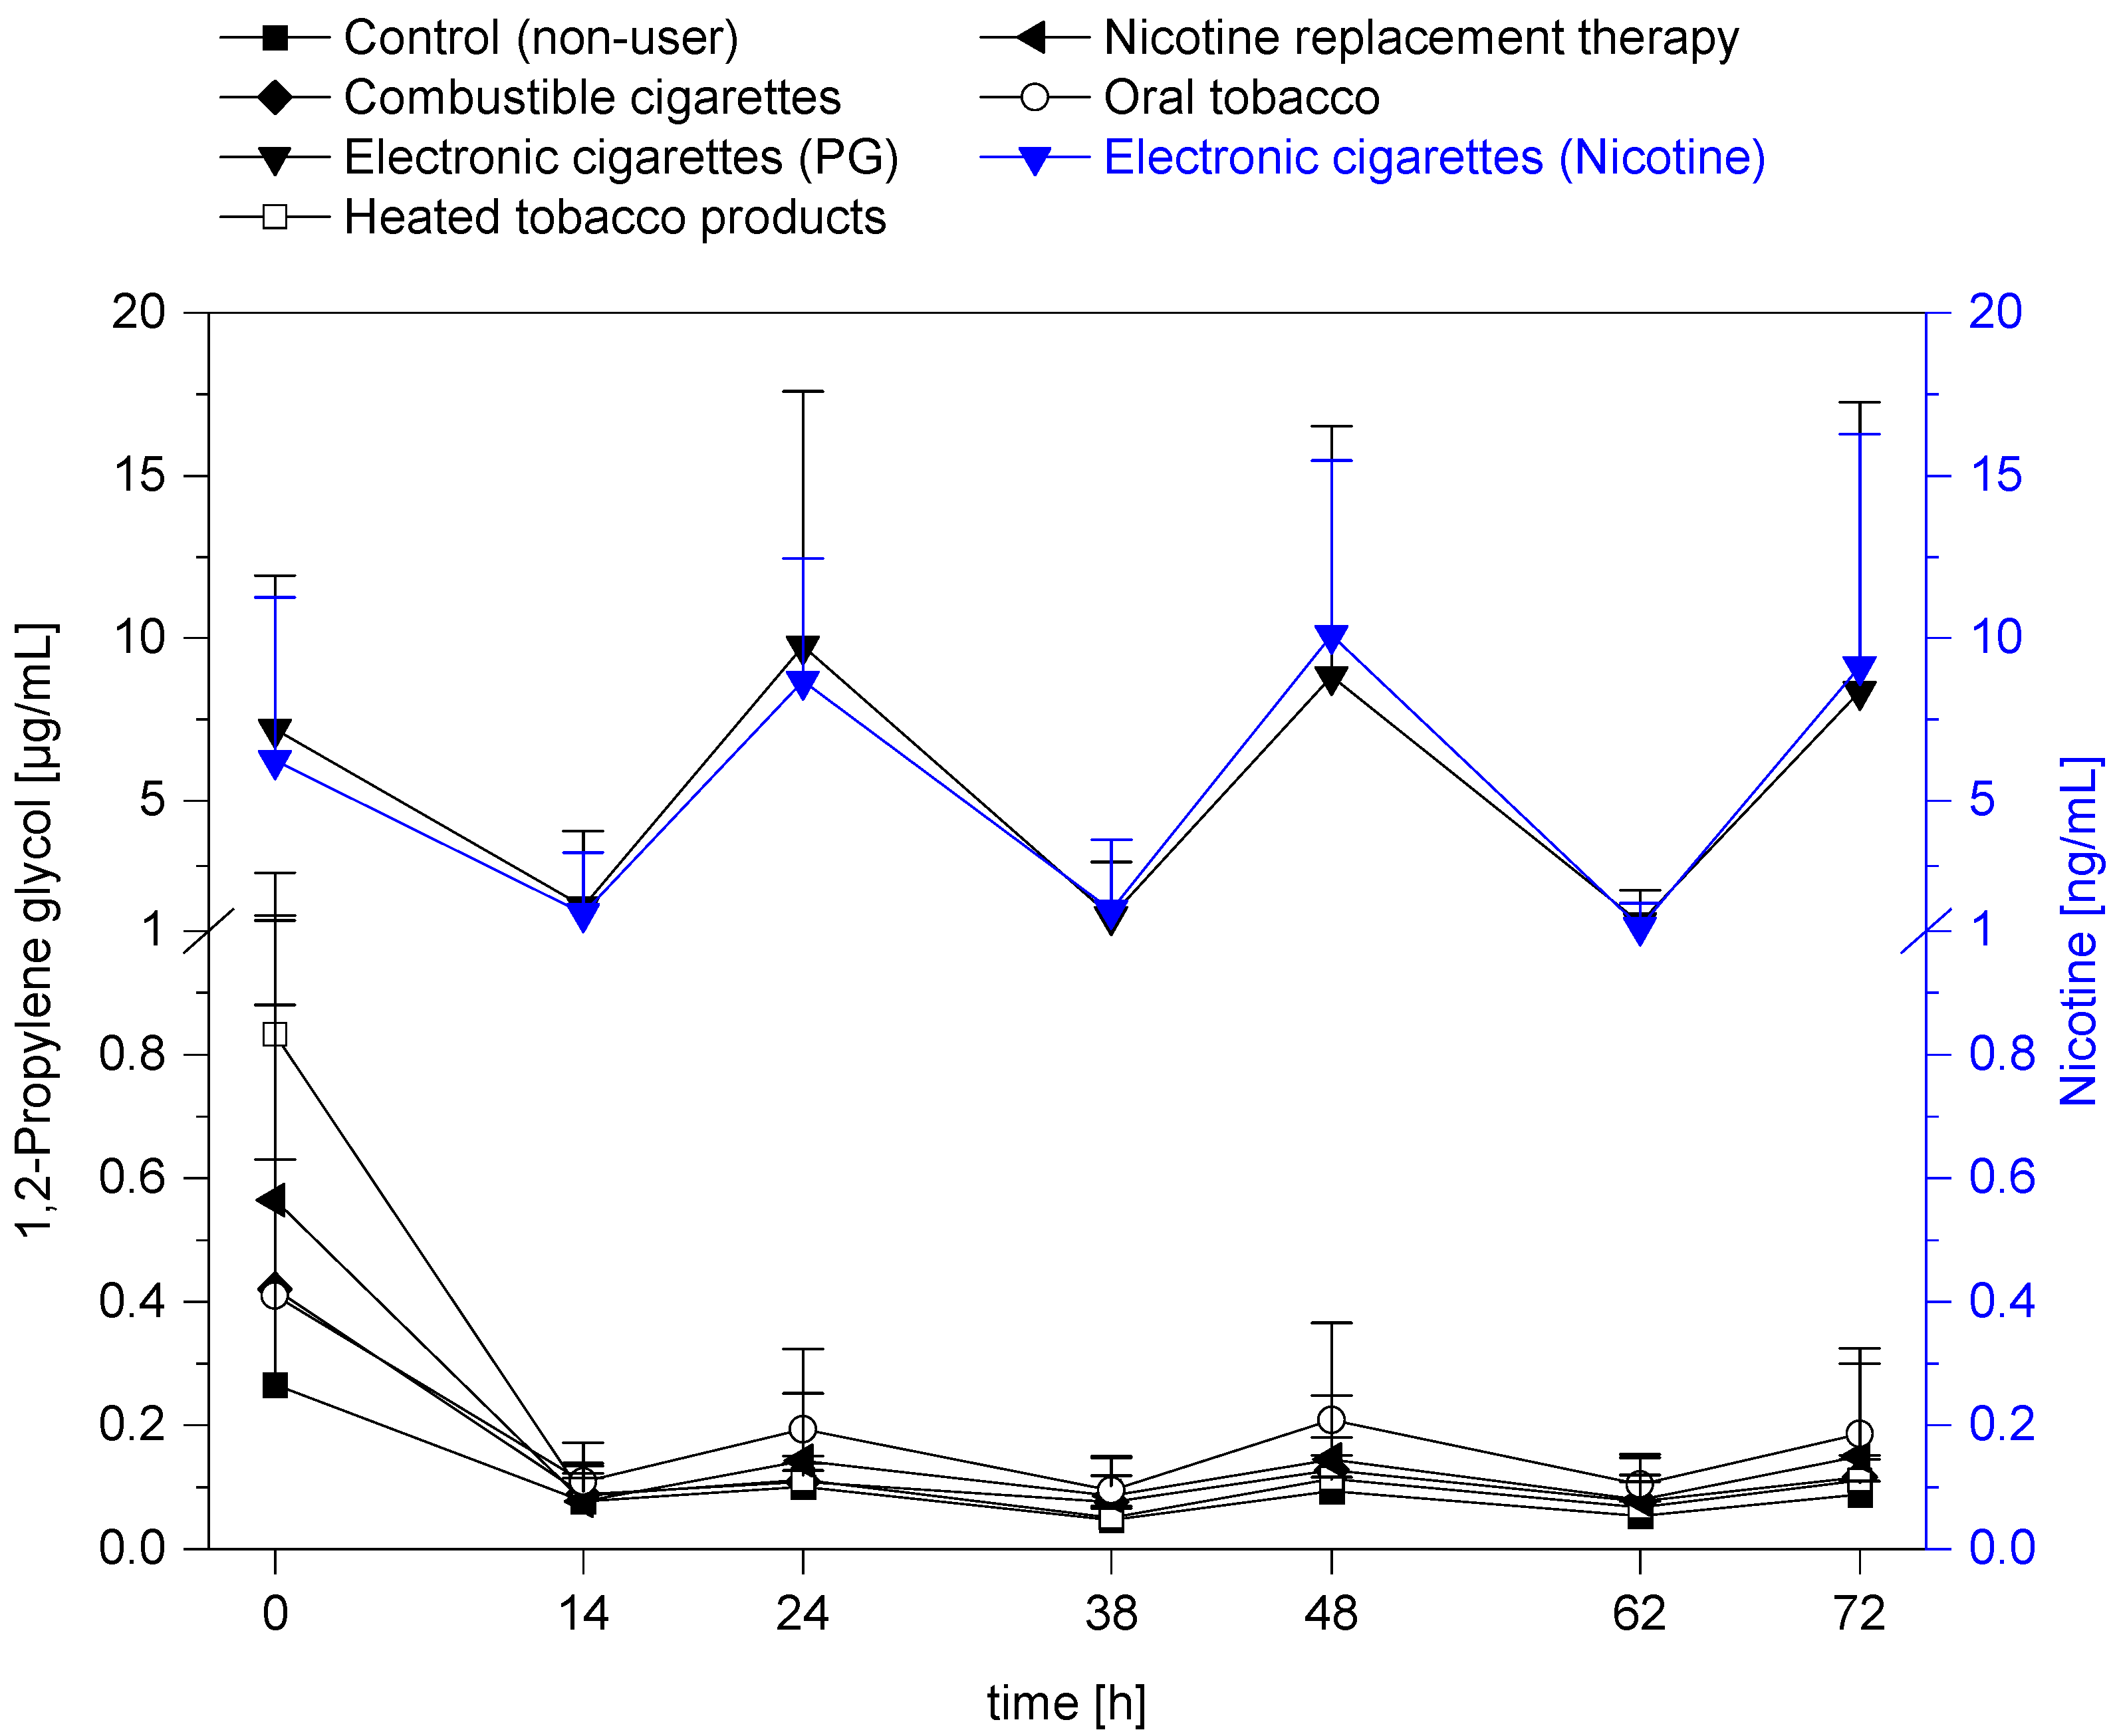
3. Results and Discussion
4. Conclusions
Supplementary Materials
Author Contributions
Funding
Institutional Review Board Statement
Informed Consent Statement
Data Availability Statement
Acknowledgments
Conflicts of Interest
References
- Institute of Medicine (IOM). Clearing the Smoke: Assessing the Science Base for Tobacco Harm Reduction; National Academy Press: Washington, DC, USA, 2001; pp. 1–500. [Google Scholar]
- US Department of Health and Human Services. How Tobacco Smoke Causes Disease: The Biology and Behavioral Basis for Smoking-Attributable Disease—A Report of the Surgeon General; National Library of Medicine Cataloging in Publication: Rockville, MD, USA, 2010; pp. 1–792. [Google Scholar]
- Djordjevic, M.V.; Doran, K.A. Nicotine content and delivery across tobacco products. Handb. Exp. Pharmacol. 2009, 61–82. [Google Scholar] [CrossRef]
- Chang, C.M.; Edwards, S.H.; Arab, A.; Del Valle-Pinero, A.Y.; Yang, L.; Hatsukami, D.K. Biomarkers of Tobacco Exposure: Summary of an FDA-Sponsored Public Workshop. Cancer Epidemiol. Biomark. Prev. Publ. Am. Assoc. Cancer Res. Cosponsored Am. Soc. Prev. Oncol. 2016. [Google Scholar] [CrossRef]
- Schick, S.F.; Blount, B.C.; Jacob, P., 3rd; Saliba, N.A.; Bernert, J.T.; El Hellani, A.; Jatlow, P.; Pappas, R.S.; Wang, L.; Foulds, J.; et al. Biomarkers of Exposure to New and Emerging Tobacco and Nicotine Delivery Products. Am. J. Physiology Lung Cell. Mol. Physiol. 2017, 313, L425–L452. [Google Scholar] [CrossRef]
- Alwis, K.U.; Blount, B.C.; Britt, A.S.; Patel, D.; Ashley, D.L. Simultaneous analysis of 28 urinary VOC metabolites using ultra high performance liquid chromatography coupled with electrospray ionization tandem mass spectrometry (UPLC-ESI/MSMS). Anal. Chim. Acta 2012, 750, 152–160. [Google Scholar] [CrossRef]
- Pluym, N.; Gilch, G.; Scherer, G.; Scherer, M. Analysis of 18 urinary mercapturic acids by two high-throughput multiplex-LC-MS/MS methods. Anal. Bioanal. Chem. 2015, 407, 5463–5476. [Google Scholar] [CrossRef]
- Xia, B.; Blount, B.C.; Guillot, T.; Brosius, C.; Li, Y.; Van Bemmel, D.M.; Kimmel, H.L.; Chang, C.M.; Borek, N.; Edwards, K.C.; et al. Tobacco-Specific Nitrosamines (NNAL, NNN, NAT, and NAB) Exposures in the US Population Assessment of Tobacco and Health (PATH) Study Wave 1 (2013-2014). Nicotine Tob. Res. Off. J. Soc. Res. Nicotine Tob. 2021, 23, 573–583. [Google Scholar] [CrossRef]
- Riedel, K.; Scherer, G.; Engl, J.; Hagedorn, H.W.; Tricker, A.R. Determination of three carcinogenic aromatic amines in urine of smokers and nonsmokers. J. Anal. Toxicol. 2006, 30, 187–195. [Google Scholar] [CrossRef]
- McNeill, A.; Brose, L.S.; Calder, R.; Hitchman, S.C.; Hajek, P.; McRobbie, H. E-cigarettes: An Evidence Update. A Report Commissioned by Public Health England; Public Health England: London, UK, 2015; pp. 1–113. [Google Scholar]
- McNeill, A.; Brose, L.; Calder, R.; Simonavicius, E.; Robson, D. Vaping in England: An evidence update including vaping for smoking cessation, February 2021; Public Health England: London, UK, 2021; pp. 1–247. [Google Scholar]
- Hatsukami, D.K.; Carroll, D.M. Tobacco harm reduction: Past history, current controversies and a proposed approach for the future. Prev. Med. 2020, 140, 106099. [Google Scholar] [CrossRef]
- Adkison, S.E.; O’Connor, R.J.; Bansal-Travers, M.; Hyland, A.; Borland, R.; Yong, H.H.; Cummings, K.M.; McNeill, A.; Thrasher, J.F.; Hammond, D.; et al. Electronic nicotine delivery systems: International tobacco control four-country survey. Am. J. Prev. Med. 2013, 44, 207–215. [Google Scholar] [CrossRef]
- Mayer, M.; Reyes-Guzman, C.; Grana, R.; Choi, K.; Freedman, N.D. Demographic Characteristics, Cigarette Smoking, and e-Cigarette Use Among US Adults. JAMA Netw. Open 2020, 3, e2020694. [Google Scholar] [CrossRef]
- Kapan, A.; Stefanac, S.; Sandner, I.; Haider, S.; Grabovac, I.; Dorner, T.E. Use of Electronic Cigarettes in European Populations: A Narrative Review. Int. J. Environ. Res. Public Health 2020, 17, 1917. [Google Scholar] [CrossRef]
- Prakash, S.; Hatcher, C.; Shiffman, S. Prevalence of ENDS and JUUL Use, by Smoking Status, in National Samples of Young Adults and Older Adults in the U.S. Am. J. Health Behav. 2021, 45, 402–418. [Google Scholar] [CrossRef]
- Bonner, E.; Chang, Y.; Christie, E.; Colvin, V.; Cunningham, B.; Elson, D.; Ghetu, C.; Huizenga, J.; Hutton, S.J.; Kolluri, S.K.; et al. The chemistry and toxicology of vaping. Pharmacol. Ther. 2021, 225, 107837. [Google Scholar] [CrossRef]
- Dai, J.; Kim, K.-H.; Szulejko, J.E.; Jo, S.-H.; Kwon, K.; Choi, D.W. Quantification of nicotine and major solvents in retail electronic cigarette fluids and vaped aerosols. Microchem. J. 2018, 140, 262–268. [Google Scholar] [CrossRef]
- Crenshaw, M.D.; Tefft, M.E.; Buehler, S.S.; Brinkman, M.C.; Clark, P.I.; Gordon, S.M. Determination of Nicotine, Glycerol, Propylene Glycol and Water in Electronic Cigarette Fluids Using Quantitative 1 H NMR. Magn. Reson. Chem. MRC 2016, 54, 901–904. [Google Scholar] [CrossRef]
- Ruddick, J.A. Toxicology, metabolism, and biochemistry of 1, 2-propanediol. Toxicol. App. Pharmacol. 1972, 21, 102–111. [Google Scholar] [CrossRef]
- Wilson, K.C.; Reardon, C.; Theodore, A.C.; Farber, H.W. Propylene glycol toxicity: A severe iatrogenic illness in ICU patients receiving IV benzodiazepines: A case series and prospective, observational pilot study. Chest 2005, 128, 1674–1681. [Google Scholar] [CrossRef]
- Koehler, K.; Braun, H.; de Marees, M.; Geyer, H.; Thevis, M.; Mester, J.; Schaenzer, W. Urinary excretion of exogenous glycerol administration at rest. Drug Test. Anal. 2011, 3, 877–882. [Google Scholar] [CrossRef]
- McMartin, K. Propylene Glycol. In Encyclopedia of Toxicology, 3rd ed.; Wexler, P., Ed.; Academic Press: Oxford, UK, 2014; pp. 1113–1116. [Google Scholar]
- Hutzler, C.; Paschke, M.; Kruschinski, S.; Henkler, F.; Hahn, J.; Luch, A. Chemical hazards present in liquids and vapors of electronic cigarettes. Arch. Toxicol. 2014, 88, 1295–1308. [Google Scholar] [CrossRef]
- National Toxicology Program. NTP-CERHR Monograph on the Potential Human Reproductive and Developmental Effects of Propylene Glycol (PG). NTP CERHR Mon. 2004, 12, 1–III6. [Google Scholar]
- Wernke, M.J. Glycerol. In Encyclopedia of Toxicology, 3rd ed.; Wexler, P., Ed.; Academic Press: Oxford, UK, 2014; pp. 754–756. [Google Scholar]
- Sibul, F.; Burkhardt, T.; Kachhadia, A.; Pilz, F.; Scherer, G.; Scherer, M.; Pluym, N. Identification of biomarkers specific to five different nicotine product user groups: Study protocol of a controlled clinical trial. Contemp. Clin. Trials Commun. 2021, 22, 100794. [Google Scholar] [CrossRef]
- Landmesser, A.; Scherer, M.; Pluym, N.; Sarkar, M.; Edmiston, J.; Niessner, R.; Scherer, G. Biomarkers of Exposure Specific to E-vapor Products Based on Stable-Isotope Labeled Ingredients. Nicotine Tob. Res. Off. J. Soc. Res. Nicotine Tob. 2019, 21, 314–322. [Google Scholar] [CrossRef]
- Food and Drug Administration (FDA). Bioanalytical Method Validation—Guidance for Industry. 2018. Available online: https://www.fda.gov/downloads/Drugs/GuidanceComplianceRegulatoryInformation/Guidances/UCM070107.pdf (accessed on 12 August 2021).
- Piller, M.; Gilch, G.; Scherer, G.; Scherer, M. Simple, fast and sensitive LC-MS/MS analysis for the simultaneous quantification of nicotine and 10 of its major metabolites. J. Chromatogr. B: Anal. Technol. Biomed. Life Sci. 2014, 951–952, 7–15. [Google Scholar] [CrossRef]
- Jansson, P.A.; Larsson, A.; Smith, U.; Lönnroth, P. Glycerol production in subcutaneous adipose tissue in lean and obese humans. J. Clin. Investig. 1992, 89, 1610–1617. [Google Scholar] [CrossRef]
- Rotondo, F.; Ho-Palma, A.C.; Remesar, X.; Fernández-López, J.A.; Romero, M.d.M.; Alemany, M. Glycerol is synthesized and secreted by adipocytes to dispose of excess glucose, via glycerogenesis and increased acyl-glycerol turnover. Sci. Rep. 2017, 7, 8983. [Google Scholar] [CrossRef]
- Brisson, D.; Vohl, M.-C.; St-Pierre, J.; Hudson, T.J.; Gaudet, D. Glycerol: A neglected variable in metabolic processes? BioEssays 2001, 23, 534–542. [Google Scholar] [CrossRef]
- Nelson, J.L.; Harmon, M.E.; Robergs, R.A. Identifying plasma glycerol concentration associated with urinary glycerol excretion in trained humans. J. Anal. Toxicol. 2011, 35, 617–623. [Google Scholar] [CrossRef][Green Version]
- Wurita, A.; Suzuki, O.; Hasegawa, K.; Gonmori, K.; Minakata, K.; Yamagishi, I.; Nozawa, H.; Watanabe, K. Presence of appreciable amounts of ethylene glycol, propylene glycol, and diethylene glycol in human urine of healthy subjects. Forensic Toxicol. 2014, 32, 39–44. [Google Scholar] [CrossRef]
- Laitinen, J.; Liesivuori, J.; Savolainen, H. Exposure to glycols and their renal effects in motor servicing workers. Occup. Med. 1995, 45, 259–262. [Google Scholar] [CrossRef]
- Jansen, E.; Ramlal, R.; Cremers, H.; Talhout, R. Stability and Concentrations of Humectants in Tobacco. J. Anal. Bioanal. Tech. 2017, 8, 380. [Google Scholar] [CrossRef]
- Pennings, J.L.A.; Cremers, J.; Becker, M.J.A.; Klerx, W.N.M.; Talhout, R. Aldehyde and VOC yields in commercial cigarette mainstream smoke are mutually related and depend on the sugar and humectant content in tobacco. Nicotine Tob. Res. Off. J. Soc. Res. Nicotine Tob. 2019, 10, 748–1756. [Google Scholar] [CrossRef]
- Heck, J.D.; Gaworski, C.L.; Rajendran, N.; Morrissey, R.L. Toxicologic evaluation of humectants added to cigarette tobacco: 13-week smoke inhalation study of glycerin and propylene glycol in Fischer 344 rats. Inhal. Toxicol. 2002, 14, 1135–1152. [Google Scholar] [CrossRef]
- Gaworski, C.L.; Oldham, M.J.; Coggins, C.R.E. Toxicological considerations on the use of propylene glycol as a humectant in cigarettes. Toxicology 2010, 269, 54–66. [Google Scholar] [CrossRef]
- Stepanov, I.; Woodward, A. Heated tobacco products: Things we do and do not know. Tob. Control 2018, 27, s7–s8. [Google Scholar] [CrossRef] [PubMed]
- Uchiyama, S.; Noguchi, M.; Takagi, N.; Hayashida, H.; Inaba, Y.; Ogura, H.; Kunugita, N. Simple Determination of Gaseous and Particulate Compounds Generated from Heated Tobacco Products. Chem. Res. Toxicol. 2018, 7, 585–593. [Google Scholar] [CrossRef]
- McAdam, K.G.; Kimpton, H.; Faizi, A.; Porter, A.; Rodu, B. The composition of contemporary American and Swedish smokeless tobacco products. BMC Chem. 2019, 13, 31. [Google Scholar] [CrossRef] [PubMed]
- Eaton, D.L.; Kwan, L.Y.; Stratton, K.; National Academies of Sciences, E. Toxicology of E-Cigarette Constituents. In Public Health Consequences of E-Cigarettes; National Academies Press (US): Washington, DC, USA, 2018. [Google Scholar]
- Hajek, P.; Etter, J.F.; Benowitz, N.; Eissenberg, T.; McRobbie, H. Electronic cigarettes: Review of use, content, safety, effects on smokers and potential for harm and benefit. Addiction 2014, 109, 1801–1810. [Google Scholar] [CrossRef] [PubMed]
- Gillman, I.G.; Kistler, K.A.; Stewart, E.W.; Paolantonio, A.R. Effect of variable power levels on the yield of total aerosol mass and formation of aldehydes in e-cigarette aerosols. Regul. Toxicol. Pharmacol. 2016, 75, 58–65. [Google Scholar] [CrossRef] [PubMed]
- St Helen, G.; Shahid, M.; Chu, S.; Benowitz, N.L. Impact of e-liquid flavors on e-cigarette vaping behavior. Drug Alcohol Depend. 2018, 189, 42–48. [Google Scholar] [CrossRef] [PubMed]
- Cunningham, A.; Slayford, S.; Vas, C.; Gee, J.; Costigan, S.; Prasad, K. Development, validation and application of a device to measure e-cigarette users’ puffing topography. Sci. Rep. 2016, 6, 35071. [Google Scholar] [CrossRef]
- Spindle, T.R.; Talih, S.; Hiler, M.M.; Karaoghlanian, N.; Halquist, M.S.; Breland, A.B.; Shihadeh, A.; Eissenberg, T. Effects of electronic cigarette liquid solvents propylene glycol and vegetable glycerin on user nicotine delivery, heart rate, subjective effects, and puff topography. Drug Alcohol Depend. 2018, 188, 193–199. [Google Scholar] [CrossRef] [PubMed]
- Talih, S.; Balhas, Z.; Eissenberg, T.; Salman, R.; Karaoghlanian, N.; El Hellani, A.; Baalbaki, R.; Saliba, N.; Shihadeh, A. Effects of User Puff Topography, Device Voltage, and Liquid Nicotine Concentration on Electronic Cigarette Nicotine Yield: Measurements and Model Predictions. Nicotine Tob. Res. Off. J. Soc. Res. Nicotine Tob. 2014, 3, 150–157. [Google Scholar] [CrossRef] [PubMed]
- DeVito, E.E.; Krishnan-Sarin, S. E-cigarettes: Impact of E-Liquid Components and Device Characteristics on Nicotine Exposure. Curr. Neuropharmacol. 2018, 16, 438–459. [Google Scholar] [CrossRef] [PubMed]
- El-Hellani, A.; Salman, R.; El-Hage, R.; Talih, S.; Malek, N.; Baalbaki, R.; Karaoghlanian, N.; Nakkash, R.; Shihadeh, A.; Saliba, N.A. Nicotine and Carbonyl Emissions From Popular Electronic Cigarette Products: Correlation to Liquid Composition and Design Characteristics. Nicotine Tob. Res. Off. J. Soc. Res. Nicotine Tob. 2016, 20, 215–223. [Google Scholar] [CrossRef]
- Farsalinos, K.E.; Spyrou, A.; Tsimopoulou, K.; Stefopoulos, C.; Romagna, G.; Voudris, V. Nicotine absorption from electronic cigarette use: Comparison between first and new-generation devices. Sci. Rep. 2014, 4, 4133. [Google Scholar] [CrossRef] [PubMed]
- Li, Y.; Burns, A.E.; Tran, L.N.; Abellar, K.A.; Poindexter, M.; Li, X.; Madl, A.K.; Pinkerton, K.E.; Nguyen, T.B. Impact of e-Liquid Composition, Coil Temperature, and Puff Topography on the Aerosol Chemistry of Electronic Cigarettes. Chem. Res. Toxicol. 2021, 34, 1640–1654. [Google Scholar] [CrossRef]
- Cahours, X.; Prasad, K. A Review of Electronic Cigarette Use Behaviour Studies. Beiträge Zur Tab. Int. Contrib. Tob. Res. 2018, 28, 81–92. [Google Scholar] [CrossRef]
- Rebuli, M.E.; Liu, F.; Urman, R.; Barrington-Trimis, J.L.; Eckel, S.P.; McConnell, R.; Jaspers, I. Compliance in controlled e-cigarette studies. Nicotine Tob. Res. Off. J. Soc. Res. Nicotine Tob. 2020, 17. [Google Scholar] [CrossRef]
- Winden, T.J.; Chen, E.S.; Wang, Y.; Sarkar, I.N.; Carter, E.W.; Melton, G.B. Towards the Standardized Documentation of E-Cigarette Use in the Electronic Health Record for Population Health Surveillance and Research. AMIA Jt Summits Transl. Sci. Proc. 2015, 2015, 199–203. [Google Scholar]
- Logue, J.M.; Sleiman, M.; Montesinos, V.N.; Russell, M.L.; Litter, M.I.; Benowitz, N.L.; Gundel, L.A.; Destaillats, H. Emissions from Electronic Cigarettes: Assessing Vapers’ Intake of Toxic Compounds, Secondhand Exposures, and the Associated Health Impacts. Environ. Sci. Technol. 2017, 51, 9271–9279. [Google Scholar] [CrossRef]
- St Helen, G.; Havel, C.; Dempsey, D.A.; Jacob, P., 3rd; Benowitz, N.L. Nicotine delivery, retention and pharmacokinetics from various electronic cigarettes. Addiction 2016, 111, 535–544. [Google Scholar] [CrossRef]
- Benowitz, N.L.; St Helen, G.; Nardone, N.; Cox, L.S.; Jacob, P. Urine Metabolites for Estimating Daily Intake of Nicotine From Cigarette Smoking. Nicotine Tob. Res. Off. J. Soc. Res. Nicotine Tob. 2020, 22, 288–292. [Google Scholar] [CrossRef] [PubMed]
- Holloway, A.C. Nicotine. In Encyclopedia of Toxicology, 3rd ed.; Wexler, P., Ed.; Academic Press: Oxford, UK, 2014; pp. 514–516. [Google Scholar]
- Feyerabend, C.; Ings, R.M.J.; Russell, M.A.H. Nicotine pharmacokinetics and its application to intake from smoking. Br. J. Clin. Pharmacol. 1985, 19, 239–247. [Google Scholar] [CrossRef] [PubMed]
- Benowitz, N.L.; Hukkanen, J.; Jacob, P., 3rd. Nicotine chemistry, metabolism, kinetics and biomarkers. Handb. Exp. Pharmacol. 2009, 29–60. [Google Scholar] [CrossRef]
- Speth, P.A.; Vree, T.B.; Neilen, N.F.; de Mulder, P.H.; Newell, D.R.; Gore, M.E.; de Pauw, B.E. Propylene glycol pharmacokinetics and effects after intravenous infusion in humans. Ther. Drug Monit. 1987, 9, 255–258. [Google Scholar] [CrossRef]
- Yu, D.K.; Elmquist, W.F.; Sawchuk, R.J. Pharmacokinetics of Propylene Glycol in Humans During Multiple Dosing Regimens. J. Pharm. Sci. 1985, 74, 876–879. [Google Scholar] [CrossRef] [PubMed]
- Conklin, D.J.; Ogunwale, M.A.; Chen, Y.; Theis, W.S.; Nantz, M.H.; Fu, X.A.; Chen, L.C.; Riggs, D.W.; Lorkiewicz, P.; Bhatnagar, A.; et al. Electronic cigarette-generated aldehydes: The contribution of e-liquid components to their formation and the use of urinary aldehyde metabolites as biomarkers of exposure. Aerosol Sci. Technol. J. Am. Assoc. Aerosol Res. 2018, 52, 1219–1232. [Google Scholar] [CrossRef]
- Sakamaki-Ching, S.; Williams, M.; Hua, M.; Li, J.; Bates, S.M.; Robinson, A.N.; Lyons, T.W.; Goniewicz, M.L.; Talbot, P. Correlation between biomarkers of exposure, effect and potential harm in the urine of electronic cigarette users. BMJ Open Respir. Res. 2020, 7, e000452. [Google Scholar] [CrossRef]
- Goniewicz, M.L.; Smith, D.M.; Edwards, K.C.; Blount, B.C.; Caldwell, K.L.; Feng, J.; Wang, L.; Christensen, C.; Ambrose, B.; Borek, N.; et al. Comparison of Nicotine and Toxicant Exposure in Users of Electronic Cigarettes and Combustible Cigarettes. JAMA Net. Open 2018, 1, e185937. [Google Scholar] [CrossRef]
- Glasser, A.M.; Collins, L.; Pearson, J.L.; Abudayyeh, H.; Niaura, R.S.; Abrams, D.B.; Villanti, A.C. Overview of Electronic Nicotine Delivery Systems: A Systematic Review. Am. J. Prev. Med. 2016, 52, e33–e66. [Google Scholar] [CrossRef]
- Faridoun, A.; Sultan, A.S.; Jabra-Rizk, M.A.; Weikel, D.; Varlotta, S.; Meiller, T.F. Salivary biomarker profiles in E-cigarette users and conventional smokers: A cross-sectional study. Oral Dis. 2021, 27, 277–279. [Google Scholar] [CrossRef] [PubMed]
- Jacob, P.; St Helen, G.; Yu, L.; Nardone, N.; Havel, C.; Cheung, P.; Benowitz, N.L. Biomarkers of Exposure for Dual Use of Electronic Cigarettes and Combustible Cigarettes: Nicotelline, NNAL, and Total Nicotine Equivalents. Nicotine Tob. Res. Off. J. Soc. Res. Nicotine Tob. 2019, 22, 1107–1113. [Google Scholar] [CrossRef] [PubMed]
- Rudasingwa, G.; Kim, Y.; Lee, C.; Lee, J.; Kim, S.; Kim, S. Comparison of Nicotine Dependence and Biomarker Levels among Traditional Cigarette, Heat-Not-Burn Cigarette, and Liquid E-Cigarette Users: Results from the Think Study. Int. J. Environ. Res. Public Health 2021, 18, 4777. [Google Scholar] [CrossRef] [PubMed]
- Shahab, L.; Goniewicz, M.L.; Blount, B.C.; Brown, J.; McNeill, A.; Alwis, K.U.; Feng, J.; Wang, L.; West, R. Nicotine, Carcinogen, and Toxin Exposure in Long-Term E-Cigarette and Nicotine Replacement Therapy Users: A Cross-sectional Study. Ann. Intern. Med. 2017, 166, 390–400. [Google Scholar] [CrossRef] [PubMed]


| Analyte | Q1 m/z (Da) | Q3 m/z (Da) | Declustering Potential (V) | Collision Energy (V) | Collision Cell Exit Potential (V) | |
|---|---|---|---|---|---|---|
| 1,2-Propylene glycol (PG) | 285 | 163 | Quantifier | 86 | 13 | 10 |
| 285 | 105 | Qualifier | 86 | 31 | 8 | |
| Glycerol (G) | 405 | 283 | Quantifier | 91 | 13 | 16 |
| 405 | 105 | Qualifier | 91 | 37 | 8 | |
| 1,2-Propylene glycol-d6 | 291 | 169 | IS for PG | 86 | 13 | 10 |
| Glycerol-d5 | 410 | 288 | IS for G | 91 | 13 | 16 |
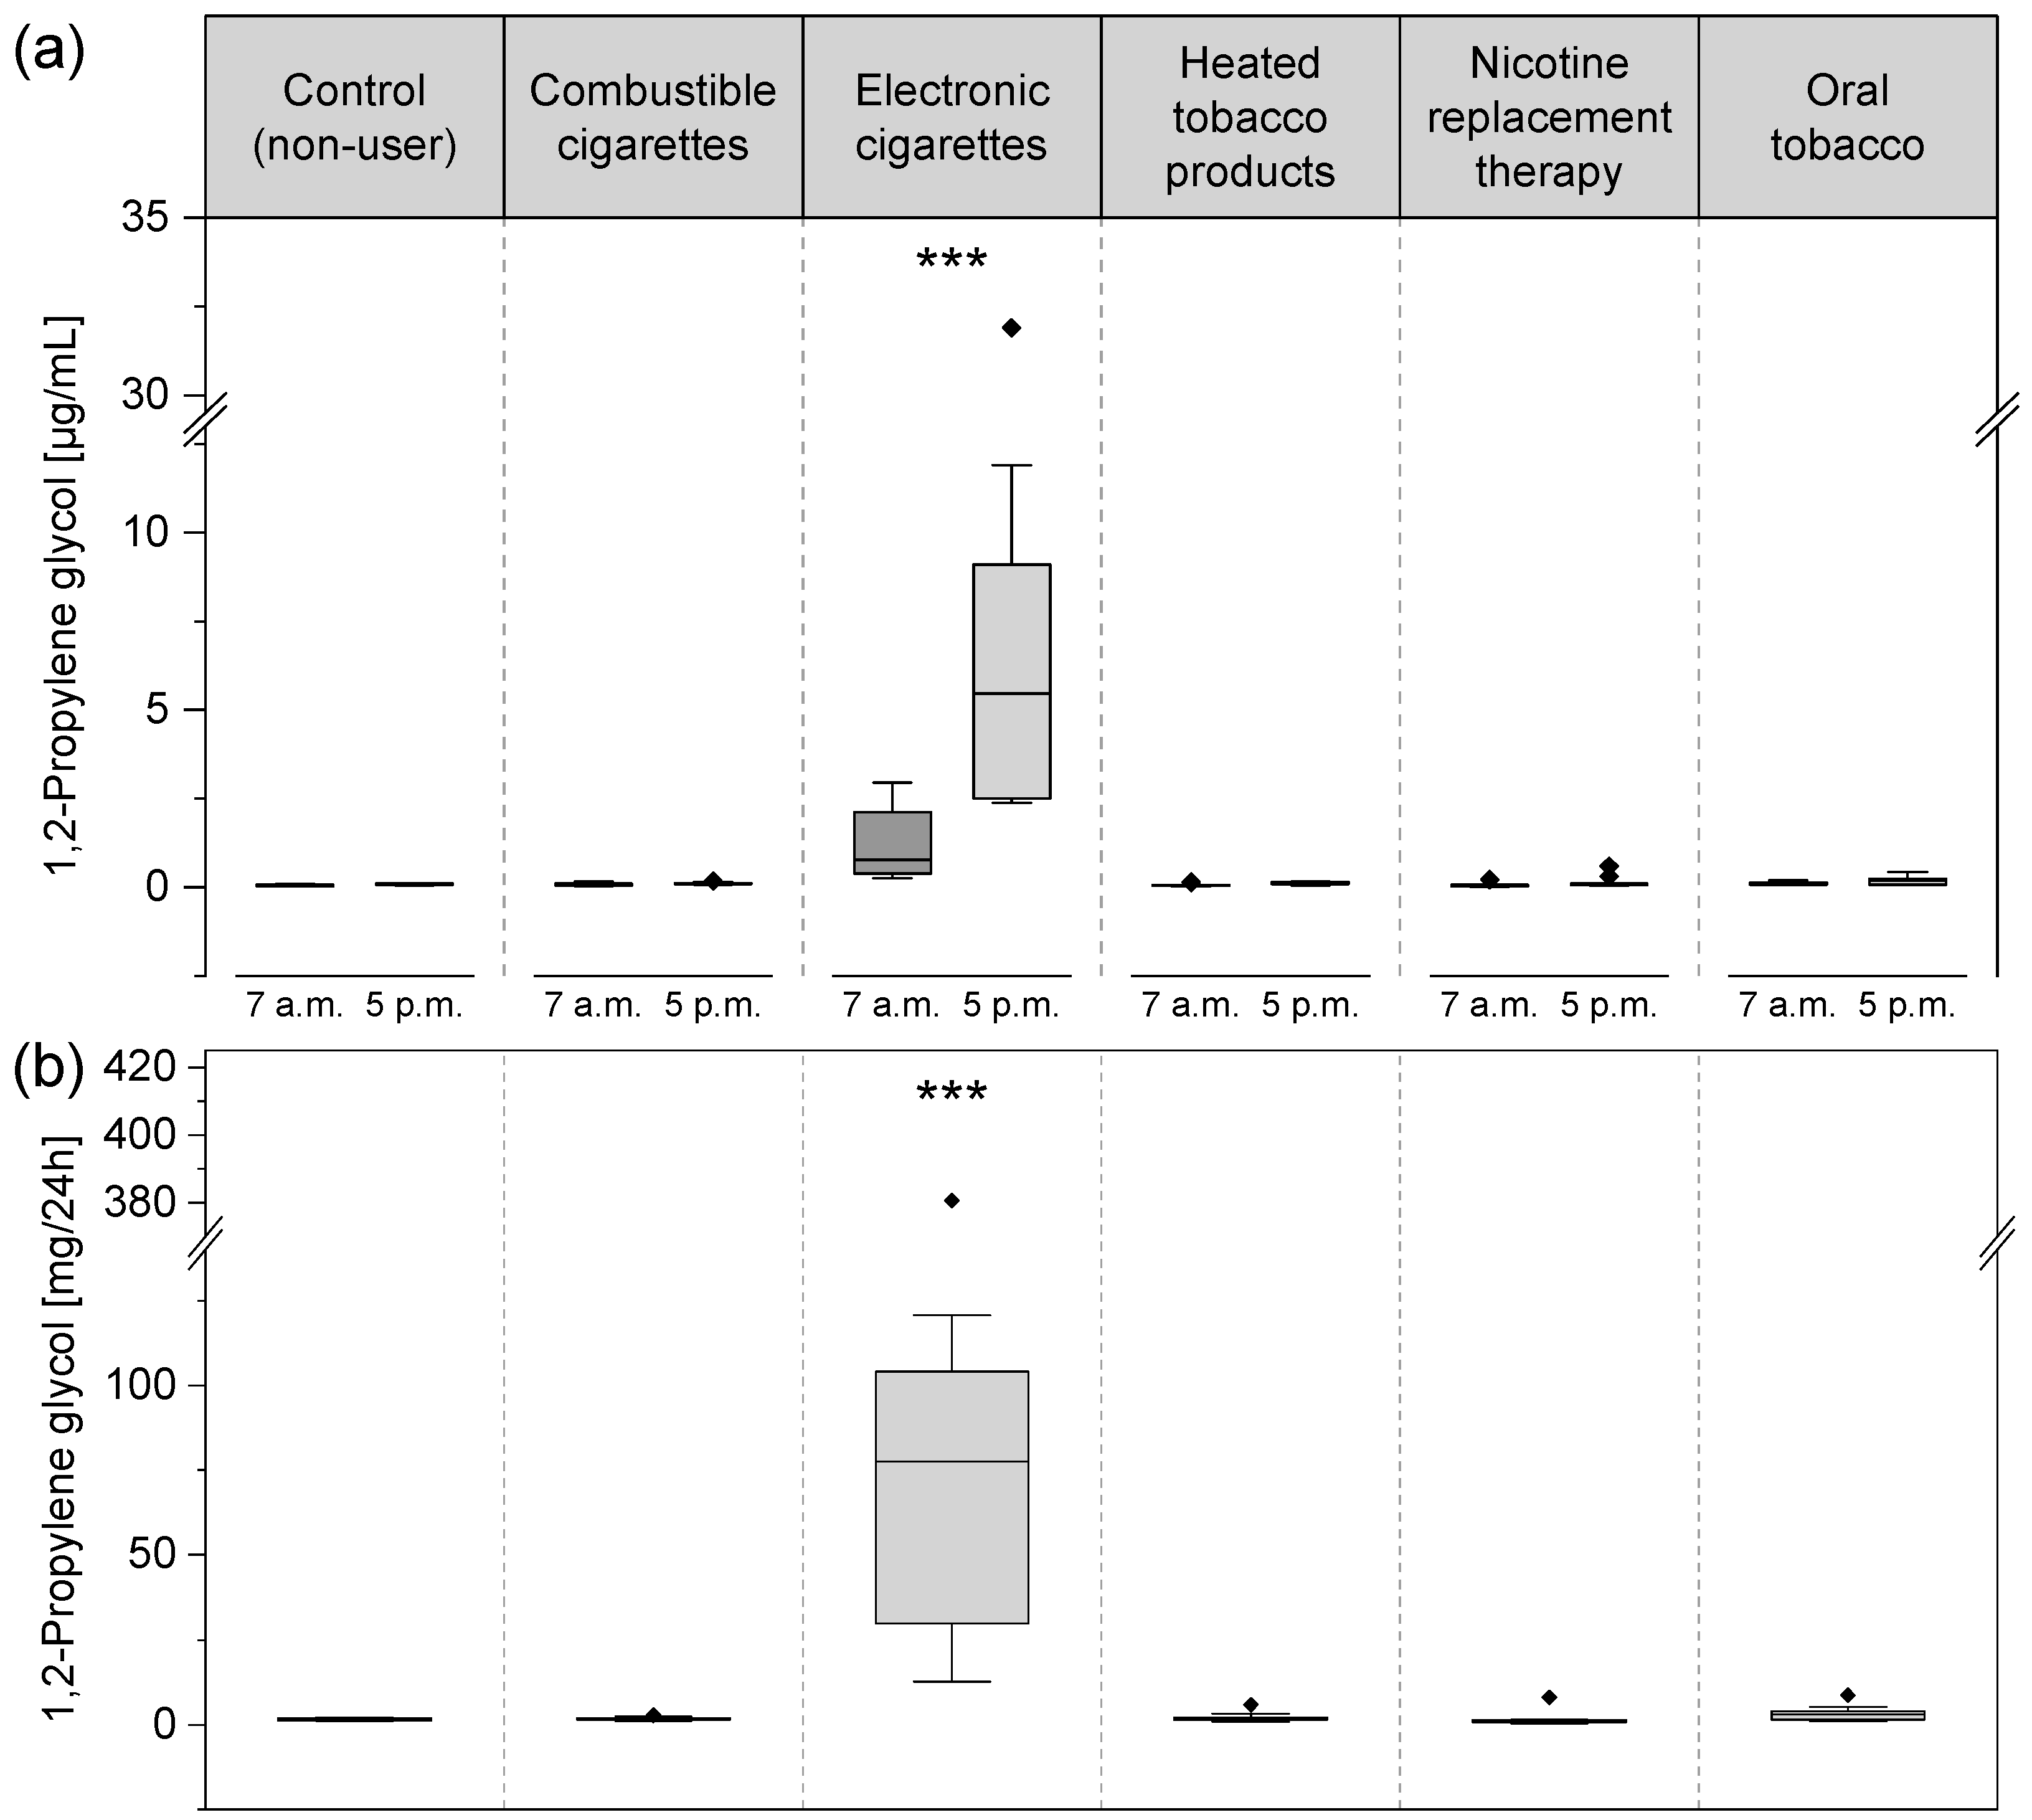
| User Group | Sampling | N Total | Mean | SD | Median | Min | Max |
|---|---|---|---|---|---|---|---|
| Control (non-user, NU) | 7 a.m. | 10 | 0.05 | 0.02 | 0.04 | 0.03 | 0.10 |
| 5 p.m. | 10 | 0.09 *** | 0.02 | 0.09 | 0.05 | 0.12 | |
| Combustible cigarettes (CC) | 7 a.m. | 10 | 0.08 | 0.04 | 0.06 | 0.04 | 0.17 |
| 5 p.m. | 10 | 0.12 | 0.03 | 0.12 | 0.08 | 0.19 | |
| Electronic Cigarettes (EC) | 7 a.m. | 10 | 1.25 | 1.01 | 0.78 | 0.25 | 2.95 |
| 5 p.m. | 10 | 8.37 *** | 8.88 | 5.47 | 2.38 | 31.90 | |
| Heated Tobacco Products (HTP) | 7 a.m. | 10 | 0.07 | 0.04 | 0.05 | 0.03 | 0.15 |
| 5 p.m. | 10 | 0.11 | 0.04 | 0.11 | 0.05 | 0.17 | |
| Nicotine Replacement Therapy (NRT) | 7 a.m. | 10 | 0.08 | 0.07 | 0.06 | 0.02 | 0.22 |
| 5 p.m. | 10 | 0.15 | 0.17 | 0.08 | 0.04 | 0.59 | |
| Oral Tobacco (OT) | 7 a.m. | 10 | 0.11 | 0.04 | 0.10 | 0.06 | 0.20 |
| 5 p.m. | 10 | 0.19 | 0.12 | 0.19 | 0.07 | 0.43 |
| User Group | N Total | Mean | SD | Median | Min | Max | |
|---|---|---|---|---|---|---|---|
| Control (non-user, NU) | 10 | 1.5 | 0.4 | 1.5 | 1.0 | 2.1 | |
| Combustible cigarettes (CC) | 10 | 1.8 | 0.5 | 1.7 | 1.0 | 2.7 | |
| Electronic cigarettes (EC) | 10 | 95.4 *** | 107.1 | 77.6 | 12.7 | 380.7 | |
| Heated tobacco products (HTP) | 10 | 2.1 | 1.5 | 1.6 | 0.9 | 5.9 | |
| Nicotine replacement therapy (NRT) | 10 | 1.7 | 2.3 | 1.1 | 0.4 | 8.1 | |
| Oral tobacco (OT) | 10 | 3.3 | 2.3 | 3.0 | 1.1 | 8.7 |
Publisher’s Note: MDPI stays neutral with regard to jurisdictional claims in published maps and institutional affiliations. |
© 2021 by the authors. Licensee MDPI, Basel, Switzerland. This article is an open access article distributed under the terms and conditions of the Creative Commons Attribution (CC BY) license (https://creativecommons.org/licenses/by/4.0/).
Share and Cite
Burkhardt, T.; Pluym, N.; Scherer, G.; Scherer, M. 1,2-Propylene Glycol: A Biomarker of Exposure Specific to e-Cigarette Consumption. Separations 2021, 8, 180. https://doi.org/10.3390/separations8100180
Burkhardt T, Pluym N, Scherer G, Scherer M. 1,2-Propylene Glycol: A Biomarker of Exposure Specific to e-Cigarette Consumption. Separations. 2021; 8(10):180. https://doi.org/10.3390/separations8100180
Chicago/Turabian StyleBurkhardt, Therese, Nikola Pluym, Gerhard Scherer, and Max Scherer. 2021. "1,2-Propylene Glycol: A Biomarker of Exposure Specific to e-Cigarette Consumption" Separations 8, no. 10: 180. https://doi.org/10.3390/separations8100180
APA StyleBurkhardt, T., Pluym, N., Scherer, G., & Scherer, M. (2021). 1,2-Propylene Glycol: A Biomarker of Exposure Specific to e-Cigarette Consumption. Separations, 8(10), 180. https://doi.org/10.3390/separations8100180