Article

Determination of Synthetic Cathinones in Urine and Oral Fluid by Liquid Chromatography High-Resolution Mass Spectrometry and Low-Resolution Mass Spectrometry: A Method Comparison

Department of Analytical Chemistry and Organic Chemistry, Universitat Rovira i Virgili, Campus Sescelades, Marcel·lí Domingo 1, 43007 Tarragona, Spain
*
Author to whom correspondence should be addressed.
Separations 2020, 7(4), 53; https://doi.org/10.3390/separations7040053
Submission received: 6 September 2020 / Revised: 24 September 2020 / Accepted: 26 September 2020 / Published: 2 October 2020
(This article belongs to the Section Analysis of Natural Products and Pharmaceuticals)

Abstract

:
Synthetic cathinones have become very popular recreational drugs. Therefore, determining them in biological samples is now a matter of concern. In recent years, different methods that have been developed can determine these drugs at low-concentration levels. In general, liquid chromatography mass spectrometry detection plays an important role in these methods and the trend is to use low-resolution and high-resolution mass spectrometry. In this article, for the first time, we compare these two analyzers using an Orbitrap and a triple quadrupole mass spectrometer in order to determine a group of synthetic cathinones in urine and oral fluid samples. For this comparison, we evaluated and compared different parameters: Method detection and quantification limits, linearity, apparent recoveries, matrix effect, repeatability (intra-day), reproducibility (inter-day), and accuracy. Similar results were obtained for the two analyzers for the apparent recoveries and matrix effect. However, triple quadrupole showed higher sensitivity compared to Orbitrap for both urine and oral fluid samples. The quantification limits in urine and the detection limits in saliva were two times lower for triple quadrupole. Finally, when blind samples were analyzed to study the accuracy, similar results were obtained for both analyzers.

1. Introduction

Synthetic cathinones are an important group among the new psychoactive substances (NPS) that have emerged in recent years as some of the most common drugs around the world [1,2]. These compounds are synthetized from the molecule cathinone, a natural alkaloid that can be found in the Catha edulis plant [3]. Although they were first synthetized for medical purposes, they began being used as recreational drugs and have emerged as an important alternative to other worldwide popular drugs such as cocaine, amphetamine, or ecstasy [3]. This is because they have similar effects to some of these drugs, such as paranoia and euphoria, which can be partly attributed to their similarity to amphetamine compounds [2,4]; however, cathinones have an additional ketone group at the β position of the amino chain. Moreover, when cathinones are combined with other drugs such as gamma-hydroxybutyric acid (GHB), gamma-butyrolactone (GBL), or cocaine they can reduce inhibition and enhance sexual activities [2,4]. Synthetic cathinones are sold as “bath salts” and can be found easily on different websites because drug agencies cannot control all of them due to their continuous structural changes [4,5].
When these substances are consumed, they can be present in different biological samples and they have become very important in toxicological and forensic analyses [6,7,8,9,10,11,12,13,14,15,16,17,18,19,20]. Although in these samples it is possible to find the parent drug and its metabolites, it is usually the latter that remain longer in the body. However, there are some matrices including blood and oral fluid (OF), in which the parent drug is not as metabolized as in others, such as in urine [21]. Moreover, depending on the biological sample, the detection window can be different and even this could be affected by several factors, such as the frequency and the amount of drug taken by the individual. In general, for short detection windows, breath, blood, or OF are the usual samples, for medium detection windows, urine and sweat are the most convenient, and for long detection windows, hair and meconium are the preferred choices [21,22,23,24]. In this work, we focused on urine and OF.
Although the concentration range of cathinones in urine and OF may depend on the amount of the drug consumed, in urine, low levels of these compounds in the range of ng mL−1 24 h after the consumption are usual [25], while in OF, cathinones can be found between low and high levels of ng mL−1 due to its earlier detection [26]. Therefore, it is important to provide methods with high sensitivity to be able to detect the usual levels at which these substances can be found in biological samples from drug abusers. The instrumentation is, thus, a key factor for achieving the goal of low detection limits. Mass spectrometry (MS) is a promising tool for this purpose. In the literature, there are several examples in which cathinones have been determined mainly using liquid chromatography (LC) due to the polar characteristics of these compounds. The trend is to use MS as a detection system to obtain methods with high sensitivity. Low-resolution MS, such as tandem MS (MS/MS), and high-resolution MS (HRMS) have become the preferred choices in recent years [6,7,8,9,11,12,13,14,15,16,17,18,19,20]. In the case of MS/MS, there are several examples using triple quadrupole (QqQ) or ion trap MS (QTrap) [6,7,11,12,13,14,15,16]. For HRMS, Orbitrap, QOrbitrap, and quadrupole time-of-flight (QToF) are the most used detectors [8,9,17,18,19,20]. Despite the satisfactory results obtained in these previously reported strategies, neither HRMS nor MS/MS have been compared for determining synthetic cathinones in biological samples as other compounds and matrices have been compared in the literature [27,28,29,30,31,32,33,34,35]. It has been proven that, in general, HRMS offers some advantages compared to MS/MS such as the target, post-target, and nontarget analyses, the possibility of operating in full-scan mode, and higher specificity. Thus, HRMS allows analyzing data for an unlimited number of compounds, with the possibility of performing targeted and untargeted analysis and to perform retrospective analysis. On the other hand, MS/MS normally offers better sensitivity and wider linear ranges. It also offers short dwell times to obtain very narrow peaks [27,34,36,37]. In particular, there are several examples in which QqQ and Orbitrap have been compared [27,28,30,32,33], and the authors concluded that both detectors can reach a similar sensitivity level. However, there are some examples that find significant differences between the compared MS analyzers. This was the case of Vanhaecke et al. [31], who reported higher sensitivity for the QqQ for determining anabolic steroids in meat, Gómez-Canela et al. [34], who reported higher sensitivity for the Orbitrap for characterizing multiclass cytostatic compounds, Kaufmann et al. [29], who obtained better sensitivity for the QqQ for determining veterinary drugs in honey and bovine kidney samples, and Viaene et al. [35], who achieved better sensitivity for the QToF for determining opioids in plasma. As it can be observed, the type of compound and the matrix in which they are determined are key factors when the sensitivity is evaluated.
Considering all the mentioned studies, the main objective of the present work was to establish, for the first time, an accurate comparison between MS/MS and HRMS in terms of sensitivity, accuracy, and other method validation parameters when synthetic cathinones are determined in urine and OF samples.

2. Materials and Methods

2.1. Standards and Materials

Eleven synthetic cathinones were selected for this study: 2-methylmethcathinone (2-MMC), 3,4-dimethylmethylcathinone (3,4-DMMC), 4-fluoromethcathinone (flephedrone), 4-methylcathinone (4-MEC), 4-methylmethcathinone (mephedrone), alpha-pyrrolidinovalerophenone (alpha-PVP), beta-ethylmethcathinone (pentedrone), buphedrone, butylone, methylenedioxypyrovalerone (MDPV), and N-ethylcathinone. All of them were obtained from LGC Standards (Luckenwalde, Germany).
Different stock standard solutions for each cathinone were prepared in methanol (MeOH) at three concentrations: 100 mg L−1, 1000 mg L−1, and 2000 mg L−1. A working standard mixture solution from the individual standard solutions was prepared in MeOH at 1 mg L−1 and then diluted in water to prepare the final solutions. All the standard solutions were stored in the freezer at −20 °C.
The solvents and reagents used in this study were: Acetonitrile (ACN) for LC-MS from Chem-Lab (Zedelgem, Belgium); water for LC-MS purchased from J.T. Baker (Deventer, The Netherlands); hydrochloric acid (HCl), formic acid (HCOOH), ammonium hydroxide (NH4OH), sodium dihydrogen phosphate (NaH2PO4), and disodium hydrogen phosphate (Na2HPO4) from Sigma-Aldrich (St. Louis, MO, USA); and ultrapure water obtained using a water purification system (Merck Millipore, Darmstadt, Germany).
For urine, Oasis MCX (150 mg/6 cc) cartridges from Waters Corp. (Milford, MA, USA) were used. For OF, Salivette® devices were purchased from Starstedt (Nümbrecht, Germany) and a Hettich Universal 32R centrifuge machine from Hettich (Tuttlingen, Germany) was used to centrifugate the samples.

2.2. HPLC Separation

The chromatographic conditions were optimized in a previous study in which the same group of cathinones were successfully separated [9].
A Luna Omega 5 μm Polar C18 (150 mm × 4.6 mm, 5 μm) with a Security Guard from Phenomenex (Torrance, CA, USA) was used for the chromatographic separation at 35 °C with a mobile phase flow rate of 0.6 mL min−1. The sample injection volume was 20 µL and the vials were stored in the autosampler at 10 °C. The mobile phase was composed by A: 0.1% HCOOH in H2O and B: 0.1% HCOOH in ACN in gradient mode starting at 15% B, which was maintained for 5 min, increased to 35% in 5 min, then to 80% in 4 min, and to 100% in 1 min. Finally, it was maintained for 2 min before returning to the initial conditions in 1 min and held for 4 min.

2.3. Orbitrap

A Thermo Scientific Accela 1250 UHPLC system (Bremen, Germany) equipped with an Accela Autosampler automatic injector and an Accela 1250 pump coupled with a Thermo Scientific Exactive OrbitrapTM mass spectrometer were used. The instrument was also equipped with a higher-energy collisional dissociation (HCD) cell and a heated electrospray ionization (HESI) source.
The gas flow rate and temperature parameters were optimized with positive ionization and the following parameters were used: Auxiliary gas, 5 adimensional units (AU); sheath gas, 60 AU; capillary voltage, 30 volts (V); tube lens voltage, 80 V; spray voltage, 2 kV; and skimmer voltage, 24 V. The capillary and heater temperatures were set at 350 °C and 400 °C, respectively. The probe position was set at micrometer 1, side to side 0, and vertical B. Two-time windows were used for data acquisition in positive mode (0–11.75 min and 11.75–15 min). Two scan events in each window were set: Full scan at 50,000 Full Width at Half Maximum (FWHM) with 250 ms of injection time for the first one, and fragmentation scan at 10,000 FWHM with 50 ms of injection time for the second one. The HCD cell was set in “all ion fragmentation” mode with an injection time of 50 ms. The optimum collision voltages were 15 electronvolts (eV) for the first one and 25 eV for the second one. The mass ranges used for the full scan at high resolution were between 60 mass-to-charge ratio (m/z) and 300 m/z. Table 1 specifies the LC-HRMS protonated molecules and fragments. The ion ratio was calculated by dividing the signal of the protonated molecule by the one of the fragment.

2.4. QqQ

The method was validated using an Agilent model 1200 series LC coupled with an Agilent 6460 series triple quadrupole mass spectrometer equipped with an electrospray ionization (ESI) interface from Agilent Technologies (Waldbronn, Germany).
The LC-MS/MS parameters were optimized by injecting individual standards at 1 mg L−1 into a mixture of H2O:MeOH (50:50, volume/volume (v/v)). Five different windows were created according to their retention times: Flephedrone and ethcathinone; buphedrone; 2-MMC, butylone, and mephedrone; 4-MEC and pentedrone; and 3,4-DMMC, alpha-PVP, and MDPV. The optimized source parameters were: Gas flow rate, 13 L min−1; gas temperature, 350 °C; nebulizer pressure, 60 psi; and capillary voltage 2500 V. The fragmentor was 100 V for most of the compounds and 125 V for 3,4-DMMC, alpha-PVP, and MDPV. The collision energies were between 8 and 25 eV. A multiple reaction monitoring (MRM) mode was used, selecting the two most intensive transitions between the parent ion and the product ions. The optimized fragments are shown in Table 2. For the QqQ, the ion ratio was calculated by dividing the qualifier signal between the quantifier one.

2.5. Urine Collection and Preparation

To pretreat the urine samples, the same sample pretreatment procedure that was used in a previous study by our research group was applied [9]. Different urine samples from nonaddicted women and men volunteers of different ages were collected and mixed to obtain a pooled urine sample. All the volunteers consented to the study following the Declaration of Helsinki normative. The samples were collected in polypropylene tubes and kept in the freezer at −20 °C. Before their extraction, the samples were diluted with a phosphate buffer at pH 6 (0.15 molar (M) NaH2PO4 and 0.05 M Na2HPO4), 50:50 (v/v). The Oasis MCX cartridge was activated with 5 mL of MeOH, then conditioned with 5 mL of phosphate buffer solution (pH 6), and loaded with 5 mL of the mixture of urine:buffer 50:50 (v/v). After the loading, the cartridge was washed with 2 mL of MeOH and the analytes were eluted with 2 mL of 5% NH4OH in MeOH. Finally, 100 μL of 1% HCl in MeOH were added prior to the evaporation to dryness under a gentle stream of N2. Then, the obtained residue was reconstituted with 1 mL of mobile phase, filtered through a 0.45 μm polytetrafluoroethylene (PTFE) syringe filter, and transferred to a vial for its chromatographic analysis.

2.6. Saliva Collection and Preparation

The saliva was pretreated using the same procedure as in a previous study by our research group [11]. Salivette® was used to collect the OF samples from nonaddicted volunteers of different ages following the Declaration of Helsinki normative. The cotton swab of the Salivette® was chewed and rolled around in the mouth for 1 min. This swab was returned to the tube and it was centrifuged for 1 min at 8000 rpm (10,800× g). The saliva fell to the bottom of the device and was discarded. Then 1 mL of MeOH was added to the swab and was centrifuged again at the same conditions. The centrifuge was collected, this procedure was repeated, and the two methanolic solutions were combined. Then, 100 µL of 1% HCl in MeOH were added to the solution before evaporating it to dryness under a gentle stream of nitrogen. The residue was then reconstituted with 500 µL of mobile phase under initial chromatographic conditions, filtered through a 0.45-µm PTFE filter, and the final solution was injected into the chromatograph.

2.7. Validation

The methods were validated following the guidance for the validation of analytical methodology and calibration equipment used for testing illicit drugs in seized materials and biological specimens and the European guidelines for workplace drug testing in oral fluid [38,39]. The developed methods were compared in terms of apparent recoveries (Rapp), matrix effects (ME), method detection and quantification limits (MDLs and MQLs), linearity, and accuracy. The retention time in the analyte confirmation had to correspond to a tolerance of ±2.5% and the ion ratio to ±20%. Moreover, in the case of Orbitrap, the error mass had to correspond to a maximum tolerance of 5 ppm [40].
To evaluate the mentioned parameters, urine was spiked before the extraction procedure and OF was spiked in the cotton swab after it had been chewed. The %Rapp in both cases was the recovery of all the methods, calculated from the ratio of the cathinone concentration of a sample spiked prior to the procedure and the concentration for the same cathinone in a standard sample. Both of these were obtained from the instrumental calibration curve.
The percentage of ME was calculated according to the following Equation (1):
%ME = [(Cspiked/CSTD) × 100] − 100
CSTD is the concentration of a cathinone in a standard sample and Cspiked is the concentration of the same cathinone in urine or in an OF extract spiked at the same concentration as CSTD after the procedure.
In the case of Orbitrap, the MDLs were defined as the lowest detectable concentrations with a signal intensity higher than ×103 for the protonated molecule and for the fragments, while the MQLs were considered the lowest point in the calibration curve. However, for the QqQ, the MDLs were the minimum concentrations with a signal to noise (S/N) ratio greater than 3 and the MQLs were the lowest point in the calibration curve with a S/N ratio higher than 10.
The method linearities were based on a matrix-matched calibration curve by evaluating the determination coefficient (r2). Two concentration levels were used to study the Rapp and ME: 1 ng g−1 (low) and 40 ng g−1 (high) for OF and 1 ng mL−1 (low) and 40 ng mL−1 (high) for urine. In the case of OF, the concentrations were expressed as nanograms (ng) of cathinone per gram of OF weighted (ng g−1), and ng was used for the amount of the cathinone in OF in the calibration curve. In the pretreatment, the Salivette® was weighed before and after the sampling to determine the amount of saliva sampled. Thus, to express the concentration of a cathinone in a sample, the ng found was divided by the grams of saliva weighed.
Finally, to determine the accuracy of the methods, we analyzed different blind samples spiked with all the cathinones by a laboratory staff member at different concentrations. The concentration found in these samples was calculated, compared to the spiked value, and the accuracy in terms of error was calculated for each compound.

3. Results and Discussion

In order to evaluate both LC-MS/MS and LC-HRMS methodologies, the methods for urine and OF samples for the two detectors were validated to compare their performance in terms of linearity, MDLs, MQLs, Rapp, ME, and accuracy of the methods.

3.1. Urine Samples

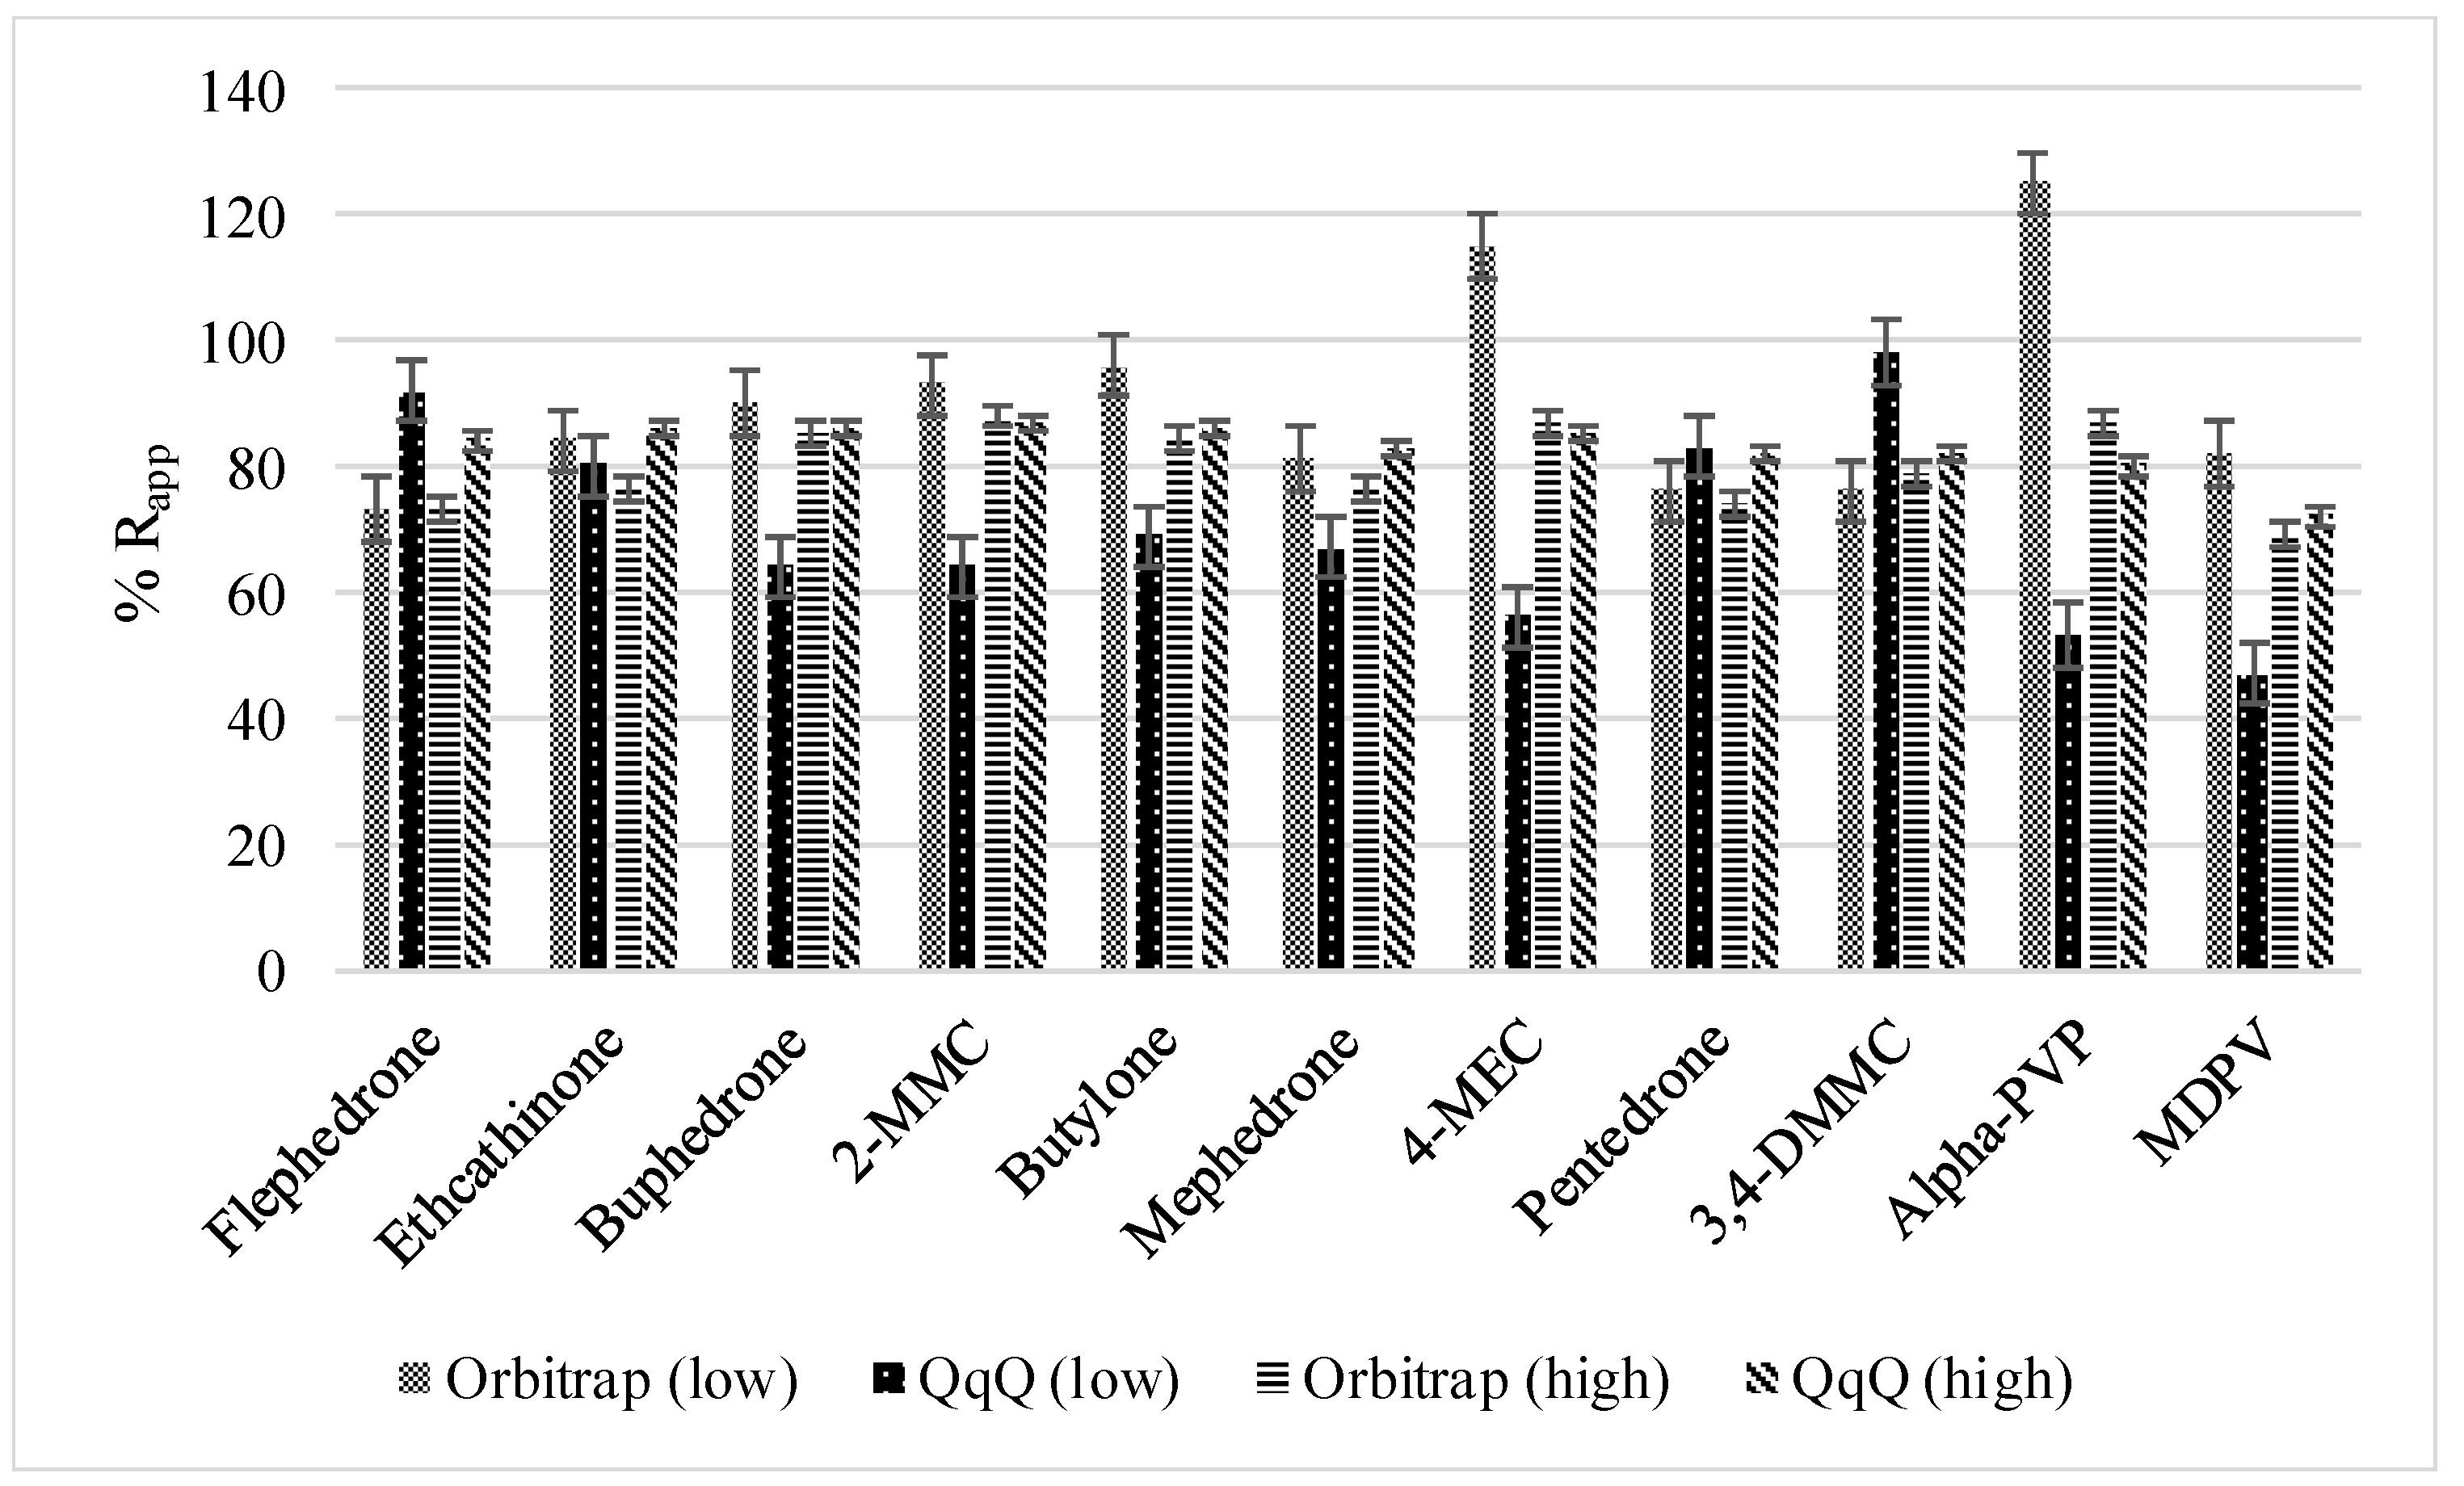
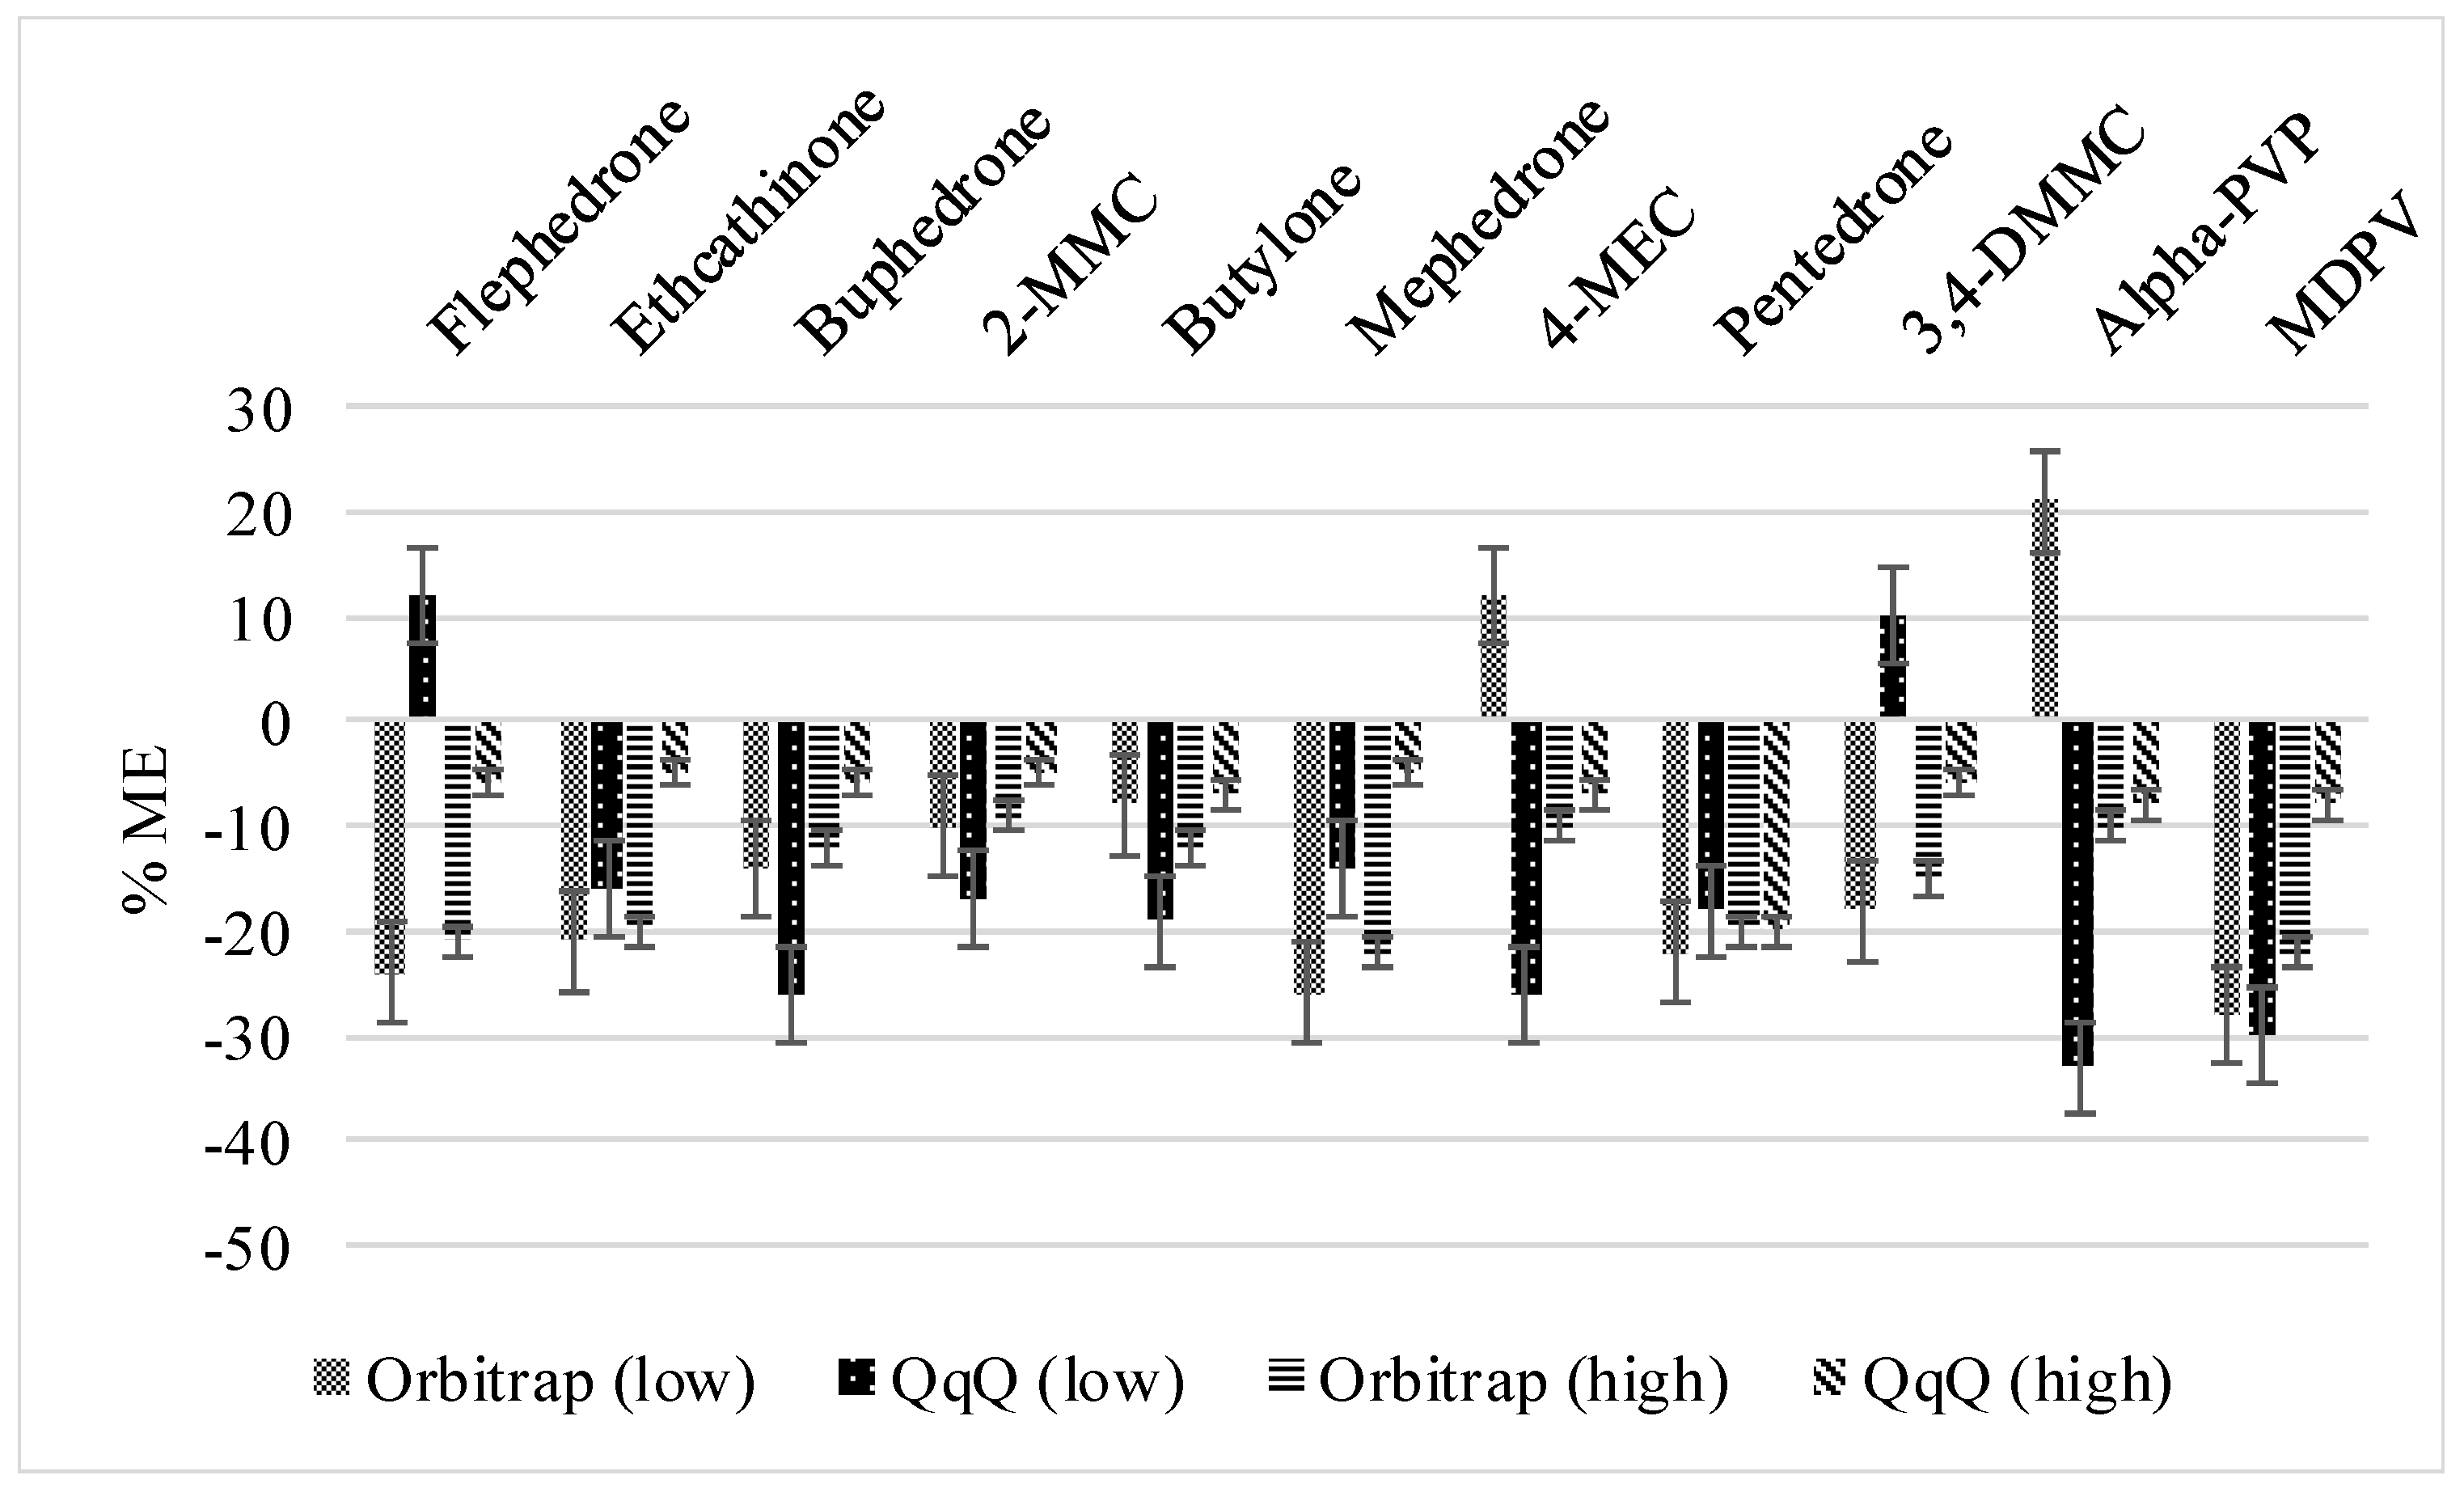
3.1.1. Method Recoveries and Matrix Effects

As it was mentioned above, %Rapp was evaluated at low and high-concentration levels (1 ng mL−1 and 40 ng mL−1). For the low concentration tested, the values of %Rapp for the different cathinones ranged from 73 to 125% for Orbitrap and from 53 to 98% for QqQ, while for the higher concentration value the recovery values ranged between 69 and 88% and 72 and 87%, respectively (Figure 1).
In the case of ME (Figure 2), for Orbitrap at 1 ng mL−1, suppression values were between −8 and −28% for most of the compounds. Enhancements of 12 and 21% were obtained for 4-MEC and alpha-PVP, respectively. At 40 ng mL−1, suppressions between −9 and −22% were obtained for all the compounds. However, for QqQ at the low-concentration level (1 ng mL−1), values from −14 to −33% were obtained for most of the compounds except for flephedrone and 3,4-DMMC, which had enhancements of 12 and 10%, respectively. At the high level (40 ng mL−1), ME values ranged between −5 and −20% for QqQ.
In order to statistically compare both instruments in terms of %Rapp, a two-way ANOVA was performed. At the low-concentration level, LC-HRMS achieved slightly better results compared to LC-QqQ. The results of the statistical test proved that there were significant differences between both MS systems (critical Fisher (F)-value: 4.96; F-obtained: 7.85). On the contrary, at the high concentration, no significant differences between both instruments were found (critical F-value: 4.96; F-obtained: 2.88).

3.1.2. Linearity, MDLs, and MQLs

Matrix-matched calibration curves were used for quantification in the two methods to compensate the ME and the possible losses in the sample pretreatment. Table 3 shows the linearity range and the MDLs and MQLs obtained when the two MS analyzers were used to analyze cathinones in urine. In the case of Orbitrap, the linear range was from 0.050 to 4 ng mL−1 and from 4 to 200 ng mL−1 for most of the cathinones and from 0.200 to 4 ng mL−1 and from 4 to 200 ng mL−1 for ethcathinone, buphedrone, and 4-MEC. For QqQ, the linear range was between the MQL and 4 ng mL−1 and from 4 to 200 ng mL−1. The linear ranges for the two analyzers encompassed the usual concentrations at which these compounds can be found in urine samples from drug abusers. The MQLs for QqQ ranged from 0.020 to 0.070 ng mL−1 and for Orbitrap they were 0.050 ng mL−1 for most analytes and 0.200 ng mL−1 for ethcathinone, buphedrone, and 4-MEC. The MDLs were between 0.005 and 0.035 ng mL−1 for Orbitrap and between 0.040 and 0.160 ng mL−1 for QqQ.
Comparing all these values, it was possible to conclude that with QqQ lower MDLs and MQLs were obtained and, therefore, the method based on LC-MS/MS has better sensitivity for the analyzed cathinones in urine samples than the one based on HRMS. In different studies reported in the literature focused on the comparison of different MS analyzers, the general conclusion was that no significant differences between LC-HRMS and LC-MS/MS in terms of sensitivity were observed [27,28,29,30,31,32,33,34,35]. However, there are some examples in which the results are coincident with those obtained in the present study, as in the case of Vanhaecke et al. [31] and Kaufmann et al. [29], who also obtained better sensitivity for QqQ, although it is important to point out that these authors analyzed different compounds and the matrices were also different to the ones analyzed in this study.

3.1.3. Accuracy

To study the accuracy of the method, three different blind urine samples (A, B, and C) spiked by a laboratory staff member were analyzed using the two methods, LC-Orbitrap and LC-MS/MS. The three samples were spiked at different concentrations: 2 ng mL−1 (A), 60 ng mL−1 (B), and 125 ng mL−1 (C). The accuracy was calculated in terms of percentage of error between the concentration obtained for each cathinone by analyzing these blind samples and the spiked concentration for each analyte. Finally, the average percentage of error was calculated for each sample. In the case of Orbitrap, values of 18% (A), 6% (B), and 15% (C) were obtained and for QqQ the values were 16% (A), 1% (B), and 15% (C). According to the validation guide, the results have to fall within ±20% at the lower concentration and ±15% at the higher concentration [36]. From these results it was possible to observe that all the values obtained were within the range mentioned and, therefore, they were considered very good results for the method accuracy. Moreover, no significant differences between LC-HRMS and LC-MS/MS were observed in terms of accuracy.

3.2. OF Samples

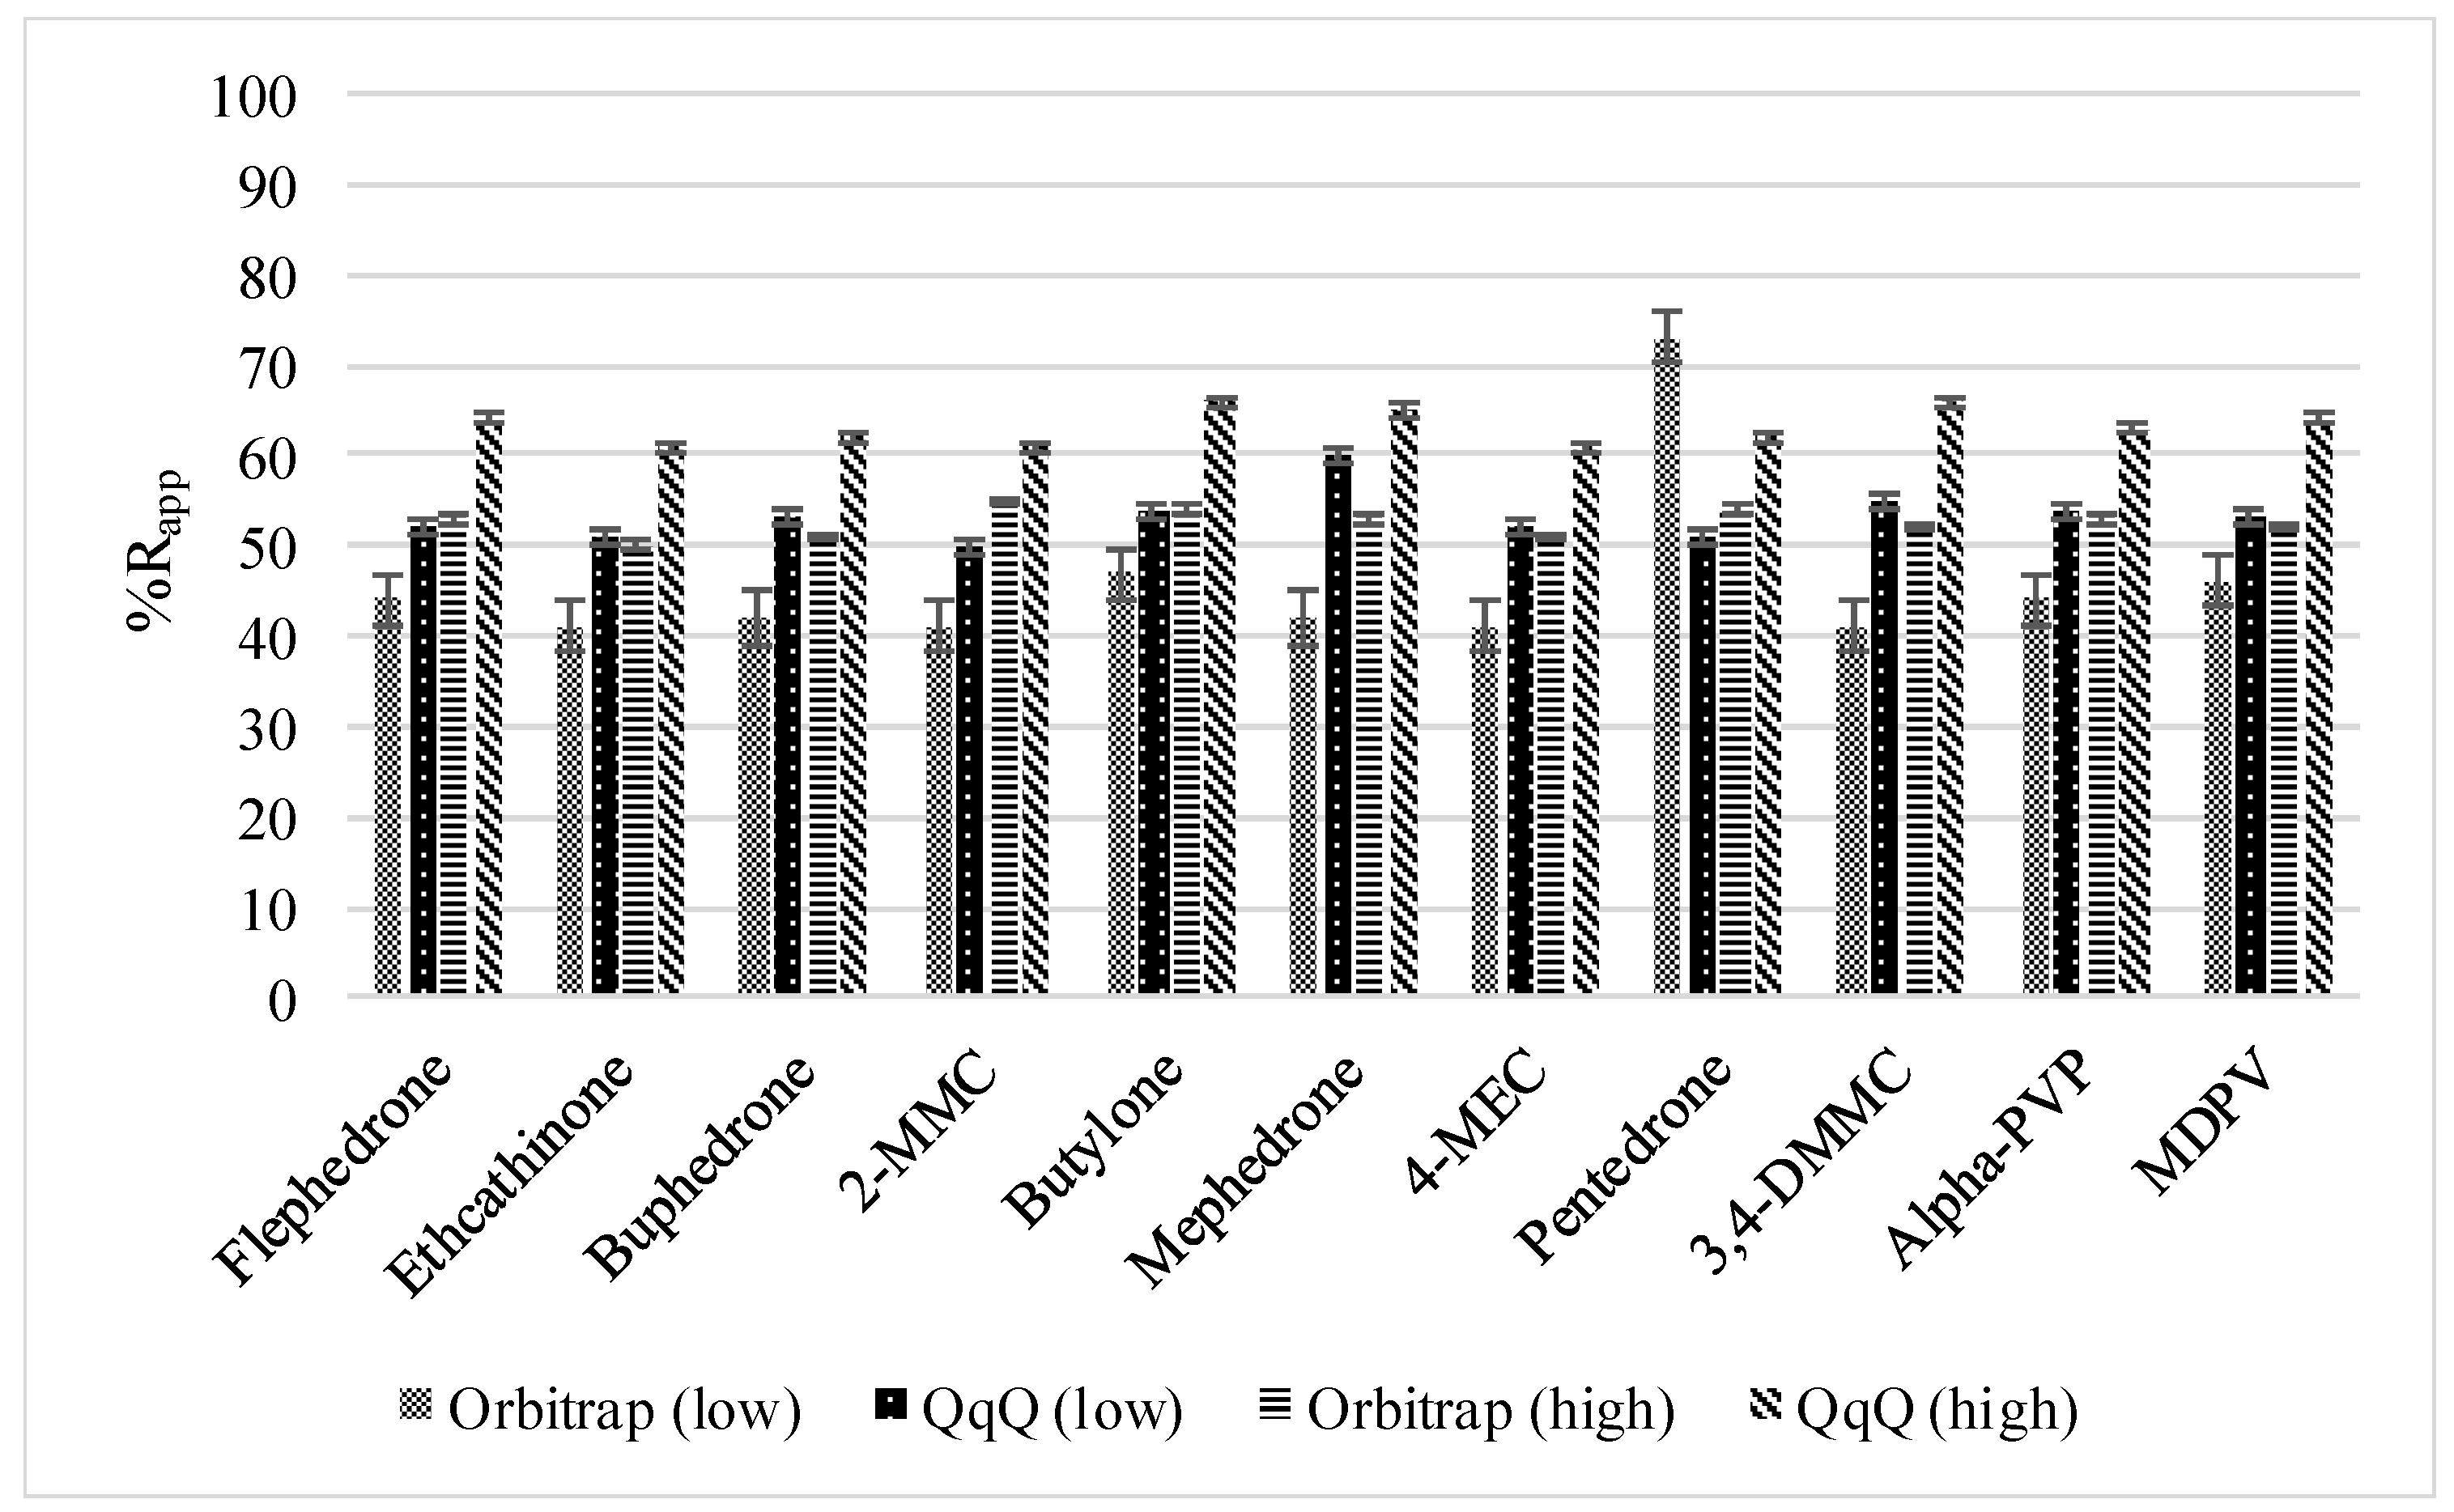
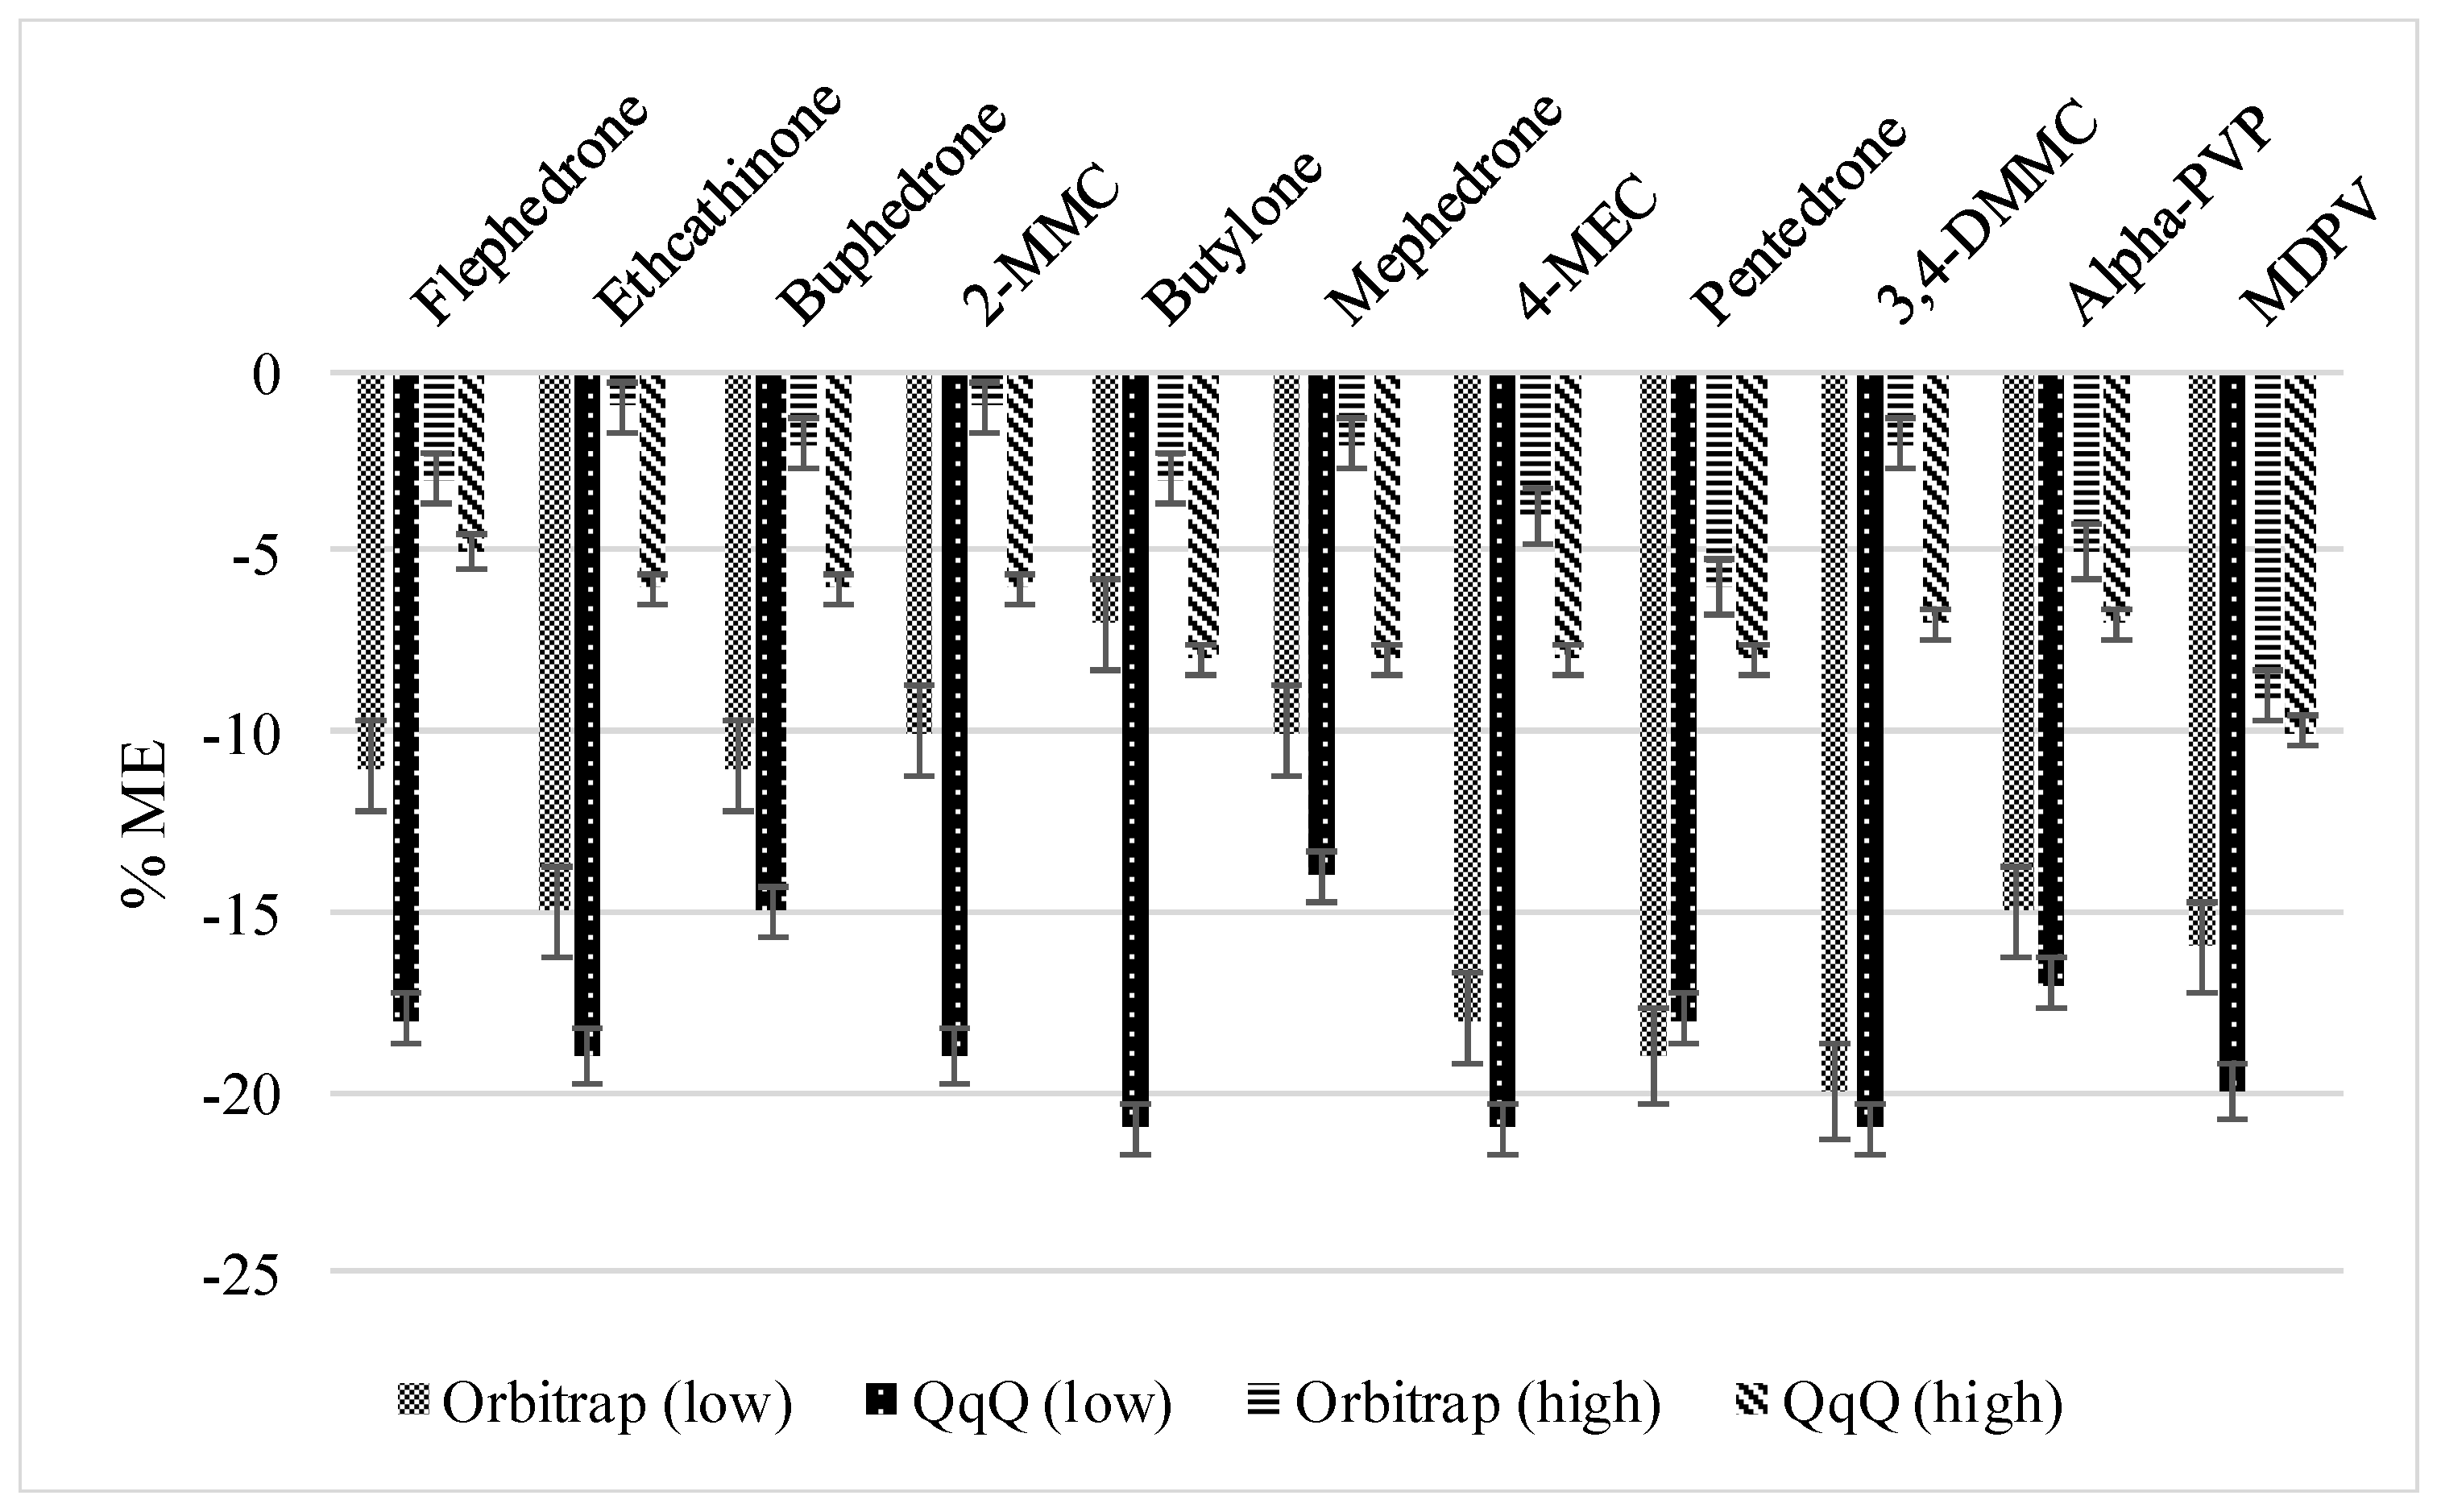
3.2.1. Method Recoveries and Matrix Effects

The %Rapp and ME for the OF samples were also evaluated, as for the urine samples, at the same two concentration levels: 1 ng g−1 and 40 ng g−1. For both MS analyzers higher %Rapp was obtained at the high-concentration level evaluated and higher ME were obtained at the low-concentration level. Rapp at the low level ranged from 41 to 53% for Orbitrap and 50 to 60% for QqQ, while at high levels it ranged from 50 to 55% and from 61 to 66%, respectively (Figure 3). The ME values observed at the low level were between −7 and −20% for Orbitrap and between −14 and −21% for QqQ. ME at the high level ranged from −1 to −9% for Orbitrap and from −5 to −10% for QqQ (Figure 4).
In the same case as urine, a two-way ANOVA was used to compare both detectors in OF. At both levels of concentration, significant differences could be observed, obtaining better results for the LC-QqQ (critical F-value: 4.96; F-obtained: 5.98 at low concentration and critical F-value: 4.96; F-obtained: 265.38 at high concentration).

3.2.2. Linearity, MDLs, and MQLs

Similarly to the urine samples, a matrix-matched calibration curve for the OF samples was used. Table 4 shows the linearity range and MDL and MQL parameters studied for analyzing cathinones in OF. Similar linear ranges were obtained for Orbitrap and QqQ. For QqQ, the calibration curves were adjusted to two linear ranges, from 0.075 to 4 ng and from 4 to 75 ng of cathinone in OF for all the compounds. The Orbitrap calibration curves were also adjusted to the two same linear ranges for most of the compounds except for buphedrone and 4-MEC, which were from 0.100 to 4 ng and from 4 to 75 ng of cathinone in OF. These linear ranges covered all the usual concentrations at which cathinones can be found in OF from drug abusers.
Thus, the MQL, which was considered as the lowest point in the calibration curve, was 0.075 ng g−1 for all the compounds in the case of QqQ. For Orbitrap, they were 0.075 ng g−1 for most of the compounds except for buphedrone and 4-MEC, for which they were 0.100 ng g−1. The MDLs were slightly lower in the case of QqQ, between 0.003 and 0.030 ng g−1, and they were between 0.010 and 0.035 ng g−1 in the case of Orbitrap.
Comparing both the MDLs and MQLs for the two analyzers, lower values were obtained, in general, when LC-MS/MS was used. Therefore, better sensitivity was obtained with this analyzer, despite only slight differences.

3.2.3. Accuracy

To study the accuracy of the method for OF samples, three different blind samples spiked by a member of the laboratory at different concentrations (0.45 ng g−1 (A), 6.2 ng g−1 (B), and 58 ng g−1 (C)) were analyzed with the two methods. The % errors obtained for Orbitrap were 16% (A), 10% (B), and 15% (C), while for QqQ the % errors were 18% (A), 9% (B), and 6% (C). These values were within the acceptable limits according to the guide and are considered excellent results in both cases [36]. The results show that there were no observable differences and in both cases good results were achieved.

4. Conclusions

Two analytical methods for determining synthetic cathinones in urine and OF by LC-HRMS and LC-MS/MS were compared in terms of linearity, MDLs, MQLS, %Rapp, %ME, and accuracy. For both biological samples, better sensitivity was observed in the case of LC-MS/MS and no significant differences were found when %Rapp and %ME were compared. Finally, the two methodologies demonstrated good accuracy values and, although similar values were obtained for urine and OF samples, the latter showed slightly better results for LC-MS/MS. For these reasons, in general terms, we can say that LC-MS/MS can provide better sensitivity and accuracy when synthetic cathinones are determined in urine and OF. Nevertheless, it was also observed that the two methodologies (based on either HRMS or MS/MS) both have good potential for forensic and toxicological analyses. With these methods, low concentrations of these substances can be found in urine and OF samples, which is interesting from the juridical point of view. The developed research can be considered an important starting point to apply the different methods for urine and OF samples in monitoring campaigns, which can be focused in the study of the trends of the cathinone consumption in different regions, and to establish possible relationships between the consumption and the age of the consumers.

Author Contributions

Conceptualization, S.P.-C., F.B., C.A., and M.C.; methodology, S.P.-C.; software, S.P.-C.; validation, S.P.-C., C.A., and M.C.; formal analysis, S.P.-C., C.A., and M.C.; investigation, S.P.-C., C.A., and M.C.; resources, F.B., C.A., and M.C.; data curation, S.P.-C., C.A., and M.C.; writing—original draft preparation, S.P.-C.; writing—review and editing, S.P.-C., C.A., and M.C.; visualization, S.P.-C., C.A., and M.C.; supervision, C.A. and M.C.; project administration, F.B., C.A., and M.C.; funding acquisition, F.B., C.A., and M.C. All authors have read and agreed to the published version of the manuscript.

Funding

This research was funded by the Ministerio de Ciencia, Innovación y Universidades, the Fons Social Europeu, the Iniciativa d’Ocupació Juvenil (PEJ2018-003102-A), and the European Regional Development Fund (ERDF) (Project: CTQ2017-88548-P).

Conflicts of Interest

The authors declare no conflict of interest.

Abbreviations

OF, oral fluid; MS, mass spectrometry; MS/MS, tandem mass spectrometry; HRMS, high-resolution mass spectrometry; QqQ, triple quadrupole; Rapp, apparent recovery; ME, matrix effect; MDL, method detection limits; MQL, method quantification limits.

References

  1. United Nations Office on Drugs and Crime. Global Overview of Drug Demand and Supply. World Drug Report 2019. 2019. Available online: https://www.unodc.org/wdr2018/prelaunch/WDR18_Booklet_2_GLOBAL.pdf (accessed on 17 May 2020).
  2. United Nations Office on Drugs and Crime. World Drug Report 2019. Stimulants; UNITED NATIONS: 2019. Available online: https://www.unodc.org/wdr2018/prelaunch/WDR18_Booklet_3_DRUG_MARKETS.pdf (accessed on 17 May 2020).
  3. Valente, M.J.; Guedes De Pinho, P.; De Lourdes Bastos, M.; Carvalho, F.; Carvalho, M. Khat and synthetic cathinones: A review. Arch. Toxicol. 2014, 88, 15–45. [Google Scholar] [CrossRef]
  4. United Nations Office on Drugs and Crime. Drugs of Abuse 2017 Edition: A DEA Resource Guide. Forensic Toxicol. 2017, 37, 2352–2362. [Google Scholar] [CrossRef] [Green Version]
  5. European Monitoring Centre for Drugs and Drug Addiction EU Drug Markets Report 2019. 2019. Available online: http://www.emcdda.europa.eu/system/files/publications/12078/20192630_TD0319332ENN_PDF.pdf (accessed on 17 May 2020).
  6. Strickland, E.C.; Cummings, O.T.; Mellinger, A.L.; McIntire, G.L. Development and validation of a novel all-inclusive LC–MS-MS designer drug method. J. Anal. Toxicol. 2018, 43, 161–169. [Google Scholar] [CrossRef] [PubMed]
  7. de Castro, A.; Lendoiro, E.; Fernández-Vega, H.; Steinmeyer, S.; López-Rivadulla, M.; Cruz, A. Liquid chromatography tandem mass spectrometry determination of selected synthetic cathinones and two piperazines in oral fluid. Cross reactivity study with an on-site immunoassay device. J. Chromatogr. A 2014, 1374, 93–101. [Google Scholar] [CrossRef] [PubMed]
  8. Strano-Rossi, S.; Anzillotti, L.; Castrignanò, E.; Felli, M.; Serpelloni, G.; Mollica, R.; Chiarotti, M. UHPLC-ESI-MS/MS method for direct analysis of drugs of abuse in oral fluid for DUID assessment. Anal. Bioanal. Chem. 2011, 401, 609–624. [Google Scholar] [CrossRef] [PubMed]
  9. Strano-Rossi, S.; Anzillotti, L.; Castrignanò, E.; Romolo, F.S.; Chiarotti, M. Ultra high performance liquid chromatography-electrospray ionization-tandem mass spectrometry screening method for direct analysis of designer drugs, “spice” and stimulants in oral fluid. J. Chromatogr. A 2012, 1258, 37–42. [Google Scholar] [CrossRef] [PubMed]
  10. Fernández, P.; Regenjo, M.; Ares, A.; Fernández, A.M.; Lorenzo, R.A.; Carro, A.M. Simultaneous determination of 20 drugs of abuse in oral fluid using ultrasound-assisted dispersive liquid–liquid microextraction. Anal. Bioanal. Chem. 2019, 411, 193–203. [Google Scholar] [CrossRef]
  11. Rocchi, R.; Simeoni, M.C.; Montesano, C.; Vannutelli, G.; Curini, R.; Sergi, M.; Compagnone, D.; Simeoni, M.C.; Rocchi, R.; Curini, R.; et al. Analysis of new psychoactive substances in oral fluids by means of microextraction by packed sorbent followed by ultra-high-performance liquid chromatography-tandem mass spectrometry. Drug Test. Anal. 2018, 10, 865–873. [Google Scholar] [CrossRef]
  12. Sorribes-Soriano, A.; Esteve-Turrillas, F.A.; Armenta, S.; Amorós, P.; Herrero-Martínez, J.M. Amphetamine-type stimulants analysis in oral fluid based on molecularly imprinting extraction. Anal. Chim. Acta 2019, 1052, 73–83. [Google Scholar] [CrossRef]
  13. Concheiro, M.; Anizan, S.; Ellefsen, K.; Huestis, M.A. Simultaneous quantification of 28 synthetic cathinones and metabolites in urine by liquid chromatography-high resolution mass spectrometry. Anal. Bioanal. Chem. 2013, 405, 9437–9448. [Google Scholar] [CrossRef]
  14. Concheiro, M.; Castaneto, M.; Kronstrand, R.; Huestis, M.A. Simultaneous determination of 40 novel psychoactive stimulants in urine by liquid chromatography-high resolution mass spectrometry and library matching. J. Chromatogr. A 2015, 1397, 32–42. [Google Scholar] [CrossRef] [PubMed] [Green Version]
  15. Glicksberg, L.; Bryand, K.; Kerrigan, S. Identification and quantification of synthetic cathinones in blood and urine using liquid chromatography-quadrupole/time of flight (LC-Q/TOF) mass spectrometry. J. Chromatogr. B 2016, 1035, 91–103. [Google Scholar] [CrossRef] [PubMed]
  16. Paul, M.; Ippisch, J.; Herrmann, C.; Guber, S.; Schultis, W. Analysis of new designer drugs and common drugs of abuse in urine by a combined targeted and untargeted LC-HR-QTOFMS approach. Anal. Bioanal. Chem. 2014, 406, 4425–4441. [Google Scholar] [CrossRef] [PubMed]
  17. Pascual-Caro, S.; Fontanals, N.; Borrull, F.; Aguilar, C.; Calull, M. Solid-phase extraction based on cation-exchange sorbents followed by liquid chromatography high-resolution mass spectrometry to determine synthetic cathinones in urine. Forensic Toxicol. 2020, 38, 185–194. [Google Scholar] [CrossRef]
  18. Odoardi, S.; Valentini, V.; De Giovanni, N.; Pascali, V.L.; Strano-Rossi, S. High-throughput screening for drugs of abuse and pharmaceutical drugs in hair by liquid-chromatography-high resolution mass spectrometry (LC-HRMS). Microchem. J. 2017, 133, 302–310. [Google Scholar] [CrossRef]
  19. Pascual-Caro, S.; Borrull, F.; Calull, M.; Aguilar, C. A fast analytical method for determining synthetic cathinones in oral fluid by liquid chromatography-tandem mass spectrometry. J. Anal. Toxicol. 2020. accepted. [Google Scholar]
  20. Mercolini, L.; Protti, M.; Catapano, M.C.; Rudge, J.; Sberna, A.E. LC-MS/MS and volumetric absorptive microsampling for quantitative bioanalysis of cathinone analogues in dried urine, plasma and oral fluid samples. J. Pharm. Biomed. Anal. 2016, 123, 186–194. [Google Scholar] [CrossRef]
  21. Substance Abuse and Mental Health Services Administration. Clinical Drug Testing in Primary Care; Lulu.com: Morrisville, NC, USA, 2012. [Google Scholar]
  22. Dinis-Oliveira, R.J.; Vieira, D.N.; Magalhães, T. Guidelines for Collection of Biological Samples for Clinical and Forensic Toxicological Analysis. Forensic Sci. Res. 2016, 1, 42–51. [Google Scholar] [CrossRef] [Green Version]
  23. Hadland, S.E.; Levy, S. Objective testing: Urine and other drug tests. Child Adolesc. Psychiatr. Clin. N. Am. 2016, 25, 549–565. [Google Scholar] [CrossRef] [Green Version]
  24. Wille, S.M.R.; Baumgartner, M.R.; Di Fazio, V.; Samyn, N.; Kraemer, T. Trends in drug testing in oral fluid and hair as alternative matrices. Bioanalysis 2014, 6, 2193–2209. [Google Scholar] [CrossRef]
  25. Øiestad, E.L.; Øiestad, Å.M.L.; Gjelstad, A.; Karinen, R. Oral fluid drug analysis in the age of new psychoactive substances. Bioanalysis 2016, 8, 691–710. [Google Scholar] [CrossRef]
  26. Institóris, L.; Árok, Z.; Seprenyi, K.; Varga, T.; Sára-Klausz, G.; Keller, É.; Tóth, R.A.; Sala, L.; Kereszty, É.; Róna, K. Frequency and structure of stimulant designer drug consumption among suspected drug users in Budapest and South-East Hungary in 2012–2013. Forensic Sci. Int. 2015, 248, 181–186. [Google Scholar] [CrossRef] [PubMed]
  27. Herrero, P.; Cortés-Francisco, N.; Borrull, F.; Caixach, J.; Pocurull, E.; Marcé, R.M. Comparison of triple quadrupole mass spectrometry and Orbitrap high-resolution mass spectrometry in ultrahigh performance liquid chromatography for the determination of veterinary drugs in sewage: Benefits and drawbacks. J. Mass Spectrom. 2014, 49, 585–596. [Google Scholar] [CrossRef] [PubMed]
  28. Henry, H.; Sobhi, H.R.; Scheibner, O.; Bromirski, M.; Nimkar, S.B.; Rochat, B. Comparison between a high-resolution single-stage Orbitrap and a triple quadrupole mass spectrometer for quantitative analyses of drugs. Rapid Commun. Mass Spectrom. 2012, 26, 499–509. [Google Scholar] [CrossRef]
  29. Kaufmann, A.; Butcher, P.; Maden, K.; Walker, S.; Widmer, M. Quantitative and confirmative performance of liquid chromatography coupled to high-resolution mass spectrometry compared to tandem mass spectrometry. Rapid Commun. Mass Spectrom. 2011, 25, 979–992. [Google Scholar] [CrossRef]
  30. Kaufmann, A.; Butcher, P.; Maden, K.; Walker, S.; Widmer, M. Quantification of anthelmintic drug residues in milk and muscle tissues by liquid chromatography coupled to Orbitrap and liquid chromatography coupled to tandem mass spectrometry. Talanta 2011, 85, 991–1000. [Google Scholar] [CrossRef] [PubMed]
  31. Vanhaecke, L.; Van Meulebroek, L.; De Clercq, N.; Vanden Bussche, J. High resolution orbitrap mass spectrometry in comparison with tandem mass spectrometry for confirmation of anabolic steroids in meat. Anal. Chim. Acta 2013, 767, 118–127. [Google Scholar] [CrossRef]
  32. Bruce, S.J.; Rochat, B.; Béguin, A.; Pesse, B.; Guessous, I.; Boulat, O.; Henry, H. Analysis and quantification of vitamin D metabolites in serum by ultra-performance liquid chromatography coupled to tandem mass spectrometry and high-resolution mass spectrometry—A method comparison and validation. Rapid Commun. Mass Spectrom. 2013, 27, 200–206. [Google Scholar] [CrossRef]
  33. De Baere, S.; Osselaere, A.; Devreese, M.; Vanhaecke, L.; De Backer, P.; Croubels, S. Development of a liquid-chromatography tandem mass spectrometry and ultra-high-performance liquid chromatography high-resolution mass spectrometry method for the quantitative determination of zearalenone and its major metabolites in chicken and pig plasma. Anal. Chim. Acta 2012, 756, 37–48. [Google Scholar] [CrossRef]
  34. Gómez-Canela, C.; Cortés-Francisco, N.; Ventura, F.; Caixach, J.; Lacorte, S. Liquid chromatography coupled to tandem mass spectrometry and high resolution mass spectrometry as analytical tools to characterize multi-class cytostatic compounds. J. Chromatogr. A 2013, 1276, 78–94. [Google Scholar] [CrossRef]
  35. Viaene, J.; Lanckmans, K.; Dejaegher, B.; Mangelings, D.; Vander Heyden, Y. Comparison of a triple-quadrupole and a quadrupole time-of-flight mass analyzer to quantify 16 opioids in human plasma. J. Pharm. Biomed. Anal. 2016, 127, 49–59. [Google Scholar] [CrossRef] [PubMed]
  36. Ramanathan, R.; Jemal, M.; Ramagiri, S.; Xia, Y.Q.; Humpreys, W.G.; Olah, T.; Korfmacher, W.A. It is time for a paradigm shift in drug discovery bioanalysis: From SRM to HRMS. J. Mass Spectrom. 2011, 46, 595–601. [Google Scholar] [CrossRef] [PubMed]
  37. Sancho, J.V.; Ibáñez, M. Chapter 10. Multiresidue Analysis of Pesticides: LC–MS/MS versus LC–HRMS. In Fast Liquid Chromatography-Mass Spectrometry Methods in Food and Environmental Analysis; World Scientific: Singapore, 2015; pp. 381–419. [Google Scholar] [CrossRef]
  38. United Nations Office on Drugs and Crime. Laboratory and Scientific Section. Guidance for the Validation of Analytical Methodology and Calibration of Equipment Used for Testing of Illicit Drugs in Seized Materials and Biological Specimens: A Commitment to Quality and Continuous Improvement; United Nations Publications: New York, NY, USA, 2009; ISBN 9789211482430. [Google Scholar]
  39. Brcak, M.; Beck, O.; Bosch, T.; Carmichael, D.; Fucci, N.; George, C.; Piper, M.; Salomone, A.; Schielen, W.; Steinmeyer, S.; et al. European guidelines for workplace drug testing in oral fluid. Drug Test. Anal. 2018, 10, 402–415. [Google Scholar] [CrossRef] [PubMed] [Green Version]
  40. EC/96/23 COMMISSION DECISION of 12 August 2002 Implementing Council Directive 96/23/EC Concerning the Performance of Analytical Methods and the Interpretation of Results. Available online: https://eur-lex.europa.eu/legal-ontent/EN/TXT/PDF/?uri=CELEX:32002D0657&from=EN (accessed on 17 May 2020).
Figure 1. The percentage of apparent recovery (%Rapp) at low (1 ng mL−1) and high (40 ng mL−1) levels of concentrations for Orbitrap and triple quadrupole (QqQ) in the analysis of synthetic cathinones in urine.
Separations 07 00053 g001
Figure 2. The percentage of matrix effect (%ME) at low (1 ng mL−1) and high (40 ng mL−1) levels of concentrations for Orbitrap and QqQ in the analysis of synthetic cathinones in urine.
Separations 07 00053 g002
Figure 3. The %Rapp at low (1 ng g−1) and high (40 ng g−1) levels of concentrations for Orbitrap and QqQ in the analysis of synthetic cathinones in oral fluid (OF).
Separations 07 00053 g003
Figure 4. The %ME at low (1 ng g−1) and high (40 ng g−1) levels of concentrations for Orbitrap and QqQ in the analysis of synthetic cathinones in OF.
Separations 07 00053 g004
Table 1. Retention time, protonated molecule (quantifier), the two fragment ions (qualifier), and the ratios of the studied cathinones by liquid chromatography high-resolution mass spectrometry (LC-HRMS).
Protonated Molecule [M+H]+Fragment
AnalyteRt (min)FormulaAccurate Mass m/zFormulaAccurate Mass m/zRatio
Flephedrone6.17C10H13FNO182.09757C10H11FN164.0875538
C9H8FN149.0640810
Ethcathinone6.29C11H16NO178.12264C11H14N160.1126223
C9H10N132.0813212
Buphedrone7.66C11H16NO178.12264C11H14N160.1126219
C9H9N131.073506
2-MMC8.97C11H16NO178.12264C11H14N160.1126230
C10H11N145.0891516
Butylone9.05C12H16NO3222.11247C11H12NO174.0918914
C12H14NO2204.1024517
Mephedrone9.38C11H16NO178.12264C11H14N160.1126234
C10H11N145.0891514
4-MEC10.58C12H18NO192.13829C12H16N174.1282730
C10H11N145.089159
Pentedrone10.98C12H18NO192.13829C12H16N174.1282716
C9H10N132.0813210
3,4-DMMC11.66C12H18NO192.13829C12H16N174.1282737
C11H13N159.1048012
Alpha-PVP12.21C15H22NO232.16959C7H791.0547815
C7H5O105.034045
MDPV12.58C16H22NO3276.15942C8H16N126.128278
C8H7O2135.044619
Table 2. Retention time, fragmentor, precursor, product ions (the quantifier ion is underlined), ion ratios, and collision energies of the studied cathinones by LC-MS/MS.
AnalyteRt (min)Fragmentor (V)Precursor IonProduct IonCE (eV)Ion Ratio
Flephedrone6.53100182.116415
1491570
1231521
Ethcathinone6.62100178.116012
1321493
1051839
Buphedrone8.29100178.116010
1311555
1321552
2-MMC9.98100178.11608
1451571
1191511
Butylone10.26100222.117414
20410101
1911023
Mephedrone10.48100178.11608
1451561
1191512
4-MEC11.81100192.117410
1461621
1451824
Pentedrone12.25100192.117410
1321649
911824
3,4-DMMC13.02125192.117410
1591557
133157
Alpha-PVP13.50125232.29122
1052542
1262541
MDPV13.96125276.212625
1352567
1752052
Table 3. Linearity, method detection limits (MDLs) and method quantification limits (MQLs) for Orbitrap and QqQ in ng mL−1 for the determination of synthetic cathinones in urine.
MDL OrbitrapMDL QqQMQL OrbitrapMQL QqQLinear Range OrbitrapLinear Range QqQ
Flephedrone0.0800.0250.2000.0500.200–4⋯4–2000.050–4⋯4–200
Ethcathinone0.1000.0300.0500.0500.050–4⋯4–2000.050–4⋯4–200
Buphedrone0.1000.0350.2000.0500.200–4⋯4–2000.050–4⋯4–200
2-MMC0.1000.0250.0500.0500.050–4⋯4–2000.050–4⋯4–200
Butylone0.1200.0300.0500.0500.050–4⋯4–2000.050–4⋯4–200
Mephedrone0.0800.0050.0500.0300.050–4⋯4–2000.030–4⋯4–200
4-MEC0.0400.0100.2000.0300.200–4⋯4–2000.030–4⋯4–200
Pentedrone0.0400.0250.0500.0300.050–4⋯4–2000.030–4⋯4–200
3,4-DMMC0.0400.0100.0500.0300.050–4⋯4–2000.030–4⋯4–200
Alpha-PVP0.1600.0050.0500.0200.050–4⋯4–2000.020–4⋯4–200
MDPV0.0600.0050.0500.0300.050–4⋯4–2000.030–4⋯4–200
Table 4. Linearity in ng of cathinones, MDLs, and MQLs in ng g−1 for Orbitrap and QqQ for the determination of synthetic cathinones in OF.
MDL OrbitrapMDL QqQMQL OrbitrapMQL QqQLinear Range OrbitrapLinear Range QqQ
Flephedrone0.0200.0100.0750.0750.075–4⋯4–750.075–4⋯4–75
Ethcathinone0.0350.0300.0750.0750.075–4⋯4–750.075–4⋯4–75
Buphedrone0.0250.0300.1000.0750.100–4⋯4–750.075–4⋯4–75
2-MMC0.0150.0150.0750.0750.075–4⋯4–750.075–4⋯4–75
Butylone0.0200.0100.0750.0750.075–4⋯4–750.075–4⋯4–75
Mephedrone0.0100.0100.0750.0750.075–4⋯4–750.075–4⋯4–75
4-MEC0.0250.0200.1000.0750.100–4⋯4–750.075–4⋯4–75
Pentedrone0.0200.0200.0750.0750.075–4⋯4–750.075–4⋯4–75
3,4-DMMC0.0150.0100.0750.0750.075–4⋯4–750.075–4⋯4–75
Alpha-PVP0.0100.0050.0750.0750.075–4⋯4–750.075 –4⋯4–75
MDPV0.0150.0030.0750.0750.075–4⋯4–750.075–4⋯4–75

