Article

Highly Informative Fingerprinting of Extra-Virgin Olive Oil Volatiles: The Role of High Concentration-Capacity Sampling in Combination with Comprehensive Two-Dimensional Gas Chromatography

Dipartimento di Scienza e Tecnologia del Farmaco, Università di Torino, Via Pietro Giuria 9, I-10125 Turin, Italy
*
Author to whom correspondence should be addressed.
Separations 2019, 6(3), 34; https://doi.org/10.3390/separations6030034
Submission received: 25 June 2019 / Revised: 10 July 2019 / Accepted: 11 July 2019 / Published: 15 July 2019
(This article belongs to the Special Issue Chromatography and Chemometrics)

Abstract

:
The study explores the complex volatile fraction of extra-virgin olive oil by combining high concentration-capacity headspace approaches with comprehensive two-dimensional gas chromatography, which is coupled with time of flight mass spectrometry. The static headspace techniques in this study are: (a) Solid-phase microextraction, with multi-polymer coating (SPME- Divinylbenzene/Carboxen/Polydimethylsiloxane), which is taken as the reference technique; (b) headspace sorptive extraction (HSSE) with either a single-material coating (polydimethylsiloxane—PDMS) or a dual-phase coating that combines PDMS/Carbopack and PDMS/EG (ethyleneglycol); (c) monolithic material sorptive extraction (MMSE), using octa-decyl silica combined with graphite carbon (ODS/CB); and dynamic headspace (d) with either PDMS foam, operating in partition mode, or Tenax TA™, operating in adsorption mode. The coverage of both targeted and untargeted 2D-peak-region features, which corresponds to detectable analytes, was examined, while concentration factors (CF) for a selection of informative analytes, including key-odorants and off-odors, and homolog-series relative ratios were calculated and the information capacity was discussed. The results highlighted the differences in concentration capacities, which were mainly caused by polymer-accumulation characteristics (sorptive/adsorptive materials) and its amount. The relative concentration capacity for homologues and potent odorants was also discussed, while headspace linearity and the relative distribution of analytes, as a function of different sampling amounts, was examined. This last point is of particular interest in quantitative studies where accurate data is needed to derive consistent conclusions.

Graphical Abstract

1. Introduction

Comprehensive two-dimensional gas chromatography (GC × GC) is a multidimensional separation technique that enables the in-depth chemical characterization of the complex food volatilome [1]. It combines, in a single analytical platform, two separation dimensions with mass spectrometry, i.e., an orthogonal measurement principle that is fundamental for analyte identification and quantitation, and automated sample preparation. Such configured platforms deliver highly efficient profiling (detailed investigation of single molecular entities) with the intrinsic fingerprinting potential, and can provide accurate and informative cross-comparative analyses [1].
The chemical characterization of the olive-oil volatilome is a challenging, although fundamental, task that is part of the quality assessment process. The composition of the volatile fraction, also referred to as the chemical signature, is an informative and diagnostic tool for oil quality characterization and sensory qualification [2,3,4,5]. Only a few of the considerable number of detectable volatiles are responsible for the positive and negative attributes that delineate olive oil sensory profiles. In fact, olive oil is, to date, the only food product whose sensory attributes are officially regulated by EU legislation, and standardized sensory assessment protocols [6,7], in the form of smelling and tasting experiments, are run by constantly updated and trained panelists. Virgin olive oil is classified into three categories, extra-virgin (EV), virgin (V), and lampante oil, according to the presence/absence and the intensity of coded defects (i.e., fusty/muddy sediment, musty/humid/earthy, winey/vinegary, rancid) and the perception of the “fruity” taste.
Improved separation power and detection sensitivity are needed to efficiently extract information on the presence of potent odorants, sometimes at trace and ultra-trace concentration levels. These features, if accompanied by a structured logic of elution for chemically correlated compounds, can provide highly confident and accurate chemical characterizations, while offering new perspectives to the important problems of quality and authenticity assessment [8].
GC × GC has been adopted to characterize the olive-oil volatilome in studies that aim to define the volatile signatures of olives that differed in terms of variety, origin, and process technology [9,10,11] using both targeted and targeted/untargeted analyte distributions. A significant step ahead was made by Purcaro et al. [2], who explored the 2D-patterns of volatiles, after headspace solid-phase microextraction (HS-SPME) sampling, to delineate the coded defects in the chemical signature of the oil (i.e., blueprint). Olive ripening and its impact on volatiles distribution and oil quality has been studied by Magagna et al. [12], who also introduced a systematic strategy for efficient untargeted and targeted investigations, which was based on pattern recognition by template matching; the strategy was defined as combined untargeted/targeted (UT) fingerprinting and has been recently extended to several other applications in the fields of food [13,14,15], and nutrimetabolomics [16].
All of the above-referenced studies have exploited HS-SPME as a sampling strategy; it combines the advantages of gas-phase extraction approaches with the possibility of achieving suitable enrichment factors that match method-sensitivity requirements [17,18,19,20,21,22]. However, as the zeroth dimension of an analytical process [23], HS-SPME, and more generally any sampling procedure, may impact on method information potential by discriminating analytes in function of one of their specific characteristics (polarity, volatility, etc.). If the focus of the investigation is potent odorants, the ideal sampling system should comply for: (a) Appropriate/tunable extraction selectivity; (b) high extraction efficiency toward ultra-trace analytes with high odor potency; (c) mild interaction mechanisms (sorption/partition is preferable) that limit the formation of artifacts that may be induced during the thermo-desorption of volatiles at high temperatures; and (d) the full integration of all operation steps in the analytical system [19,20,24].
In this context, it would be interesting to compare the effectiveness of a number of gas-phase extraction procedures, more specifically headspace-sampling approaches, in delineating informative volatile patterns in extra-virgin olive oil. In fact, conventional SPME can show limited extraction capability for ultra-trace odorant analysis and/or suffer from headspace saturation [25], towards major HS components. Interesting solutions to enhance the sensitivity of the HS-SPME method have been presented by Chin et al. [26], who proposed that cumulative multiple HS-SPME samplings be used in combination with a number of different fiber coatings, and followed by successive GC injections, which are delayed over time to achieve odor detection limits for GC-olfactometry (GC-O) screenings of wine aroma. More recently, Oliver-Pozo et al. [25] have developed a dynamic headspace (DHS) sampling system that enables volatiles to be accumulated in SPME fibers, while also providing higher enrichment factors than the static headspace (SHS) approach and better aldehyde and alcohol recovery. The above-mentioned methods unfortunately have some limitations, such as automation difficulties and, in the case of GC-O screenings, the fact that replicate analyses and dilution experiments are not possible.
In this scenario, a systematic investigation of the different and complementary HS sampling methods, combined with high-resolution fingerprinting by GC × GC coupled to time-of-flight mass spectrometry (TOF MS), would be of great interest, especially when the fingerprinting includes key-odorants that are responsible for the positive and negative sensory attributes of olive oil.
In this study, a selection of HS approaches has been used to study the complex volatilome of a commercial EV olive oil. They include enriched SHS with: (a) SPME with a multi-polymer coating (divinylbenzene/carboxen/polydimethylsiloxane—DVB/CAR/PDMS), taken as the reference technique; (b) headspace sorptive extraction (HSSE) either with a single-material coating (PDMS) or dual-phase coating that combines PDMS/Carbopack [27] and PDMS/EG [28] (ethyleneglycol); (c) monolithic material sorptive extraction (MMSE) by octa-decyl silica combined with graphite carbon (ODS/CB); and (d) D-HS, with either PDMS foam, operating in partition mode, or Tenax TA™, operating in adsorption mode.
The coverage of both targeted and untargeted peak-region features that correspond to detectable analytes has been examined, while concentration factors (CF) have been calculated for a selection of informative analytes, including key-odorants and off-odors. Homolog-series relative ratios have also been calculated and information capacity has been discussed.

2. Materials and Methods

2.1. Reference Compounds and Samples

The pure reference compounds for the confirmation of the identity of potent odorants, n-alkanes (n-C9 to n-C25) for linear retention index (IT) determination, and the reference compounds for internal standardization, α- and β-thujone, for SPME (see below), were obtained from Sigma-Aldrich (Milan, Italy). Pure dibutyl phthalate was used for internal standard (IS) working-solution preparation (0.1 g/L) and was purchased from Merck (Milan, Italy).
A commercial sample of extra virgin olive oil was selected from those collected as part of the Italian “Violin” Project (valorization of Italian olive products through innovative analytical tools—AGER Fondazioni in rete per la Ricerca Agroalimentare). In particular, the olive oil used was an EV olive oil with a protected geographical indication (PGI) quality label from Azienda Agricola Mori Concetta, PGI Toscano, olives Mariolo cultivar (San Casciano in Val di Pesa, Firenze, Italy).
A reference oil from International Olive Council (IOC) for the fusty/muddy defect was kindly supplied by Prof. Lanfranco Conte from the University of Udine.

2.2. Sample Preparation

2.2.1. Automated Headspace Solid Phase Microextraction

Automated HS-SPME was performed using a MPS-2 multipurpose sampler (Gerstel, Mülheim a/d Ruhr, Germany) installed on the GC × GC-TOF MS system. SPME fibers were obtained from Supelco (Bellefonte, PA, USA) and consisted of divinylbenzene/carboxen/polydimethylsiloxane—DVB/PDMS/CAR df 50/30 μm–2 cm. Fibers were conditioned before use, as recommended by the manufacturer. Sampling conditions and thermal desorption parameters are summarized in Table 1.

2.2.2. Headspace Sorptive Extraction

HSSE sampling was performed using commercial Twister™ devices. 100% PDMS df 500 μm 1 cm and 2 cm long twisters, as well as EG/Silicone (PDMS/EG copolymer) twisters were supplied by Gerstel (Mülheim a/d Ruhr, Germany). PDMS-Carbopack B™ df 500 μm–2 cm Dual Phase (DP) twisters were obtained from the Research Institute for Chromatography—RIC (Kortrijk, Belgium). Sampling was carried out in a thermostatic bath with constant stirring; HSSE twisters were suspended in the vapor phase with a stainless steel wire, and volatiles were thus transferred to GC × GC-TOF MS by a MPS-2 multipurpose sampler (Gerstel, Mülheim a/d Ruhr, Germany) equipped with a Thermo Desorption Unit (TDU) and a CIS-4 PTV injector (Gerstel, Mülheim a/d Ruhr, Germany). Sampling conditions and thermal desorption parameters are reported in Table 1.

2.2.3. Monolithic Material Sorptive Extraction

MMSE sampling was performed using commercial devices, named MonoTrap™ (GL Sciences, Tokyo, Japan), in the form of monolithic rods consisting of a combination of octa-decyl silica and graphite carbon (ODS/GC). Sampling was carried out in a thermostatic bath with constant stirring; MonoTraps were suspended in the vapor phase with the stainless steel wire supplied by the manufacturer, and volatiles were thus transferred to GC × GC-TOF MS by a MPS-2 multipurpose sampler (Gerstel, Mülheim a/d Ruhr, Germany) equipped with a Thermo Desorption Unit (TDU) and a CIS-4 PTV injector (Gerstel, Mülheim a/d Ruhr, Germany). Sampling conditions and thermal desorption parameters are reported in Table 1.

2.2.4. Dynamic Headspace Sampling

Dynamic headspace sampling was performed using traps assembled in the authors’ laboratory. They consisted of (a) 50 mg (±2) of Tenax TA™—60/80 meshes from Supelco (Bellefonte, PA, USA) and (b) 100% PDMS foams (15 mm length—30 mg ± 2) supplied by Gerstel (Mülheim a/d Ruhr, Germany). Packing materials were assembled on inert, single taper, glass liners for the TDU unit.
During sampling, traps were gas-tight connected to the outlet of a 20 mL sampling vial kept at 40 °C, and analytes were stripped with nitrogen at 10 mL/min for 20 min (200 mL of total volume). Traps were maintained at room temperature during sampling to increase extraction efficiency. Sampling conditions and thermal desorption parameters are given in Table 1.

2.3. GC × GC-MS Instrument Set-Up and Analytical Conditions

GC × GC analyses were performed on an Agilent 7890B GC unit coupled with a Bench TOF-Select™ system (Markes International, Llantrisant, UK) featuring Tandem Ionization™. The ion source and transfer line were set at 270 °C. The MS optimization option was set to operate in single ionization mode with a mass range between 40 and 300 m/z; the data-acquisition frequency was 100 Hz; filament voltage was set at 1.60 V. Electron ionization 70 eV.
The system was equipped with a two-stage KT 2004 loop thermal modulator (Zoex Corporation, Houston, TX, USA) cooled with liquid nitrogen, and controlled by Optimode™ V.2 (SRA Instruments, Cernusco sul Naviglio, MI, Italy). The hot-jet pulse time was set at 250 ms, the modulation period (PM) was 4 s, and cold-jet total flow was progressively reduced as a linear function, from 40% of the mass flow controller (MFC), at initial conditions, to 8% at the end of the run.
The column set was configured as follows: 1D SolGel-Wax column (100% polyethylene glycol; 30 m × 0.25 mm dc, 0.25 μm df) from SGE Analytical Science (Ringwood, Australia) coupled with a 2D OV1701 column (86% polydimethylsiloxane, 7% phenyl, 7% cyanopropyl; 2 m × 0.1 mm dc, 0.10 μm df), from J&W (Agilent, Little Falls, DE, USA). The two columns were connected in series by a μ-union (SGE Analytical Science) and the first meter of the capillary was wrapped in the modulator slit acting as modulator capillary (i.e., the loop capillary). Columns were placed in the same oven and no temperature offset was applied to the two dimensions. The carrier gas was helium at a constant flow of 1.3 mL/min. The oven temperature program was from 40 °C (2 min) to 240 °C at 3.5 °C/min (10 min).
The n-alkanes liquid sample solution for ITS determination was analyzed under the following conditions: Split/splitless injector in split mode, split ratio 1:50, injector temperature 250 °C, and injection volume 1 µL.

2.4. Analyte Identification

Analytes were identified on the basis of their linear retention indices (IT) and MS electron impact (MS-EI) spectra that were either compared to those of authentic standards (where available) or tentatively identified through their EI-MS fragmentation patterns and IT. The list of targeted analytes is reported in Table 2 together with their retention times (1tR, 2tR), IT, odor qualities, and odor thresholds, as reported in reference literature, and their correlation with coded defects [2].

2.5. Method-Performance Parameters

A simple validation protocol was designed to establish method performance in terms of precision for quantitative descriptors (i.e., 2D peak volumes measured on analytes target ion—Ti). This protocol included experiments on HS-SPME with DVB/CAR/PDMS (SPME-TRIF), HSSE with 100% PDMS Twister™ (HSSE-TW1), and DHS sampling with PDMS foams (DHS-PDMS). Precision data (intra and inter-week precision on retention times and 2D peak volumes on selected odorants Ti), were evaluated by replicating analyses (six replicates) over a period of three weeks. Results are reported as Supplementary Material—Supplementary Table S1 (ST1) and are expressed as percentage relative standard deviation (RSD%).

2.6. Raw Data Acquisition and GC × GC Data Handling

Data were acquired using TOF-DS software (Markes International, Llantrisant, UK) and processed using GC Image ver 2.8 (GC Image, LLC, Lincoln, NE, USA). Statistical analyses were performed using XLStat (Addinsoft, Paris, France).

3. Results and Discussion

This study aimed to evaluate how sample preparation can impact upon the high resolution fingerprinting of the olive-oil volatilome when GC × GC-TOF MS is exploited for both its untargeted and targeted investigation potential. The oil volatilome has been chosen as the model here because of its chemical complexity, also referred to as chemical dimensionality [29], and the high informational density it brings to oil-quality characterization and sensory evaluation.
The performance of the different sample preparation approaches are evaluated by considering untargeted and targeted peak-region features using the UT fingerprinting strategy, while a focus on some odor-active compounds is also discussed in view of their relevant roles in delineating olive-oil aroma.
The next paragraph will introduce the olive-oil volatilome by illustrating 2D-peak patterns as they result from a polar × medium-polarity column combination.

3.1. Extra-Virgin Olive Oil Complex Volatilome by GC × GC Fingerprinting

The chemical complexity of the olive-oil volatilome can be effectively described by the concept defined by Giddings, known as chemical dimensionality [29], which was introduced to describe the degree of order/disorder that can be achieved in multidimensional separations. Volatiles in olive oil are generated from multiple chemical reactions, mainly promoted by endogenous or exogenous enzymes, that occur in olive primary metabolites during fruit ripening and, later, in post-harvest and processing stages. In addition, storage and shelf-life may add additional complexity, resulting in thousands of volatiles that belong to different chemical classes and differ in their polarity, volatility and concentration.
High resolution separations and orthogonal detection by mass spectrometry are fundamental for the accurate fingerprinting of volatiles. In addition, the possibility of obtaining structured separation patterns for chemically correlated compounds is of great help; analyte identification can be confirmed by observing analyte relative elution, while for unknowns, information about their relative polarity and volatility can be reliably hypothesized because of the multiple retention mechanisms used by the technique. Figure 1A shows the 2D pattern of the PGI Toscano EV oil, which was taken as a reference sample for the study. The number of detectable 2D-peaks, over a signal-to-noise ratio (SNR) threshold of 50, is about 1500, and reliable identification was possible for 114 of them by matching 1D IT and MS spectra with those collected in commercial and in-house databases [30,31].
Of the most important classes of informative volatiles, compounds formed from lipoperoxide cleavage, also referred to as the lipoxygenase (LOX) signature (Figure 1B), are fundamental for the definition of fresh-green and fruity notes, which are considered positive attributes. Of the C6 unsaturated alcohols and aldehydes, hexanal was connoted by green apple and grassy notes, (Z)-3-hexenal had green and grassy odor, (E)-2-hexenal was described as bitter almond and green, (Z)-3-hexenol and (E)-3-hexenol had both green notes, (E)-2-hexenol evokes green grass and leaf odors, while (E,Z)-2,4-hexadienal had a green odor. All of these compounds were formed from linoleic and linolenic acid oxidative cleavage, as promoted by lipoxygenase (LOX) and hydroperoxide lyase (HPL) pathways [32].
Figure 1C illustrates the homologous series of linear saturated and unsaturated aldehydes, together with a few ketones that were most likely formed by non-enzymatic hydroperoxide cleavage. This last group of analytes generally provides information on shelf-life evolution [33]; increasing concentrations of potent odorants of this class bring rancid and fatty notes. Heptanal, octanal, and nonanal, although possessing different odor potencies, had fatty and waxy notes, decanal and undecanal were described as waxy and fatty, while the series of (E)-2-unsaturated aldehydes (i.e., from (E)-2-heptenal to (E)-2-Decenal) had odors that evoked apple and green leaf, up to fatty and tallowy notes for the higher homologues.
The enlarged area of Figure 1D shows the retention region of a group of branched unsaturated hydrocarbons, eluting later in the 2D. They were identified by Angerosa et al. [34] in olives at early stages of ripening. They were 3,4-diethyl-1,5-hexadiene (RS + SR), 3,4-diethyl-1,5-hexadiene (meso), (5Z) and (5E)-3-Ethyl-1,5-octadiene, (E,Z)- and (E,E)-3,7-decadiene and (E)-4,8-Dimethyl- 1,3,7-nonatriene [12,34].
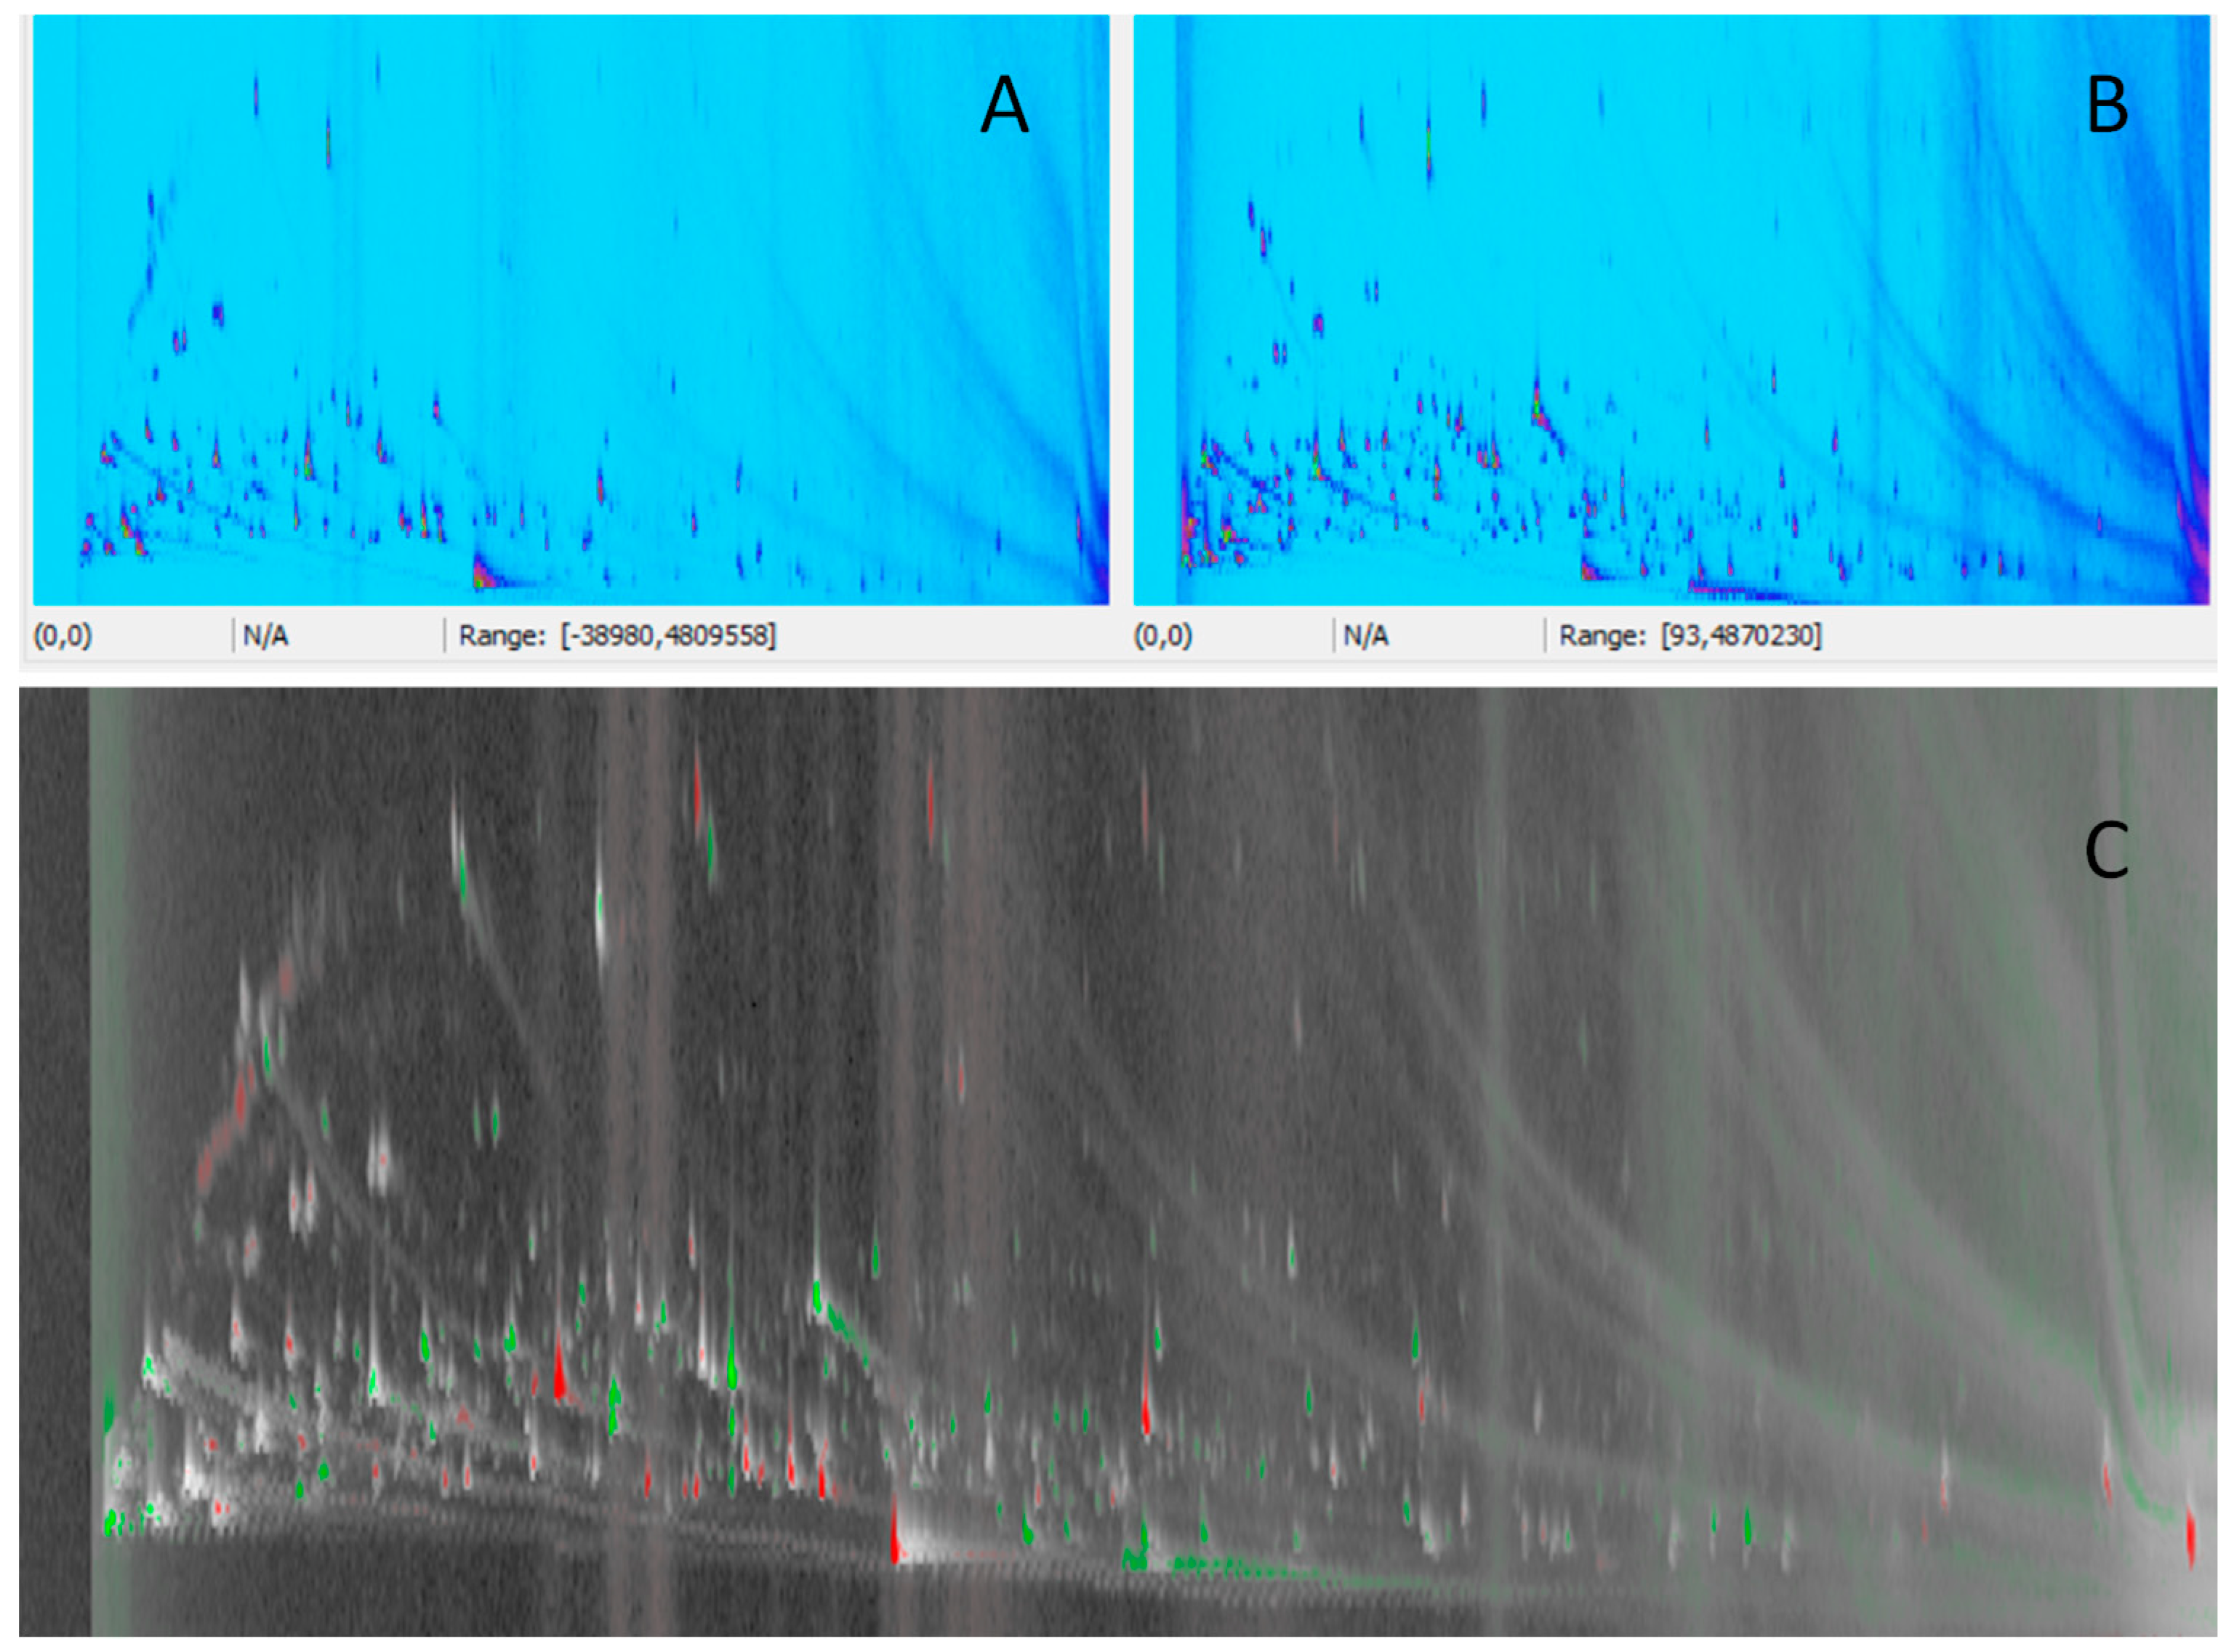
This chemical complexity can also be explored by simple datapoint feature fingerprinting [35]; this pointwise approach, also explored by Vaz-Freire et al. [9] in a study focused on olive oils from different cultivars, enables point-by-point, or pixel-by-pixel, chromatogram comparisons to be performed. In a GC × GC-TOF MS chromatogram, every datapoint corresponded to a detector event, i.e., a single MS spectrum. Features located at the same retention times in a pair of chromatograms were implicitly matched using this approach. Figure 2 shows the 2D-patterns of the analyzed EV olive oil (Figure 2A), and of a reference oil from IOC for the fusty/muddy defect (Figure 2B). The comparative visualization was rendered as the colorized fuzzy ratio in Figure 2C, and analyte relative abundance in the two samples was highlighted by color-coding (green, red, and light-grey). In this specific pair-wise comparison, performed on the normalized total ion current (TIC) response to the smooth concentration effect, several compounds were present in a higher relative ratio in the analyzed sample (e.g., fusty/muddy oil). They were 2,3-butanediol, 2-butenal, 3-methyl-1-butanol acetate, 3,4-dimethyl-2-hexanone, 2-heptanone, heptanal, 6-methyl-5-hepten-2-one, nonanal, propanoic acid, butanoic acid, 3-methyl butanoic acid, and pentanoic acid. On the other hand, red colored datapoints correspond to compounds that were more abundant in the reference sample (e.g., EV oil). They were 2-methyl-1-butanol, (E)-2-hexenal, (Z)-3-hexenol, hexanol, (E)-2-hexenol, acetic acid, and dodecanol.
This last approach is a clear example of how high-resolution bi-dimensional separation can effectively compare sample patterns and give prompt results on compositional differences. The same approach, performed on 1D-GC profiles, would fail for minor components or for those affected by co-elution issues, although it would be effective for more highly abundant peaks/components.
The next paragraph will discuss the results of the differential information provided by the explored sampling approaches, which are based on untargeted peak-region distribution.

3.2. Sampling Information Potentials Based on Untargeted Data

Smart-template-concept based pattern recognition [36], was used to study sampling effectiveness and 2D-pattern information potential. The template corresponds to the pattern of 2D-peaks and/or their corresponding graphic objects created over the 2D-peak contour of a reference image(s) (single or composite image) [16]. This template is then used to recognize similar peak patterns in an analyzed image(s) [37]. Template objects (2D-peak and/or graphic) carry various metadata such as retention times, IT, mass spectrum, compound name, compound group, informative ions and their relative ratios, additional constraint functions, and qualifier functions. Typical constraint functions are those that limit positive correspondence to analytes that show an MS-fragmentation pattern similarity above a fixed threshold, while qualifier functions may provide information about quality indicators, as calculated via scripts that are developed ad hoc. These functions enable highly specific cross-comparison of data, providing 2D-peak re-alignment across samples with high consistency.
Peak-region features, introduced by Reichenbach and co-workers [38,39], are template objects that give considerable assistance in compensating for temporal inconsistencies, detector fluctuations and highly variable sample compositions. They provide greater robustness than peak-features methods, while offering all the advantages of one-feature-to-one-analyte selectivity. The combination of both, 2D-peaks and peak-regions was adopted for combined untargeted and targeted fingerprinting—UT fingerprinting strategy [5,12,13,16].
In UT fingerprinting, a group of reliable peaks, which positively match across all or most chromatograms in a set [40], is established and then used to re-align chromatograms [41], before their combination into a single-composite chromatogram. The composite chromatogram corresponds to the sum of the re-aligned datapoint responses in the 2D retention-time plane. It can therefore be treated as a regular 2D-chromatogram for peak detection and metadata extraction. The sub-set of reliable 2D-peaks and all the peak-regions extracted by peak outlines in the composite chromatogram are collected in a feature template, or consensus template, which covers the chemical dimensionality of the whole sample-set, and that is capable of capturing chemical variability with high specificity. The subset of known compounds can be completed from all detected analytes by filling their metadata fields (compound name, ion ratios, IT); this subset—reported in Table 2—can be separately processed for the interpretation of results.
A schematic of the UT fingerprinting process is illustrated in Supplementary Material—Supplementary Figure S1 together with some details on targeted and untargeted 2D peaks and peak-regions.
In this specific application, UT fingerprinting is extremely useful since it enables a consistent re-alignment of detected features (UT peaks) when different sampling approaches are applied. In this context, the cross-comparative analysis aims at revealing 2D-pattern differences brought by the extraction techniques rather than those related to the different composition of a selection of samples.
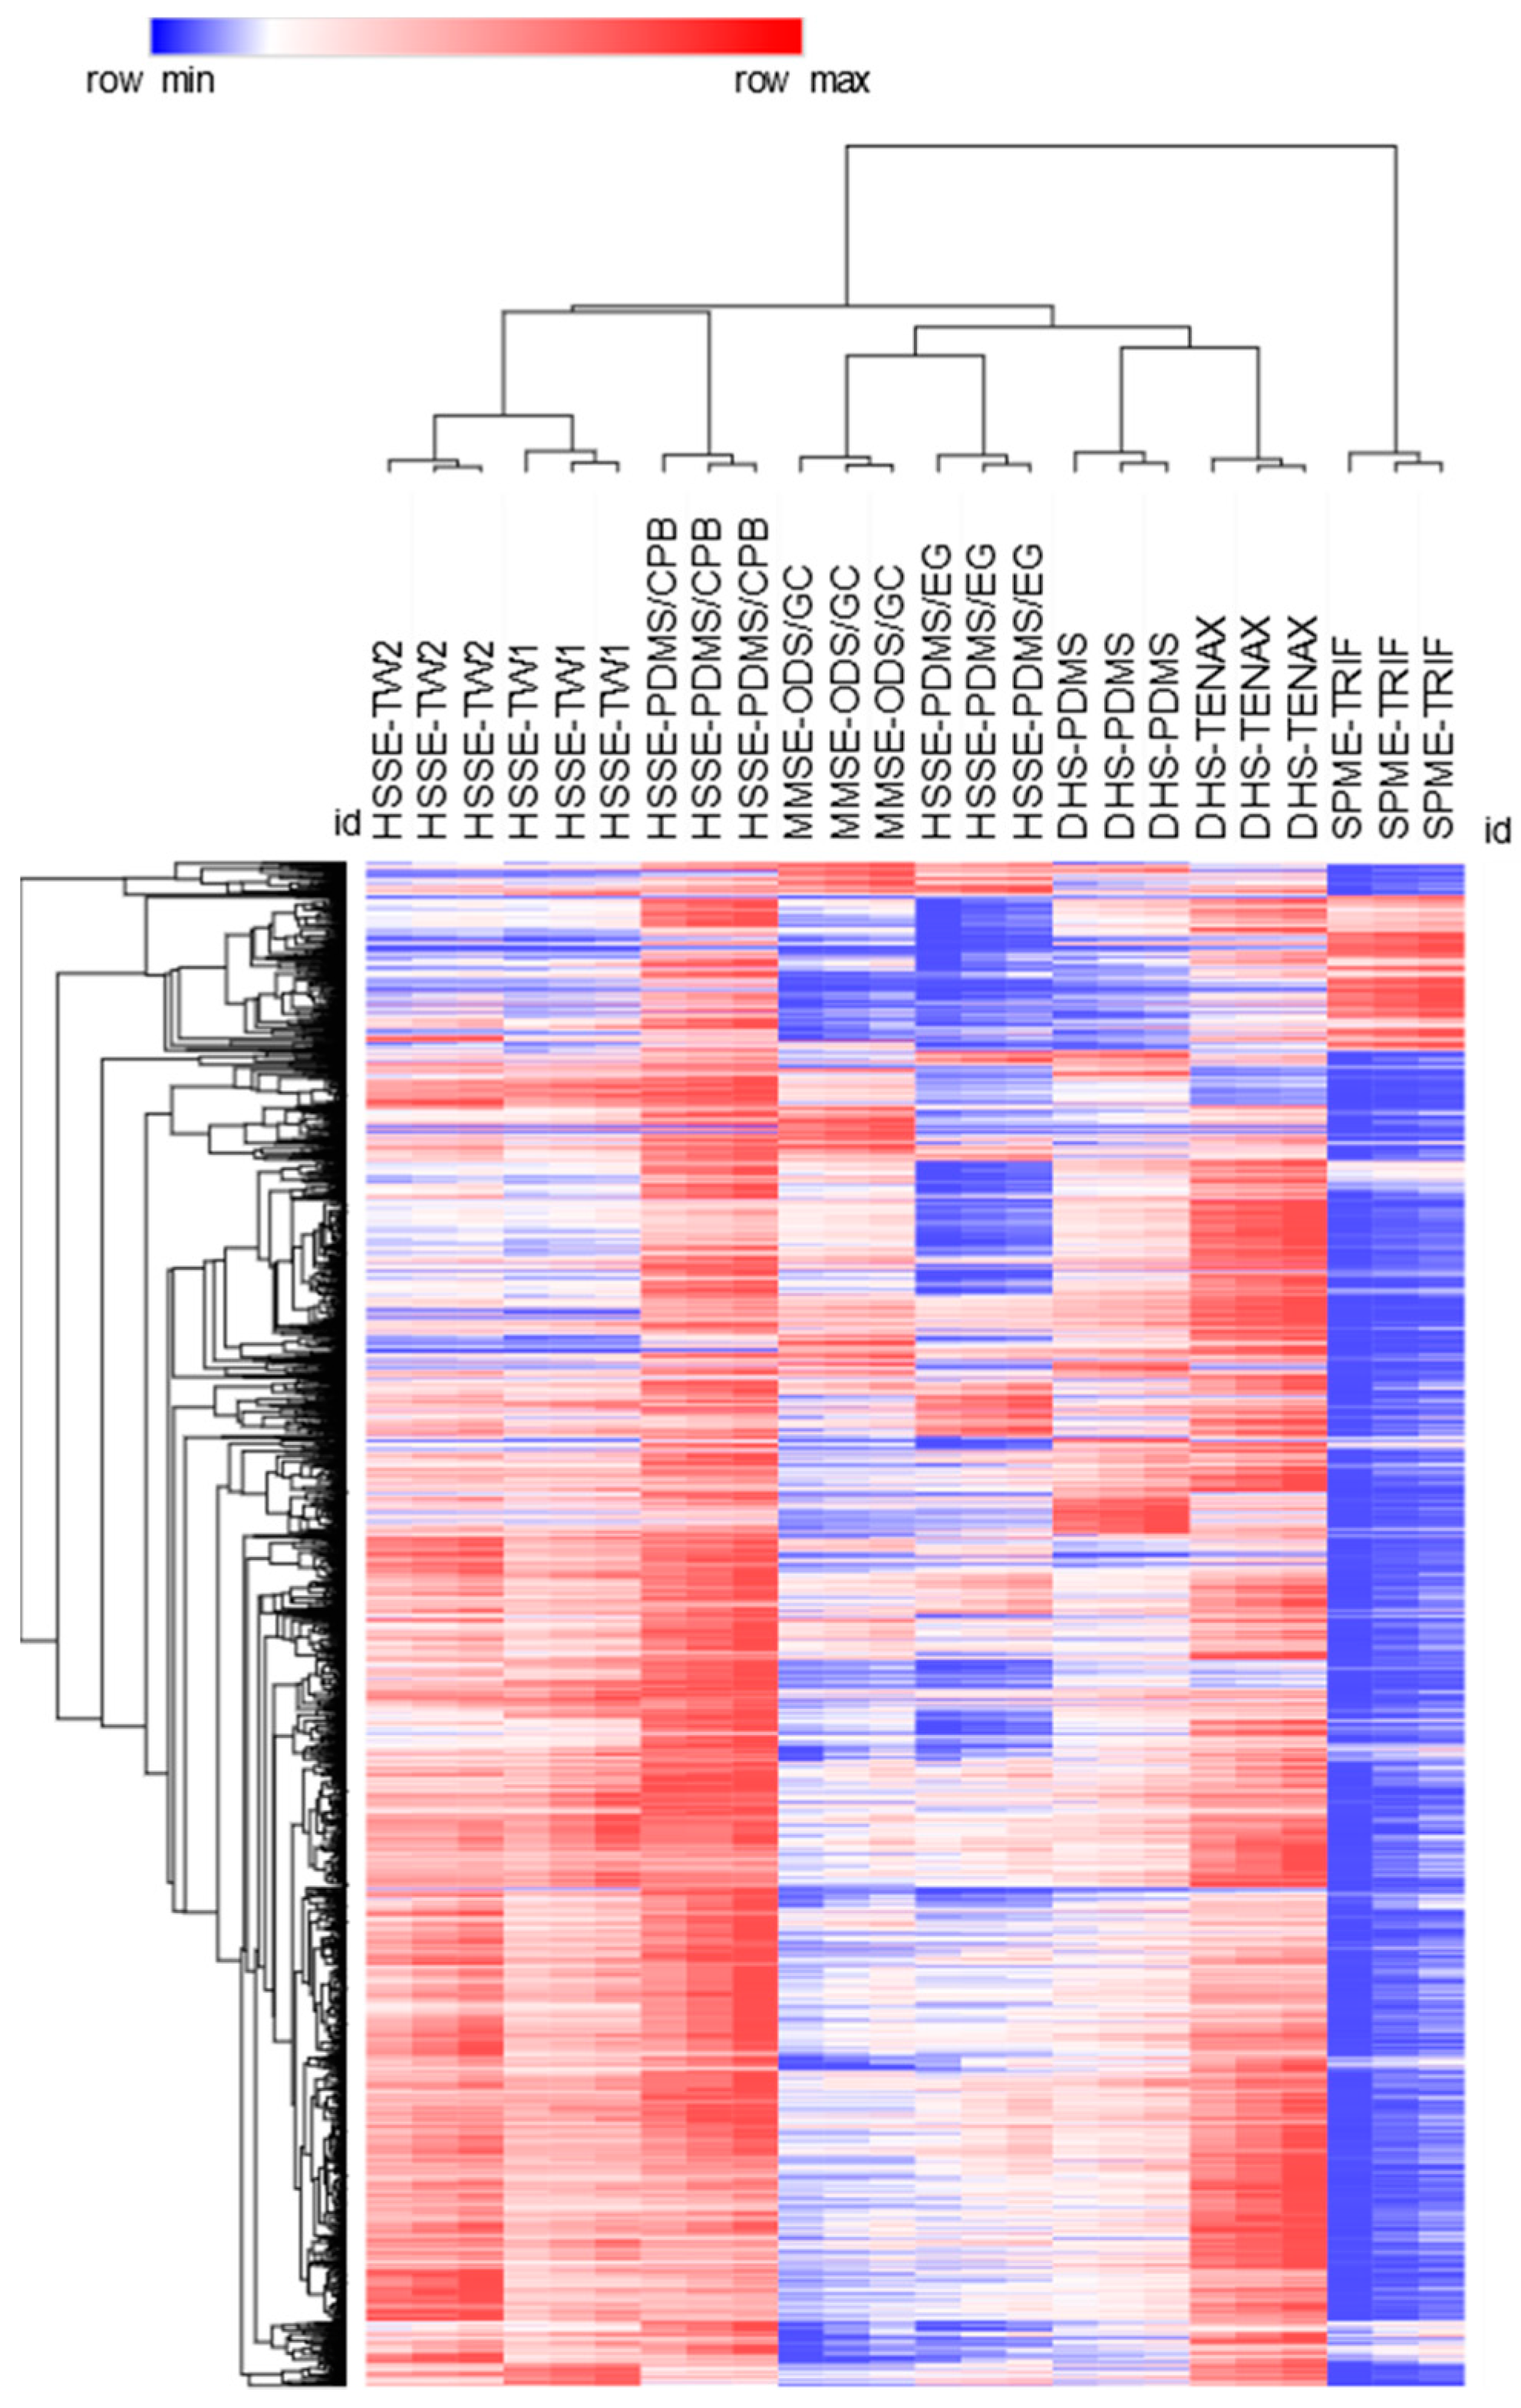
The distribution of about 1500 untargeted and targeted 2D-peak-regions is illustrated as a heat-map in Figure 3. Analyte responses (absolute 2D-peak volume) were normalized using the Z-score (i.e., mean subtraction and normalization to the standard-deviation) and clustered (hierarchical clustering—HC) based on Spearman rank correlation. For each sampling approach, three analytical replicates were computed.
The tested techniques with higher amounts of polymer gave better results in terms of concentration capacity, as expected; the approach with the highest TIC response, calculated over all UT peaks, was HSSE-PDMS/CPB (1.56 × 10⁷), as indicated by the predominance of red colored spots on the heat-map. This was followed by DHS-TENAX (1.17 × 10⁷) and then by DHS-PDMS (8.89 × 10⁶). As expected, SPME-TRIF was the approach with the lowest overall TIC response. However, its coverage for key-analytes is quite good, as will be illustrated in the next section.
These following preliminary considerations can be confirmed upon observing the HC results (Figure 3): SPME-TRIF clusters independently of the other approaches; HSSE with PDMS twisters (HSSE-TW1 and HSSE-TW2) and the combination of PDMS and Carbopack B (HSSE-PDMS/CPB) were all clustered together with the sub-cluster of the two PDMS devices, which differed in the amount of extraction polymer. Interestingly, both DHS approaches were closely clustered, as were MMSE-ODS/GC and HSSE-PDMS/EG, which, however, showed limited accumulation capacity.
The next section will discuss sampling performance towards a selection of targeted analytes of interest for olive-oil sensory profiles.

3.3. Focus on Informative Targeted Analyte Signatures

Of the group of analytes that were targeted, the class of alcohols provides information on LOX activity in ripened fruits, and on enzymatic reactions promoted by bacteria and molds. Their concentration factors (CFs), obtained from Equation (1), are calculated over SPME-TRIF, which is taken as the reference technique:
C F i = A i   d e v   x A 1 S P M E   T R I F ,
where Ai is the 2D-chromatographic area of the i analyte obtained by applying a certain sampling device/approach (dev x) and Ai SPME TRIF is the analyte i chromatographic area resulting from the HS-SPME approach, which is taken as the reference technique.
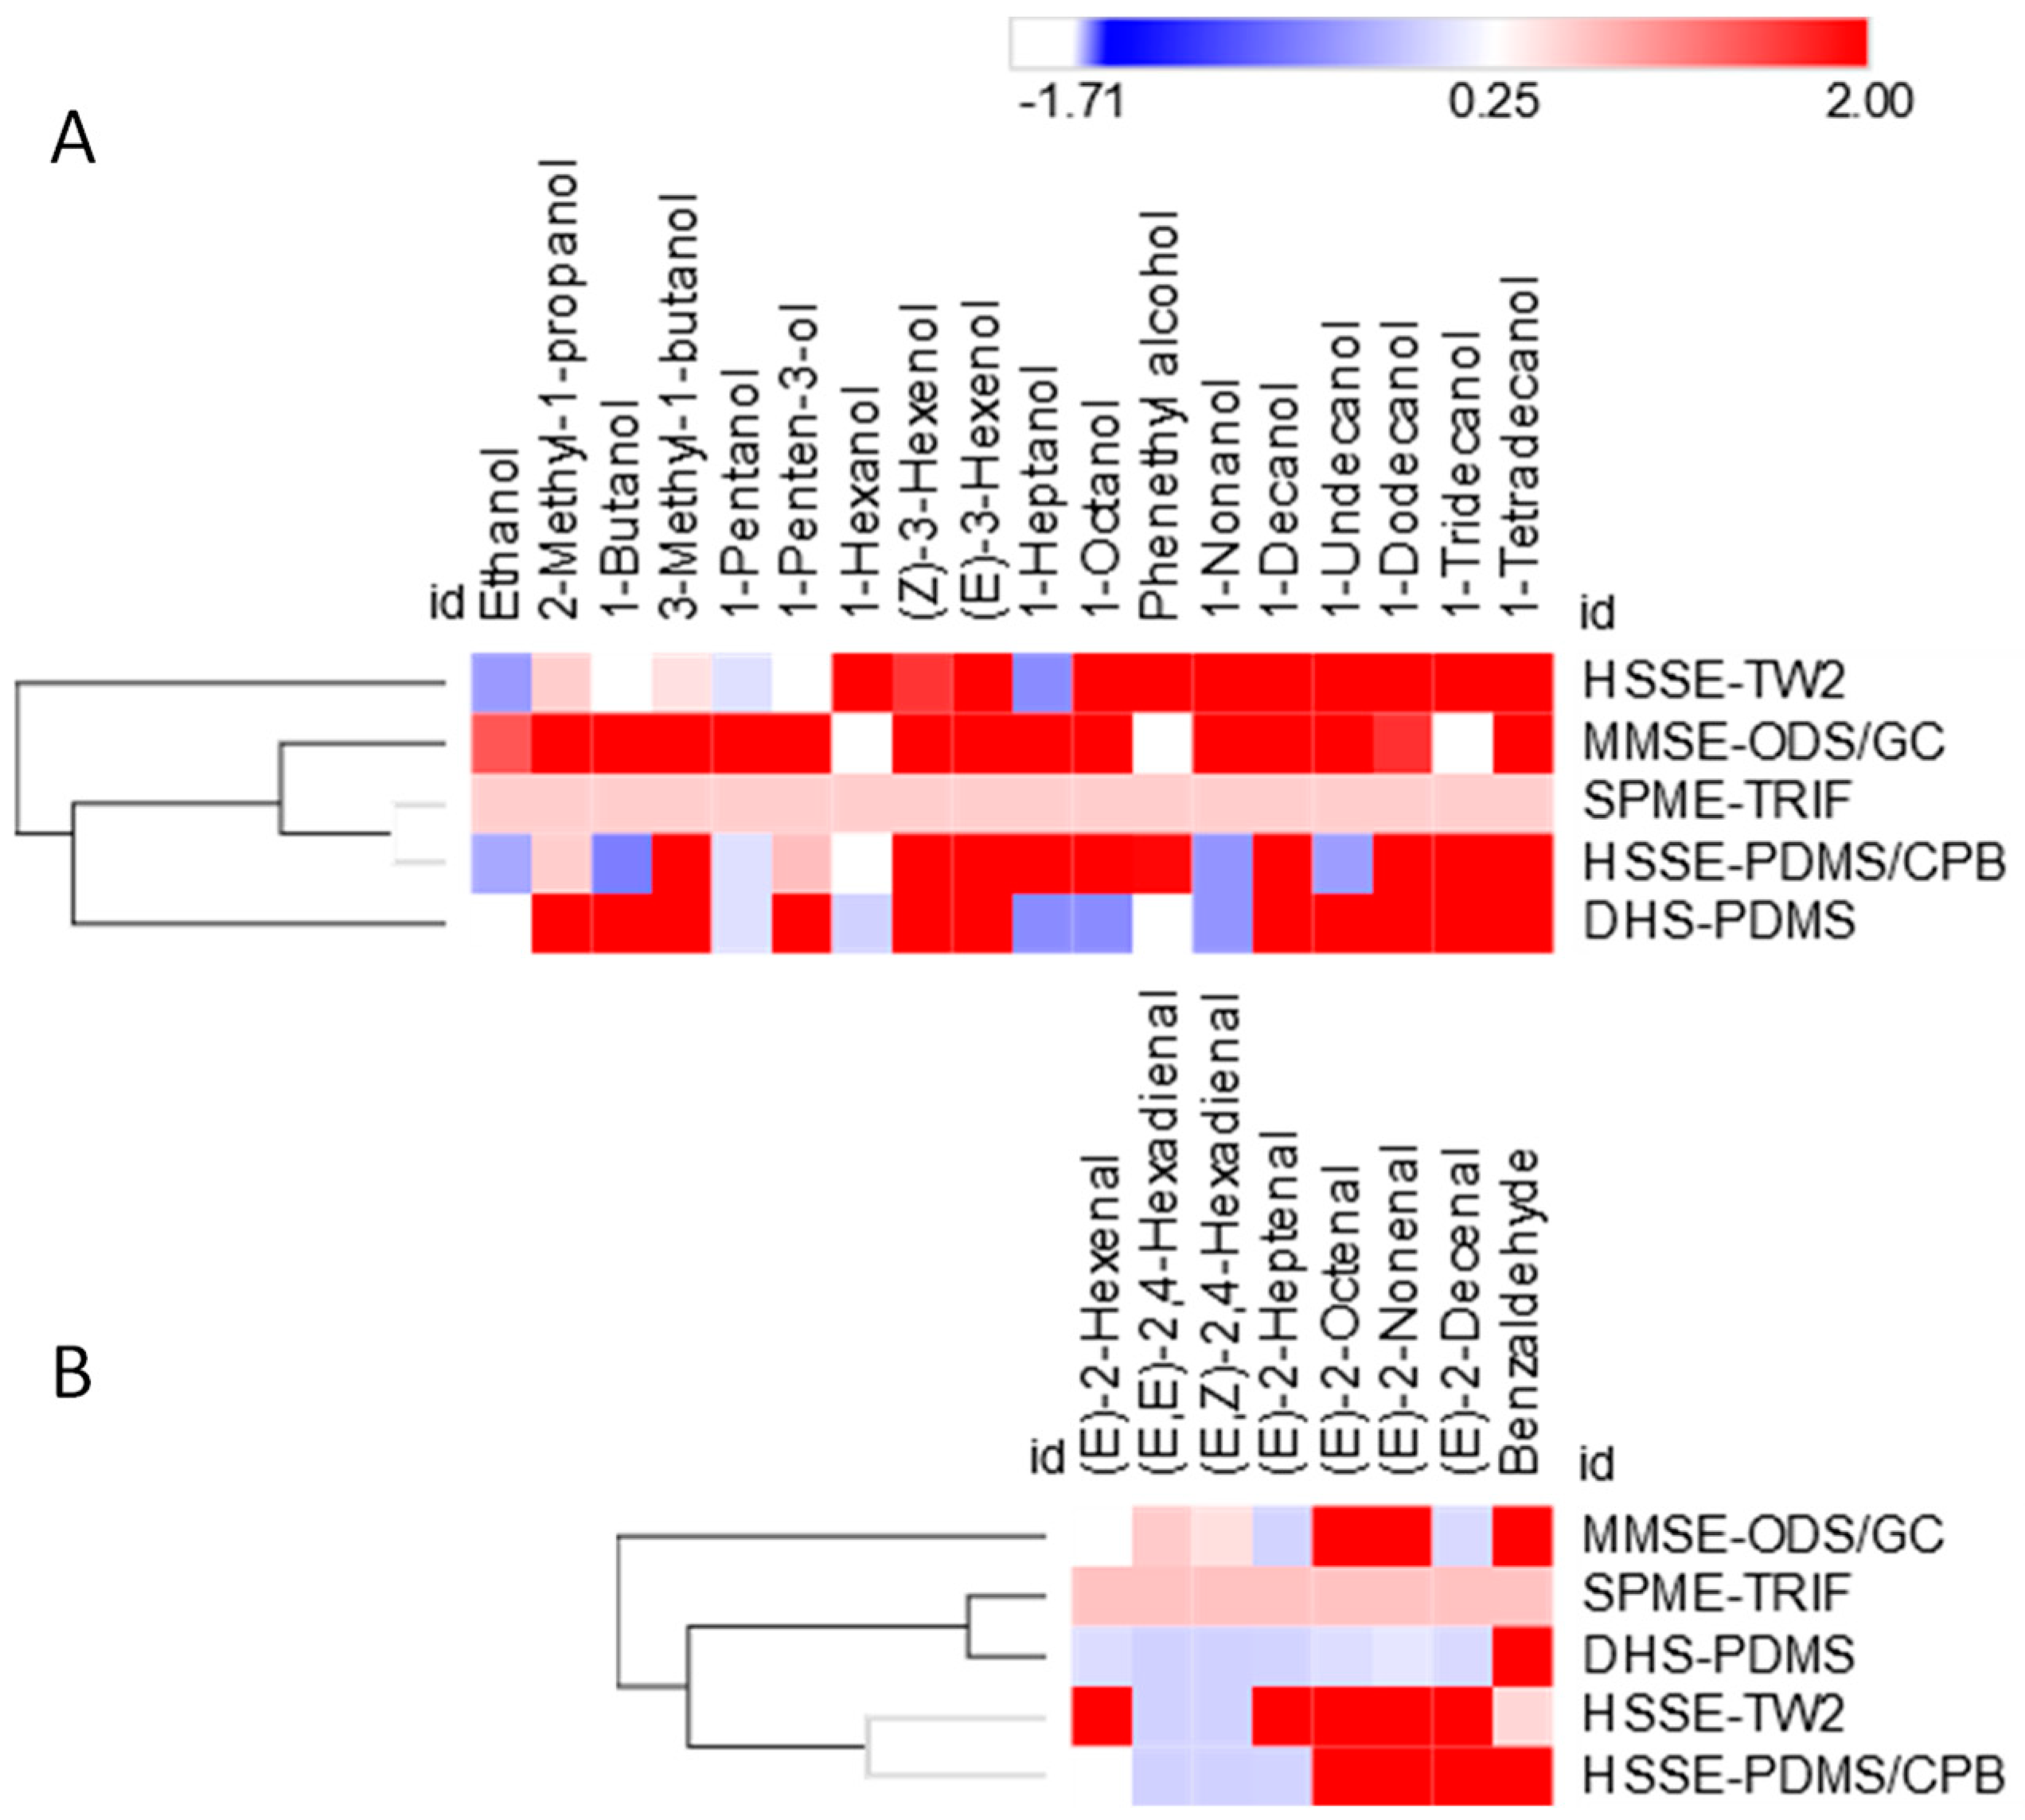
Results were visualized in the heat-map of Figure 4A; alcohols were, in general, better recovered by MMSE-ODS/GC and DHS-PDMS sampling, with the latter showing a mean CF of 120 and a median of 3.36. The alcohols that were recovered most by DHS-PDMS sampling were 2-methyl-1-propanol (CF 1548) and 1-tetradecanol (CF 557). Indeed, DHS shows lower CF values for the most volatile members of the linear series (i.e., ethanol, pentanol, hexanol, heptanol, octanol, and nonanol), most probably because of their breakthrough (see below for further comments). The two C6 unsaturated alcohols ((E) and (Z)-3-hexenol), with a high information potential being fundamental for their green note contribution to the overall flavor, were better recovered by all devices, except SPME-TRIF. It is worth noting that their relative abundance in the sample was so high that their detection by HS sampling was not generally limiting. Phenylethyl alcohol, the aromatic member of this chemical class, showed the opposite tendency, being better enriched by SHS with HSSE-PDMS and dual-phase twisters HSSE-PDMS/CBP.
Another interesting chemical class is that of unsaturated aldehydes; they are formed by the β-scission of unsaturated fatty-acid hydroperoxides, and their odor thresholds are generally lower than those of the saturated homologs. They have been described in the volatile fraction of defected oils [2] (rancid, moldy and fusty) and contribute with fatty and rancid notes. Figure 4B shows CF values within a sub-set of techniques for the most relevant members of this series. In this case, the HSSE approach gave higher average CFs than the other techniques. For (E)-2-octenal and (E)-2-nonenal, MMSE-ODS/GC reported CFs of 10 and 13, showing good selectivity, compared to SPME-TRIF, for these two analytes, which were connoted by very low OTs, i.e., 0.004 and 0.9 mg/kg.
The results could also be examined by observing the relative concentration capacity of each device/approach toward selected analytes and by taking the most effective one as a reference. In a few words, a unit value was assigned to the most effective approach towards each single analyte and the ratios between analyte responses were calculated in a 0–1 range for the other sampling devices. Sampling selectivity was emphasized with this parameter, if calculated for homologs, therefore it is a parameter to be considered in method optimization. Results for saturated aldehydes, alcohols, and short-chain fatty acids are shown in histograms in Figure 5A–C.
Saturated aldehydes, the series from C6 to C17, showed an interesting trend. The static headspace approaches (SPME-TRIF, MMSE-ODS/GC, and HSSE), better recover the most volatile members of the series (from C6 up to C12), provide higher amount of the accumulating polymer, and more uniform relative analyte recovery, although they do so to different extents. For example, HSSE-TW2 achieves unit values for C6–C9 and C12, and is one of the best performing devices for these analytes. For higher homologs in the series, C12–C17, the highest relative concentration capacity was shown by DHS-PDMS. Interestingly, opposite trends are observed with SPME-TRIF, which discriminates this series in favor of the most volatile species, and DHS-PDMS, which better enriches the less volatile members (C13–C17).
For the alcohols series (Figure 5B), the most effective approach to enrich the higher homologs, from C9 to C14, was HSSE-TW2. Complementary behavior is shown by MMSE-ODS/GC and DHS-PDMS; they effectively enrich alcohols from C2 to C8. SPME-TRIF represents this chemical class well and displays less discrimination than observed for aldehydes.
Fatty acids (Figure 5C), within the C2 to C10 range, were well characterized by HSSE-TW2, which maximized the extraction for those with lower volatility. On the other hand, volatility discrimination is evident in the SPME-TRIF profile.
These experimental results demonstrate how high concentration-capacity (HCC) HS can provide useful information on olive-oil volatile-fraction compositions and also enable trace and ultra-trace analytes to be quantitatively recovered. However, as demonstrated by observing CF trends in absolute and relative terms, this information is partial and can only be adopted for cross-sample analyses. Any conclusion about the quantitative distribution of volatiles in the sample would be erroneous if not obtained via accurate quantitation methods [42,43].
To quantify volatiles from a complex matrix, standard addition (SA) or multiple headspace extraction (MHE) should be adopted. These methods require headspace linearity conditions [44], for all targeted analytes, meaning that no saturation effects should compromise result accuracy. The next paragraph will focus on the evaluation of headspace linearity for a selection of potent odorants after SPME-TRIF sampling in the selected time–temperature conditions. Considerations about internal standard (IS) quantitation will also be discussed as this approach is widely, although often erroneously, adopted in several applications.

3.4. Headspace Linearity and Its Impact on Analyte Relative Distribution

Volatile fraction profiling [45], can be run for effective cross-sample comparison, as in the case of a selection of olive oils that differ in origin, extraction technology, and storage time, so analytes and/or informative markers can be compared using chromatographic quantitative indicators that are based on peak areas (raw areas, percentage area), and peak-volume percentage in the case of GC × GC (raw volume, percentage volume), or IS normalization (normalized area, normalized volume). These methods, which are based on relative/normalized responses, have been accepted by the scientific community for several application fields [46], despite being inaccurate and misleading if treated as absolute concentration indicators.
They do not take into consideration several concurring effects, such as the effect exerted by the condensed phase (i.e., matrix effect) on the release of an analyte into the HS or the displacement and multiple-equilibria that occur with adsorption polymers (carboxen—CAR and divinylbenzene—DVB).
Procedures that compensate, or model, the matrix effect are those known as quantitation approaches, and these are based on either external or internal calibration with authentic standards or stable isotopologues of the target analytes.
Those suitable for liquid samples are: (a) External calibration in matrix-matched blank samples; (b) standard addition (SA) by spiking the sample with known incremental amounts of analyte(s); (c) stable isotope dilution assays (SIDA), which are a specific application of SA; and (d) multiple headspace extraction (MHE).
HS linearity must be accomplished for an accurate quantitation of targeted analytes, whichever approach is applied. [44] This condition is verified when, under pre-determined sampling conditions (e.g., temperature, time, and phase-ratio), the condensed phase (liquid or solid sample) releases a minimal analyte amount into the HS without saturation and, in addition, a linear function can be established between the analyte concentration in the sample (C0) and its concentration in the gas phase (Cg). Linearity is easily achievable for trace and sub-trace components, but becomes challenging in multi-analyte quantitation with complex volatile fractions. The linear range depends on analyte partition (Khs) and activity coefficients. It generally ranges between 0.1% and 1% of actual concentration in the sample and can be tuned by modifying the sampling extraction phase (adsorption/sorption mechanisms), the amount of extraction polymers, the sampling temperature and time, as well as by modifying the phase ratio between HS (Vh) and the condensed phase volume (Vs).
In this study, HS linearity by SPME-TRIF sampling, which was taken as the reference technique, was explored, for the analytes listed in Table 2, by analyzing different amounts of EV olive oil, between 1.500 and 0.100 g, chosen on the basis of previous studies [3,47,48,49,50]. Results for normalized peak volumes and percentage responses are reported in Supplementary Table S2 (ST2), while they are summarized in Table 3 for a selection of potent odorants. Responses, obtained from three analytical replicates randomly distributed within a uniform sampling batch, were normalized over the IS (i.e., α-tujone) and refer to 1.500 g of sample (the amount adopted for sampling-device screening) or to 0.100 g. At 0.100 g, at least 50% of the analytes failed to reach HS saturation for the applied sampling conditions (20 mL sampling vial, 40 °C, 60 min).
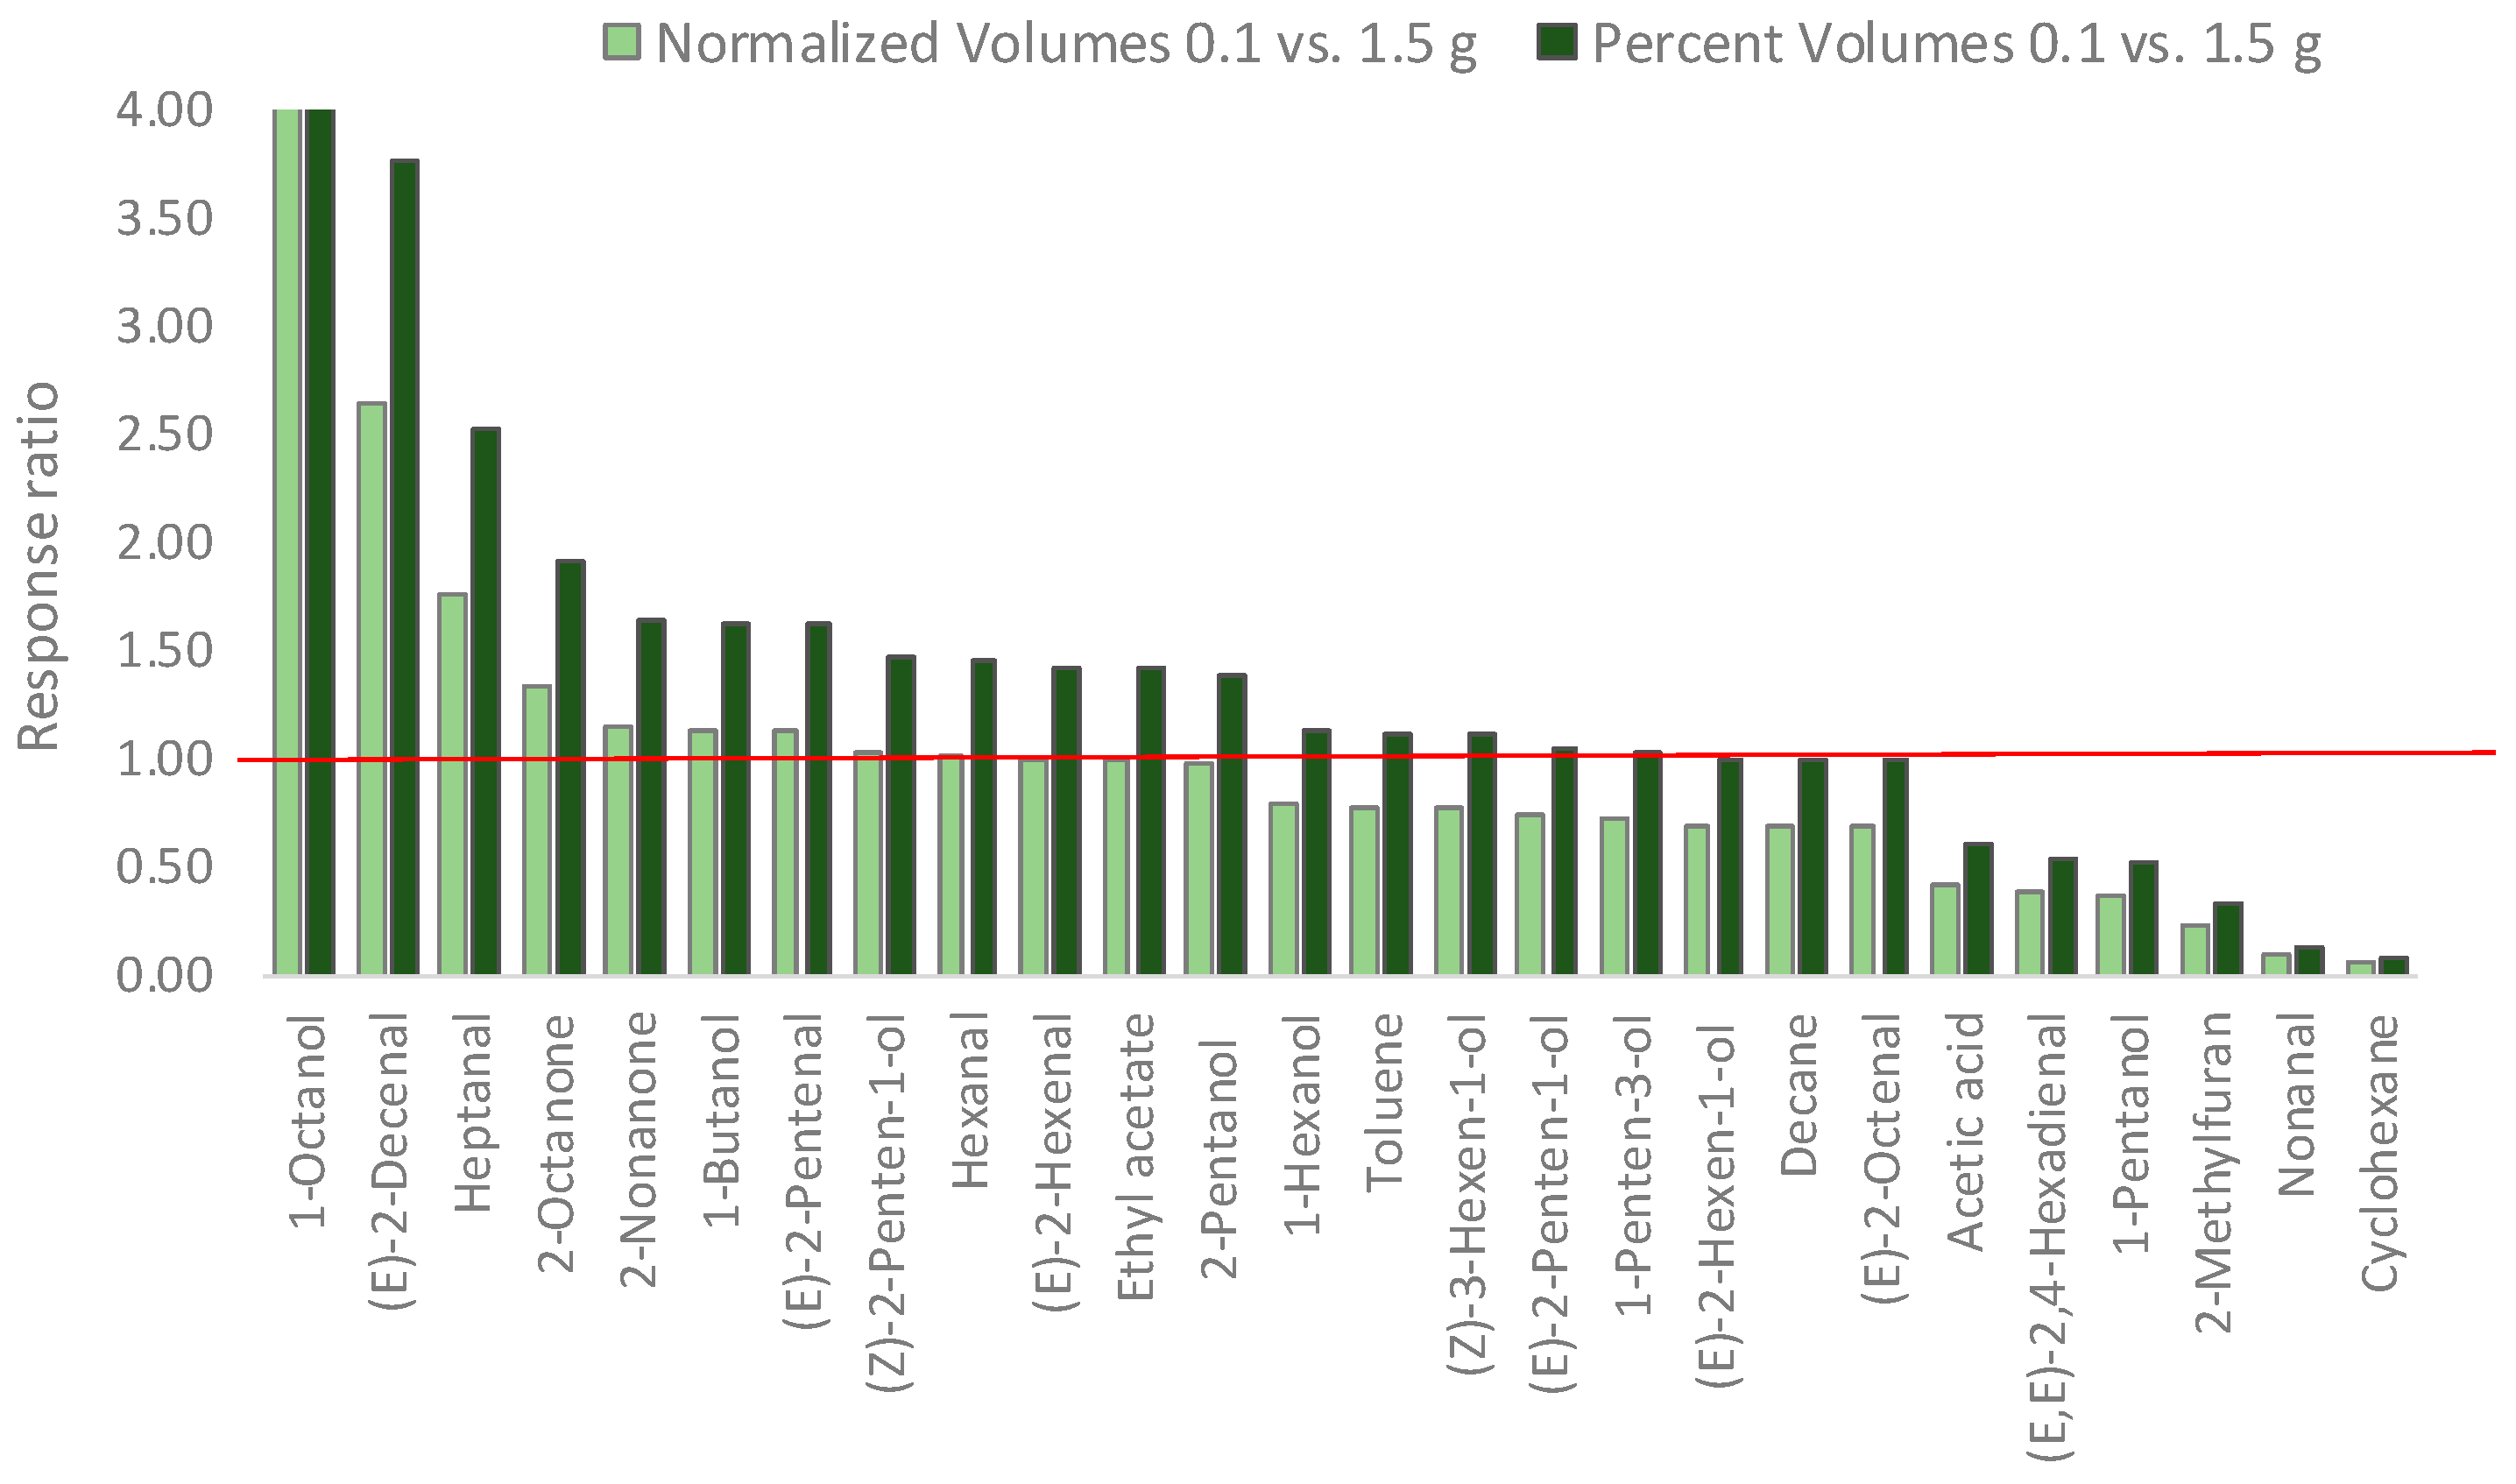
Normalized volume ratios, calculated between 0.1 and 1.5 g of sampling amount, differ widely within the group of analytes considered. A histogram of Figure 6 summarizes the results. In particular, an average value of 1 (highlighted by a red line) was obtained for (Z)-2-penten-1-ol, hexanal, (E)-2-hexenal, ethyl acetate, and 2-pentanol. On the other hand, responses were about 10- and 2.6-fold higher for 1-octanol and (E)-2-decenal, respectively, with 0.1 g of sampling amount. In this last case, displacement effects that occur on the CAR-DVB material reasonably influence the extraction. On the other hand, response ratios for (Z)-3-hexen-1-ol, (E)-2-penten-1-ol, (E)-2-hexen-1-ol, (E)-2-octenal, and (E,E)-2,4-hexadienal were lower at 0.1 g than at 1.5 g. The results clearly highlight the complexity of the multiple-equilibria that coexist in HS-SPME-TRIF sampling and suggest that deeper investigations into HS linearity conditions were needed to validate the hypothesis of HS saturation at the very least. SHS experiments are required to investigate the coexisting effects, such as displacement and phase ratio. Multiple headspace extraction (MHE) was therefore applied to confirm these findings.
The MHE approach is a dynamic, stepwise gas extraction carried out on the sample headspace; it was introduced for S-HS applications and adapted to HS-SPME, resulting in a technique referred to as MHS-SPME [44,51,52,53,54,55].
It consists of three main steps:
Step 1.
Exhaustive analyte extraction from calibration solutions in a range that matches real-sample concentrations.
Step 2.
Exhaustive analyte extraction from selected samples that show comparable matrix effects in order to define HS linearity boundaries.
Step 3.
Use of MHE on samples of interest.
Steps 1 and 2 define the function according to the cumulative instrumental response that is the results of consecutive extractions from the same sample/calibration solution. After four to six consecutive extractions, in HS linearity [44,53], exhaustiveness is accomplished and the decrease in the analyte response (chromatographic peak area) should be exponential.
By summing the instrumental response (A) from each HS extraction, the total response that is virtually generated by the analyte amount in the sample (AT) can be estimated—Equation (2):
A T = i = 1 = A i = A 1   1 ( 1 e q ) = A 1 ( 1 β ) ,
where AT is the total estimated response (chromatographic area), A1 is the response after the first extraction, and q is a constant associated with the response exponential decay (β) over consecutive extractions. The term q is obtained from the natural logarithm of the analyte response as a function of the number of extractions, and a linear regression equation (Equation (3)) can be calculated:
ln A i = a   ( i 1 ) + b ,
where i is the number of extraction steps, b is the intercept on the y axis, and a is the slope. β (e−q) is analyte and matrix dependent and can be adopted to confirm, or refute, HS linearity.
In this study, β values and decay functions (all R2 ≥ 0.995) were estimated over four successive extractions on sample headspace from 1.500, 1.000, 0.500, and 0.100 g of EV olive oil. Results are reported in Table 3 for the 0.100 g sampling. It is worth noting that HS saturation occurred in the range between 0.500–1.500 g with relative β values of ~1 for most of the analytes examined.
Based on these data, any conjecture that is made as to the amount of analytes in a sample derived from HS-SPME sampling without having applied suitable quantitative strategies (e.g., MHE or SA) would be inconsistent and may lead to erroneous results. In practice, if internal standardization is used to estimate analyte concentrations in the sample using HS-SPME-TRIF sampling on 1.500 g, as reported in some research papers that deal with EV olive oil volatilome, relative errors would range between −90% (for 1-octanol) to 1630% (for cyclohexane). These errors are just an underestimation of the actual ones, since additional sources of error, such as detection or response factors and chromatographic extra-column effects, are not computed. Only external calibration [42] or suitable flame ionization detector (FID) response-factor estimation [42,43], accompanied by MHS-SPME or SA, can lead to the accurate quantitation of multiple analytes in samples headspace.
Alternatively, sorption-based materials (PDMS or polyethylene glycol—PEG) with relatively high amounts of extraction polymer were able to overcome most of the limitations highlighted in the examples discussed herein. New commercial devices that benefit from the advantages of SPME, in terms of automation and instrument integration, such as SPME arrows [56,57] and Hisorb™ solutions (Markes International) deserve consideration.

4. Conclusions

This study showed how high concentration capacity headspace sampling could successfully be integrated in a GC × GC-TOF MS platform for highly informative fingerprinting of the complex EV olive oil volatilome. The influence of different variables on extraction effectiveness (CFs and relative CFs) was shown focusing the attention on potent odorants and/or on key-markers known to be correlated with oil sensory defects. Among the others, SPME-TRIF confirmed its good quali-quantitative coverage of the different chemical dimensions present in the EV oil volatilome. However, to derive consistent and accurate quantitative considerations, headspace linearity should be accomplished at the sampling stage. When saturation occurs in the sample headspace, analytes displacements and distribution on the extraction polymers may change giving unrealistic results in quantitative terms.
Several studies erroneously apply HS-SPME followed by IS “apparent” quantitation by working outside the boundaries of headspace linearity and/or by using adsorption polymers (CAR and DVB above all) that may be affected by displacement and competition phenomena between analytes. In addition, such apparent quantitation approaches do not take into account the actual analytes distribution constants (KHS and KD) and detector response factors that, in the case of MS detection, may vary greatly analyte by analyte.

Supplementary Materials

The following are available online at https://www.mdpi.com/2297-8739/6/3/34/s1, Figure S1: schematic diagram of the combined untargeted/targeted (UT) fingerprinting workflow from Stilo, F., Liberto, E., Reichenbach, S. E., Tao, Q., Bicchi, C., & Cordero, C. (2019). Untargeted and targeted fingerprinting of extra virgin olive oil volatiles by comprehensive two-dimensional gas chromatography with mass spectrometry: Challenges in long-term studies. Journal of Agricultural and Food Chemistry, 67(18), 5289-5302. doi:10.1021/acs.jafc.9b01661., Table S1: Precision data on retention times and targeted 2D-peaks normalized volumes expressed as % Relative Standard Deviation (RSD). For those peaks that were not detected the “n.d.” abbreviation is used., Table S2: 2D-peaks response descriptors comparison between 0.100 g and 1.500 g of olive oil HS-SPME-TRIF sampling amount.

Author Contributions

The following statements should be used “conceptualization, C.C., E.L., B.S. and C.B.; investigation and the performing of experiments, F.S., C.C. and E.L.; data curation, F.S. and E.L.; writing—original draft preparation, C.C.; writing—review and editing, C.C, C.B., E.L., B.S. and F.S.; supervision, C.C., C.B.

Funding

This research was funded by Progetto Ager—Fondazioni in rete per la ricerca agroalimentare. Project acronym Violin—Valorization of Italian olive products through innovative analytical tools (https://olivoeolio.progettoager.it/index.php/i-progetti-olio-e-olivo/violin-valorization-of-italian-olive-products-through-innovative-analytical-tools/violin-il-progetto).

Conflicts of Interest

The authors declare no conflict of interest.

References

  1. Cordero, C.; Kiefl, J.; Reichenbach, S.E.; Bicchi, C. Characterization of odorant patterns by comprehensive two-dimensional gas chromatography: A challenge in omic studies. Trends Anal. Chem. 2018, 364–378. [Google Scholar] [CrossRef]
  2. Purcaro, G.; Cordero, C.; Liberto, E.; Bicchi, C.; Conte, L.S. Toward a definition of blueprint of virgin olive oil by comprehensive two-dimensional gas chromatography. J. Chromatogr. A 2014, 1334, 101–111. [Google Scholar] [CrossRef]
  3. Romero, I.; García-González, D.L.; Aparicio-Ruiz, R.; Morales, M.T. Validation of SPME-GCMS method for the analysis of virgin olive oil volatiles responsible for sensory defects. Talanta 2015, 134, 394–401. [Google Scholar] [CrossRef]
  4. Aparicio, R.; Morales, M.T.; Aparicio-Ruiz, R.; Tena, N.; García-González, D.L. Authenticity of olive oil: Mapping and comparing official methods and promising alternatives. Food Res. Int. 2013, 54, 2025–2038. [Google Scholar] [CrossRef]
  5. Stilo, F.; Liberto, E.; Reichenbach, S.E.; Tao, Q.; Bicchi, C.; Cordero, C. Untargeted and Targeted Fingerprinting of Extra Virgin Olive Oil Volatiles by Comprehensive Two-Dimensional Gas Chromatography with Mass Spectrometry: Challenges in Long-Term Studies. J. Agric. Food Chem. 2019, 67, 5289–5302. [Google Scholar] [CrossRef]
  6. Commission of the European Communities. Commission Regulation (Eec) No 2568/91. Off. J. Eur. Comm. 1991, 5, 1–83. [Google Scholar]
  7. International Oil Council. COI/T.20/DOC.15/Rev.10 Sensory Analysis of Olive Oil—Method for the Organoleptic Assessment of Virgin Olive Oil, COI/T.20/DOC.15/Rev.10. 2018. Available online: www.internationaloliveoil.org/documents/viewfile/3685-orga6 (accessed on 12 July 2019).
  8. Stilo, F.; Liberto, E.; Bicchi, C.; Reichenbach, S.E.; Cordero, C. GC×GC–TOF-MS and Comprehensive Fingerprinting of Volatiles in Food: Capturing the Signature of Quality. LC-GC Eur. 2019, 32, 234–242. [Google Scholar]
  9. Vaz-Freire, L.T.; Da Silva, M.D.R.G.; Freitas, A.M.C. Comprehensive two-dimensional gas chromatography for fingerprint pattern recognition in olive oils produced by two different techniques in Portuguese olive varieties Galega Vulgar, Cobrançosa e Carrasquenha. Anal. Chim. Acta. 2009, 633, 263–270. [Google Scholar] [CrossRef]
  10. Cajka, T.; Riddellova, K.; Klimankova, E.; Cerna, M.; Pudil, F.; Hajslova, J. Traceability of olive oil based on volatiles pattern and multivariate analysis. Food Chem. 2010, 121, 282–289. [Google Scholar] [CrossRef]
  11. Lukić, I.; Carlin, S.; Horvat, I.; Vrhovsek, U. Combined targeted and untargeted profiling of volatile aroma compounds with comprehensive two-dimensional gas chromatography for differentiation of virgin olive oils according to variety and geographical origin. Food Chem. 2019, 270, 403–414. [Google Scholar] [CrossRef]
  12. Magagna, F.; Valverde-Som, L.; Ruíz-Samblás, C.; Cuadros-Rodríguez, L.; Reichenbach, S.E.; Bicchi, C.; Cordero, C. Combined untargeted and targeted fingerprinting with comprehensive two-dimensional chromatography for volatiles and ripening indicators in olive oil. Anal. Chim. Acta 2016, 936, 245–258. [Google Scholar] [CrossRef]
  13. Magagna, F.; Guglielmetti, A.; Liberto, E.; Reichenbach, S.E.; Allegrucci, E.; Gobino, G.; Bicchi, C.; Cordero, C. Comprehensive Chemical Fingerprinting of High-Quality Cocoa at Early Stages of Processing: Effectiveness of Combined Untargeted and Targeted Approaches for Classification and Discrimination. J. Agric. Food Chem. 2017, 65, 6329–6341. [Google Scholar] [CrossRef]
  14. Magagna, F.; Liberto, E.; Reichenbach, S.E.; Tao, Q.; Carretta, A.; Cobelli, L.; Cordero, C. Advanced fingerprinting of high-quality cocoa: Challenges in transferring methods from thermal to differential-flow modulated comprehensive two dimensional gas chromatography. J. Chromatogr. A 2018, 1536, 122–136. [Google Scholar] [CrossRef]
  15. Reichenbach, S.E.; Zini, C.A.; Nicolli, K.P.; Welke, J.E.; Cordero, C.; Tao, Q. Benchmarking Machine Learning Methods for Comprehensive Chemical Fingerprinting and Pattern Recognition. J. Chromatogr. A 2019, 1595, 158–167. [Google Scholar] [CrossRef]
  16. Bressanello, D.; Liberto, E.; Collino, M.; Chiazza, F.; Mastrocola, R.; Reichenbach, S.E.; Bicchi, C.; Cordero, C. Combined untargeted and targeted fingerprinting by comprehensive two-dimensional gas chromatography: Revealing fructose-induced changes in mice urinary metabolic signatures. Anal. Bioanal. Chem. 2018, 410, 2723–2737. [Google Scholar] [CrossRef]
  17. Bicchi, C.; Cordero, C.; Rubiolo, P. A survey on high-concentration-capability headspace sampling techniques in the analysis of flavors and fragrances. J. Chromatogr. Sci. 2004, 42, 402–409. [Google Scholar] [CrossRef]
  18. Bicchi, C.; Cordero, C.; Liberto, E.; Rubiolo, P.; Sgorbini, B. Automated headspace solid-phase dynamic extraction to analyse the volatile fraction of food matrices. J. Chromatogr. A 2004, 1024, 217–226. [Google Scholar] [CrossRef]
  19. Risticevic, S.; Vuckovic, D.; Lord, H.L.; Pawliszyn, J. 2.21—Solid-Phase Microextraction. In Comprehensive Sampling and Sample Preparation; Academic Press: Cambridge, MA, USA, 2012; pp. 419–460. [Google Scholar] [CrossRef]
  20. Lord, H.L.; Pfannkoch, E.A. Sample Preparation Automation for GC Injection; Elsevier: Amsterdam, Netherland, 2012. [Google Scholar] [CrossRef]
  21. Ross, C.F. 2.02—Headspace Analysis; Elsevier: Amsterdam, Netherland, 2012. [Google Scholar] [CrossRef]
  22. Bicchi, C.; Cordero, C.; Liberto, E.; Sgorbini, B.; Rubiolo, P. Headspace sampling of the volatile fraction of vegetable matrices. J. Chromatogr. A 2008, 1184, 220–233. [Google Scholar] [CrossRef]
  23. Cordero, C.; Schmarr, H.G.; Reichenbach, S.E.; Bicchi, C. Current Developments in Analyzing Food Volatiles by Multidimensional Gas Chromatographic Techniques. J. Agric. Food Chem. 2018, 66, 2226–2236. [Google Scholar] [CrossRef]
  24. Cordero, C.; Kiefl, J.; Schieberle, P.; Reichenbach, S.E.; Bicchi, C. Comprehensive two-dimensional gas chromatography and food sensory properties: Potential and challenges. Anal. Bioanal. Chem. 2015, 407, 169–191. [Google Scholar] [CrossRef]
  25. Oliver-Pozo, C.; Trypidis, D.; Aparicio, R.; Garciá-González, D.L.; Aparicio-Ruiz, R. Implementing Dynamic Headspace with SPME Sampling of Virgin Olive Oil Volatiles: Optimization, Quality Analytical Study, and Performance Testing. J. Agric. Food Chem. 2019, 67, 2086–2097. [Google Scholar] [CrossRef]
  26. Chin, S.T.; Eyres, G.T.; Marriott, P.J. Cumulative solid phase microextraction sampling for gas chromatography-olfactometry of Shiraz wine. J. Chromatogr. A 2012, 1255, 221–227. [Google Scholar] [CrossRef]
  27. Bicchi, C.; Cordero, C.; Liberto, E.; Sgorbini, B.; David, F.; Sandra, P.; Rubiolo, P. Influence of polydimethylsiloxane outer coating and packing material on analyte recovery in dual-phase headspace sorptive extraction. J. Chromatogr. A 2007, 1164, 33–39. [Google Scholar] [CrossRef]
  28. Bicchi, C.; Cordero, C.; Liberto, E.; Rubiolo, P.; Sgorbini, B.; David, F.; Sandra, P. Dual-phase twisters: A new approach to headspace sorptive extraction and stir bar sorptive extraction. J. Chromatogr. A 2005, 1094, 9–16. [Google Scholar] [CrossRef]
  29. Giddings, J.C. Sample dimensionality: A predictor of order-disorder in component peak distribution in multidimensional separation. J. Chromatogr. A 1995, 703, 3–15. [Google Scholar] [CrossRef]
  30. NIST/EPA/NIH Mass Spectral Library with Search Program Data Version: NIST v17, (n.d.); U.S. Department of Commerce: New York, NY, USA, 2008.
  31. Adams, R.P. Identification of Essential Oil Components by Gas Chromatography—Mass Spectroscopy; Allured Publishing: New York, NY, USA, 1995. [Google Scholar]
  32. Feussner, I.; Wasternack, C. The Lipoxygenase Pathway. Annu. Rev. Plant Biol. 2002, 53, 275–297. [Google Scholar] [CrossRef]
  33. Berlitz, H.D.; Grosch, W.; Schieberle, P. Food Chemistry; Springer: New York, NY, USA, 2009. [Google Scholar]
  34. Angerosa, F.; Camera, L.; D’Alessandro, N.; Mellerio, G. Characterization of Seven New Hydrocarbon Compounds Present in the Aroma of Virgin Olive Oils. J. Agric. Food Chem. 1998, 46, 648–653. [Google Scholar] [CrossRef]
  35. Reichenbach, S.E.; Tian, X.; Cordero, C.; Tao, Q. Features for non-targeted cross-sample analysis with comprehensive two-dimensional chromatography. J. Chromatogr. A 2012, 1226, 140–148. [Google Scholar] [CrossRef] [Green Version]
  36. Reichenbach, S.E.; Carr, P.W.; Stoll, D.R.; Tao, Q. Smart Templates for peak pattern matching with comprehensive two-dimensional liquid chromatography. J. Chromatogr. A 2009, 1216, 3458–3466. [Google Scholar] [CrossRef] [Green Version]
  37. GC ImageTM. GC Image GCxGC Edition Users’ Guide. 2017. Available online: https://www.gcimage.com/gcxgc/usersguide/index.html (accessed on 12 July 2019).
  38. Cordero, C.; Liberto, E.; Bicchi, C.; Rubiolo, P.; Reichenbach, S.E.; Tian, X.; Tao, Q. Targeted and non-targeted approaches for complex natural sample profiling by GCxGC-qMS. J. Chromatogr. Sci. 2010, 48, 251–261. [Google Scholar] [CrossRef]
  39. Reichenbach, S.E.; Tian, X.; Tao, Q.; Stoll, D.R.; Carr, P.W. Comprehensive feature analysis for sample classification with comprehensive two-dimensional LC. J. Sep. Sci. 2010, 33, 1365–1374. [Google Scholar] [CrossRef]
  40. Reichenbach, S.E.; Tian, X.; Boateng, A.A.; Mullen, C.A.; Cordero, C.; Tao, Q. Reliable peak selection for multisample analysis with comprehensive two-dimensional chromatography. Anal. Chem. 2013, 85, 4974–4981. [Google Scholar] [CrossRef]
  41. Rempe, D.W.; Reichenbach, S.E.; Tao, Q.; Cordero, C.; Rathbun, W.E.; Zini, C.A. Effectiveness of Global, Low-Degree Polynomial Transformations for GCxGC Data Alignment. Anal. Chem. 2016, 88, 10028–10035. [Google Scholar] [CrossRef]
  42. Sgorbini, B.; Cagliero, C.; Liberto, E.; Rubiolo, P.; Bicchi, C.; Cordero, C.E.I. Strategies for Accurate Quantitation of Volatiles from Foods and Plant-Origin Materials: A Challenging Task. J. Agric. Food Chem. 2019, 67, 1619–1630. [Google Scholar] [CrossRef]
  43. Cordero, C.; Guglielmetti, A.; Sgorbini, B.; Bicchi, C.; Allegrucci, E.; Gobino, G.; Baroux, L.; Merle, P. Odorants quantitation in high-quality cocoa by multiple headspace solid phase micro-extraction: Adoption of FID-predicted response factors to extend method capabilities and information potential. Anal. Chim. Acta. 2019, 1052, 190–201. [Google Scholar] [CrossRef]
  44. Kolb, B.; Ettre, L.S. Static Headspace-Gas Chromatography: Theory and Practice, Wiley-VCH, New York. Available online: https://books.google.com/books?hl=en&lr=&id=nGPmpb4VvEgC&oi=fnd&pg=PR5&ots=6SZHNIygx6&sig=lcvdWEsXW-3H8BzCWuKuK2PnjiI#v=onepage&q&f=false (accessed on 12 July 2019).
  45. Cordero, C.; Liberto, E.; Bicchi, C.; Rubiolo, P.; Schieberle, P.; Reichenbach, S.E.; Tao, Q. Profiling food volatiles by comprehensive two-dimensional gas chromatography coupled with mass spectrometry: Advanced fingerprinting approaches for comparative analysis of the volatile fraction of roasted hazelnuts (Corylus avellana L.) from different ori. J. Chromatogr. A 2010, 1217, 5848–5858. [Google Scholar] [CrossRef]
  46. Brevard, H.; Cantergiani, E.; Cachet, T.; Chaintreau, A.; Demyttenaere, J.; French, L.; Gassenmeier, K.; Joulain, D.; Koenig, T.; Leijs, H.; et al. Guidelines for the quantitative gas chromatography of volatile flavouring substances, from the Working Group on Methods of Analysis of the International Organization of the Flavor Industry. Flavour Fragr. J. 2011, 26, 297–299. [Google Scholar] [CrossRef]
  47. Vichi, S.; Pizzale, L.; Conte, L.S.; Buxaderas, S.; Lopez-Tamames, E. Solid phase microextraction in the analysis of virgin olive oil volatile fraction: Characterization of virgin oils from two distinct geographical areas of northern Italy. J. Agric. Food Chem. 2003, 51, 6564–6571. [Google Scholar] [CrossRef]
  48. Cavalli, J.F.; Fernandez, X.; Lizzani-Cuvelier, L.; Loiseau, A.M. Comparison of Static Headspace, Headspace Solid Phase Microextraction, Headspace Sorptive Extraction, and Direct Thermal Desorption Techniques on Chemical Composition of French Olive Oils. J. Agric. Food Chem. 2003, 51, 7709–7716. [Google Scholar] [CrossRef]
  49. Morales, M.T.; Luna, G.; Aparicio, R. Comparative study of virgin olive oil sensory defects. Food Chem. 2005, 91, 293–301. [Google Scholar] [CrossRef]
  50. Nigri, S.; Oumeddour, R.; Fernandez, X. Analysis of some Algerian virgin olive oils by headspace solid phase micro-extraction coupled to gas chromatography/mass spectrometry. Riv. Ital. Delle Sostanze Grasse 2012, 89, 54–61. [Google Scholar] [CrossRef]
  51. Costa, R.; Albergamo, A.; Bua, G.D.; Saija, E.; Dugo, G. Determination of flavor constituents in particular types of flour and derived pasta by heart-cutting multidimensional gas chromatography coupled with mass spectrometry and multiple headspace solid-phase microextraction. LWT 2017, 86, 99–107. [Google Scholar] [CrossRef]
  52. Cagliero, C.; Bicchi, C.; Cordero, C.; Rubiolo, P.; Sgorbini, B.; Liberto, E. Fast headspace-enantioselective GC-mass spectrometric-multivariate statistical method for routine authentication of flavoured fruit foods. Food Chem. 2012, 132, 1071–1079. [Google Scholar] [CrossRef]
  53. Nicolotti, L.; Cordero, C.; Cagliero, C.; Liberto, E.; Sgorbini, B.; Rubiolo, P.; Bicchi, C. Quantitative fingerprinting by headspace-Two-dimensional comprehensive gas chromatography-mass spectrometry of solid matrices: Some challenging aspects of the exhaustive assessment of food volatiles. Anal. Chim. Acta. 2013, 798, 115–125. [Google Scholar] [CrossRef]
  54. Sgorbini, B.; Bicchi, C.; Cagliero, C.; Cordero, C.; Liberto, E.; Rubiolo, P. Herbs and spices: Characterization and quantitation of biologically-active markers for routine quality control by multiple headspace solid-phase microextraction combined with separative or non-separative analysi. J. Chromatogr. A 2015, 1376, 9–17. [Google Scholar] [CrossRef]
  55. Griglione, A.; Liberto, E.; Cordero, C.; Bressanello, D.; Cagliero, C.; Rubiolo, P.; Bicchi, C.; Sgorbini, B. High-quality Italian rice cultivars: Chemical indices of ageing and aroma quality. Food Chem. 2015, 172, 305–313. [Google Scholar] [CrossRef]
  56. Kremser, A.; Jochmann, M.A.; Schmidt, T.C. PAL SPME Arrow—Evaluation of a novel solid-phase microextraction device for freely dissolved PAHs in water. Anal. Bioanal. Chem. 2016, 408, 943–952. [Google Scholar] [CrossRef]
  57. Helin, A.; Rönkkö, T.; Parshintsev, J.; Hartonen, K.; Schilling, B.; Läubli, T.; Riekkola, M.L. Solid phase microextraction Arrow for the sampling of volatile amines in wastewater and atmosphere. J. Chromatogr. A 2015, 1426, 56–63. [Google Scholar] [CrossRef]
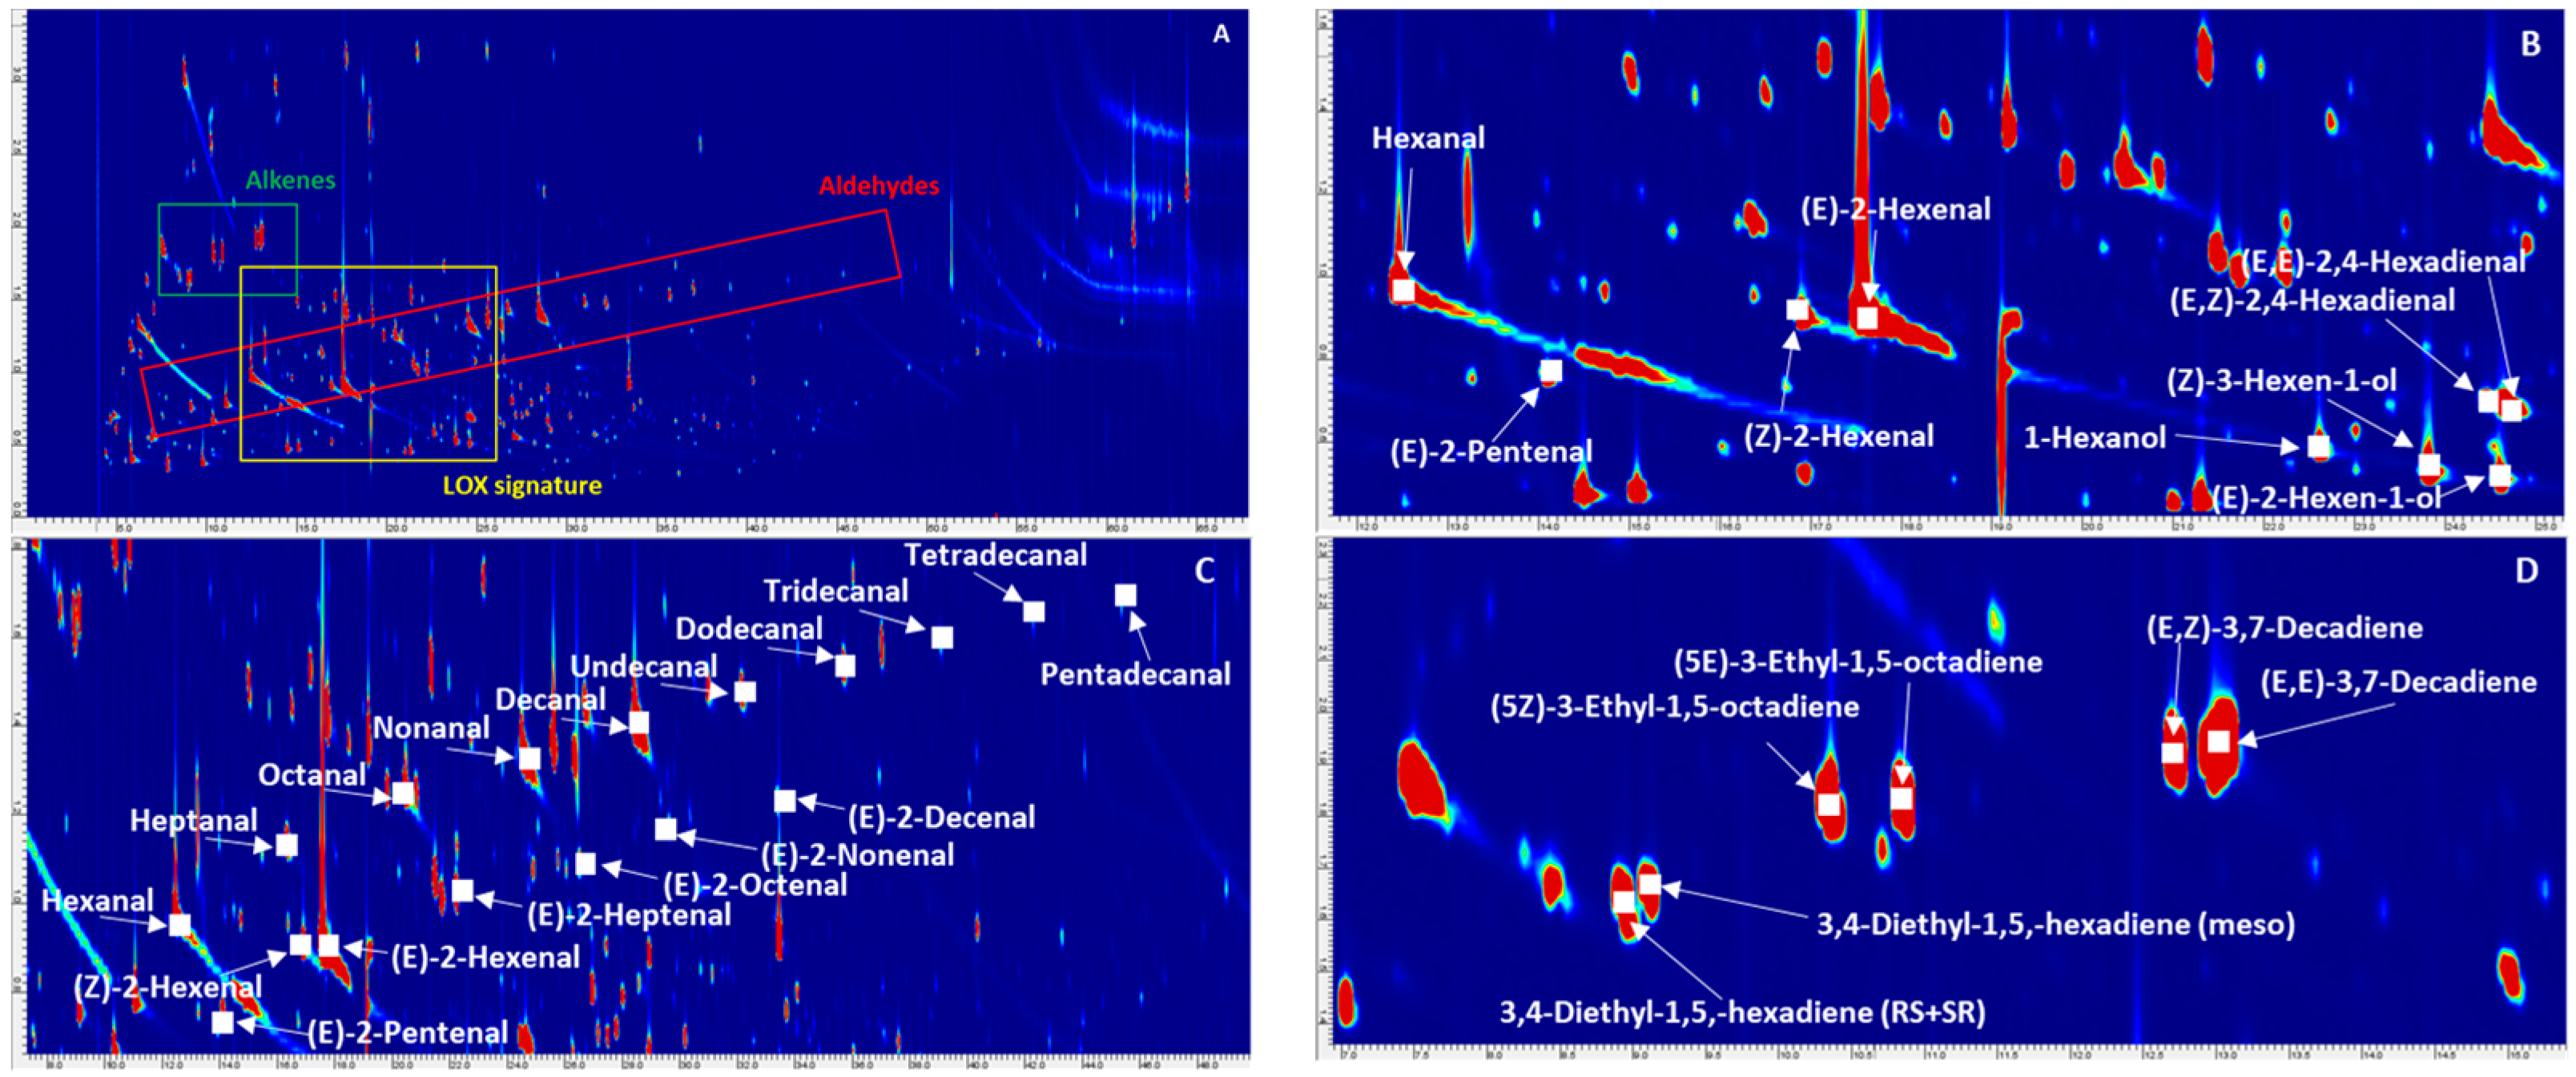
Figure 1. 2D pattern of the PGI Toscano EV oil (A), together with some informative patterns of volatiles. The lipoxygenase (LOX) signature is shown in panel (B), linear saturated and unsaturated aldehydes are illustrated in panel (C), while panel (D) shows the enlarged area of branched unsaturated hydrocarbons correlated to olive fruit freshness [34].
Separations 06 00034 g001
Figure 2. 2D pattern of the PGI Toscano EVO oil (A) and that of a reference oil from IOC for the fusty/muddy defect (B). Comparative visualization is rendered in (C) as colorized fuzzy ratio and analyte relative abundance in the two samples is highlighted by color-coding (green, red, and light-grey). For details see text.
Separations 06 00034 g002
Figure 3. Heat-map showing the analyte-response (absolute 2D-peak volume) distribution resulting from the different sampling approaches. Data were normalized by Z-score (i.e., mean subtraction and normalization to the standard deviation) and clustered (hierarchical clustering—HC) based on Spearman rank correlation. For each sampling approach, three analytical replicates were computed.
Separations 06 00034 g003
Figure 4. Heat-map illustrating concentration factor (CF) values for the alcohol series (A) and unsaturated aldehydes (B) relative to the selected devices/approaches, with solid-phase microextraction SPME-TRIF being taken as the reference.
Separations 06 00034 g004
Figure 5. Relative concentration capacity of each device/approach towards selected analyte classes (saturated aldehydes—(A), alcohols—(B), and fatty acids—(C)) with the most effective approach being taken as the reference.
Separations 06 00034 g005
Figure 6. Normalized response ratios (normalized volumes and % volumes) calculated between 0.1 and 1.5 g for selected analytes.
Separations 06 00034 g006
Table 1. Sampling devices and conditions adopted in the study.
AcronymSampling ApproachSample Weight/VolumeTemperature and TimeOther
STME-TRIFHS-SPME—DVB/CAR/PDMS1.500 g oil
Sampling vial: 20 mL
Temperature: 40 °C
Sampling time: 60 min
Constant stirring
Desorption time: 5 (min)
S/SL injector: 250 °C
Split ratio 1:10
HSSE-TW1HSSE—Twister™
PDMS 1 cm
1.500 g oil
Sampling vial: 20 mL
Temperature: 40 °C
Sampling time: 60 min
TDU conditions: from 30 °C to 27.0°C
(5 min) at 60 °C/min;
Flow mode: Splitless
Transfer line: 270 °C.
CIS-4 PTV injector temp: −50 °C
Coolant: Liquid CO2;
Injection temp program: From −50 °C to 270 °C (10 min) at 12 °C/s.
Inlet operated in split mode: Split ratio 1:10.
HSSE-TW2HSSE—Twister™
PDMS 2 cm
HSSE-PDMS/CPBHSSE—Twister™
PDMS—Carbopack B™
HSSE-PDMS/EGHSSE—Twister™
PDMS—Ethylene glycol EG
MMSE-ODSMMSE
ODS
MMSE-ODS/GCMMSE
ODS—Graphite carbon
DHS-TENAXD-HS
TENAX TA™
1.500 g oil
Sampling vial: 20 mL
Incubation: 40 °C
Sampling: room temperature
Carrier: nitrogen
Sampling flow: 10 mL/min
Sampling time: 20 min
DHS-PDMSD-HS
PDMS (foam)
Table 2. List of targeted analytes together with their retention times in the two dimensions (1tR and 1tR), linear retention times—IT, their known role in defining attributes (defects of qualities), odor quality, odor threshold—OT (mg/Kg), and reference literature for data on sensory features. Sensory defect and quality acronyms: Fusty—F; Vinegary—V; Rancid—R; Mold—M; Morchia—Mo; and Fruity—Fr.
Compound1tR (min)2tR (s)ITAttributesOdor QualityOT (mg/kg)Ref
Heptane4.341.09750 Alkane
Octane5.591.89800F/V/RAlkane0.94[2]
1-Octene6.091.68820M-0.08
Ethyl acetate6.751.35850F/VPineapple0.94[2]
Butanal7.001.04857F/MPungent, green0.018
Ethanol7.671.14883VAlcohol30[2]
Pentanal7.751.35892 -
Nonane7.822.34895 Alkane
3,4-Diethyl-1,5-hexadiene (RS+SR)8.502.36917 -
3,4-Diethyl-1,5-hexadiene (meso)8.662.40923 -
3-Methylbutanal8.752.61927F/VMalty0.0054[3]
3-Pentanone8.841.47930VEther70[2]
(Z)-3-Ethyl-1,5-octadiene9.922.61973 -
1-Penten-3-one10.171.47983MMustard0.00073[3]
(E)-3-Ethyl-1,5-octadiene10.422.61993 -
Ethyl butanoate10.591.771000FSweet, fruity0.03[2]
(E)-2-Butenal10.751.381010 Green, fruit
Butyl acetate12.001.731046FGreen, fruity, pungent, sweet0.3[2]
Hexanal12.251.771054F/Mo/V/RGreen apple, grassy0.08[2]
(E,Z)-3,7-Decadiene12.252.741054 -
(E,E)-3,7-Decadiene12.582.741065 -
(Z)-Pent-2-enal14.001.511108MoStrawberry, fruit, tomato, green, pleasant
(E)-Pent-2-enal14.081.521110VGreen, apple, tomato, pungent0.3[2]
Ethyl benzene14.251.781115FrStrong
1-Penten-3-ol14.700.201129
1-Butanol15.421.261142V/MWiney0.15[3]
2-Heptanone16.421.891161VSweet, fruity0.3
Heptanal16.501.891169ROily, fatty, woody0.5
Limonene16.912.151181 Citrus, mint
1-Pentanol17.171.451190F/M/VFruity3[2]
(Z)-2-Hexenal17.541.611198FrGreen leaves, cut grass0.003[4]
(E)-2-Hexenal18.001.641208Mo/V/F/RBitter almond, green0.42[3]
3-Methylbutan-1-ol18.350.941215F/M/MoWhiskey, malt, burnt0.1[2]
Ethyl hexanoate18.361.941216FApple peel, fruit
1-Hexanol19.001.711231FrFruity, banana, soft0.4[2]
Styrene19.251.351237 Balsamic, gasoline
Hexyl acetate20.332.021263FrGreen, fruity, sweet1.04[4]
2-Octanone20.832.061274VMold, green0.51
Octanal21.082.021280Mo/RFatty, sharp0.32[2]
1-Octen-3-one21.581.891292MoMushroom, mold0.01
(Z)-2-Penten-1-ol21.751.221296 Butter, pungent
(E)-4,8-Dimethyl-1,3,7-nonatriene21.922.361300 -
(Z)-3-Hexen-1-ol acetate22.081.681304 Green, banana
(E)-2-Penten-1-ol22.091.021304 Butter, pungent1.04[4]
1-Heptanol22.311.891309 Herb
(Z)-2-Heptenal22.581.771315ROxidized, tallowy0.042[2]
(E)-2-Heptenal22.671.811317Mo/R-0.005[2]
Ethyl pentanoate23.082.271327M-0.0015
6-Methylhept-5-en-2-one23.171.851329Mo/F/RPungent, green1[2]
(Z)-3-Hexen-1-ol24.081.301350F/R/VGreen1.5[2]
(E)-3-Hexen-1-ol24.921.351369V/FGreen6[4]
1-Octanol25.501.961383MoMoss, nut, mushroom0.1
Nonanal25.752.191388RFatty, waxy, pungent0.15[2]
(E,Z)-2,4-Hexadienal25.761.461388 Green
(E)-2-Hexen-1-ol25.921.261392VGreen grass, leaves5[2]
(E,E)-2,4-Hexadienal26.001.481395 -
(Z)-2-Octenal27.151.861420 Green leaf, walnut
(E)-2-Octenal27.251.891424RGreen, nut, fat0.004[2]
Ethyl octanoate27.502.361429VFruit, fat10
1-Octen-3-ol27.831.471437MoMold, earthy0.05
Acetic acid28.500.971453F/V/RSour, vinegary0.5[2]
(Z,E)-2,4-Heptadienal28.581.601455R/Mo/FFatty, rancid0.36[2]
(E,Z)-2,4-Heptadienal28.663.241457R/Mo/FFatty, rancid10[2]
(E,E)-2,4-Heptadienal28.751.731459R/Mo/FFatty, rancid4[2]
1-Nonanol30.022.021487 Fresh, clean, floreal0.28[3]
Copaene30.162.991492 Wood, spice
Decanal30.252.231494RPenetrating, sweet, waxy0.65[2]
(E)-Octa-3,5-dien-2-one30.911.731507V/MoGeranium-like0.0005[4]
(Z)-2-Nonenal31.431.941521RGreen, fatty0.0045[3]
(E)-2-Nonenal31.751.981530RPaper-like, fatty0.9[3]
Propanoic acid32.240.781541 Pungent, acidic
(E)-6-Methylhepta-3,5-dien-2-one33.831.641568V/Mo-0.38[2]
Undecanal34.492.021597 Waxy, aldehydic, soapy
Methyl benzoate34.911.431608 Phenolic, prune, lettuce
Butanoic acid35.751.011630 -
(E,E)-2,4-Nonadienal35.821.631632RWatermelon2.5[2]
Ethyl decanoate35.912.481634VGrape10[2]
(E)-2-Decenal36.082.021638RPainty, fishy, fatty0.01[2]
1-Decanol36.202.061642 Fatty, waxy, floral, orange
Methyl butanoate37.411.051672FEther, fruit, sweet0.06
γ-Hexalactone37.911.561684 Herbal, coconut, sweet
Dodecanal38.652.121704 Soapy, waxy, citrus
3,4-Dimethyl-2,5-Furandione39.161.351717 -
α-Farnesene40.152.231744 Wood, sweet
Pentanoic acid40.161.051751 Sweet, acidic, sharp
(E,Z)-2,4-Decadienal40.581.731756RDeep-fried0.01[2]
Phenylethyl alcohol40.800.261763
γ-Heptalactone41.661.601783 Sweet, coconut, nutty
1-Undecanol41.932.101792 Fresh, waxy, rose, soapy
(E,E)-2,4-Decadienal42.251.641800RDeep-fried0.18[2]
Tridecanal42.572.241809RFlower, sweet, must, clean
Geranylacetone43.901.851846 Magnolia, green
Butyl benzoate43.991.641848 Balsamic, mild, fruity
Hexanoic acid44.161.011853 Sweet, sour, fatty0.7[3]
γ-Octalactone45.661.771891 Sweet, coconut, creamy
Tetradecanal46.312.361914RFatty, lactonic, coconut, woody
1-Dodecanol47.572.141951 Soapy, waxy, clean
Heptanoic acid47.991.011963 Waxy, cheesy, fruity0.1[2]
γ-Nonalactone49.491.852007 Fatty, coconut
Pentadecanal49.892.482020RFresh, waxy
Octanoic acid51.581.012072 Rancid, soapy, cheesy3[2]
γ-Decalactone53.161.982109 Fruity, fresh, peach
Hexadecanal53.312.582126RCardboard
1-Tridecanol54.232.172155 Musty
Nonanoic acid54.911.052176 Fatty, waxy, cheesy
Methyl palmitate55.902.442208 Oily, waxy, fatty, orris
Ethyl palmitate57.062.612247 Waxy, fruity, creamy
Decanoic acid58.241.052286 Soapy, waxy, fruity
Palmitic acid59.562.692332 Waxy, creamy, fatty, soapy
Heptadecanal59.722.742338R-
1-Tetradecanol60.402.212361 Coconut
Butyl palmitate62.233.112438
Table 3. Normalized and % volumes obtained by sampling 0.100 and 1.500 g of reference EV oil, as calculated after the first extraction. % Error refers to the relative error in response indicators as calculated between the two sampling amounts, and by taking the lowest as reference. For MHS- SPME-TRIF experiments, slope (β) and decay function formulae are reported.
Sampling Amount 0.100 gSampling Amount 1.500 g MHS-SPME-TRIF (0.100 g)
Norm. Volume% VolumeNorm. Volume% Volume% Error βDecay Function
1-Octanol1.109.42 × 10−30.116.75 × 10−4−89.750.67y = −0.40x + 14.1
(E)-2-Decenal0.927.82 × 10−30.352.07 × 10−3−62.060.59y = −0.54x + 14.7
Heptanal1.361.16 × 10−20.774.62 × 10−3−43.250.47y = −0.76x + 14.6
2-Octanone0.201.71 × 10−30.158.95 × 10−4−25.330.76y = −0.28x + 12.5
2-Nonanone0.171.46 × 10−30.158.91 × 10−4−12.960.62y = −0.48x + 12.7
1-Butanol3.382.88 × 10−22.971.77 × 10−2−12.050.37y = −1.00x + 16.1
(E)-2-Pentenal25.422.17 × 10−122.451.34 × 10−1−11.650.28y = −1.28x + 17.5
(Z)-2-Penten-1-ol9.067.73 × 10−28.815.26 × 10−2−2.740.39y = −0.94x + 17.1
Hexanal366.323.13 × 100360.142.15 × 100−1.690.48y = −0.74x + 20.6
(E)-2-Hexenal0.151.24 × 10−30.158.68 × 10−40.210.67y = −0.74x + 23.6
Ethyl acetate0.615.23 × 10−30.623.68 × 10−30.670.63y = −0.46x + 13.4
2-Pentanol0.191.61 × 10−30.191.15 × 10−32.840.69y = −0.37x + 12.7
1-Hexanol304.902.60 × 100384.662.30 × 10026.160.75y = −0.28x + 19.8
Toluene1.149.72 × 10−31.468.71 × 10−328.230.44y = −0.81x + 14.6
(Z)-3-Hexen-1-ol71.876.13 × 10−192.985.55 × 10−129.370.74y = −0.30x + 18.5
(E)-2-Penten-1-ol220.871.88 × 100301.141.80 × 10036.340.28y = −0.82x + 20.3
1-Penten-3-ol191.901.64 × 100267.171.59 × 10039.230.44y = −0.81x + 20.0
(E)-2-Hexen-1-ol171.701.46 × 100247.771.48 × 10044.300.73y = −0.32x + 19.3
Decane0.342.90 × 10−30.492.93 × 10−344.540.73y = −0.32x + 13.0
(E)-2-Octenal0.413.48 × 10−30.593.52 × 10−344.890.44y = −0.40x + 13.1
Acetic acid15.991.36 × 10−137.642.25 × 10−1135.360.45y = −0.81x + 17.9
(E,E)-2,4-Hexadienal19.171.64 × 10−150.813.03 × 10−1165.050.48y = −0.73x + 17.9
1-Pentanol3.543.02 × 10−29.895.90 × 10−2179.080.51y = −0.68x + 15.8
2-Methylfuran0.252.17 × 10−31.116.64 × 10−3338.200.57y = −0.56x + 13.1
Nonanal0.695.88 × 10−37.884.70 × 10−21043.060.58y = −0.55x + 15.6
Cyclohexane15.811.35 × 10−1273.401.63 × 1001629.520.34y = −1.07x + 18.0