Article

Chemometric Characterization of Synthetic Dye Sorption onto Slovakian River Sediments: A Laboratory Batch Experiment

1
Department of Ecochemistry and Radioecology, Faculty of Natural Sciences, University of SS. Cyril and Methodius in Trnava, Nám. J. Herdu 2, SK-917 01 Trnava, Slovakia
2
Department of Chemistry, Trnava University in Trnava, Priemyselná 4, SK-918 43 Trnava, Slovakia
*
Author to whom correspondence should be addressed.
Separations 2018, 5(4), 57; https://doi.org/10.3390/separations5040057
Submission received: 1 October 2018 / Revised: 8 November 2018 / Accepted: 22 November 2018 / Published: 4 December 2018
(This article belongs to the Special Issue Sorption Separation)

Abstract

:
The aim of the work was to characterize the sorption of cationic dyes thioflavine T (ThT) and methylene blue (MB) onto selected Slovakian river sediments using chemometric approaches including principal component analysis (PCA) and cluster analysis (CA). Also, the potential of mentioned multivariate analyses for comparison of studied objects (river sediments or river and model waters) as well as in finding relationships between the variables describing the physico-chemical characteristics of studied matrices or waters and sorption/desorption characteristics of matrices for dyes binding under laboratory conditions was evaluated. Parameters describing the physico-chemical characteristics of sediments include: pH, pHzpc, or cation-exchange capacity; and in the case of waters: pH, conductivity, water hardness, content of dissolved solids or presence of organic compounds. From the comparison of dye sorption onto sediments, it was found that sorption of thiazine dye MB was minimally 1.5-times higher than sorption of benzothiazole dye ThT. Sorption capacities Qs reached the maximum values in the case of sediments originated from Dudvah River (MB-Qs = 8.70 ± 0.42 mg g−1; ThT-Qs = 5.03 ± 0.28 mg g−1; ±SD). Obtained results showed that applied methods of multivariate analyses represent a suitable tool for evaluation of sorption/desorption processes of organic xenobiotics binding in sediments.

1. Introduction

Environmental pollution caused mainly by organic contaminants as a reverse side of industrialization has been a topic of scientific concern for decades. Many low degradability compounds are major environmental pollutants, such as munitions waste, pesticides, organochlorines, polychlorinated biphenyls, polycyclic aromatic hydrocarbons, synthetic polymers, and synthetic dyes [1]. Among the different pollutants of aquatic ecosystem, synthetic dyes represent large and important group of chemicals. These compounds are extensively used in textile dyeing, paper printing, color photography, pharmaceutical, food, cosmetic, and leather industries. Most synthetic dyes can be described as toxic and highly resistant to degradation due to their complex chemical structures [2]. Some dyes are reported to cause allergy, dermatitis, skin irritation, cancer, and mutations in humans [3].
Cationic basic dyes, as one of the classes of synthetic dyes, are quaternary salts whose cations have the positive charge most often on the atom of N, C, O, and S. Basic dyes are considered as one of the most toxic substances [4]. According to United States Environmental Protection Agency (US EPA) and Organisation for Economic Co-operation and Development (OECD), the amounts of non-fixed basic dyes that may be discharged in the effluent were 1% and 2–3%, respectively [5]. Thus, a large amount of wastewater containing dye compounds at low concentrations may be leaked and released into natural water, leading to aquatic environmental contamination. The dye compounds discharged into water systems absorb and reflect the sunlight interfering with its dispersion through water and thereby cause the disturbance of aquatic life and may accumulate in sediments [6,7].
Besides flow conditions of water systems and persistence of dyes, sorption/desorption processes are one of the key factors controlling the input, transport, and transformation of these substances in the aquatic environment [8]. Some published papers have noted that environmental factors, particularly defining the water columns (temperature, ionic strength, pH, and others), and sediment (composition, content of organic matter, pH, and others) characteristics play an important role in controlling the sorption/desorption processes of organic compounds deposition in the sediments [9,10,11,12,13]. However, these studies are usually focused on evaluating the single parameter or factor affecting the sorption/desorption processes. The data thus obtained is difficult to extrapolate on the processes occurring in real aquatic environments. However, the extrapolation of laboratory experiments to environmental conditions still remains challenging [14].
In this context, the selection of the most appropriate statistical approaches is crucial to obtaining meaningful results and interpretations [15]. Chemometrics includes a collection of methods for the design and analysis of laboratory or field experiments, most, but not all, chemically based [16]. In particular, multivariate methods, such as principal component analysis (PCA) and cluster analysis (CA), are increasingly in use in environmental studies [17,18].
Our previous papers dealt with mathematical modelling of data characterizing the continuous sorption of cationic dyes thioflavine T (ThT) and malachite green on dried biomass of microalga Chlorella pyrenoidosa [19] as well as with description of synthetic cationic dye ThT sorption onto river sediments under conditions of batch and column systems [20]. The present work is focused on the characterization of benzothiazole cationic dye ThT and thiazine cationic dye methylene blue (MB) sorption onto selected Slovakian river sediments using chemometric approaches including principal component analysis (PCA) and cluster analysis (CA). In this way, the potential of mentioned multivariate analyses is evaluated mainly in terms of finding the relationships between the sorption/desorption variables describing the stability of the bond sediment-dye and parameters describing the physico-chemical properties of river sediments or the environment of real or model waters. In the work, these methods are also applied with the aim to compare the studied objects represented by river sediments or sea sand and river or model waters on the basis of data obtained from short-time batch experiments.

2. Materials and Methods

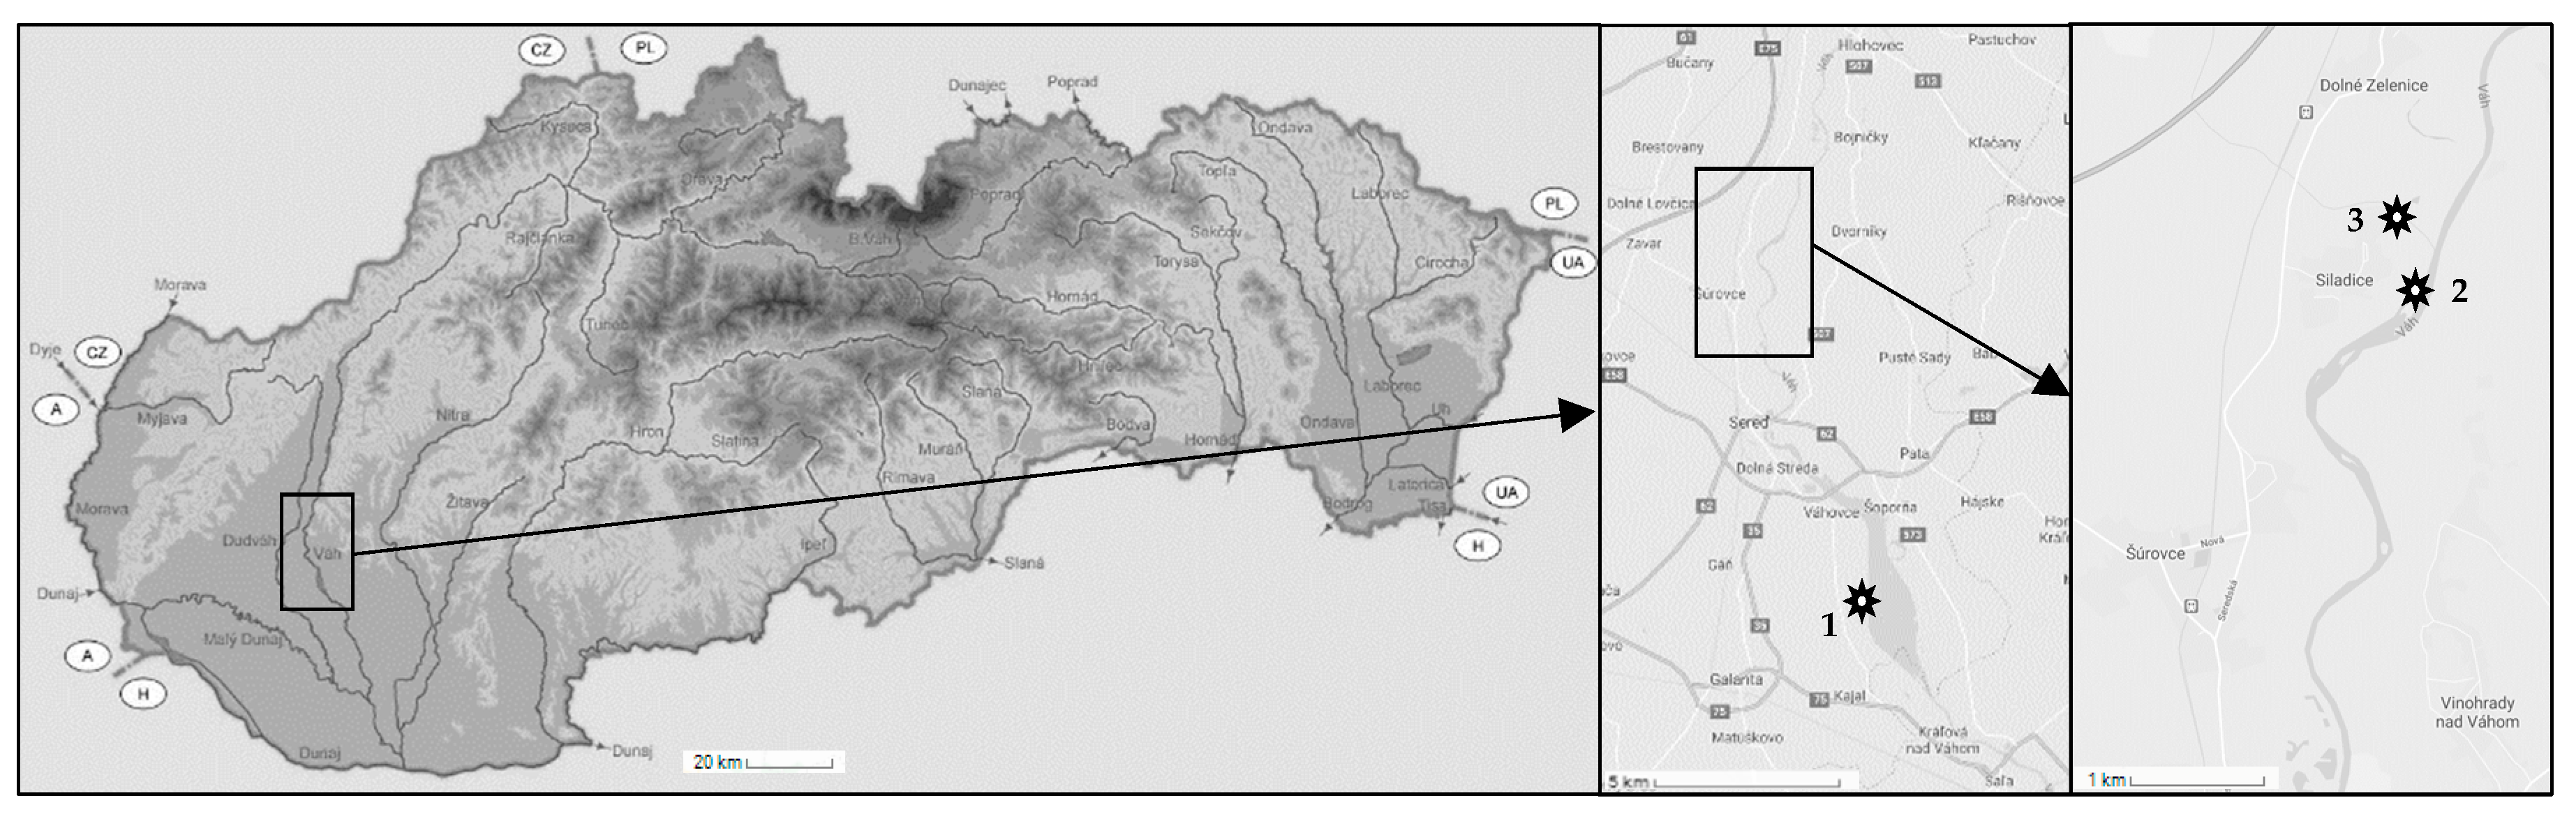
2.1. River Sediments and Waters

River sediments and waters with negligible background levels of studied pollutants were obtained from three different localities within the catchment area of Vah River (Slovak republic). Sediments were sampled from Dudvah River (N 48° 20′ 54.76″; E 17° 44′ 23.58″), Vah River nearby the mouth of Dudvah River to Vah River (N 48° 21′ 10.55″; E 17° 44′ 59.62″) and from the water reservoir Kralova near the city of Sala (N 48°12′ 35″; E 17° 48′ 02″). A map describing the location of individual sampling sites is depicted in Figure 1. Sediments were collected from the sediment surface (0–10 cm) at least 1 m away from the riverbank. At each site, four samples of sediment were obtained from sampling points forming the edges of the imaginary square with the side length of approximately 0.5 m to ensure the qualitatively and quantitatively representative samples. After removal of small stones and plant residues, sediments were homogenized by quartering and dried at laboratory temperature (23 ± 2 °C), gently crumbled, sieved through a 0.31 mm mesh and stored dry at laboratory temperature. For the extension of studied objects as well as in terms of comparative study, the river sediments were washed three times in deionized water or 0.1 mol dm−3 HCl solution during a 2 h agitation (250 rpm) at the concentration of sediment 200 g dm−3. In this way, a laboratory sea sand (fraction < 0.31 mm) as a model matrix was also used.
The sampling of river water from the surface of Vah River and Dudvah River was carried out at least 1 m away from the riverbank into sterile plastic flasks (2 dm3) and obtained samples of waters were stored in a refrigerator at 4 °C.
Similarly to the case of sediments, samples of river waters as studied objects were extended with deionized water, mineral waters, and synthetic lake waters or synthetic wastewater. Model synthetic freshwaters imitating the composition of water in lakes Seathwaite Tarn (Cumbria), Esthwaite (Cumbria), and Rostherne Mere (Lancashire) in the UK were prepared according to work Smith et al. [21]. The composition of individual synthetic freshwaters is described in Table 1. The preparation of the model synthetic wastewater was carried out according to work Bracklow et al. [22]. The composition of synthetic wastewater was as follows (in mg dm−3): peptone—17.4; yeast extract—52.2; milk powder—116; starch—122; sunflower oil—29.0; ammonium acetate—79.4; KH2PO4—23.4; MgSO4·7H2O—41.0; urea—91.7; NH4Cl—12.8; FeSO4·7H2O—5.8; CoCl2·6H2O—0.3. Microelements and heavy metals were added in quantitative and qualitative composition according to Hoagland medium [23] (in µg dm−3): H3BO3—850; CuSO4·5H2O—80; MnSO4·5H2O—500; Na2MoO4·2H2O—6; ZnSO4·7H2O—66. A commercially available waters as models of mineral waters were also used.

2.2. Chemicals

Stock solutions of thiazine cationic dye methylene blue (MB; p.a. purity; CAS 61-73-4; C.I. 52015; Mr = 319.86; Fluka AG, Chem Fabrik, Buchs, Switzerland) or benzothiazole cationic dye thioflavine T (ThT; 75% purity; CAS 2390-54-7; C.I. 49005; Mr = 318.86; Fluka AG, Chem Fabrik, Buchs, Switzerland) with the final concentration 200 mg dm−3 were prepared by dissolving of defined amount of dyes in deionized water, river waters, mineral waters, synthetic lake waters, or synthetic wastewater.

2.3. Characterization of River Sediments

The characterization of potential functional groups involved in the sorption of cationic dyes onto surface of non-treated or treated river sediments and chemically treated sea sand was carried out using modified potentiometric titration proposed by Zhang et al. [24]. In order to prediction of pKa values characterizing the individual functional groups, binding sites concentration cAn for each predicted functional group and pHzpc value (pH of zero point of charge) the modelling program ProtoFit ver. 2.1 [25] was used. The determination of cation-exchange capacity (CEC) of studied river sediments and sea sand was realized according to ISO standard method no. 11260 [26] based on using 0.1 mol dm−3 BaCl2 solution as an extraction agent and chelatometric titration for Mg2+ determination as an index cation. The pH values of river sediments and sea sand were measured according to ISO standard method no. 10390 [27] in a mixture of sediment with distilled water (pHH2O), 0.01 mol dm−3 CaCl2 (pHCaCl2) or 1 mol dm−3 KCl (pHKCl) solutions in weight to volume ratio 1:5 (w/v). The elemental analysis of non-treated and treated river sediments (sieved to granularity < 0.063 mm) was performed by X-ray fluorescence spectrometry using the high performance X-ray fluorescence spectrometer (Spectro, X-LAB 2000) for determination of metals As, Ba, Bi, Br, Ca, Cd, Ce, Cr, Cs, Cu, Fe, Ga, Ge, La, Mg, Mn, Mo, Nb, Ni, Pb, Rb, Sb, Se, Sn, Sr, Th, U, V, W, Y, Zn, and Zr.

2.4. Characterization of River and Model Waters

The water hardness determination (Ca and Mg content) in the case obtained samples of river water as well as deionized water, mineral waters, synthetic lake waters or synthetic wastewater was carried out according to ISO standard method no. 6059 [28]. This standard method is based on chelatometric titration of Ca and Mg by disodium salt of EDTA at pH 10.0 and with Eriochrome black T as an indicator. The qualitative determination of organic compounds presence in studied waters was realized according to standard method no. 75 7360 [29] by measuring of water absorbance at wavelength λmax = 254 nm. The content of dissolved solids was determined according to standard method no. 75 7373 [30] gravimetrically at 105 °C. The content of selected inorganic anions (F, Cl, Br, NO3, NO2, SO42−, and PO43−) in river water samples was determined by ion chromatography (Dionex, ICS-5000, Sunnyvale, California, USA) using the conductivity detector (Dionex, ASRS ULTRA), whereby obtained primary data were analyzed with the program Chromeleon 6.5 Chromatography Workstation (Dionex). For the determination of selected heavy metals (Cd, Pb, Cu, Zn, Ni, and Co) in river water samples, the stripping voltammetry was used. The analysis was carried out using the voltammetry apparatus (Metrohm, 746VA Trace Analyzer, Herisau, Switzerland) and standard addition method, differential pulse anodic stripping voltammetry, and adsorption differential pulse cathodic stripping voltammetry were applied as measurement techniques.

2.5. Sorption and Desorption of Dyes

Sorption and desorption experiments were conducted under batch conditions in 100 cm3 Erlenmeyer flasks. Control experiments without river sediment addition performed to investigate the loss of dyes due to sorption onto the surface of the flask confirmed that the concentration of studied dyes MB and ThT remained unchanged. Studied river sediments or sea sand (fraction < 0.31 mm; concentration 5.0 g dm−3) were added into series of Erlenmeyer flasks containing 20 cm3 of dye solution MB or ThT prepared in deionized water, river waters, mineral waters, synthetic lake waters or synthetic wastewater with defined concentration and values of pH or conductivity. Interaction via agitation in an incubated rotary shaker (250 rpm; 25 °C) was carried out and the change of dye concentration in solution due to evaporation of water was prevented by covering the Erlenmeyer flasks with a parafilm. In defined time intervals, the suspension in flasks was centrifuged (5 min at 3500 rpm) and the chemical concentrations of MB or ThT dyes in the supernatant using UV-vis spectrophotometer (Varian, Cary 50, Mulgrave, Victoria, Australia) were analyzed. The measurements of the absorbance of experimental solutions as well as standard solutions containing MB or ThT to obtain the calibration curves were performed at a wavelength λmax = 650 nm for MB or λmax = 412 nm for ThT, respectively. All experiments were realized in duplicate. The amount of MB or ThT dyes sorbed onto studied sediments or sea sand Qs was calculated using Equation (1)
QS = (C0Ct) * V/S
where Qs is the amount of dye sorbed onto river sediment or sea sand (mg g−1; d.w.). C0 and Ct are the initial concentration of dye in solution at the time t = 0 and the concentration of dye at the time of sampling t (mg dm−3), respectively. V and S are the volume of solution (dm3) and the amount of river sediment or sea sand (g), respectively.
Desorption of MB or ThT dyes from the river sediments or sea sand was carried out under identical conditions of the above-mentioned sorption experiments. Centrifuged studied sediments or sea sand with sorbed dyes and originated from the sorption experiments were transferred into Erlenmeyer flasks containing 0.1 mol dm−3 HCl or 96% vol. ethanol solutions as desorption agents. In the determination of MB or ThT concentration in desorption solution at the end of experiments, the changes of extinction molar coefficients ε650nm or ε412nm as well as the possible releasing of substances from sediments, which could affect the measured absorbance values, were taken into account. All experiments were realized in duplicate. The efficiency of dyes desorption from the studied sediments or sea sand D% was evaluated by Equation (2)
D% = Cd/CS * 100
where D% is the desorption efficiency (in %). Cd is the amount of dye released into supernatant of desorption solution (mg), and Cs is the initial amount of dye sorbed onto river sediment or sea sand (mg), respectively.

2.6. Data Analysis

Univariate analysis of the data describing the physico-chemical characteristics of studied sediments or sea sand as well as studied waters (n = 3) and data describing the sorption/desorption characteristics of studied matrices for dyes binding (n = 2) was applied in terms of arithmetic mean and standard deviation obtaining. Also, obtained data were evaluated by methods of multivariate analysis include: clusters analysis (CA) and principal component analysis (PCA). CA was used to investigate the similarities between the studied objects in the variable space, which are visually represented by dendrograms. In this analysis, the squared Euclidean distance and Ward’s method as aggregate rule were applied. Euclidean distance corresponds to the geometric distance between variables in the multidimensional space. Ward’s method uses an analysis of variance approach to evaluate the distances between clusters and attempts to minimize the sum of squares of any two clusters that can be formed at each step. The mentioned methods were chosen since it seems a reasonable compromise for quantitative data. The purpose of PCA is to describe linear relationships between variables. It calculates principal components (PCs) that represent the degree of correlation between all variables. Among the PCs, only those that have the percentages of highest variance are used to explain the variables and individual distribution [31]. In this context, significant PCs were selected based on the calculated eigenvalues, when eigenvalue > 1 is usually considered as a criterion for extraction of the principal components required to explain the sources of variance in the data. Mentioned data analyses were realized using the statistical and data visualization program STATGRAPHICS Centurion ver. 15 (StatPoint, Inc., Warrenton, VA, USA).

3. Results and Discussion

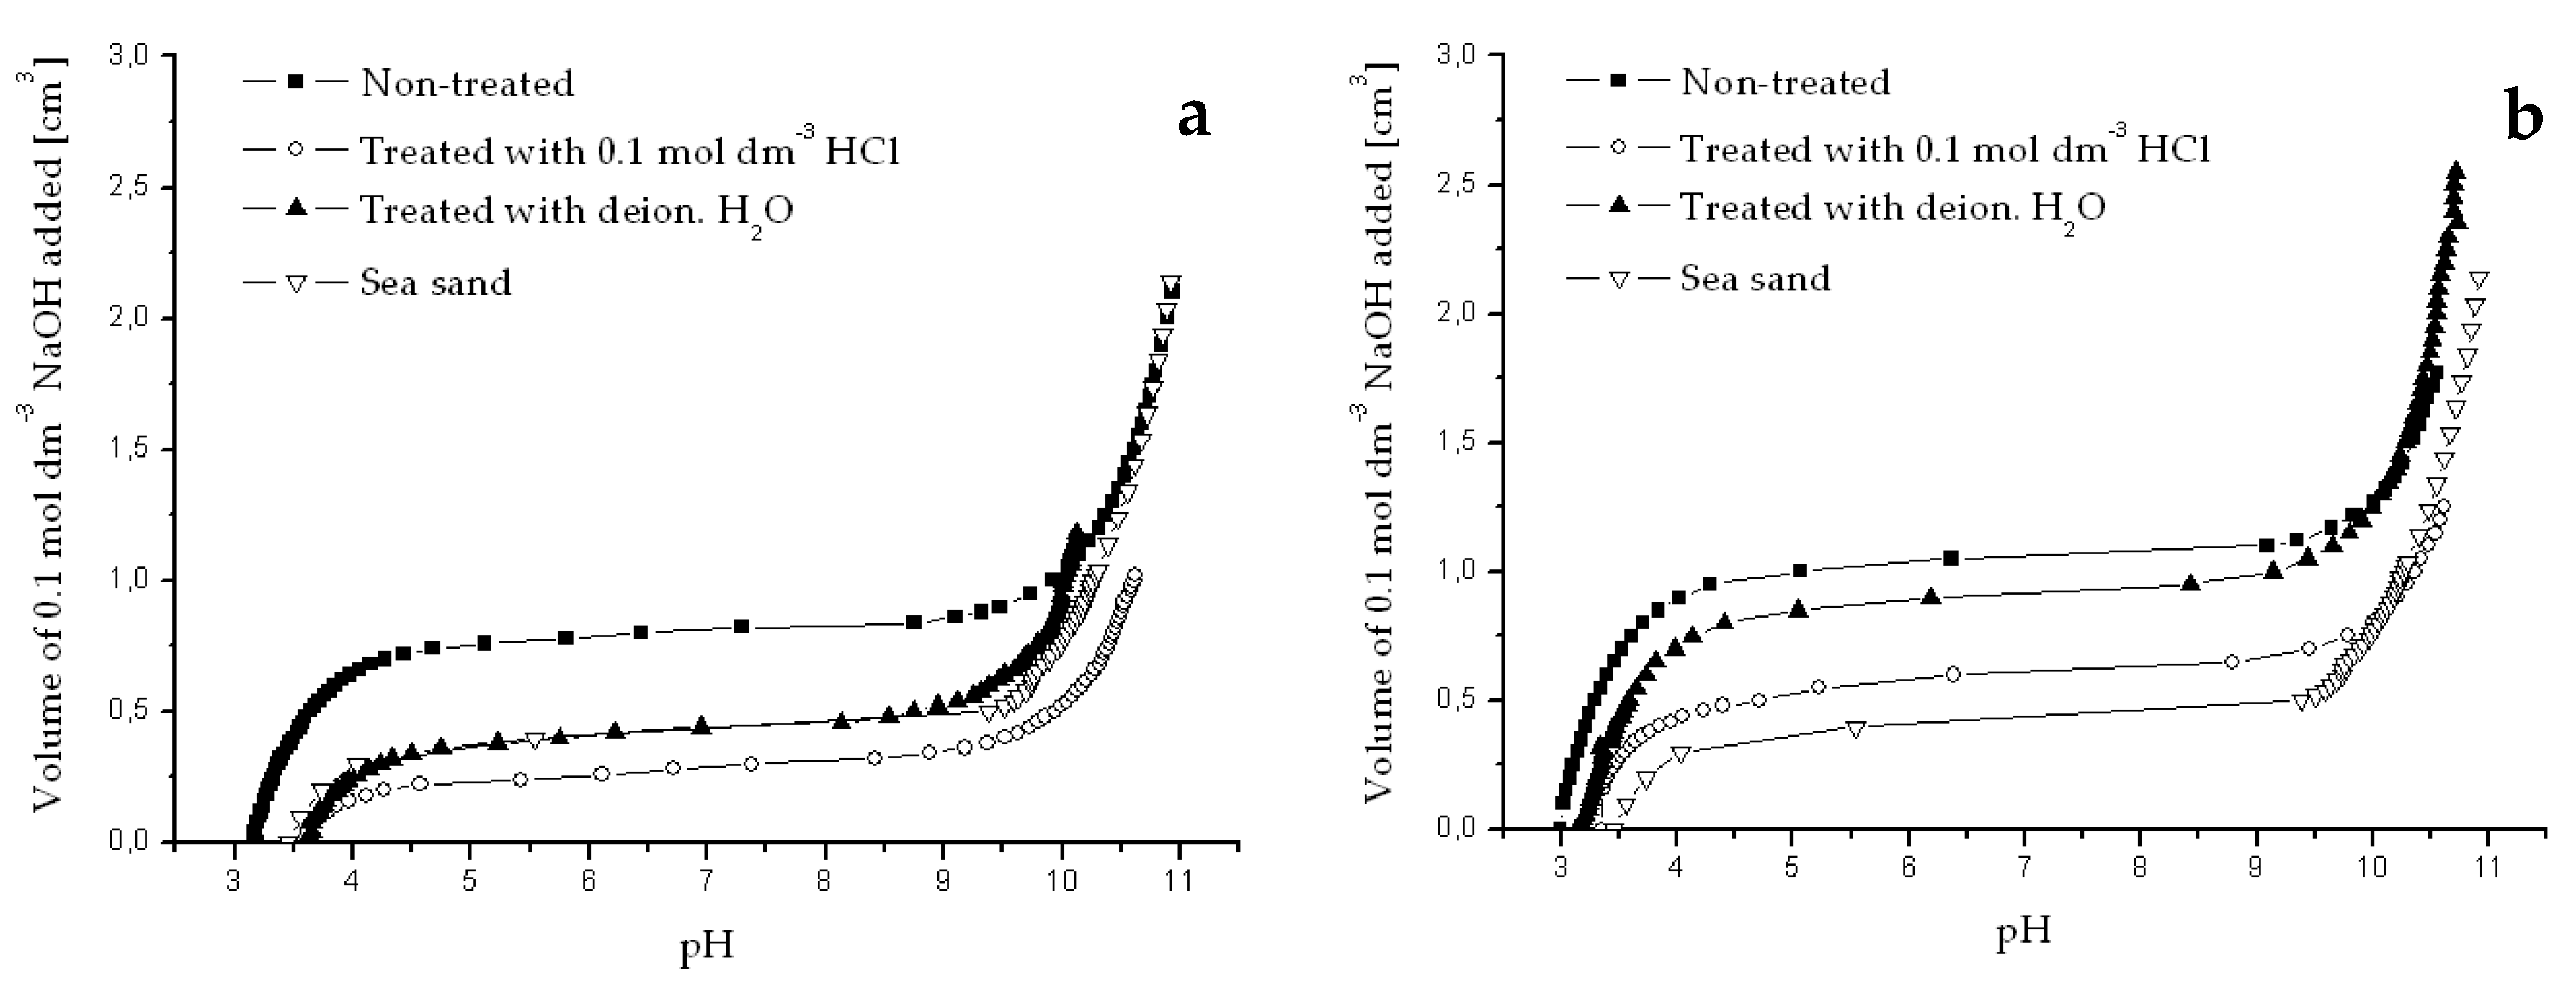
3.1. Characterization of River Sediments

To reach the main aims of the work, physico-chemical characteristics of obtained river sediments from Dudvah River, Vah River and water reservoir Kralova were determined in the first step. Also, this characterization served to provide a better understanding of dye sorption/desorption processes occurring on the surface of sediments as well as relationships between these processes and the physico-chemical characteristics of river sediments. As it was mentioned, for comparison and extension of studied objects, river sediments treated by deionized water or 0.1 mol dm−3 HCl solution and chemically treated sea sand were also used.
From the point of view of cationic xenobiotics sorption, it is important to determine the active zone on sorbent for cations binding mainly in terms of quantitative and qualitative portion of negatively charged functional groups. To find the qualitative presence of functional groups on the sorbents, FT-IR analysis is widely used. In this work, for the qualitative characterization of functional groups as well as for the prediction of binding sites concentration cAn for each predicted type of functional group on the surface of sediments, potentiometric titration, and modeling program ProtoFit were applied.
Obtained titration data (Appendix A) were fitted to the non-electrostatic surface complexation model option within ProtoFit program using two, three, and four discrete sites. The four-site model provided the best fit of the experimental data for all studied matrices. According to obtained results, the presence and quantitative portion of carboxyl (–COOH), hydroxyl (–OH), phosphate (–PO3H2), and amino (–NH2) groups on the surface of studied matrices were identified. All these qualitative and quantitative parameters are difficult to use for comparison of matrices or their effects on sorption/desorption characteristics of studied matrices for dyes binding. However, the presence or the portion of particular functional groups have important role not only considering which type of ion can be bound, but also from the point of view of the total charge on the surface of the given sorbent. In this context, the ProtoFit program allowed to predict the pHzpc values (pH of Zero Point of Charge) for individual sediments and sea sand, which represent the pH value when sorbent shows zero surface charge. It means that if the environment pH < pHzpc than sorbent surface acquires a positive charge, and if the environment pH > pHzpc sorbent surface shows a negative charge.
Among other important parameters that describe the ability of the given matrix to bind organic compounds or metals are the pH value and cation-exchange capacity (CEC). These parameters are determined, especially in the case of soil samples, for evaluating metals binding and their mobility in the environment. The pH value determines which species of ions or compounds will be significantly bound on analyzed matrix. In general, if matrix shows pH < 7, it can be expected the binding negatively charged ions or compounds on the matrix. If matrix shows pH > 7, the bond of positively charged ions or compounds will be dominated. In this work, pH values for studied matrices were analyzed in suspension with distilled water (pHH2O), 0.01 mol dm−3 CaCl2 (pHCaCl2) or 1 mol dm−3 KCl (pHKCl) solutions. CEC value in miliequivalent exchanged cations on 100 g of matrix quantitatively indicates the ability of given material to bind cations. In the case of clay or organic soils, the CEC reaches the values up to 20 meq/100 g. On the other hand, sandy soils with low ability to bind ions show values only 2−3 meq/100 g [32].
In the Table 2, the determined values of pHH2O, pHCaCl2, pHKCl, pHzpc, and CEC for non-treated or treated river sediments obtained from Dudvah River, Vah River, and water reservoir Kralova as well as sea sand are summarized. The pH values of individual non-treated river sediments and sea sand were not significantly different. The differences between the determined values in the case of suspensions with distilled water, 0.01 mol dm−3 CaCl2 or 1 mol dm−3 KCl solutions were in the range 0.27−1.27. However, the significant effect of the sediment treatment on pH values of sediments was observed, especially for sediments treated with 0.1 mol dm−3 HCl solution. Similar result was also found for pHzpc values, but studied river sediments themselves were different in the predicted pHzpc values. The lowest pHzpc value was determined in the case of Dudvah River sediment and the highest pHzpc value was obtained for sea sand as a comparative object. On the other hand, the highest CEC values were calculated in the case of sediment originated from the water reservoir Kralova and the lowest CEC value showed sea sand.
In general, river sediments represent particles derived from sedimentary rocks or different biological origin components that are transported by liquid phase and deposited from water column. Fine-grained bottom or offshore sediments (generally fraction < 0.125 mm) offer sensitive indication of organic xenobiotics or heavy metals contamination of water systems mainly controlled by sorption processes [33]. Thus, sediments represent a sink for xenobiotics or metals and indicator of environmental quality.
In consideration of the localities of river sediments samples taken which are characterized mainly by heavy metals contamination, especially Cd and Pb [34], as well as evaluation of changes in sediment composition caused by sediment washing with deionized water or 0.1 mol dm−3 HCl solution, X-ray fluorescence spectrometry as an additional analysis of sediments was used. Main elements, such as Ca, Fe, Mg, or Mn and trace elements, such as As, Ba, Bi, Br, Cd, Ce, Cr, Cs, Cu, Ga, Ge, La, Mo, Nb, Ni, Pb, Rb, Sb, Se, Sn, Sr, Th, U, V, W, Y, Zn, and Zr were analyzed in % and ppm amounts, respectively.
US EPA proposed parameters, the effects range low (ERL) and effects range median (ERM), for prediction of sediment contamination. The ERL values represent the tenth percentile of the effects database, below which harmful effects on aquatic biota are rarely observed and the ERM values describe the 50th percentile of the effects data and is indicative of concentrations above which harmful effects are often observed [35]. These parameters have been widely applied and found to be effective predictive tools [36,37].
In all studied river sediments mentioned limits were not exceeded and determined levels of metals were minimally two-times lower than defined ERL values. The significant differences in orders of magnitude between river sediments sampled from studied localities in terms of determined amounts of metals in sediments were not found. Differences at the level of 1.5- to 2-times higher values were determined only in the case of elements Ca, Cu, Pb, and Zn. The influence of river sediment treatment by washing with deionized water or 0.1 mol dm−3 HCl solution on composition of studied matrices was significantly observed only for HCl as treatment solution and for metals of alkaline earths (Mg, Ca, and Sr). This fact indicates that metals weakly bound into sediments can be released at slightly acidic conditions. However, in the case of organic xenobiotics bound onto sediments, such as cationic synthetic dyes, they can be released not only at acidic conditions, but more significantly in conditions of less polar solutions, e.g., diluted solutions of alcohols or organic solvents [20].

3.2. Characterization of River and Model Waters

Following the previous analyses, river water samples taken from Dudvah River and Vah River as well as mineral waters, synthetic lake waters and synthetic wastewater as environment of designed sorption experiments were also subjected to physico-chemical characterization. In this context, parameters, such as pH, conductivity, water hardness (content of Ca and Mg; CCa+Mg), content of dissolved solids or presence of organic compounds (Table 3) and content of selected anions and cations (Table 4) were evaluated.
From the obtained results (Table 3), it can be concluded that studied waters were significantly different in analyzed parameters: pH value in the range 4.30–7.79, conductivity 0.054–1138 μS cm−1, water hardness (content of Ca and Mg; CCa+Mg) 0.19–10.1 mmol dm−3, content of dissolved solids 0.032–0.750 g dm−3, and the presence of organic compounds given by measured values of absorbances at wavelength 254 nm 0.000–0.865 (the value > 0.080 represents potential hazardous presence of organic compounds). This fact is important from the point of view of main aim of the work relating to finding the relationships between the sorption/desorption variables describing the stability of the bond sediment-dye and parameters describing the physico-chemical properties of the environment of real or model waters using the methods of multivariate analysis.
The determinations of inorganic dissolved anions by ion chromatography and cations-metals by stripping voltammetry were also carried out. In Table 4, the contents of analyzed anions and cations in river and model waters are summarized.

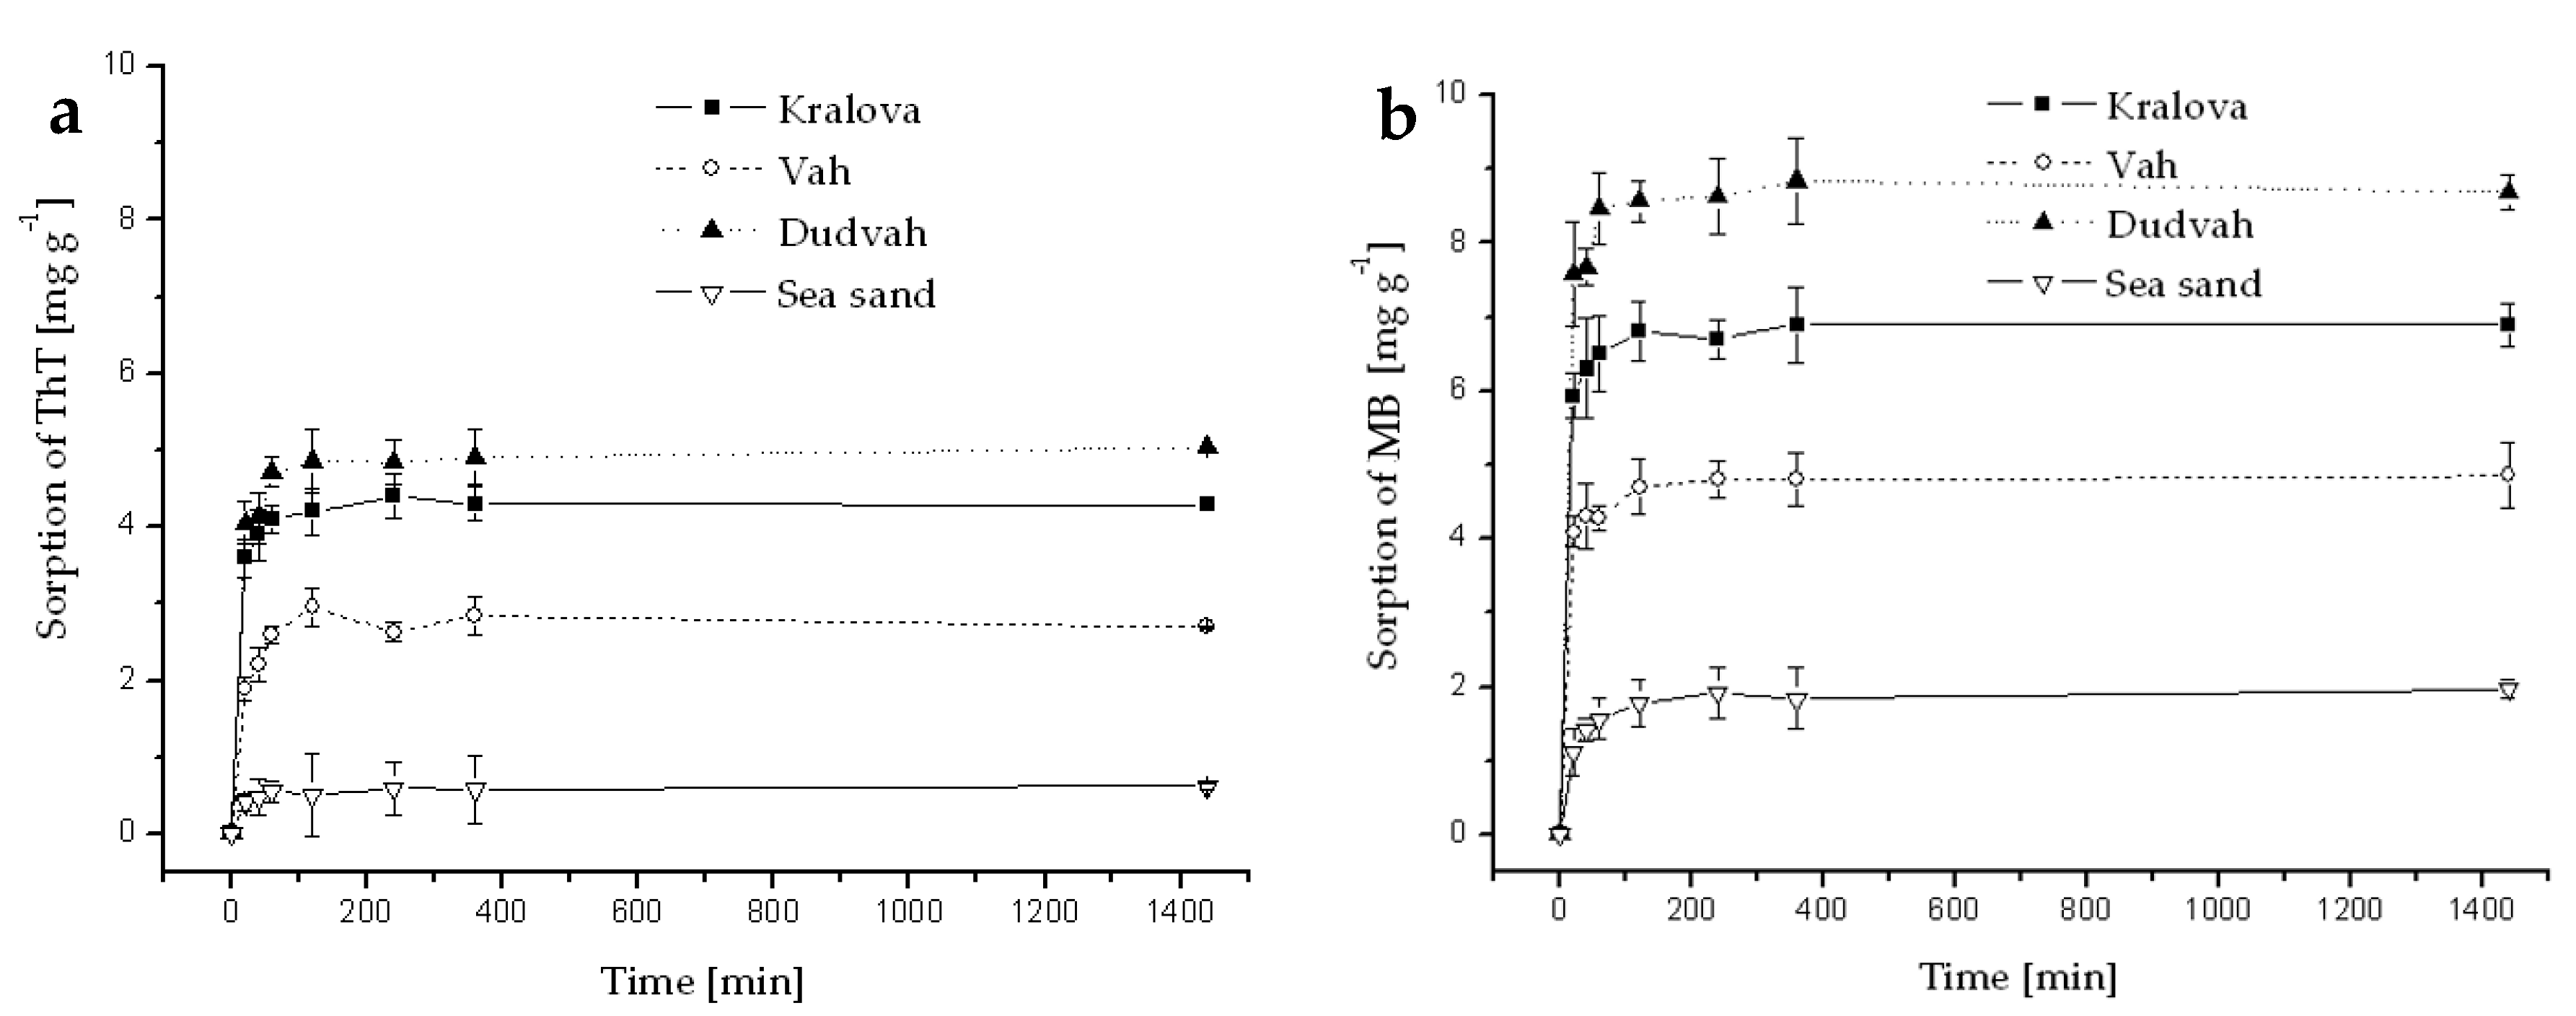
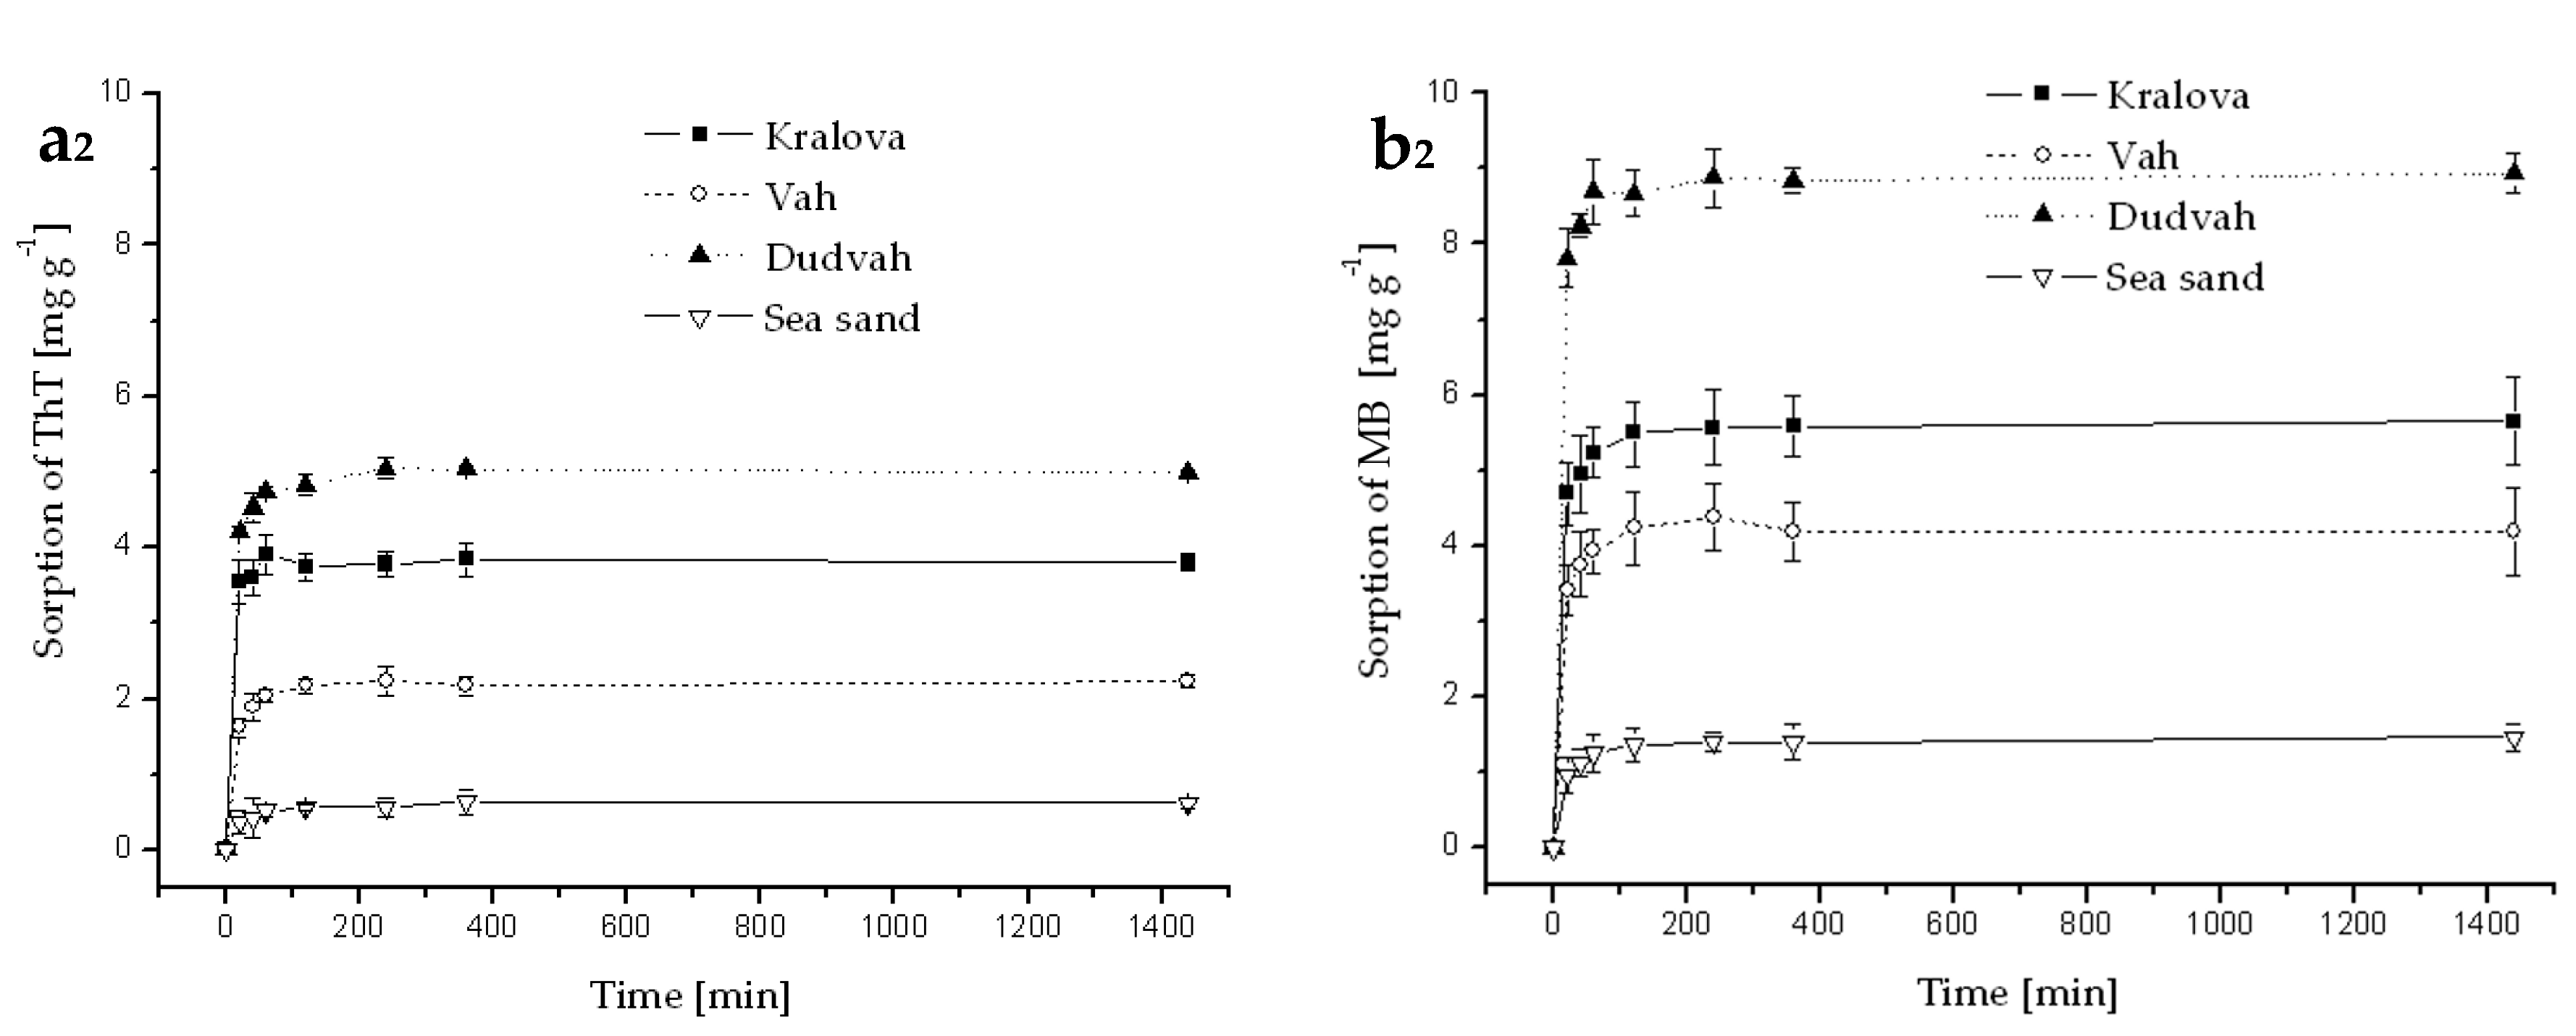
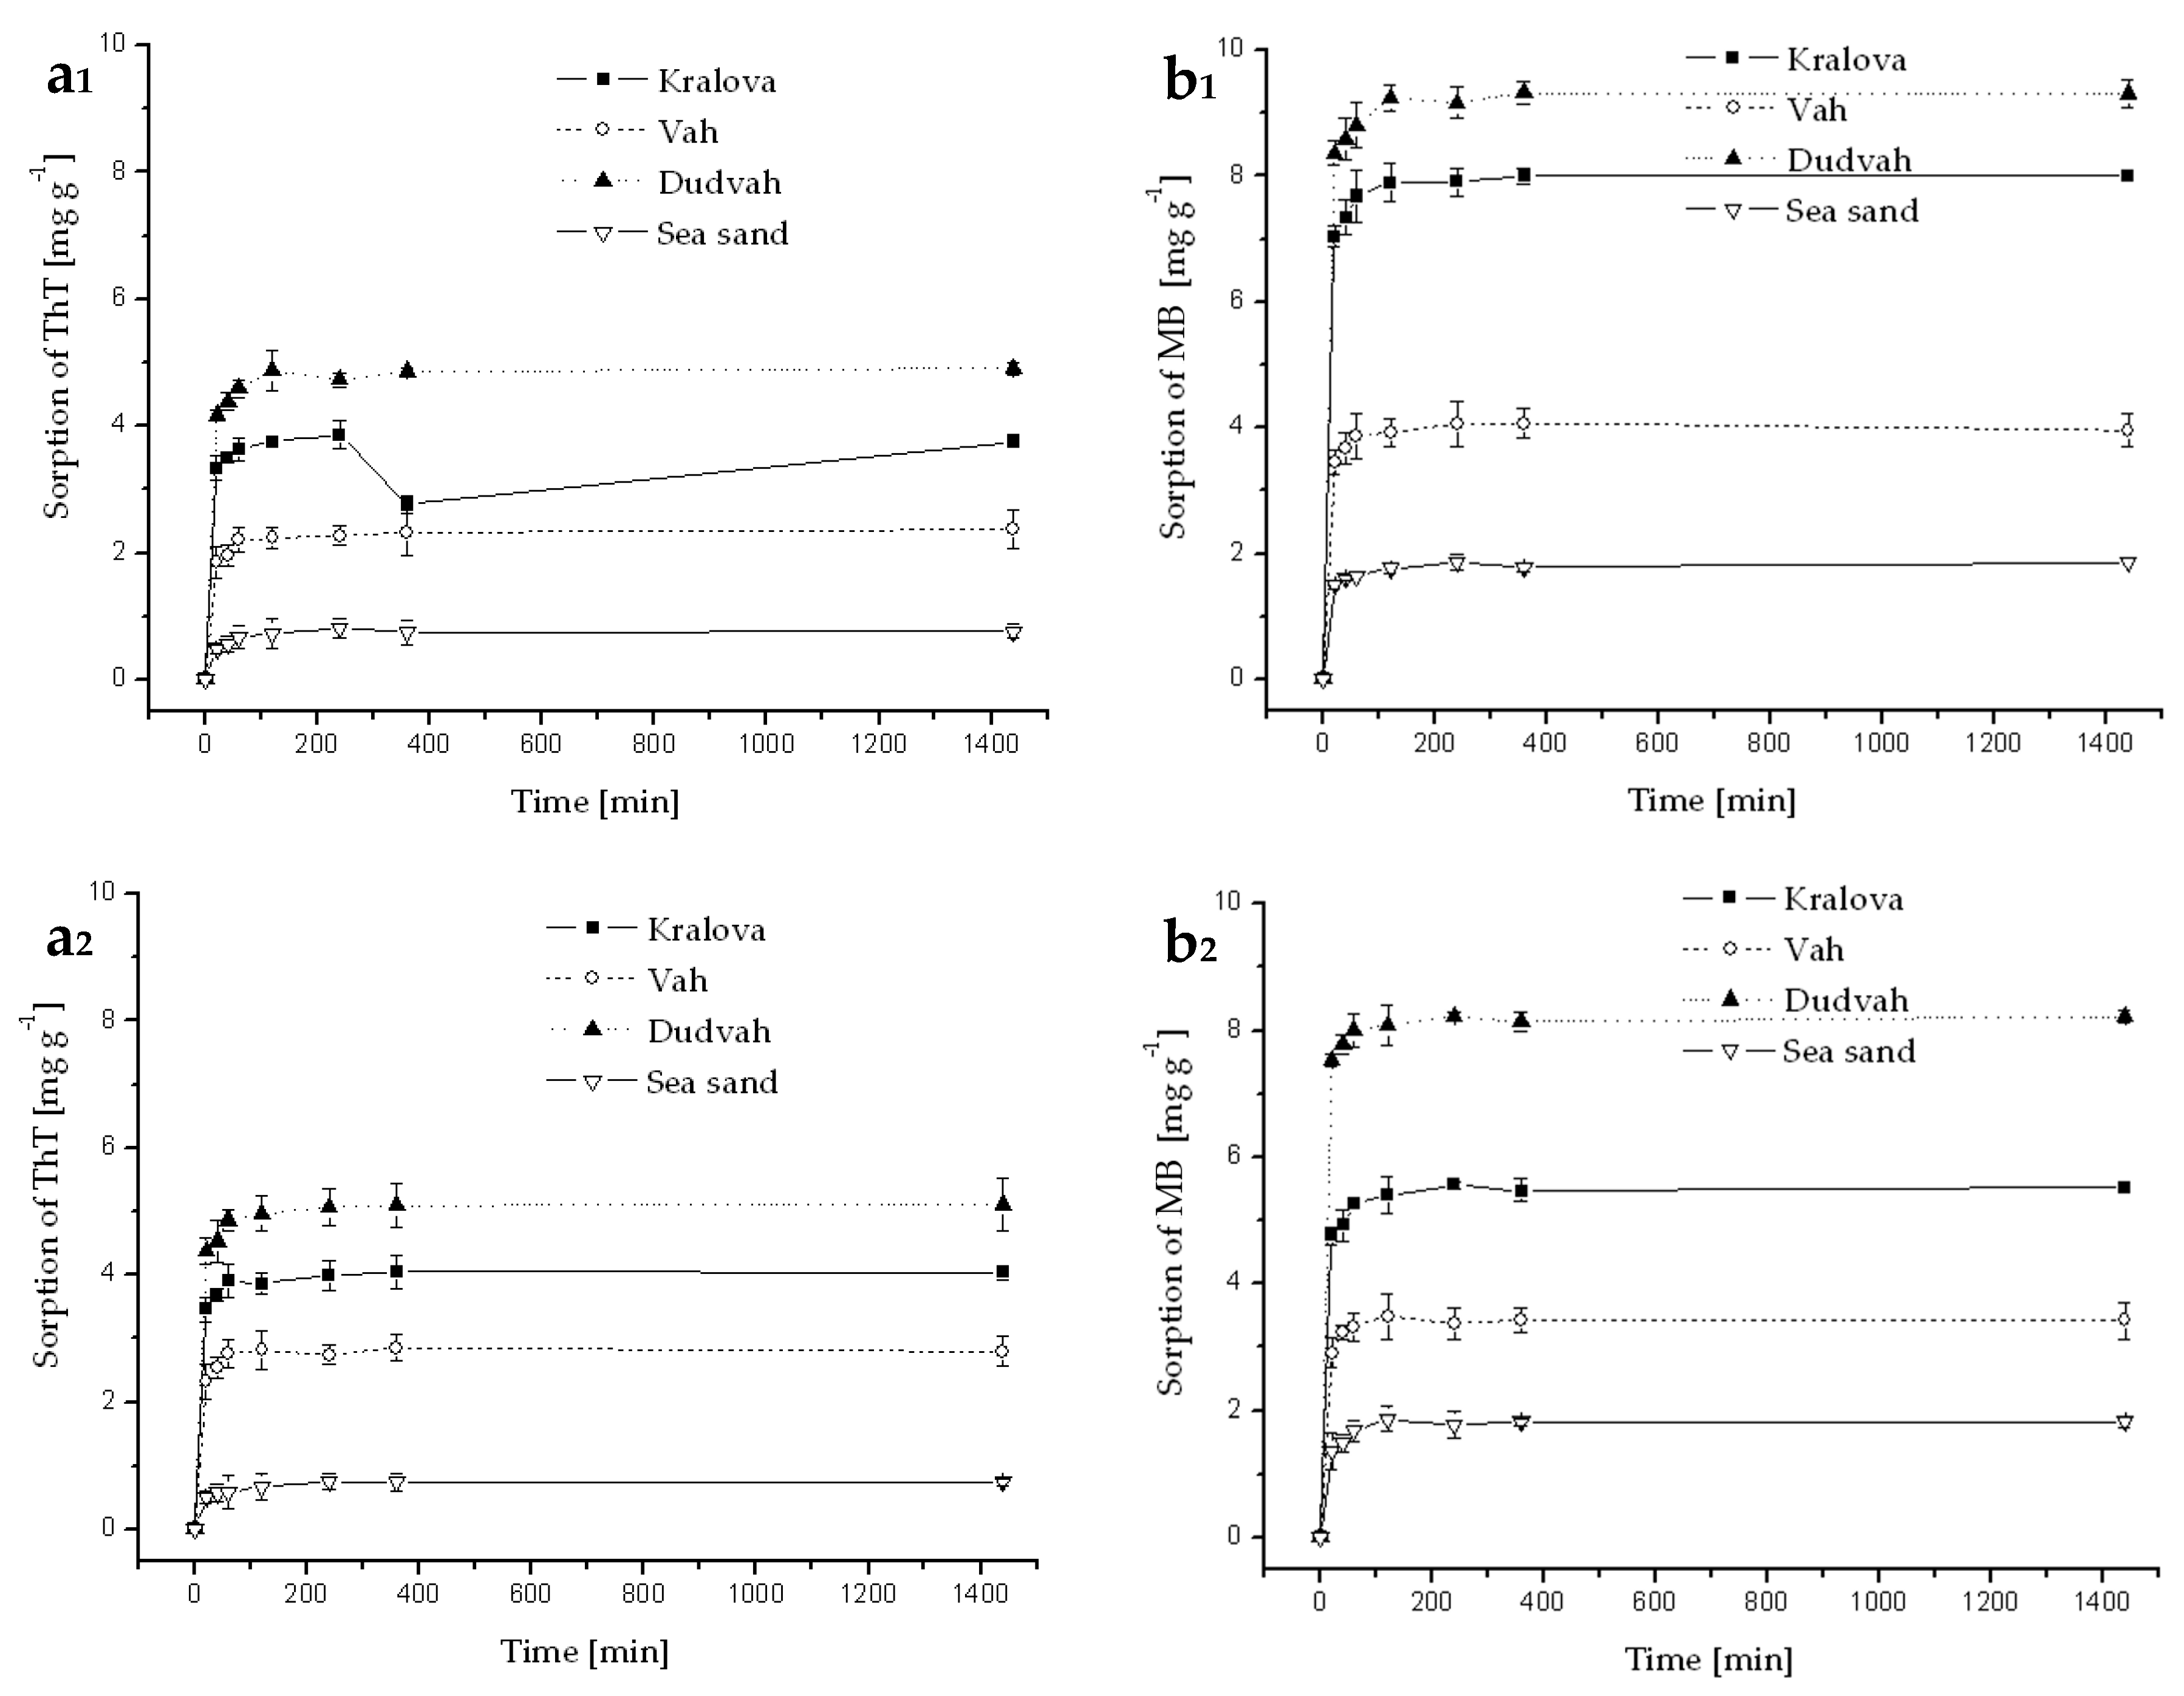
3.3. Sorption and Desorption of Dyes

With the aim to characterize the sorption processes of cationic dyes ThT and MB binding onto river sediments obtained from Dudvah River, Vah River, and water reservoir Kralova the relevant sorption experiments under batch conditions were carried out.
It was found that the sorption of ThT and MB dyes onto river sediments and sea sand (concentration of sediment 5 g dm−3) from deionized water, river waters (Dudvah and Vah River), mineral waters (Rajec and Miticka), synthetic lake waters (Esthwaite, Rostherne Mere, and Seathwaite Tarn) or synthetic wastewater containing C0 = 40 mg dm−3 ThT or MB was a rapid process when concentration equilibrium [dye]sediment:[dye]solution was reached within 2 h of interaction (Appendix B). The initial concentration of both dyes 40 mg dm−3 can be considered as equimolar concentration due to similar relative molecular mass of both dyes (Mr = 318.86 for ThT; Mr = 319.86 for MB). From the comparison of obtained values Qs of dyes ThT or MB sorption onto studied sediments and sea sand, it can be concluded that the affinity of matrices to benzothiazole dye ThT decreased in the order: sediment from Dudvah River (Qs = 5.03 ± 0.28 mg g−1; ±SD) > sediment from water reservoir Kralova (Qs = 3.85 ± 0.40 mg g−1) > sediment from Vah River (Qs = 2.70 ± 0.30 mg g−1) > sea sand (Qs = 1.16 ± 0.92 mg g−1). In the case of thiazine dye MB, the affinity of matrices to this dye decreased in the order: sediment from Dudvah River (Qs = 8.70 ± 0.42 mg g−1) > sediment from water reservoir Kralova (Qs = 5.85 ± 0.96 mg g−1) > sediment from Vah River (Qs = 4.31 ± 1.49 mg g−1) > sea sand (Qs = 1.89 ± 0.19 mg g−1). These results also revealed that MB sorption was minimally 1.5-times higher than ThT sorption at all experimental conditions. The maximum and minimum values of dye sorption Qs onto studied matrices obtained for different objects or processes are summarized in Table 5.
Also, the significant effect of environment defined by composition and physico-chemical characteristics of river or model waters on dye sorption was observed. The highest values of dye sorption Qs were found in the case of waters showing low value of conductivity, water hardness, (content of Ca and Mg) and content of dissolved solids. It can be explained by competitive effects between monovalent or bivalent cations occurring in the waters and dyes molecules with positive charge as well as saturation of binding sites on the sediment surface with cations.
As it was mentioned, sediment samples briefly treated with deionized water or 0.1 mol dm−3 HCl solution were also used in the experiments. This short-term washing of sediments caused a significant decrease in sediment ability to bind ThT and MB dyes in comparison with non-treated sediments.
The problem with organic xenobiotics, such as synthetic dyes, also consists in their high stability in the environment, especially in bottom sediments. From this reason, it is necessary to evaluate the remobilization of these compounds from river sediments to water column as well as their sequential releasing to the lower layers of sediments. In individual experiments, it was found that sorbed ThT and MB dyes were more released from the studied matrices under conditions represented by solution of 96% vol. ethanol (EtOH) in comparison with solution of 0.1 mol dm−3 HCl, however the desorption efficiency not exceeded 25% of the sorbed amount of dye (Table 5). Also, the effect of sediment origin and their physico-chemical characteristics on the reversibility of bond dye-sediment was observed. The choice of mentioned desorption agents was based on obtained results of other authors describing the sorption of dyes on sorbents of biological origin. Significant works were realized mainly in the case of methylene blue [38,39,40].
On the basis of results obtained from desorption experiments, it can be expected that the bond between ThT or MB dyes and river sediments and possibly other cationic synthetic dyes will be practically irreversible. It means that the further fate of these substances after their input into the aquatic systems and sediments will be probably determined by degradation processes carried out mainly by autochthonous microorganisms as well as photochemical reactions.

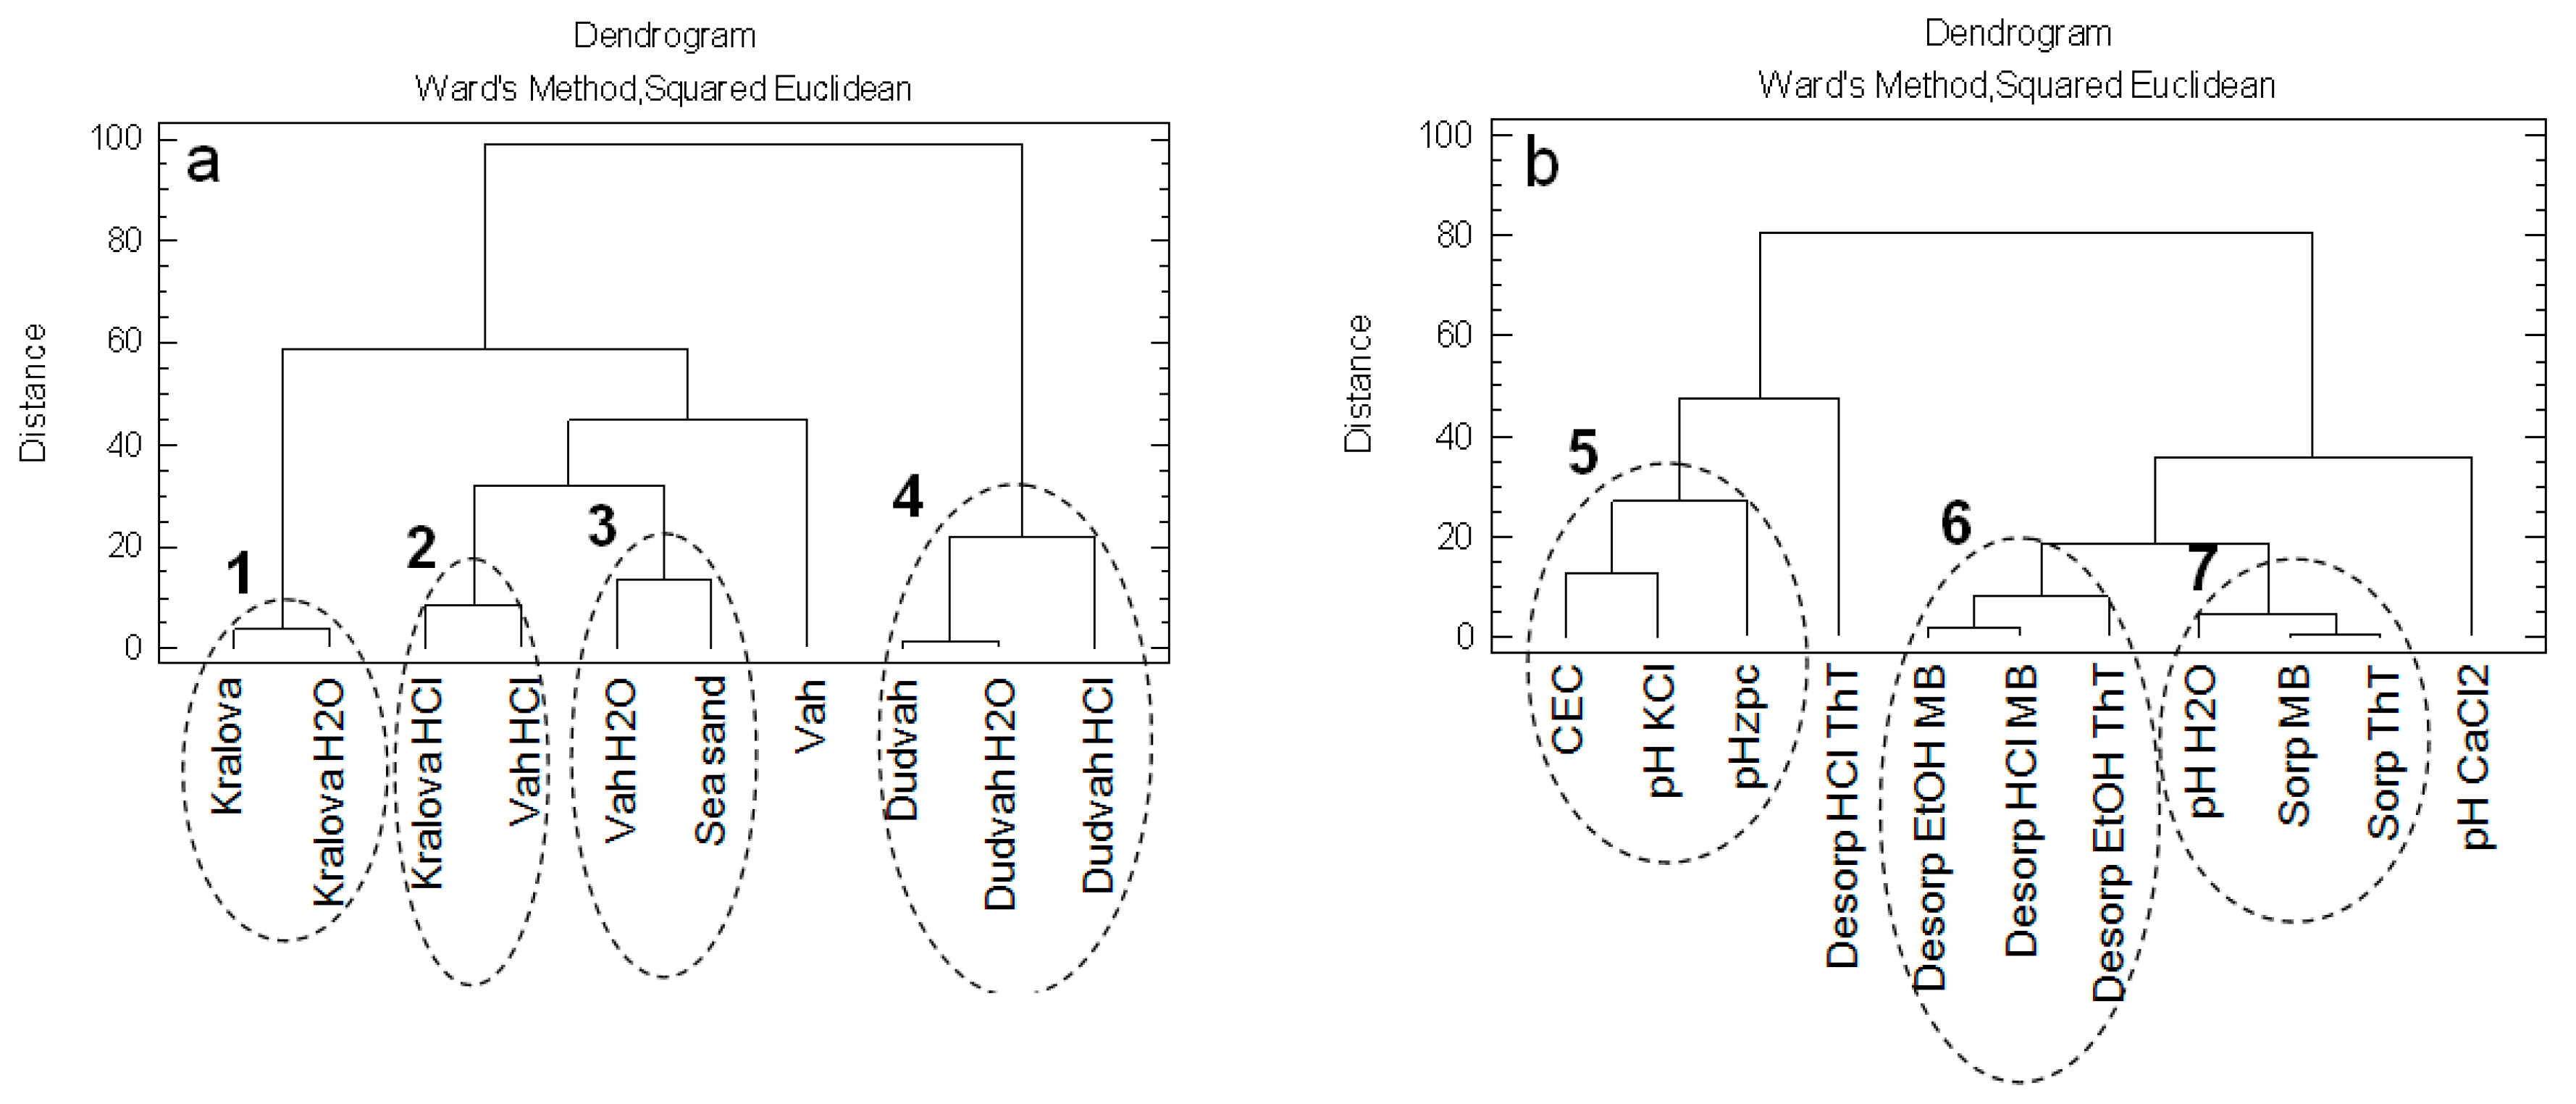
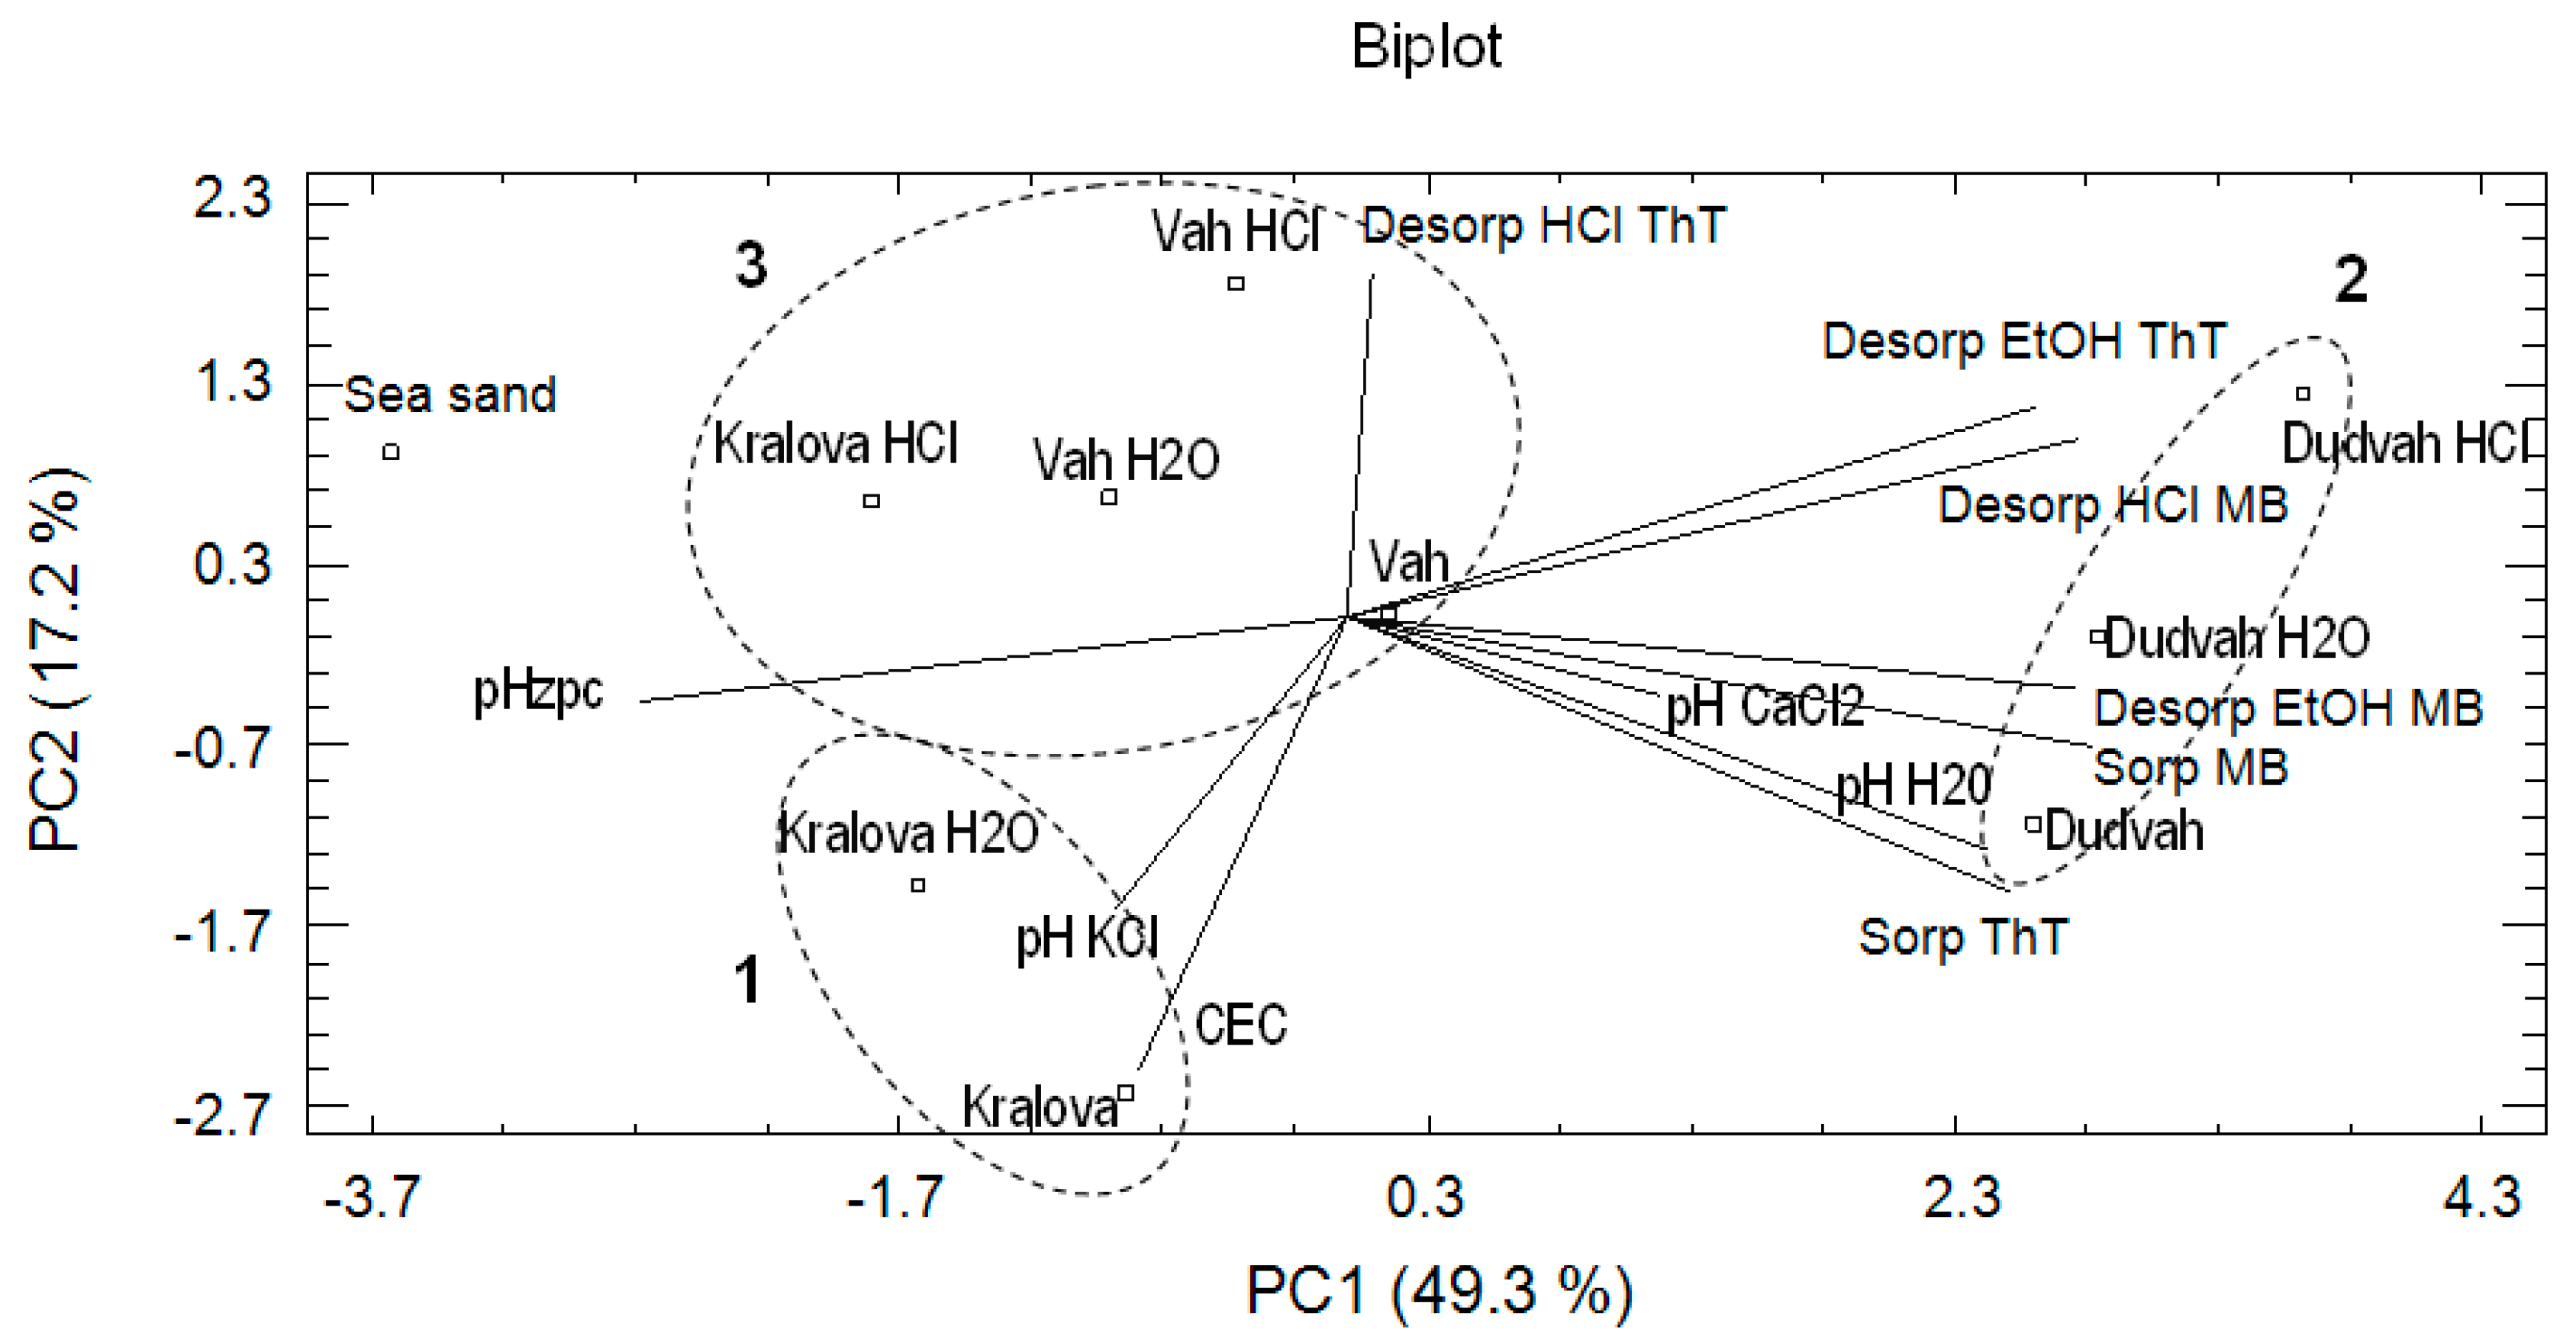
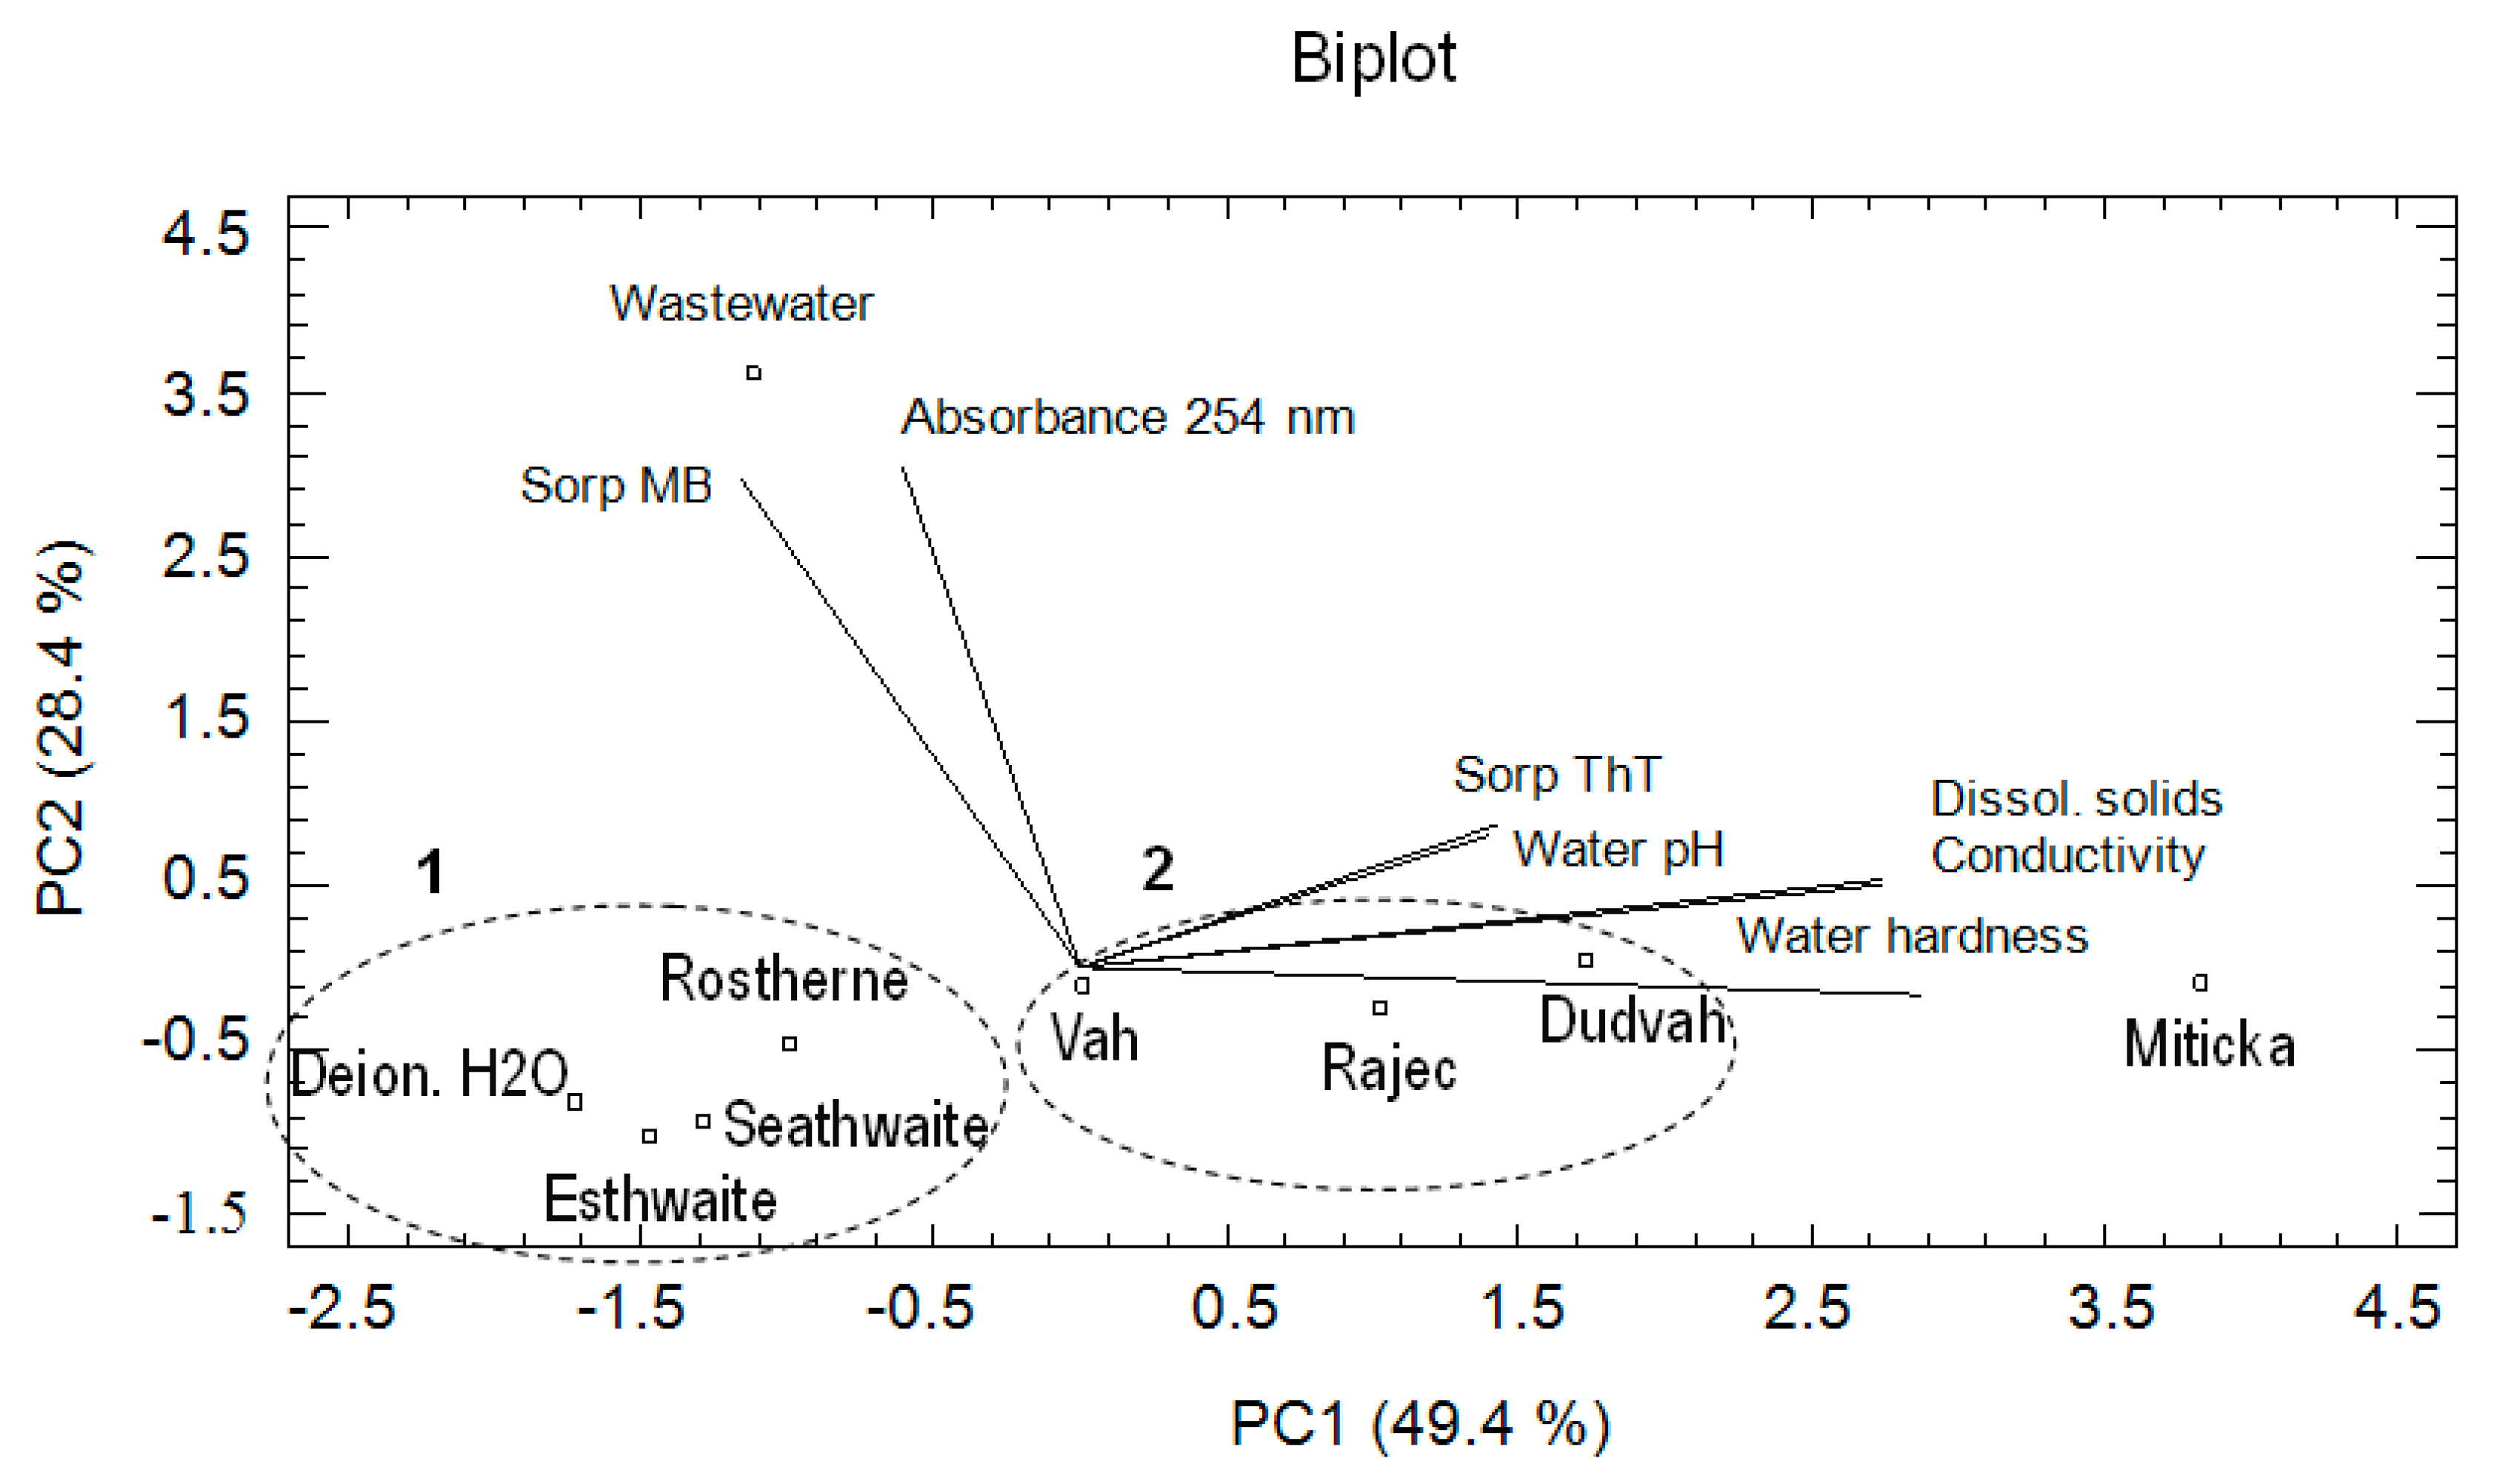
3.4. Chemometric Analysis of the Data

In this part of the work, obtained data describing the sorption/desorption characteristics of studied river sediments and sea sand in terms of ThT and MB dyes binding, their physico-chemical characteristics, as well as physico-chemical characteristics of the environment defined by river and model waters were analyzed by methods of multivariate analysis–cluster analysis (CA) and principal component analysis (PCA). Variables used in this way were identified as follows: Sorp ThT and Sorp MB–sorption of ThT and MB onto river sediments or sea sand; Desorp EtOH ThT, Desorp HCL ThT, Desorp EtOH MB and Desorp HCl MB–desorption efficiency for ThT or MB determined using desorption agent represented by solution of 96% vol. ethanol (EtOH) or solution of 0.1 mol dm−3 HCl; pHH2O, pHCaCl2 and pHKCl–pH values of river sediments or sea sand; pHzpc–pH value when matrix shows zero surface charge; CEC–cation-exchange capacity of river sediments or sea sand; pH, Conductivity and Water hardness–pH value, conductivity and water hardness of river or model water; Dissol. solids and Absorbance 254 nm–content of dissolved solids and presence of organic compounds in river or model waters. Studied objects were analyzed and compared river sediments obtained from Dudvah River (Dudvah), Vah River (Vah), and from the water reservoir Kralova (Kralova) non-treated or treated with 0.1 mol dm−3 HCl or deionized water (e.g., Dudvah HCl or Dudvah H2O) and chemically treated sea sand (Sea sand). Also, river waters (Dudvah and Vah) or model waters defined by deionized water (Deion. H2O), mineral waters (Rajec and Miticka), synthetic lake waters (Esthwaite, Rostherne, and Seathwaite) and synthetic wastewater (Wastewater) were compared as objects.
In the first data analysis, the evaluations of similarities between the studied matrices as objects and relationships between the variables describing the physico-chemical characteristics of studied matrices and their sorption/desorption characteristics for dyes binding were carried out. For these purposes, the cluster analysis (CA) with application of squared Euclidean distance and Ward’s method as aggregate rule was used. This analysis was successfully applied in the evaluation of similarities between 24 worldwide large drainage basins on the basis of hydrosedimentary, geomorphologic and climatic variables [31].
The CA with application of squared Euclidean distance degree of a variety and Ward’s method showed that non-treated and treated sediments obtained from Dudvah River were not similar to other studied matrices (cluster No. 4) (Figure 2a). Within the mentioned cluster no. 4, it was revealed that sediment washing with 0.1 mol dm−3 HCl solution probably caused significant changes on the sediment because the similarity of treated sediment with 0.1 mol dm−3 HCl was significantly lower with non-treated or treated sediments with deionized water. Also, significant changes in sorption/desorption properties of sediments obtained from water reservoir Kralova and Vah River for dyes binding were caused by their washing in 0.1 mol dm−3 HCl solution (cluster no. 2). Identified cluster no. 1 describes the similarity between non-treated sediment obtained from water reservoir Kralova and treated sediment in deionized water. Certain degree of similarity showed sediment obtained from Vah River and treated in deionized water with sea sand (cluster no. 3).
Mentioned CA was also used to evaluate the relationships between the obtained variables describing the physico-chemical characteristics of studied matrices and their sorption/desorption characteristics for dyes binding (Figure 2b). The sorption of both ThT and MB dyes significantly correlated with the pHH2O value of sediments determined in suspension with deionized water (cluster no. 7). Separate cluster (cluster no. 6) forms the data describing desorption of ThT and MB dyes realized by 96% vol. ethanol solution. Also, data describing sediment characteristics from the point of view of CEC, pHKCl and pHzpc values on the basis of specific similarity show a correlative relationship (cluster no. 5). This correlation clearly confirms the fact that CEC, pH and pHzpc values for sorbents or other matrices have significant effect on binding metal cations and molecules with positive charge as well.
For the comparison of results obtained from CA, experimental data were also evaluated by principal component analysis (PCA). PCA belongs to important statistical tools, which explains the variance and compositional patterns within large datasets. In PCA, the natural grouping of the studied object and evaluated variables can be seen as well. The eigenvectors determine the direction of maximum variability and the eigenvalues specify the variance in each direction. Eigenvalue > 1 is usually considered as a criterion for extraction of the principal components required to explain the sources of variance in the data. The eigenvalues provide the percentage of variance explained and the cumulative variance of the principal components (PCs). According to the calculated eigenvalues for our data, only three PCs were found important. The first three principal components explain 81.2% of the total variance: PC1 explains 49.3%, PC2 17.2%, and PC3 14.7%. The first component (PC1) offered the correlation between desorption MB by 96% vol. ethanol solution, desorption ThT by 96% vol. ethanol solution, desorption MB by 0.1 mol dm−3 HCl, pHH2O, pHzpc, sorption of ThT and sorption of MB. The second component (PC2) revealed the strong association between CEC, desorption ThT by 0.1 mol dm−3 HCl and sorption of ThT and the third component (PC3) showed the correlation between pHKCl, pHCaCl2 and desorption ThT by 0.1 mol dm−3 HCl. In Figure 3, the distribution or aggregation of river sediments as studied objects and the relationships between variables describing sorption/desorption characteristics of studied river sediments or sea sand for dyes binding and their physico-chemical characteristics can be identified by biplot (PC1 vs. PC2) association. Mentioned biplot confirms the similarity between non-treated sediment obtained from water reservoir Kralova and treated sediment in deionized water (PCA cluster no. 1) and the dissimilarity of non-treated and treated sediments obtained from Dudvah River to other analyzed sediments (PCA cluster no. 2) also identified in CA (Figure 2a). However, in this analysis, sea sand was significantly separated from other studied matrices. Sediments obtained from Vah River and sediment Kralova treated with 0.1 mol dm−3 HCl solution also formed cluster (PCA cluster no. 3).
The main reason of PCA application was to identify the relationships in terms of positive or negative correlations between the obtained variables. In the evaluation of PCA results, the angle between the vectors representing variables plays an important role. If the angle between the vectors is too low, it represents a positive (synergic) correlation between the studied variables. If the angle is close to 180° and vectors lie on opposite sides, it represents a negative (antagonistic) relationship between the variables. No correlation between the studied variables is observed if the vectors form a right angle. On the basis of these rules, the positive correlations were found between pHH2O value and ThT sorption (1); pHCaCl2, MB sorption and desorption MB by 96% vol. ethanol solution (2); and pHKCl and CEC values (3). On the other hand, no correlation was determined between CEC or pHKCl and pHCaCl2, pHH2O or ThT and MB sorption. PCA was also used by Liu et al. [41] to apportion sources of polycyclic aromatic hydrocarbons (PAHs) in surface sediments of the Huangpu River in Shanghai (China), whereby parameters defining PAHs characteristics as well as coal combustion, traffic-related pollution and spills of oil products were included in the analysis.
In consideration of the fact that sorption experiments were realized under conditions of obtained river waters or model waters defined by deionized water, mineral waters, synthetic lake waters, or synthetic wastewater, the analogous multivariate analyses for these waters as objects and their physico-chemical characteristics as variables were also carried out.
Figure 4a depicts CA results, which revealed a high degree of similarity between model waters imitating lake waters (Esthwaite, Rostherne Mere, Seathwaite Tarn) and deionized water (cluster no. 1). Also, the similarity between waters obtained from Dudvah and Vah River as well as mineral water Rajec (cluster no. 2) was found. Synthetic wastewater and mineral water Miticka showed dissimilarity to other studied waters. On the basis of obtained physico-chemical characteristics of both mentioned waters, it can be concluded that their difference with other studied waters can be connected with relative high values of conductivity and content of dissolved solids (in the case of mineral water Miticka) or with presence of organic compounds (in the case of synthetic wastewater).
The evaluation of relationships from the point of view of physico-chemical characteristics of waters (Figure 4b) showed that the highest degree of correlation was observed between the absorbance of water at 254 nm representing the presence of organic compounds and MB sorption by studied matrices under given environment defined by studied waters (cluster no. 3). Similar significant relationship was also confirmed for content of dissolved solids, conductivity and water hardness values (cluster no. 4). The correlation between ThT sorption and mentioned parameters was found to a lesser extent.
According to the calculated eigenvalues, three PCs were found important, when the first three principal components explain 94.4% of the total variance: PC1 explains 49.4%, PC2 28.4%, and PC3 16.6%. The PC1 showed the correlation between conductivity, content of dissolved solids and water hardness. The PC2 revealed the correlation among absorbance of water at 254 nm and MB sorption and the PC3 among water pH and ThT sorption. Obtained biplot (PC1 vs. PC2) revealed (Figure 5) that the similarities between the studied waters as objects on the basis of data characterizing the sorption affinities of matrices to ThT and MB dyes under conditions defined by mentioned waters and their physico-chemical characteristics were identical as in the case of CA. In this context, the similarity between the model waters imitating lake waters (Esthwaite, Rostherne Mere, Seathwaite Tarn) and deionized water (PCA cluster no. 1) was confirmed. A high degree of similarity also showed waters obtained from Vah or Dudvah River and mineral water Rajec (PCA cluster no. 2), but these waters were dissimilar with synthetic wastewater and mineral water Miticka.
In the case of evaluated variables, a high degree of positive correlation showed content of dissolved solids, conductivity and water hardness values. Similar correlations were also observed in the case of ThT sorption by studied matrices under conditions of studied waters and water pH value as well as between MB sorption and presence of organic compounds. The relationship between parameters, such as presence of organic compounds and water pH or ThT sorption values, was practically not identified.

4. Conclusions

The sorption of cationic dyes thioflavine T (ThT) and methylene blue (MB) as organic xenobiotics onto Slovakian river sediments obtained within the catchment area of Vah River (southwest Slovak Republic) was investigated by laboratory batch experiments. To find the factors affecting the sorption of studied synthetic dyes, the sampled river sediments were described on the basis of the physico-chemical characteristics, such as pH (determined by three methods), pHzpc, or cation-exchange capacity. Moreover, for the extension of studied objects as well as in terms of comparative study, the river sediments were treated in a deionized water or 0.1 mol dm−3 HCl solution. Heavy metals contamination of obtained sediments as well as the changes in sediment composition caused by sediment washing with deionized water or 0.1 mol dm−3 HCl solution were evaluated using X-ray fluorescence spectrometry. Used model solutions as an environment of realized sorption experiments representing deionized water, river water samples taken from Dudvah and Vah River, mineral waters, synthetic lake waters or synthetic wastewater were subjected to determine the values of pH, conductivity, water hardness or content of dissolved solids, and the presence of organic compounds. The determinations of inorganic dissolved anions by ion chromatography and cations–metals by stripping voltammetry were also carried out.
From the comparison of the maximum values of sorption capacities (Qs) for ThT or MB sorption onto studied sediments and sea sand, it was found that the affinity of matrices to benzothiazole dye ThT decreased in the order: sediment from Dudvah River (Qs = 5.03 ± 0.28 mg g−1; ±SD) > sediment from water reservoir Kralova (Qs = 3.85 ± 0.40 mg g−1) > sediment from Vah River (Qs = 2.70 ± 0.30 mg g−1) > sea sand (Qs = 1.16 ± 0.92 mg g−1). In the case of MB, the affinity of matrices to this thiazine dye decreased in the order: sediment from Dudvah River (Qs = 8.70 ± 0.42 mg g−1) > sediment from water reservoir Kralova (Qs = 5.85 ± 0.96 mg g−1) > sediment from Vah River (Qs = 4.31 ± 1.49 mg g−1) > sea sand (Qs = 1.89 ± 0.19 mg g−1). In general, the maximum values of dye sorption Qs were found for MB (minimally 1.5-times higher than in the case of ThT), sediment originated from Dudvah River, deionized water as experimental environment and for non-treated sediments. On the other hand, the minimum values of Qs were calculated for ThT, sea sand, mineral water (Miticka) as experimental environment and for sediments treated with 0.1 mol dm−3 HCl solution. In individual experiments, it was found that sorbed ThT and MB dyes were more released from the studied matrices under conditions represented by solution of 96% vol. ethanol (EtOH) in comparison with solution of 0.1 mol dm−3 HCl as desorption agents; however, the desorption efficiency not exceeded 25% of the sorbed amount of dye.
Obtained data were subjected to multivariate analysis for comparison of studied objects (river sediments or river and model waters) as well as in finding relationships between the variables describing the physico-chemical characteristics of studied matrices or waters and sorption/desorption characteristics of matrices for dyes binding. From the obtained results, it can be concluded that applied methods of multivariate analyses (cluster analysis and principal component analysis) represent a suitable tool for evaluation of sorption/desorption processes of organic xenobiotics binding in sediments studied by short-time laboratory batch experiments. These chemometric approaches can find hidden or in individual linear and non-linear descriptions of two or more parameters hard defining relationships between the studied objects as well as variables characterizing the processes e.g., transport or mobility of contaminants in individual environmental components.

Author Contributions

M.P. and M.H. conceived and designed the experiments; A.K. and M.B. performed the experiments; V.A. and M.V. analyzed the data; A.K. and M.H. wrote the paper.

Funding

This research was funded by [European Regional Development Fund] grant number [HUSK/1101/1.2.1/0148] and grant number [ITMS 26220220191].

Acknowledgments

This work was supported by the project of the Cross-border Co-operation Programme and co-financed with European Regional Development Fund (ERDF), the grant number HUSK/1101/1.2.1/0148 as well as the project of the Operational Program Research and Development and co-financed with European Regional Development Fund (ERDF), the grant number ITMS 26220220191. The authors want to thank to Daniela Mackových, Ph.D. for X-ray fluorescence spectrometric analysis and the Regional Public Health Authority of the Slovak Republic in Trnava for stripping voltammetry analysis.

Conflicts of Interest

The authors declare no conflict of interest. The founding sponsors had no role in the design of the study; in the collection, analyses, or interpretation of data; in the writing of the manuscript, and in the decision to publish the results.

Appendix A

Figure A1. Potentiometric titration curves obtained for river sediments originated from Dudvah River (a), Vah River (b), and from the water reservoir Kralova (c) non-treated or treated with 0.1 mol dm−3 HCl or deionized water and for chemically treated sea sand (3.0 g dm−3). Titration was performed with 0.1 mol dm−3 NaOH and 0.1 mol dm−3 NaCl as background electrolyte at 25 °C.
Separations 05 00057 g0a1aSeparations 05 00057 g0a1b

Appendix B

Figure A2. Kinetics of ThT (a) and MB (b) dye sorption onto river sediments and sea sand (concentration of sediment 5 g dm−3) from deionized water containing C0 = 40 mg dm−3 ThT or MB at initial pH = 7.1 and at 25 °C. Error bars represent standard deviation of the mean (n = 2).
Separations 05 00057 g0a2
Figure A3. Kinetics of ThT (a) and MB (b) dye sorption onto river sediments and sea sand (concentration of sediment 5 g dm−3) from river waters (Dudvah—index 1 and Vah River—index 2) containing C0 = 40 mg dm−3 ThT or MB at initial pH value mentioned in Table 3 for individual model waters and at 25 °C. Error bars represent standard deviation of the mean (n = 2).
Separations 05 00057 g0a3aSeparations 05 00057 g0a3b
Figure A4. Kinetics of ThT (a) and MB (b) dye sorption onto river sediments and sea sand (concentration of sediment 5 g dm−3) from mineral waters (Rajec—index 1 and Miticka—index 2) containing C0 = 40 mg dm−3 ThT or MB at initial pH value mentioned in Table 3 for individual model waters and at 25 °C. Error bars represent standard deviation of the mean (n = 2).
Separations 05 00057 g0a4
Figure A5. Kinetics of ThT (a) and MB (b) dye sorption onto river sediments and sea sand (concentration of sediment 5 g dm−3) from synthetic lake waters (Esthwaite—index 1, Rostherne Mere—index 2 and Seathwaite Tarn–index 3) containing C0 = 40 mg dm−3 ThT or MB at initial pH value mentioned in Table 3 for individual model waters and at 25 °C. Error bars represent standard deviation of the mean (n = 2).
Separations 05 00057 g0a5
Figure A6. Kinetics of ThT (a) and MB (b) dye sorption onto river sediments and sea sand (concentration of sediment 5 g dm−3) from synthetic wastewater containing C0 = 40 mg dm−3 ThT or MB at initial pH = 6.9 and at 25 °C. Error bars represent standard deviation of the mean (n = 2).
Separations 05 00057 g0a6

References

  1. Pointing, S.B. Feasibility of bioremediation by white-rot fungi. Appl. Microbiol. Biotechnol. 2001, 57, 20–33. [Google Scholar] [CrossRef] [PubMed]
  2. Lu, L.; Zhao, M.; Liang, S.C.; Zhao, L.Y.B.; Zhang, B.B. Production and synthetic dyes decolourization capacity of a recombinant laccase from Pichia pastoris. J. Appl. Microbiol. 2009, 107, 1149–1156. [Google Scholar] [CrossRef] [PubMed]
  3. Bhatnagar, A.; Jain, A.K. A comparative adsorption study with different industrial wastes as adsorbents for the removal of cationic dyes from water. J. Colloid Interface Sci. 2005, 281, 49–55. [Google Scholar] [CrossRef] [PubMed]
  4. Marungrueng, K.; Pavasant, P. Removal of basic dye (Astrazon Blue FGRL) using macroalga Caulerpa lentillifera. J. Environ. Manag. 2006, 78, 268–274. [Google Scholar] [CrossRef] [PubMed]
  5. Hessel, C.; Allegre, C.; Maisseu, M.; Charbit, F.; Moulin, P. Guidelines and legislation for dye house effluents. J. Environ. Manag. 2007, 83, 171–180. [Google Scholar] [CrossRef] [PubMed]
  6. Tao, Q.H.; Tang, H.X. Effect of dye compounds on the adsorption of atrazine by natural sediment. Chemosphere 2004, 56, 31–38. [Google Scholar] [CrossRef]
  7. Cengiz, S.; Cavas, L. Removal of methylene blue by invasive marine seaweed: Caulerpa racemosa var. cylindracea. Bioresour. Technol. 2008, 99, 2357–2363. [Google Scholar] [CrossRef]
  8. Scheytt, T.; Mersmann, P.; Lindstädt, R.; Heberer, T. Determination of sorption coefficients of pharmaceutically active substances carbamazepine, diclofenac, and ibuprofen, in sandy sediments. Chemosphere 2005, 60, 245–253. [Google Scholar] [CrossRef]
  9. Mutavdžić Pavlović, D.; Glavač, A.; Gluhak, M.; Runje, M. Sorption of albendazole in sediments and soils: Isotherms and kinetics. Chemosphere 2018, 193, 635–644. [Google Scholar] [CrossRef]
  10. Jiang, Y.; Yuan, L.; Liu, L.; Shi, L.; Guang, A.; Mu, Z. Bisphenol A in the Yellow River: Sorption characteristics and influential factors. J. Hydrol. 2018, 564, 307–313. [Google Scholar] [CrossRef]
  11. Lewandowski, K.K.; Cieślikiewicz, W.; Kobusińska, M.E.; Niemirycz, E. Sorption of pentachlorophenol (PCP) in the marine bottom sediments—Batch sorption experiment at varying pressure. Environ. Sci. Pollut. Res. 2018, 25, 10799–10807. [Google Scholar] [CrossRef] [PubMed]
  12. Mutavdžić Pavlović, D.; Ćurković, L.; Grčić, I.; Šimić, I.; Župan, J. Isotherm, kinetic, and thermodynamic study of ciprofloxacin sorption on sediments. Environ. Sci. Pollut. Res. 2017, 24, 10091–10106. [Google Scholar] [CrossRef] [PubMed]
  13. Li, J.; Zhang, H. Factors influencing adsorption and desorption of trimethoprim on marine sediments: Mechanisms and kinetics. Environ. Sci. Pollut. Res. 2017, 24, 21929–21937. [Google Scholar] [CrossRef] [PubMed]
  14. Navarro, A.; Endo, S.; Gocht, T.; Barth, J.A.; Lacorte, S.; Barcelo, D.; Grathwohl, P. Sorption of alkylphenols on Ebro River sediments: Comparing isotherms with field observations in river water and sediments. Environ. Pollut. 2009, 157, 698–703. [Google Scholar] [CrossRef]
  15. Chabukdhara, M.; Nema, A.K. Assessment of heavy metal contamination in Hindon River sediments: A chemometric and geochemical approach. Chemosphere 2012, 87, 945–953. [Google Scholar] [CrossRef] [PubMed]
  16. Brereton, R.G. Chemometrics: Applications of Mathematics and Statistics to Laboratory Systems; Ellis Horwood: Chichester, UK, 1990; 307p, ISBN 0-13-131350-9. [Google Scholar]
  17. Mrozik, W.; Kotłowska, A.; Kamysz, W.; Stepnowski, P. Sorption of ionic liquids onto soils: Experimental and chemometric studies. Chemosphere 2012, 88, 1202–1207. [Google Scholar] [CrossRef] [PubMed]
  18. Wajda, L.; Duda-Chodak, A.; Tarko, T.; Kamiński, P. Application of principal component analysis for the optimisation of lead(II) biosorption. World J. Microbiol. Biotechnol. 2017, 33, 193. [Google Scholar] [CrossRef] [PubMed]
  19. Horník, M.; Šuňovská, A.; Partelová, D.; Pipíška, M.; Augustín, J. Continuous sorption of synthetic dyes on dried biomass of microalga Chlorella pyrenoidosa. Chem. Pap. 2013, 67, 254–264. [Google Scholar] [CrossRef]
  20. Bachratá, M.; Šuňovská, A.; Horník, M.; Pipíška, M.; Augustín, J. Sorption of synthetic dyes onto river sediments: A laboratory study. Nova Biotechnol. Chim. 2013, 12, 12–29. [Google Scholar] [CrossRef]
  21. Smith, E.J.; Davison, W.; Hamilton-Taylor, J. Methods for preparing synthetic freshwaters. Water Res. 2002, 36, 1286–1296. [Google Scholar] [CrossRef]
  22. Bracklow, U.; Drews, A.; Vocks, M.; Kraume, M. Comparison of nutrients degradation in small scale membrane bioreactors fed with synthetic/domestic wastewater. J. Hazard. Mater. 2007, 144, 620–626. [Google Scholar] [CrossRef] [PubMed]
  23. Hoagland, D.R. Optimum nutrient solutions for plants. Science 1920, 52, 562–564. [Google Scholar] [CrossRef] [PubMed]
  24. Zhang, Y.; Liu, W.; Xu, M.; Zheng, F.; Zhao, M. Study of the mechanisms of Cu2+ biosorption by ethanol/caustic-pretreated baker’s yeast biomass. J. Hazard. Mater. 2010, 178, 1085–1093. [Google Scholar] [CrossRef] [PubMed]
  25. Turner, B.F.; Fein, J.B. Protofit: A program for determining surface protonation constants from titration data. Comput. Geosci. 2006, 32, 1344–1356. [Google Scholar] [CrossRef]
  26. ISO. ISO Standard Method STN No. 11260: Kvalita pôdy. Stanovenie výmennej kapacity katiónov a hodnoty nasýtenia zásadami pomocou roztoku chloride barnatého; ISO: Geneva, Switzerland, 2003. [Google Scholar]
  27. ISO. ISO Standard Method STN No. 10390: Kvalita pôdy. Stanovenie pH; ISO: Geneva, Switzerland, 2005. [Google Scholar]
  28. ISO. ISO Standard Method STN No. 6059: Kvalita vody. Stanovenie sumy vápnika a horčíka. Titračná metóda s EDTA; ISO: Geneva, Switzerland, 1999. [Google Scholar]
  29. Slovak Office of Standards, Metrology and Testing. Standard Method STN No. 75 7360: Kvalita vody. Stanovenie absorbancie; Slovak Office of standards, Metrology and Testing: Bratislava, Slovak Republic, 1991. [Google Scholar]
  30. Slovak Office of Standards, Metrology and Testing. Standard Method STN No. 75 7373: Kvalita vody. Stanovenie rozpustených látok; Slovak Office of standards, Metrology and Testing: Bratislava, Slovak Republic, 2007. [Google Scholar]
  31. Raux, J.; Copard, Y.; Laignel, B.; Fournier, M.; Masseï, N. Classification of worldwide drainage basins through the multivariate analysis of variables controlling their hydrosedimentary response. Glob. Planet. Change 2011, 76, 117–127. [Google Scholar] [CrossRef]
  32. Pansu, M.; Gautheyrou, J. Handbook of Soil Analysis—Mineralogical, Organic and Inorganic Methods; Springer: Heidelberg, Germany, 2006; 993p, ISBN 978-3-540-31211-6. [Google Scholar]
  33. Cornelissen, G.; Gustafsson, O.; Bucheli, T.D.; Jonker, M.T.O.; Koelmans, A.A.; Van Noort, P.C.M. Extensive sorption of organic compounds to black carbon, coal, and kerogen in sediments and soils: Mechanisms and consequences for distribution, bioaccumulation, and biodegradation. Environ. Sci. Technol. 2005, 39, 6881–6895. [Google Scholar] [CrossRef] [PubMed]
  34. Kabata-Pendias, A. Trace Elements in Soils and Plants, 4th ed.; CRC Press: Boca Raton, FL, USA, 2011; 548p, ISBN 978-1-420-09370-4. [Google Scholar]
  35. US EPA. Mid-Atlantic Integrated Assessment (MAIA) Estuaries, 1997–98: Summary Report; U.S. EPA: Research Triangle Park, NC, USA, 2002.
  36. Zaharescu, D.G.; Hooda, P.S.; Soler, A.P.; Fernandez, J.; Burghelea, C.I. Trace metals and their source in the catchment of the high altitude Lake Respomuso, Central Pyrenees. Sci. Total Environ. 2009, 407, 3546–3553. [Google Scholar] [CrossRef]
  37. Yin, H.; Gao, Y.; Fan, C. Distribution, sources and ecological risk assessment of heavy metals in surface sediments from Lake Taihu, China. Environ. Res. Lett. 2011, 6, 044012. [Google Scholar] [CrossRef] [Green Version]
  38. Binupriya, A.R.; Sathishkumar, M.; Kavitha, D.; Swaminathan, K.; Yun, S.E. Aerated and rotated mode decolorization of a textile dye solution by native and modified mycelial biomass of Trametes versicolor. J. Chem. Technol. Biot. 2007, 82, 350–359. [Google Scholar] [CrossRef]
  39. Vijayaraghavan, K.; Mao, J.; Yun, Y.S. Biosorption of methylene blue from aqueous solution using free and polysulfone-immobilized Corynebacterium glutamicum: Batch and column studies. Bioresour. Technol. 2008, 99, 2864–2871. [Google Scholar] [CrossRef] [PubMed]
  40. Malekbala, M.R.; Hosseini, S.; Yazdi, S.K.; Soltani, S.M.; Malekbala, M.R. The study of the potential capability of sugar beet pulp on the removal efficiency of two cationic dyes. Chem. Eng. Res. Des. 2012, 90, 704–712. [Google Scholar] [CrossRef]
  41. Liu, Y.; Chen, L.; Huang, Q.H.; Li, W.Y.; Tang, Y.J.; Zhao, J.F. Source apportionment of polycyclic aromatic hydrocarbons (PAHs) in surface sediments of the Huangpu River, Shanghai, China. Sci. Total Environ. 2009, 407, 2931–2938. [Google Scholar] [CrossRef] [PubMed]
Figure 1. Location of sampling sites within the catchment area of Vah River, southwest Slovak Republic (indication of borders: A—Austria; CZ—Czech Republic; H—Hungary; PL—Poland; UA—Ukraine). Sampling site no. 1 represents the water reservoir Kralova near the city of Sala; sampling site no. 2 Vah River nearby the mouth of Dudvah River to Vah River; and sampling site no. 3 Dudvah River.
Separations 05 00057 g001
Figure 2. Dendrograms showing clustering of: (a) non-treated and treated river sediments and sea sand as studied objects; (b) physico-chemical characteristics of studied matrices and their sorption/desorption characteristics for dyes binding as obtained variables.
Separations 05 00057 g002
Figure 3. Result of principal component analysis (PCA) describing the relationships between the studied objects (river sediments and sea sand) and correlations between the obtained variables.
Separations 05 00057 g003
Figure 4. Dendrograms showing the clustering of: (a) studied waters (river waters, deionized water, synthetic lake waters, mineral waters, or synthetic wastewater) as environment of sorption experiments; (b) physico-chemical characteristics of studied waters and dye sorption onto studied matrices.
Separations 05 00057 g004
Figure 5. Result of principal component analysis (PCA) describing the relationships between the waters (river waters, deionized water, synthetic lake waters, mineral waters, or synthetic wastewater) as environment of sorption experiments and correlations between the obtained variables.
Separations 05 00057 g005
Table 1. Composition of stock solutions for preparation of synthetic freshwaters according to work SMITH et al. [21].
Synthetic FreshwaterStock SolutionSolution CompositionConcentration g dm−3Solution Preparation *
Seathwaite Tarn water (pH = 4.3 χ = 276 µS cm−1)A1NaCl
MgCl2·6H2O
CaCl2
KCl
NaNO3
4.27
6.67
6.12
0.746
3.06
1 cm3
A2Na2SO45.971 cm3
A3AlCl3·6H2O
HCl
1.45
7 cm3 1 mol dm−3 HCl
1 cm3
Esthwaite water (pH = 6.6 χ = 137 µS cm−1)S1MgCl2·6H2O
CaCl2
Ca(NO3)2·4H2O
12.2
17.5
3.54
1 cm3
S2CaCO30.0187910 cm3
S3Na2SO4
KHCO3
NaHCO3
16.3
2.50
1.68
1 cm3
Rostherne Mere water (pH = 7.0 χ = 111 µS cm−1)H1CaCl2
Ca(NO3)2·4H2O
7.49
1.18
10 cm3
H2CaCO30.0916910 cm3
H3KHCO3
KH2PO4
0.751
0.408
10 cm3
H4NaHCO3
Na2SO4
2.27
2.81
10 cm3
H5MgSO4·7H2O10.010 cm3
* The volume of individual stock solutions for the preparation of 1 dm3 of synthetic freshwater in deionized water.
Table 2. Basic physico-chemical properties of studied matrices.
MatrixTreated withpHH2OpHCaCl2pHKClCEC meq/100 gpHzpc
DudvahNon-treated8.407.637.953.208.58
Deion. H2O8.447.607.972.888.61
0.1 mol dm−3 HCl8.447.637.992.887.48
VahNon-treated7.988.357.632.9310.5
Deion. H2O8.047.478.303.2010.6
0.1 mol dm−3 HCl7.197.387.494.008.63
KralovaNon-treated7.917.558.5612.69.78
Deion. H2O8.067.388.447.6010.2
0.1 mol dm−3 HCl7.247.107.374.0010.8
Sea sandNon-treated7.337.398.602.6010.8
River sediments obtained from Dudvah River (Dudvah), Vah River (Vah), and from the water reservoir Kralova (Kralova) non-treated or treated with 0.1 mol dm−3 HCl or deionized water (2 h exposure at the concentration of sediment 200 g dm−3) and chemically treated sea sand (sea sand). pHH2O, pHCaCl2, and pHKCl are the pH values of river sediments and sea sand determined according to ISO standard method no. 10390 [27] in a mixture of sediment with distilled water (pHH2O), 0.01 mol dm−3 CaCl2 (pHCaCl2) or 1 mol dm−3 KCl (pHKCl) solutions. CEC is cation-exchange capacity of river sediments and sea sand determined according to ISO standard method no. 11260 [26]. pHzpc (pH of Zero Point of Charge) is the pH value when matrix shows zero surface charge.
Table 3. Basic physico-chemical characteristics of environment defined by studied waters.
EnvironmentpHConductivity μS cm−1CCa+Mg mmol dm−3Dissolved Solids g dm−3Absorbance at 254 nm
Dudvah River water7.567184.440.6860.053
Vah River water7.184012.070.2860.076
Deion. H2O7.140.0540.190.0320.000
Esthwaite 16.601370.710.0540.007
Rostherne Mere 17.001111.290.2340.004
Seathwaite Tarn 14.302760.490.0380.001
Mineral water A 27.794342.800.2920.012
Mineral water B 37.20113810.10.7500.013
Wastewater 46.923560.510.2380.865
1. Synthetic freshwaters imitating the composition of water in lakes Esthwaite, Rostherne Mere and Seathwaite Tarn in the UK prepared according to Smith et al. [21]. 2. Mineral water commercially available under the trademark Rajec. 3. Mineral water commercially available under the trademark Miticka. 4. Synthetic wastewater prepared according to Bracklow et al. [22] with addition of microelements and heavy metals in qualitative and quantitative composition according to Hoagland medium [23].
Table 4. Content of selected anions and cations in river waters, deionized water, synthetic lake waters, mineral waters, or synthetic wastewater.
WaterAnions mg dm−3; ±SD
ClNO3SO42−CO32−HCO3H2PO4NO2F
Dudvah River water35.7 ± 1.020.7 ± 0.876.3 ± 2.2n.a.n.a.n.a.n.a.n.a.
Vah River water3.18 ± 0.102.32 ± 0.078.28 ± 0.29n.a.n.a.n.a.n.a.n.a.
Deion. H2On.a.n.a.n.a.n.a.n.a.n.a.n.a.n.a.
Esthwaite 115.51.8611.010.22.75n.a.n.a.n.a.
Rostherne Mere 147.923.658.050.020.72.90n.a.n.a.
Seathwaite Tarn 19.822.234.04n.a.n.a.n.a.n.a.n.a.
Mineral water A 24.30 ± 0.138.90 ± 0.2620.3 ± 0.7n.a.321n.a.< 0.010.10 ± 0.01
Mineral water B 317.7 ± 0.74.11 ± 0.1218.6 ± 0.5n.a.1370n.a.< 0.01n.a.
Wastewater 48.58n.a.18.2n.a.n.a.16.5n.a.n.a.
WaterCations/metals mg dm−3; * µg dm−3; ±SD
Cd2+Pb2+Cu2+Zn2+Ni2+Mg2+Ca2+Na+K+Al3+NH4+Fe2+Co2+Mn2+
Dudvah River watern.d.2.19 ± 0.06 *2.43 ± 0.08 *15.0 ± 0.4 *2.58 ± 0.06 *n.a.n.a.n.a.n.a.n.a.n.a.n.a.n.a.n.a.
Vah River watern.d.1.65 ± 0.05 *1.94 ± 0.05 *6.96 ± 0.19 *2.31 ± 0.07 *n.a.n.a.n.a.n.a.n.a.n.a.n.a.n.a.n.a.
Deion. H2On.a.n.a.n.a.n.a.n.a.n.a.n.a.n.a.n.a.n.a.n.a.n.a.n.a.n.a.
Esthwaite 1n.a.n.a.n.a.n.a.n.a.1.4613.75.750.98n.a.n.a.n.a.n.a.n.a.
Rostherne Mere 1n.a.n.a.n.a.n.a.n.a.9.8762.515.34.10n.a.n.a.n.a.n.a.n.a.
Seathwaite Tarn 1n.a.n.a.n.a.n.a.n.a.0.802.214.440.390.16n.a.n.a.n.a.n.a.
Mineral water A 2n.a.n.a.n.a.n.a.n.a.19.087.42.200.70n.a.< 0.02n.a.n.a.n.a.
Mineral water B 3n.a.n.a.n.a.n.a.n.a.10527127.62.30n.a.< 0.05n.a.n.a.n.a.
Wastewater 4n.a.n.a.20.4 *15.0 *n.a.4.05n.a.1.14 *6.91n.a.16.51.1774.3 *0.11
n.a.—not analyzed or not available data. n.d.—not determined by the given analytical method. * the value of concentration of cations/metals in µg dm−3. 1. Synthetic freshwaters imitating the composition of water in lakes Esthwaite, Rostherne Mere, and Seathwaite Tarn in the UK prepared according to Smith et al. [21]. 2. Mineral water commercially available under the trademark Rajec. 3. Mineral water commercially available under the trademark Miticka. 4. Synthetic wastewater prepared according to Bracklow et al. [22] with addition of microelements and heavy metals in qualitative and quantitative composition according to Hoagland medium [23].
Table 5. Maximum and minimum values of dye sorption Qs and desorption D% onto/from studied matrices obtained for different objects or processes.
Object/ProcessMaximum Qs ValuesMinimum Qs Values
DyeMBThT
SedimentSediment from Dudvah RiverSea sand
EnvironmentDeion. H2OMineral water B 1
Sediment treatmentNon-treatmentTreatment with 0.1 mol dm−3 HCl
Object/processMaximum D% valuesMinimum D% values
Desorption agent96% vol. Ethanol0.1 mol dm−3 HCl
SedimentDudvah RiverSea sand
1 Mineral water commercially available under the trademark Miticka.

