Abstract
Forensic fire debris analysis is an important part of fire investigation, and gas chromatography–mass spectrometry (GC-MS) is the accepted standard for detection of ignitable liquids in fire debris. While GC-MS is the dominant technique, comprehensive two-dimensional gas chromatography–mass spectrometry (GC×GC-MS) is gaining popularity. Despite the broad use of these techniques, their sensitivities are poorly characterized for petroleum-based ignitable liquids. Accordingly, we explored the limit of identification (LOI) using the protocols currently applied in accredited forensic labs for two 75% evaporated gasolines and a 25% evaporated diesel as both neat samples and in the presence of interfering pyrolysate typical of fire debris. GC-MSD (mass selective detector (MS)), GC-TOF (time-of-flight (MS)), and GC×GC-TOF were evaluated under matched conditions to determine the volume of ignitable liquid required on-column for correct identification by three experienced forensic examiners performing chromatographic interpretation in accordance with ASTM E1618-14. GC-MSD provided LOIs of ~0.6 pL on-column for both neat gasolines, and ~12.5 pL on-column for neat diesel. In the presence of pyrolysate, the gasoline LOIs increased to ~6.2 pL on-column, while diesel could not be correctly identified at the concentrations tested. For the neat dilutions, GC-TOF generally provided 2× better sensitivity over GC-MSD, while GC×GC-TOF generally resulted in 10× better sensitivity over GC-MSD. In the presence of pyrolysate, GC-TOF was generally equivalent to GC-MSD, while GC×GC-TOF continued to show 10× greater sensitivity relative to GC-MSD. Our findings demonstrate the superior sensitivity of GC×GC-TOF and provide an important approach for interlaboratory benchmarking of modern instrumental performance in fire debris analysis.
1. Introduction
The purpose of forensic science is to assist the court in assessing the significance of a piece of evidence by interpreting the findings of a scientific examination of exhibit material. One of many considerations when weighing the results of a forensic examination is an understanding of how much target analyte must be present in an exhibit for conclusive identification of its presence (the sensitivity of the technique). Forensic fire debris analysis is the examination of exhibit material for the presence of ignitable liquids, and in this context an understanding of sensitivity is especially important. This is because the most frequently observed ignitable liquids are petroleum products [1,2], but petroleum products are also ubiquitous in our environment due to their widespread use in manufactured goods and their sale as consumer products [3,4,5,6,7]. Ignitable liquids may also be present in an exhibit due to the surrounding environment, since they are composed of volatile organic compounds which can evaporate from one location and condense in another (e.g., the collection of gasoline residues by materials exposed to automotive exhaust) [8,9,10,11]. Excessive sensitivity in an analysis can result in the assignment of inappropriately high significance to insignificant amounts of ignitable liquid [5].
Despite the need to limit sensitivity to forensically significant levels for exhibits selected through general fire investigation methods, there remains a long-acknowledged gap between the sensitivity of laboratory methods and accelerant detecting canines used to locate exhibits at the scene [12,13,14,15]. This persistent gap has led canine handlers to present the animal’s indications at the scene to the court without the necessary laboratory confirmation, which has resulted in vigorous debate within the courts [15,16]. Modern analytical techniques can help close this gap by offering increased sensitivity in cases where canines have been used to select exhibits, but the sensitivity must still be controlled for traditionally selected exhibits. To address both situations, the sensitivity of the analytical process must be understood. Unfortunately, most literature studies into the sensitivity of methods for forensic fire debris analysis exist in outdated literature, assess sensitivity non-quantitatively by relation to other techniques, evaluate less mainstream techniques, or do not assess sensitivity by identification of the ignitable liquid as a whole [10,12,17,18,19,20]. Since the techniques and instruments available for fire debris analysis have advanced significantly over the last two decades [21,22,23,24], an investigation into the sensitivity offered by modern analytical tools is required.
2. Materials and Methods
2.1. Materials and Reagents
Fuels were purchased from two Edmonton area service stations. One regular gasoline (rated 87 octane) was obtained from an Esso service station in 2009. An aliquot was transferred into a GC vial and manually evaporated under a high purity nitrogen stream (Praxair, Edmonton, AB, Canada) until 75% of the original volume was lost. The vial was then sealed, wrapped with Teflon tape, and stored in a dark and cool area. Before use, its condition was confirmed through examination of its physical characteristics (light yellow color, clear with no resinous deposits or precipitates) and a preliminary GC-MS analysis. A second regular gasoline (rated 87 octane) and a diesel were purchased in March 2015 from a 7-Eleven service station. Aliquots of the second gasoline and diesel were transferred into GC vials, placed into a heated 24-well evaporator (Cole-Parmer, Montreal, QC, Canada), and evaporated with high purity nitrogen gas until 75% of the original gasoline volume and 25% of the original diesel volume were lost.
2.2. Sample Dilution Scheme
Each weathered ignitable liquid was diluted using GC-MS grade SupraSolvTM dichloromethane (EMD Millipore, Burlington, MA, USA) following the scheme in Table 1. Aliquots for dilution were delivered from the sample listed under “Source Vial” using calibrated glass micropipettes (Drummond Scientific, Broomall, PA, USA) into vials pre-filled with diluent delivered from an eVol® calibrated autopipette (SGE, Ringwood, Victoria, Australia). Vials were kept chilled in crushed dry ice (Praxair, Edmonton, AB, Canada) to limit losses of volatile solvent. A second set of dilutions was prepared using dichloromethane doped with 50 μL/mL of an equal mixture of spruce plywood subfloor, black foam underlay, and nylon carpet pyrolysates as diluent. The pyrolysates were generated using an in-house method. The resulting sets of diluted samples (both neat and with pyrolysates) were distributed by 50 μL aliquots into three sets of GC vials with annealed 200 μL glass inserts, one set for each instrumental platform evaluated. Note that low concentration samples were analyzed in triplicate on each platform to ensure the reproducibility of any borderline result during interpretation.

Table 1.
Serial dilution scheme used to produce samples for analysis, starting from a vial containing the neat ignitable liquid. The source vial refers to the concentration of the vial being aliquoted. The aliquot from source vial column lists the volume taken for dilution. The volume of standard in aliquot column lists the resulting absolute volume of ignitable liquid contained in the aliquot. The diluent column refers to the amount of solvent or pyrolysate-doped solvent added to the aliquot, and the resulting concentration column refers to the final concentration of the sample produced in each row.
2.3. General Instrumental Analysis
Chromatographic and mass spectrometric conditions were matched as closely as possible to ensure a fair comparison. All separations were performed on one column configuration: a first length of 5% phenyl capillary column with a nominal length of 30 m (actual length ~26 m), connected to a second length of poly(ethylene glycol) wax capillary column with a measured length of 1.23 m. Both columns had a 0.25 mm inner diameter and a 0.25 μm film thickness, and were connected via an SGE Siltite μUnion (SGE, Ringwood, Victoria, Australia). All chromatography was performed with helium (5.0 grade; Praxair, Edmonton, AB, Canada) as carrier gas under speed-optimized flow conditions (2.0 mL/min based on the column geometry) [25], and temperature programmed under optimum heating rate (10 °C/tm; tm = column void time, min) [26] for each system. The mass spectrometers were operated in electron impact mode at a potential of 70 eV with freshly cleaned ion sources to ensure optimum ion yield. Mass spectrometers were tuned according to the manufacturers’ respective criteria prior to use. During operation, the detector voltages were offset by a magnitude of +200 V relative to the tune voltage, and the mass range was set from 25 m/z to 500 m/z. For both 1D GC methods spectra were acquired at a rate of 10 spectra/s, while the GC×GC method acquired at 200 spectra/s. In all cases, the mass spectrometer filaments were turned off at the start time of the solvent peak and turned back on at the end time of the solvent peak. All sample injections (1 μL) were performed by an Agilent 7683A auto sampler into a split/splitless injector operated at a split ratio of 1:80 and a temperature of 250 °C.
Ignitable liquid standards analyzed by each technique are presented in Table 2 and were analyzed in order of lowest concentration to highest concentration to minimize the risk of sample contamination via carryover. Triplicate injections were performed from three separately prepared vials to avoid concerns of samples concentrating between injections by loss of solvent through punctured vial septa.

Table 2.
The scheme used for analysis of the ignitable liquid standards, showing concentration in-vial, the nominal on-column volume after injection, and the number of injections performed at each concentration on each instrument. This scheme was followed for the pure ignitable liquid dilutions, and repeated for the pyrolysate-doped series. N/A represents concentrations not analyzed on those respective instruments.
2.4. GC-MSD Analysis
Analysis of the ignitable liquid standards in Table 2 was performed using an Agilent 7890A gas chromatograph with a 5975C quadrupole mass spectrometer (Agilent Technologies, Mississauga, ON, Canada). Data acquisition was performed with the Agilent MassHunter Workstation version B.07.00 (build 7.0.7024.0), while data interpretation was performed with ChemStation version E.02.02.1431 (Agilent).
2.5. GC-TOF Analysis
Analysis of the ignitable liquid standards in Table 2 was performed using a Pegasus 4D GC×GC-TOF (LECO, St. Joseph, MI, USA) composed of an Agilent 7890A gas chromatograph with a secondary oven operated at the same temperature as the primary oven, and the stationary quad-jet dual-stage modulator disabled. In this configuration, the Pegasus 4D operates as a 1D GC-TOF. Data acquisition was performed with ChromaTOF® version 4.51.6.0, while data interpretation was performed with ChromaTOF® version 4.71.0.0 (LECO).
2.6. GC×GC-TOF Analysis
Analysis of the ignitable liquid standards in Table 2 was performed using the Pegasus 4D GC×GC-TOF described in Section 2.5, but operated with the secondary oven offset by +5 °C relative to the primary oven, and with the modulator in operation using liquid nitrogen as coolant. The modulation period of 1.3 s was selected with assistance from the LECO GC×GC Column Calculator based on an approximate 1D peak width of 8 s, and a desired modulation ratio of 4–5. Data acquisition and interpretation were performed as described in Section 2.5.
2.7. Interpretation of Results
Chromatographic interpretation was performed by a forensic examiner with several years of casework experience with the Royal Canadian Mounted Police, and then peer reviewed independently by two other forensic examiners. Collectively, the examiners have 48 years of experience in forensic fire debris casework. Interpretation proceeded from a visual inspection of the total ion chromatogram (TIC), to inspection of the summed extracted ion chromatograms (EICs) for the alkane, cycloalkane, aromatic, indane, and naphthalene compound classes. Each EIC was generated by summation of the ions in Table 3. Classification criteria used for each identification was in accordance with the parameters set out in the ASTM E1618-14 standard [27] and the amplified criteria presented in the Supplementary Materials Sections SI.1 and SI.2.

Table 3.
List of characteristic ions which are summed and/or overlaid to generate EICs during examination of sample data for interpretation [6,28].
Identification of each peak was achieved by either mass spectral matching to the NIST 11 library (NIST, Gaithersburg, MD, USA) with comparison to known ignitable liquid standards, or by visual inspection relative to known peak groupings accompanied by correct relative ratios of at least three characteristic ions in Table 3 in comparison to known ignitable liquid standards.
3. Results
3.1. General Criteria for Identification of Ignitable Liquids
The ASTM E1618-14 standard [27] provides a good description of the criteria for the classification of ignitable liquids, which is not reproduced here. Other more thorough treatments of ignitable liquid identification are available [29], and forensic examiners also typically establish their own refined criteria based on the peer review process, their shared experience from casework, and from collecting ignitable liquid standards. The resulting amplified criteria used for the identification of gasoline and diesel in this work are detailed in the Supplementary Materials. Please note that, although interpretation of 2D chromatographic data for fire debris analysis has been reported in the literature [30], there are no official ASTM guidelines specific to 2D data at this time. We applied the same general approach described by ASTM E1618-14 for interpreting 1D data when evaluating the 2D data, with the addition of using the structured retention information provided by the 2D separation as an additional point of comparison to reference ignitable liquid standards. A summary of the interpretive results is presented in Table 4.

Table 4.
Color-coded results of the interpretation.
3.2. Results of Interpretation of GC-MSD Analyses
The full chromatographic data resulting from the GC-MSD analysis are presented on Pages 4–137 of the Supplementary Materials.
3.2.1. GC-MSD Analysis of Gasoline (Sections SI.3 Pages 27–70)
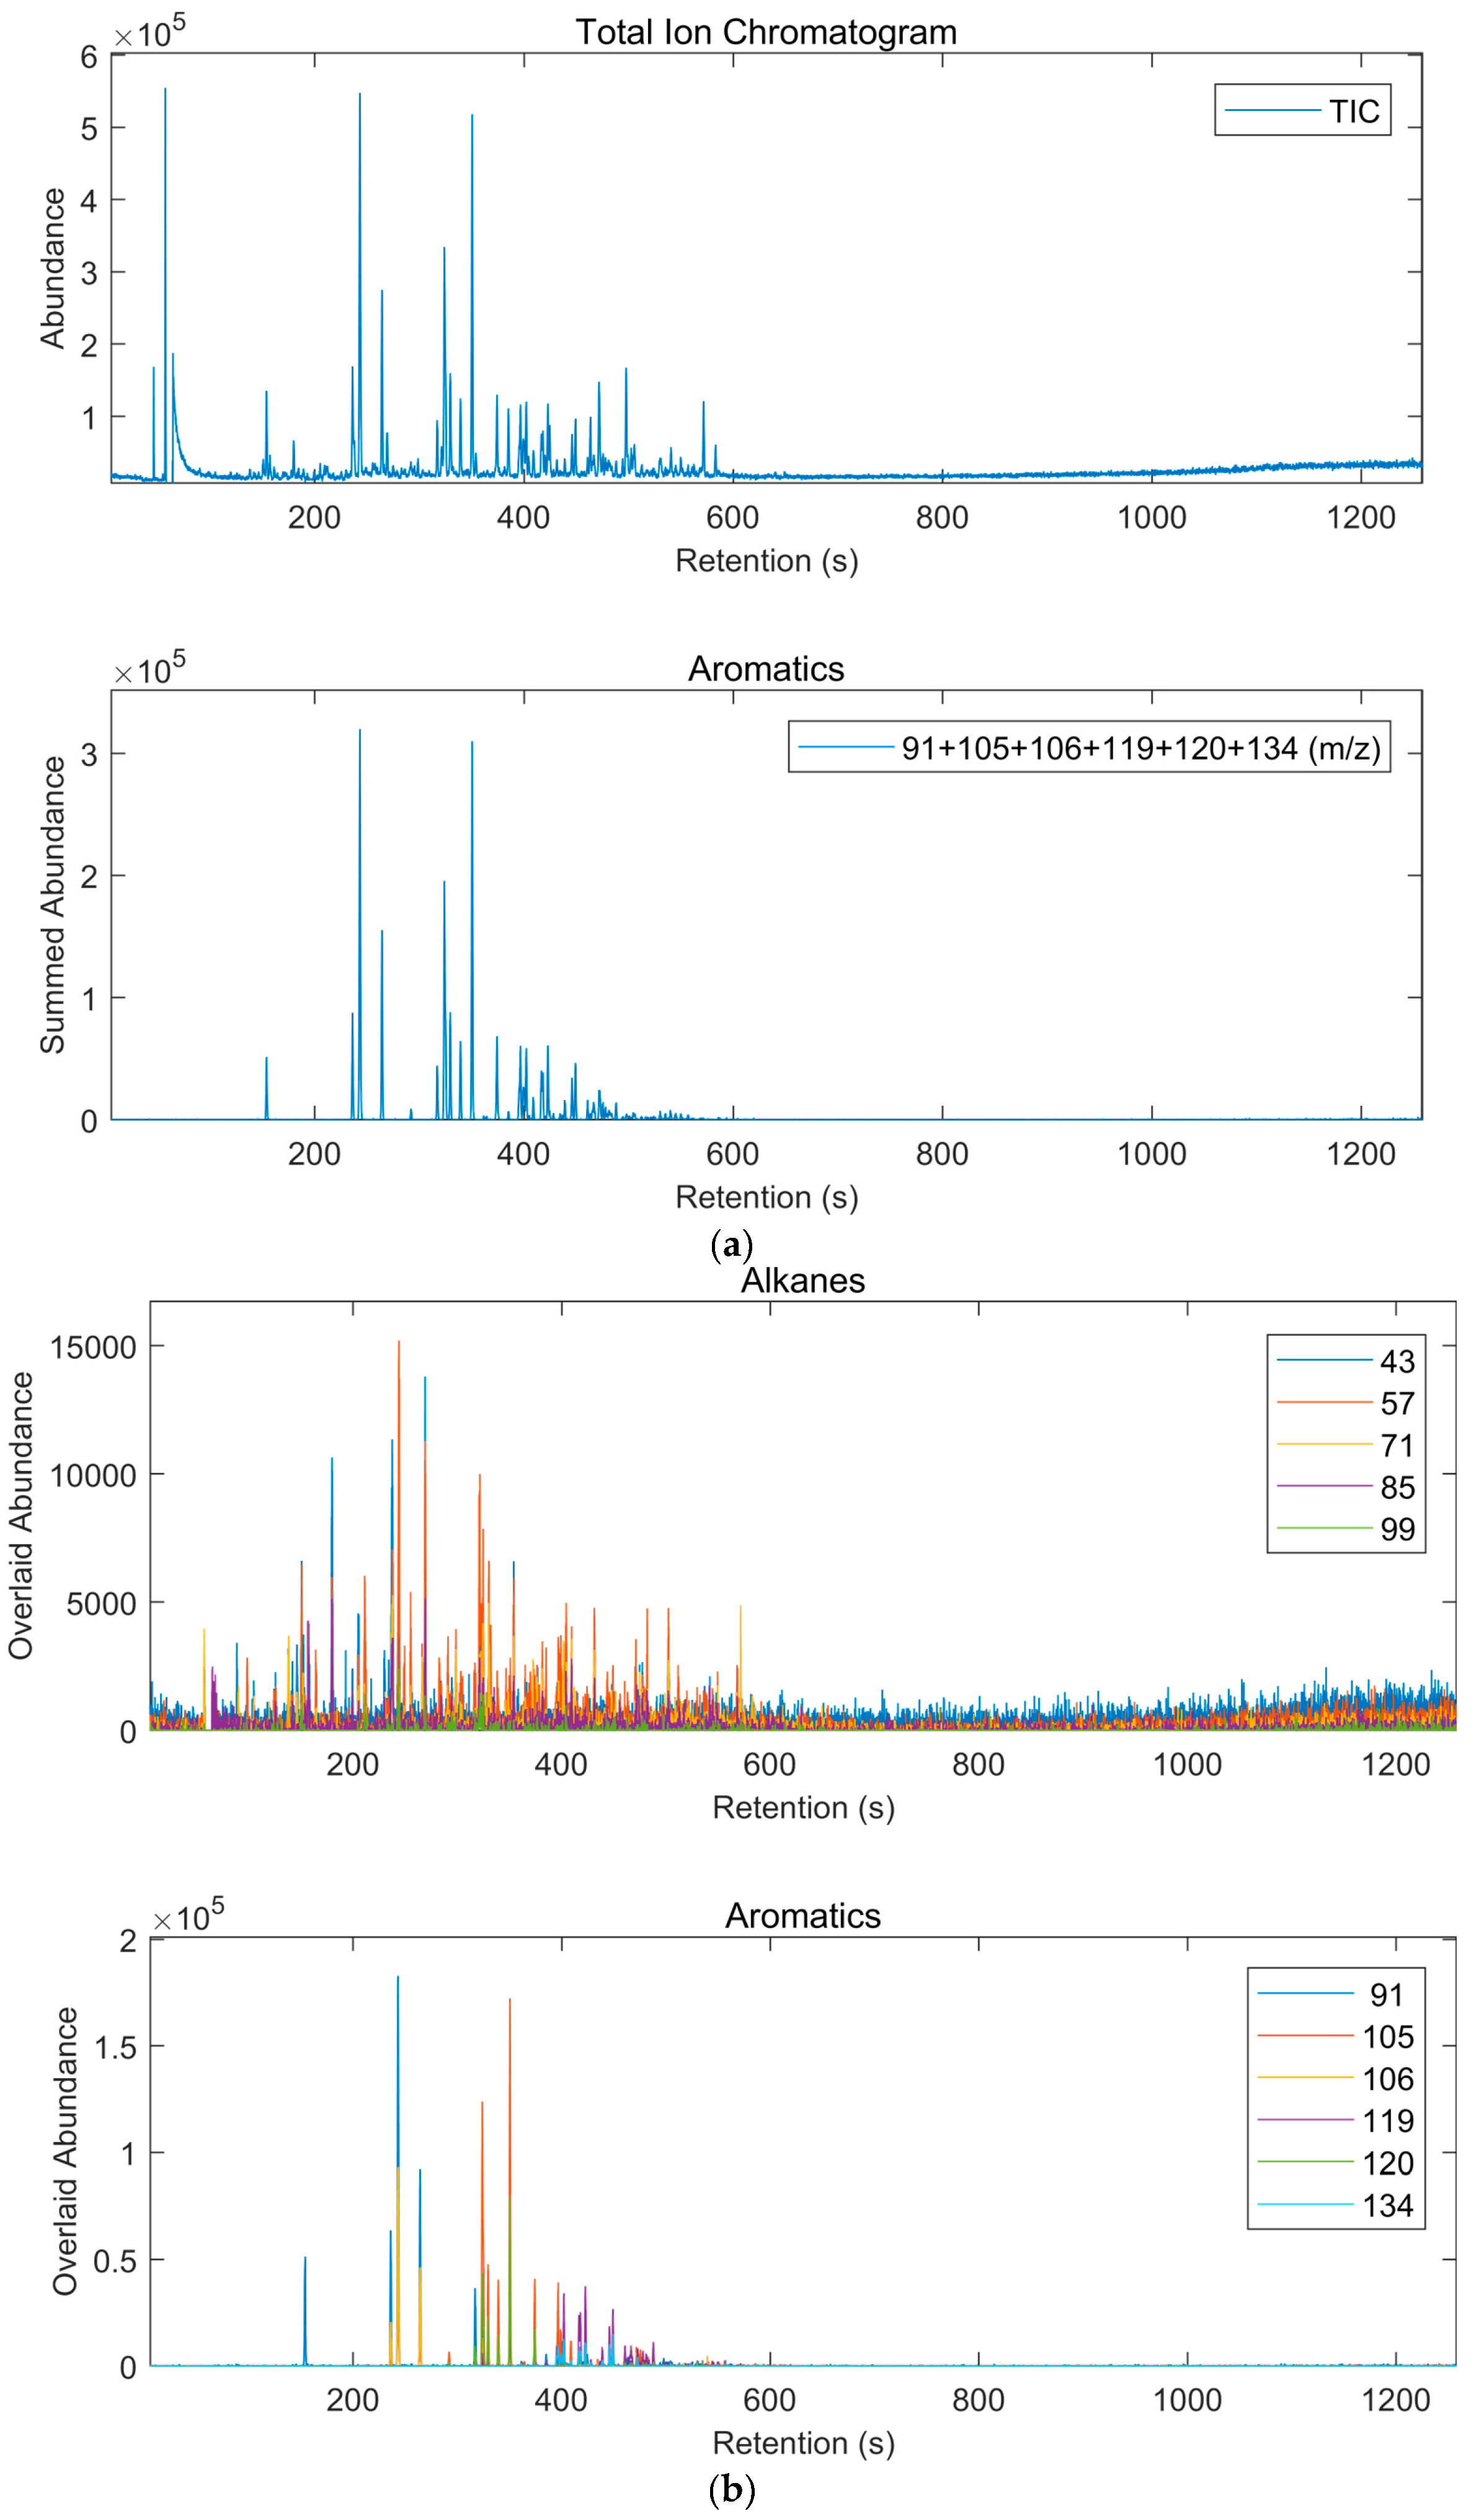
For both Gasoline 1 (Esso) and Gasoline 2 (7-Eleven) at 0.125 pL on-column the TIC appeared to be blank, and the only profile with any sign of peak activity was that of the aromatics with very low indications of toluene, ethylbenzene and the xylenes, and some of the C3-alkylbenzenes. However, the low abundance leads to a finding of no ignitable liquid detected. At 0.625 pL on-column the TIC showed some weak indications of peaks, but the aromatic, indane and naphthalene profiles were all identifiable, leading to the positive identification of both gasolines. Note that the alkane profile eventually became identifiable at 6.25 pL on-column. For the interpretation of the GC-MSD data, example TIC and summed aromatic EIC chromatograms are presented in Figure 1a. EICs displayed as overlaid ion chromatograms are illustrated for alkanes and aromatics in Figure 1b.
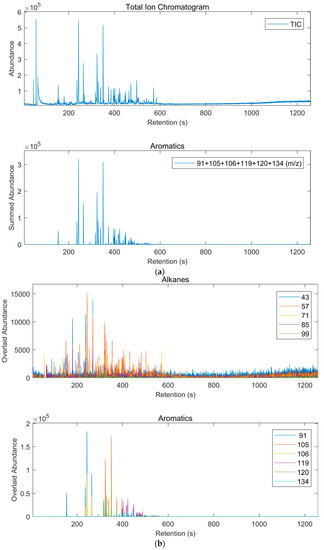
Figure 1.
Sample of 1D GC-MSD data for the most abundant gasoline level tested (1.0 μL/mL) as: (a) TIC and summed aromatic EIC; and (b) alkane and aromatic EICs displayed as overlays of individual ion chromatograms.
3.2.2. GC-MSD Analysis of Gasoline with Pyrolysate (Sections SI.3 Pages 94–137)
In the presence of pyrolysis, the TIC showed predominantly the pyrolysis profile for all samples, so the TIC was not inspected for indications of an ignitable liquid. Both Gasoline 1 and Gasoline 2 had peak activity on all EICs but no identifiable petroleum profiles at 0.125 pL on-column. Although the aromatic profile showed indications of petroleum at 0.625 pL on-column, namely indications of C4-alkylbenzenes not usually observed from pyrolysis, disturbance of the peak ratios in the C3-alkylbenzene range by pyrolysate resulted in an aromatic profile that could not be attributed to petroleum. At 1.25 pL on-column, Gasoline 1 had aromatic, indane and naphthalene profiles suggestive of petroleum, while Gasoline 2 had suggestive aromatic and naphthalene profiles. Despite the indications of petroleum, disturbance of many of the critical peak ratios in the presence of chemically related pyrolysis compounds requires a cautious conclusion that no ignitable liquid could be identified at this level for either gasoline. At 6.25 pL on-column, Gasoline 1 showed abundant and competent aromatic, indane and naphthalene profiles resulting in a positive identification of gasoline, while Gasoline 2 showed abundant and competent aromatic, indane and naphthalene profiles as well as a weak but also competent alkane profile, resulting in a positive identification of gasoline. The level of gasoline required on-column in this case is 10-fold higher in the presence of interfering pyrolysate than the amount required when the gasoline is pure. That factor will increase in the presence of more abundant interfering pyrolysate and decrease in cases of weaker interfering pyrolysate or most levels of non-interfering pyrolysate.
3.2.3. GC-MSD Analysis of Diesel (Sections SI.3 Pages 7–26)
For diesel at 1.25 pL on-column, no peaks were visible on the TIC and no indication of peaks were present on the EIC profiles. At 6.25 pL on-column, very weak indications of peaks were visible on the TIC and the n-alkanes were identifiable on the alkane EIC. However, no clear presence of branched alkanes could be seen at this level, leading to a situation where a potential misclassification as a heavy normal paraffinic product would be possible under the ASTM E1618-14 guidelines [27]. However, given the very low abundance of the n-alkane profile, a cautious finding of no ignitable liquid could be identified was given. At 12.5 pL on-column, the alkane EIC showed an identifiable profile including the presence of n-alkane and branched alkanes, along with weak indications of peak activity on the aromatic, indane and naphthalene profiles within the elution range of the Gaussian series of n-alkanes between C10 (decane) and C19 (nonadecane), resulting in a positive identification of a heavy petroleum distillate.
3.2.4. GC-MSD Analysis of Diesel with Pyrolysate (Sections SI.3 Pages 74–93)
In the presence of pyrolysate, the TIC again showed predominantly the pyrolysis profile for all samples, so the TIC was not inspected for indications of an ignitable liquid. At 6.25 pL on-column, no indication of any ignitable liquid was visible, likely due to the interference with the visual appearance of the alkane EIC by pyrolysate. At 12.5 pL on-column, the alkane EIC showed a Gaussian profile of n-alkanes but no clear indication of branched alkanes was observed, and pyrolysis contributions were the only apparent peak activity on the aromatic, indane and naphthalene profiles. This leads to a situation where the more abundant n-alkanes merit a positive finding but result in a misclassification as a heavy normal paraffinic product. In a forensic lab, such a sample would usually be concentrated and re-analyzed to eliminate any ambiguity prior to issuing a finding, but in this case 12.5 pL on-column was the highest concentration tested for diesel.
3.3. Results of Interpretation of GC-TOF Analyses
The full chromatographic data resulting from the GC-TOF analysis are presented in pages 138–313 of the Supplementary Materials.
3.3.1. GC-TOF Analysis of Gasoline (Sections SI.3 Pages 165–220)
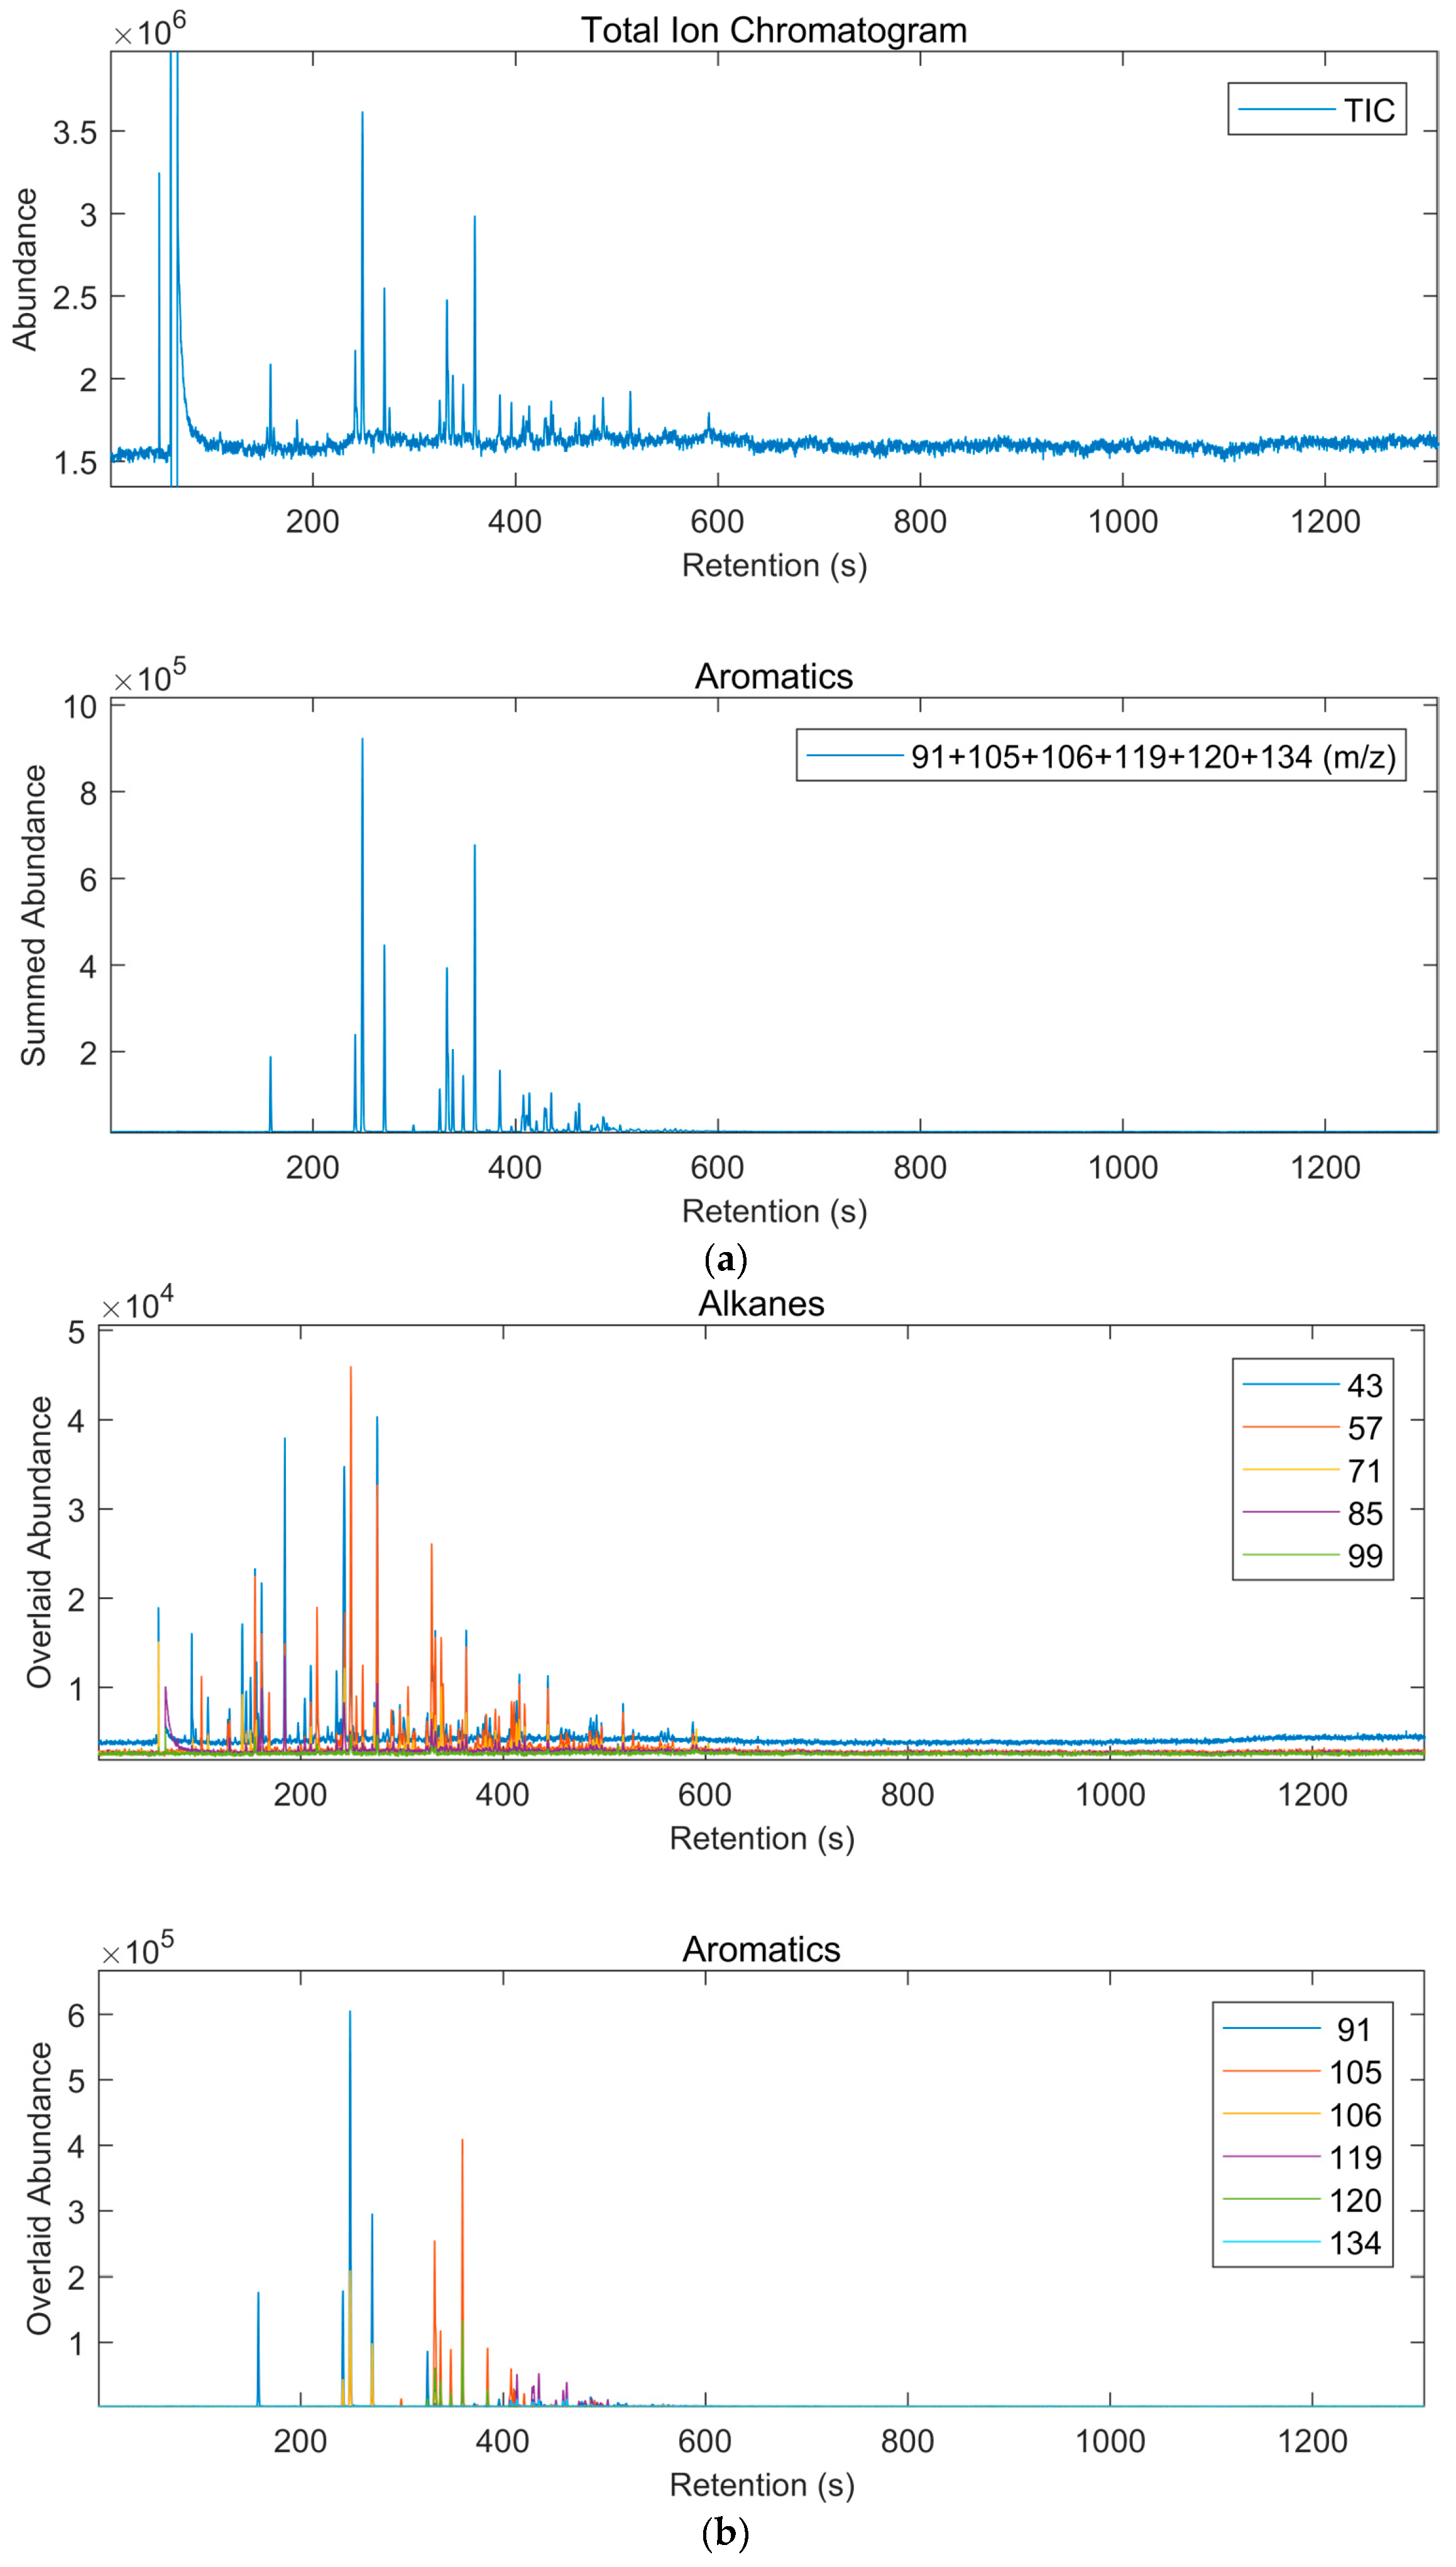
For both gasolines at 0.125 pL on-column, the observations were similar to those of the GC-MSD analyses. Gasoline 1 had a slightly more abundant aromatic profile clearly indicative of a petroleum product but resulted in a finding of no ignitable liquid was identified since, as detailed in Section 3.2.1, it is inappropriate to identify gasoline from only a weak aromatic profile. For Gasoline 2, the finding was no ignitable liquid detected. At 0.625 pL on-column, the observations were again similar to those from the GC-MSD analyses with positive identification of both gasolines, but notably the alkane profile is visible for both gasolines at this level and forms an important part of the identification. For the interpretation of the GC-TOF data, example TIC and summed aromatic EIC chromatograms are presented in Figure 2a. EICs displayed as overlaid ion chromatograms are illustrated for alkanes and aromatics in Figure 2b.
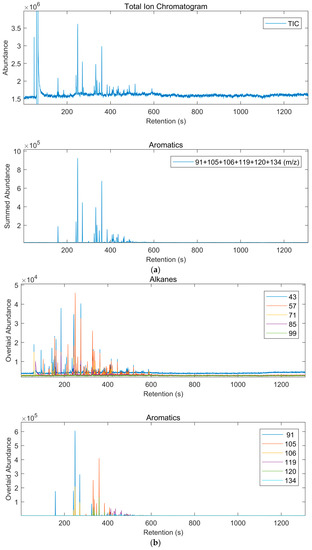
Figure 2.
Sample of 1D GC-TOF data for the most abundant gasoline level tested (1.0 μL/mL) as: (a) TIC and summed aromatic EIC; and (b) alkane and aromatic EICs displayed as overlays of individual ion chromatograms.
3.3.2. GC-TOF Analysis of Gasoline with Pyrolysate (Sections SI.3 Pages 254–313)
In the presence of pyrolysate, Gasoline 1 showed similar results to the GC-MSD analyses with 1.25 pL on-column resulting in a finding of not identified, but with positive identification at 6.25 pL based on the alkane, aromatic, indane and naphthalene profiles. Gasoline 2 showed slightly improved results during initial interpretation with a finding of not identified at 0.625 pL on-column, and an identification at 1.25 pL based on the aromatic, indane and naphthalene profiles with the presence of light alkanes in ratios comparable to gasoline reference standards. Upon peer review of the interpretation, one reviewer disagreed with the interpretation of Gasoline 2 at 1.25 pL on the basis that the alkanes were not sufficiently comparable to result in a conclusive identification, instead preferring a conservative finding of not identified. The original examiner agreed that if the alkane profile is considered insufficient, that the remaining aromatic, indane and naphthalene profiles presented too much interference from pyrolysate to justify conclusive identification of gasoline. Accordingly, the conclusion was downgraded to not identified at 1.25 pL on-column, raising the limit of identification to 6.25 pL on-column.
3.3.3. GC-TOF Analysis of Diesel (Sections SI.3 Pages 139–164)
For diesel at 1.25 pL on-column, the observations were similar to the GC-MSD result for 6.25 pL, with the alkane profile showing n-alkane peaks but at an abundance too low to confidently identify any ignitable liquid. At 6.25 pL, the observations were similar to that of the GC-MSD result for 12.5 pL, with the alkane profile showing a host of n-alkane and branched alkane peaks accompanied by some indications of peaks on the aromatic, indane and naphthalene profiles within in the n-alkane elution range leading to positive identification of a heavy petroleum distillate.
3.3.4. GC-TOF Analysis of Diesel with Pyrolysate (Sections SI.3 Pages 228–253)
In the presence of pyrolysate, diesel showed results somewhat similar to the GC-MSD analyses, except that branched alkanes became identifiable at 6.25 pL via GC-TOF relative to 12.5 pL with GC-MSD. Despite the earlier visibility of branched alkanes at 6.25 pL, they are still insufficient to reach a conclusive identification, resulting in a finding of no ignitable liquid identified. However, at 12.5 pL positive identification of a heavy petroleum distillate is achieved based on the alkane profile, supported by indications of peaks on the aromatic, indane and naphthalene profiles within the n-alkane elution range.
3.4. Results of Interpretation of GC×GC-TOF Analyses
The full chromatographic data resulting from the GC×GC-TOF analysis are presented in pages 314–413 of the Supplementary Materials.
3.4.1. GC×GC-TOF Analysis of Gasoline (Sections SI.3 Pages 331–360)
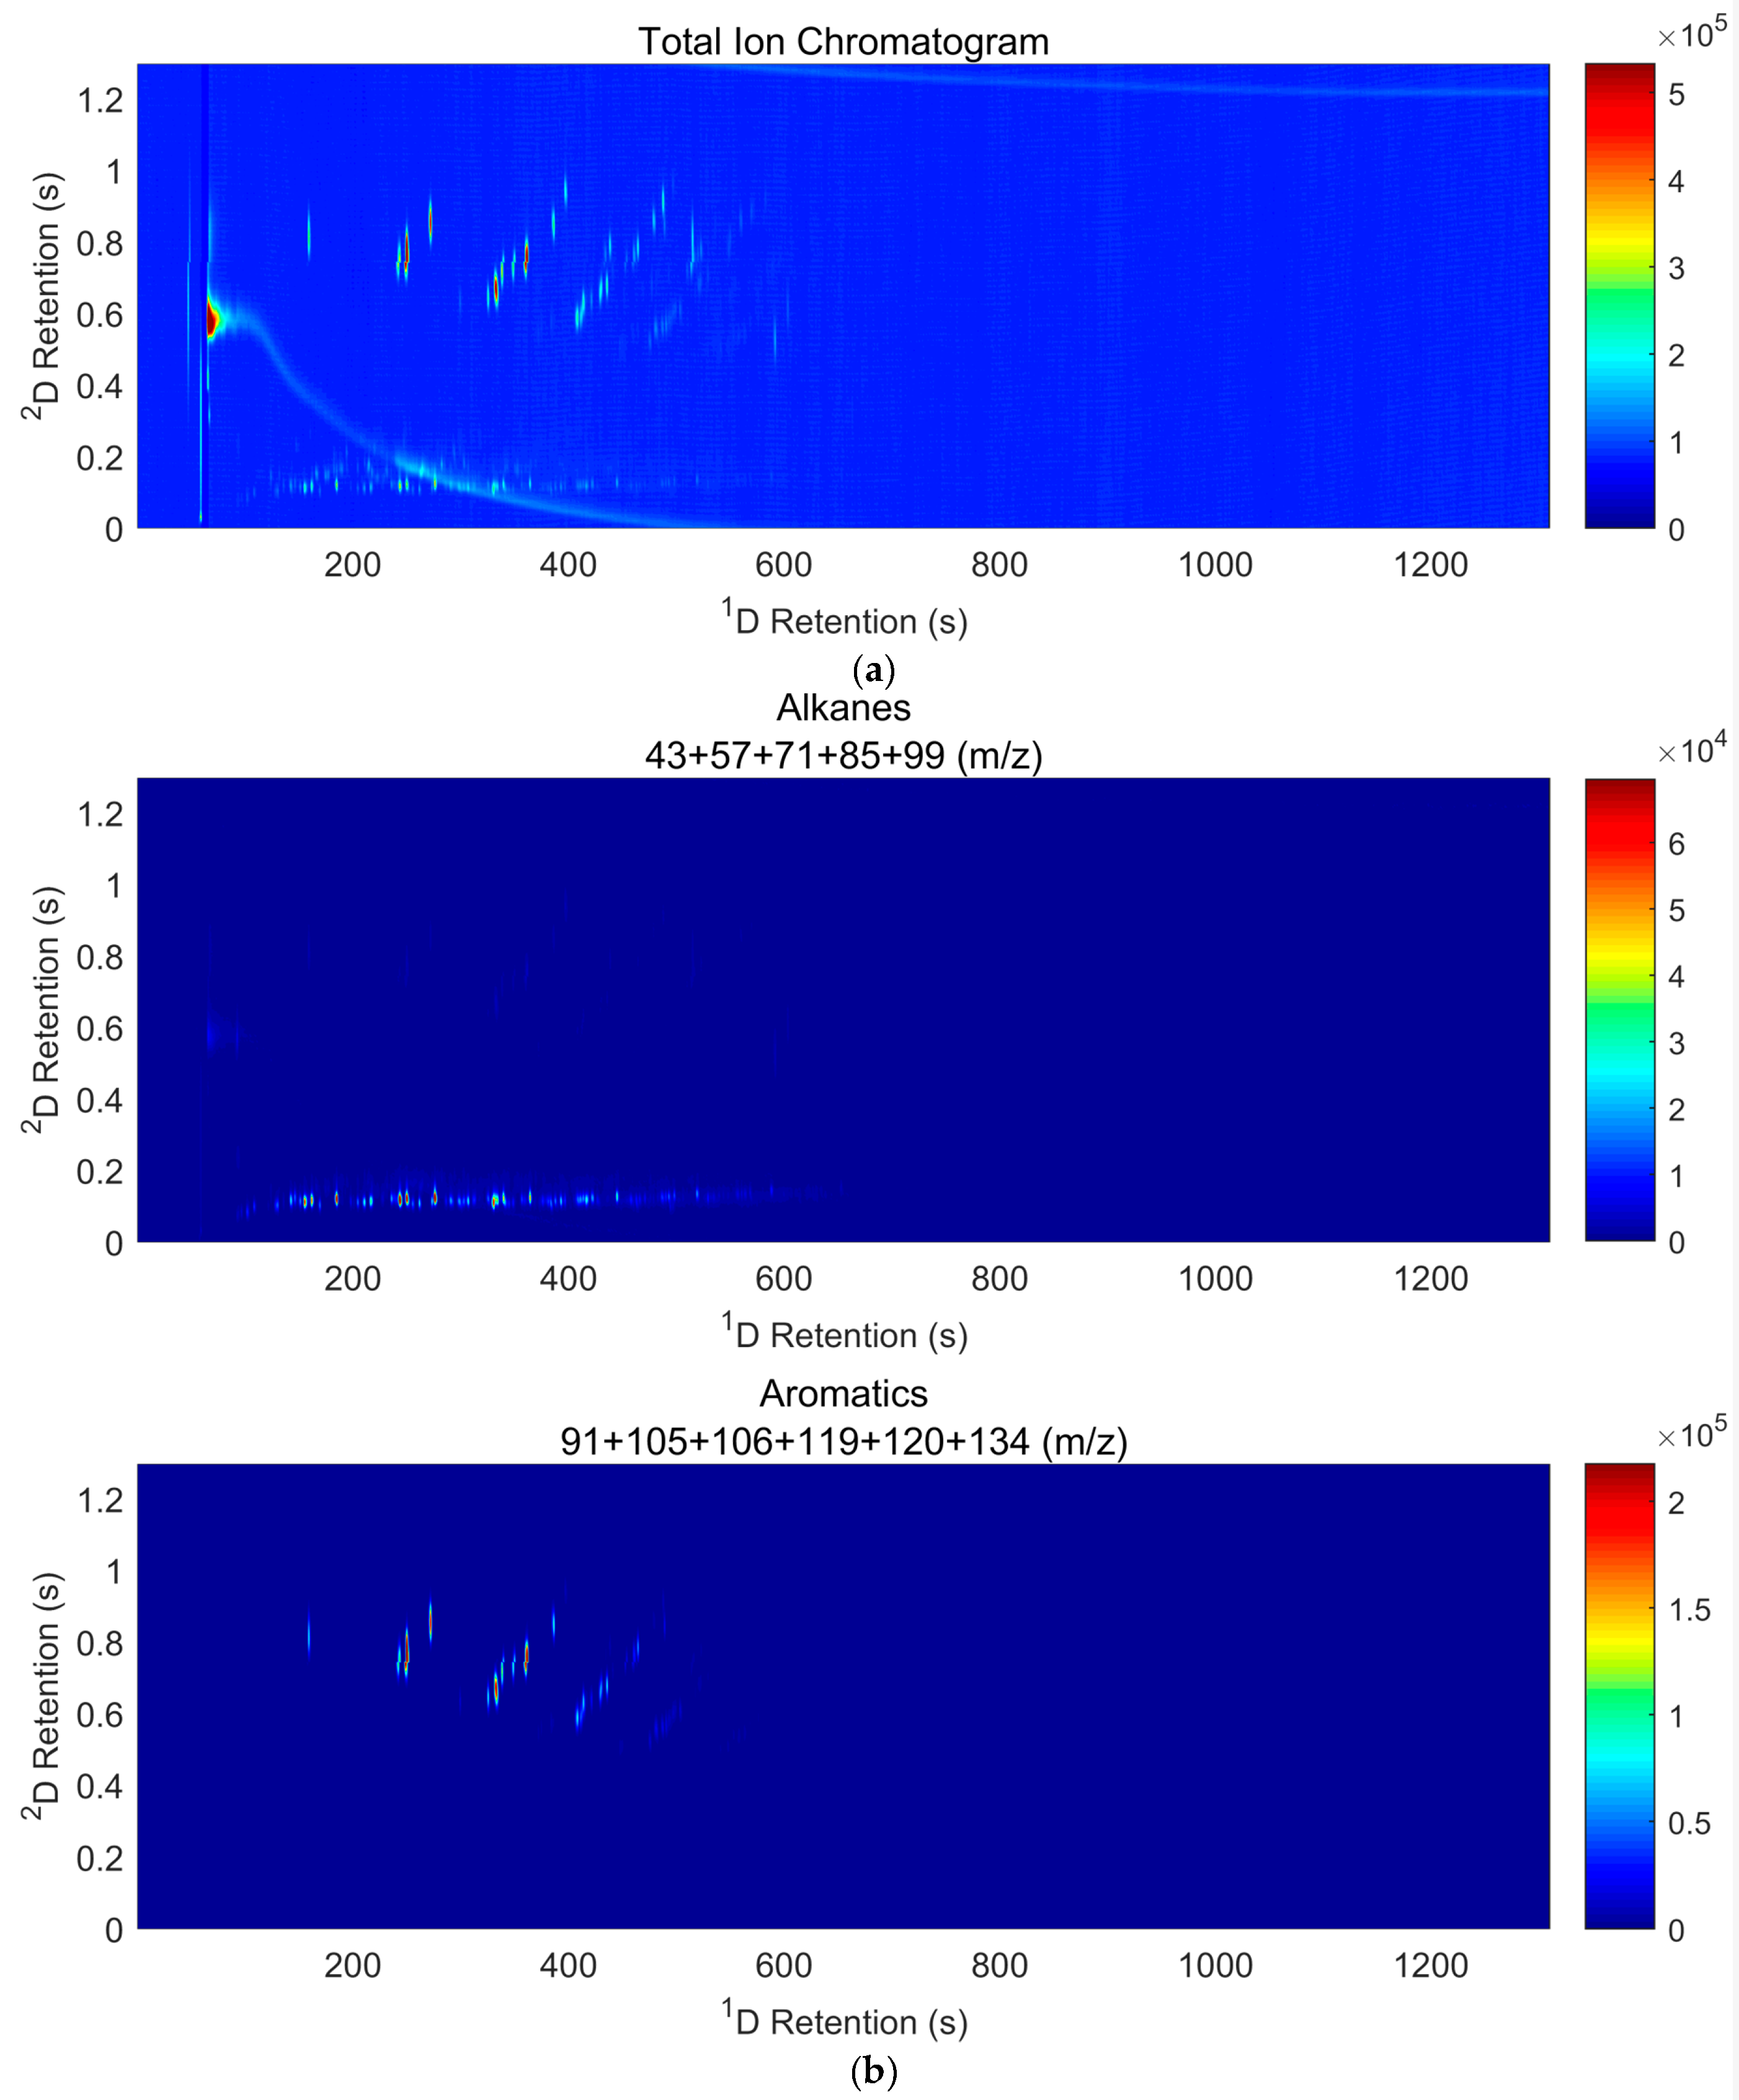
For Gasoline 1 at 0.0625 pL on-column, some alkane and aromatic peak activity were visible, suggestive of a petroleum product but insufficient for confirmation, resulting in a finding of no ignitable liquid identified. At 0.125 pL, however, competent alkane, aromatic and indane profiles were clearly identifiable, resulting in a positive identification of gasoline. For Gasoline 2 at 0.0625 pL on-column the alkane and aromatic profiles also show peaks indicative of petroleum at a greater abundance than for Gasoline 1, just passing the threshold to result in a positive identification of gasoline. For both Gasoline 1 and Gasoline 2 at 0.125 pL on-column, the alkane, aromatic, indane and naphthalene EICs all show a complete peak profile for gasoline. For the interpretation of the GC×GC-TOF data an example TIC is presented in Figure 3a, and summed alkane and aromatic EICs are presented in Figure 3b. Please note that EICs displayed as overlaid ion chromatograms are not provided for the 2D data, as it was not possible to present them in a meaningful way.
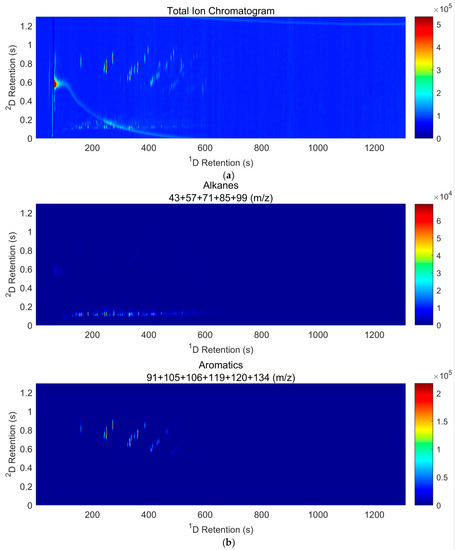
Figure 3.
Sample of 2D GC×GC-TOF data for the most abundant gasoline level tested (1.0 μL/mL) as: (a) TIC; and (b) summed alkane and aromatic EICs. The 2D retention axis has been shifted downwards by 0.55 seconds in all figures to account for the 2D tm. EICs are not provided as overlays of individual ion chromatograms as it is not possible to present them in a meaningful way for the 2D data.
3.4.2. GC×GC-TOF Analysis of Gasoline with Pyrolysate (Sections SI.3 Pages 382–413)
In the presence of pyrolysate, Gasoline 1 at 0.125 pL on-column showed peak activity on the alkane and aromatic profiles with indications of petroleum, but due to the contribution from pyrolysis to many of the same peaks present in petroleum, only a finding of no ignitable liquid identified was possible. At 0.625 pL of Gasoline 1 on-column, competent alkane, aromatic and indane profiles are all present resulting in positive identification of gasoline. For Gasoline 2 at 0.125 pL on-column, peak activity is present on the alkane and aromatic profiles but not indicative of petroleum resulting in a finding of no ignitable liquid detected. At 0.625 pL of Gasoline 2 on-column, the alkane and aromatic EICs show peak profiles indicative of petroleum at low abundances, but just sufficient to positively identify gasoline.
3.4.3. GC×GC-TOF Analysis of Diesel (Sections SI.3 Pages 315–330)
For diesel at 0.625 pL on-column the alkane EIC showed the presence of n-alkanes and branched alkanes at very low levels, but still sufficient to positively identify a heavy petroleum distillate. At 6.25 pL of diesel on-column, the aromatic, indane and naphthalene profiles also showed peak activity indicative of petroleum. Notably, the structured nature of the retention coordinates on the 2D chromatogram allowed clear visualization of the peaks present on these three EICs in a way that was impossible using the 1D techniques.
3.4.4. GC×GC-TOF Analysis of Diesel with Pyrolysate (Sections SI.3 Pages 365–381)
In the presence of pyrolysate, diesel at 1.25 pL on-column showed peak activity on all of the EICs (alkane, aromatic, indane and naphthalene) but the contribution of pyrolysate to many of the same peaks present in the petroleum obscured enough of the critical peak ratios to require a finding of no ignitable liquid identified. At 6.25 pL on-column, each of the EIC profiles showed profiles strongly indicative of petroleum resulting in the positive identification of a heavy petroleum distillate. Notably, the high number of isomers from every class of compounds and their easy visualization made confident identification of an HPD especially simple.
4. Discussion
4.1. Notes on Design and Interpretation
Instrumental sensitivity is usually assessed by mass calibration of target substances [31]; however, in the context of forensic examination of fire debris, the concepts of sensitivity and limits of detection require a different treatment. Ignitable liquids are often petroleum products containing hundreds or thousands of individual compounds [1,2]. Additionally, the relative abundances of the constituents of the ignitable liquid can vary considerably from one sample to another due to differences in formulation, weathering, etc. [32,33,34]. Consequently, the mass of each individual compound in a sample cannot be reliably tracked as a measure of material on-column. Thus, we chose to rely on calibration by total volume of ignitable liquid on-column. Further, the truly important measure for forensic purposes is the limit of identification (LOI), i.e., the concentration at which the ignitable liquid can be reliably identified. This identification depends on the combined pattern of numerous peaks [6,27,29], with the threshold for identification determined somewhat by the discretion of a skilled examiner. This makes it difficult to establish a universal rule by which an instrument’s absolute sensitivity can be quantified for fire debris analysis. However, among petroleum-based ignitable liquids of varied formulation, there are some relatively stable characteristics (e.g., the C2-, C3- and C4-alkylbenzenes in gasoline, or the dominant n-alkanes and interspersed branched alkanes in middle and heavy distillates) upon which investigators rely [6,29,33,34]. Consequently, our findings may be reasonably extrapolated to most gasolines and diesels in the absence of highly unusual compositions.
When interpreting fire debris data, inspecting the TIC is the first step in assessment as it shows the total overall peak content of the extract [29], but it also maximizes the noise by summing all ion channels even though relatively few of those channels capture the response of any given analyte. EICs are superior to the TIC as they allow filtering peaks by class via summation of only those ions known to be characteristic to a given class of compounds (Table 3) [29,35,36]. As a result, EICs provide a greater signal-to-noise ratio by ignoring the noise in low significance channels, and provide better visualization of individual contributions to an ignitable liquid profile. This improves detectability, but also aids classification and comparison to ignitable liquid standards. For this reason, a description of the EIC profiles is prioritized in the results section. In general, peaks become visible in the EIC long before a sufficient number of compounds are present to indicate the presence of petroleum. For instance, the toluene and p,m-xylene peaks are normally clearly observed in the aromatic EIC well below the limit of identification for gasoline. These peaks alone cannot provide sufficient comparison of within-group peak ratios to positively identify gasoline. For this reason, the term identifiable is used when referring to petroleum profiles within the EICs. Additionally, an abundant profile may be present in an EIC far above the threshold required to assess the within-group peak ratios necessary to identify an ignitable liquid, but the presence of even a small amount of pyrolysate may augment enough individual peaks to alter the required ratios. This would also result in a non-identifiable profile even when the remainder of the profile suggests the presence of petroleum.
In fire debris analysis, it is common practice to use a scale of findings starting with “no ignitable liquid detected” when no peak profiles indicative of petroleum are observed, which may be a result of their total absence, extremely low abundance, masking by pyrolysate, or a combination thereof. The next level of finding, “no ignitable liquid identified”, is reserved for cases where clear indications of petroleum are observed within the EICs, but their abundance is either very low, or there are other factors disqualifying their definitive attribution to a petroleum product such as microbial degradation or interference from pyrolysate. The next level of finding, “ignitable liquid detected”, refers to the successful identification of an ignitable liquid sufficient for its classification and uses to be detailed in the conclusion.
4.2. Observations on GC-MSD Results
GC-MSD provided an LOI of 0.625 pL on-column for both gasolines, and 12.5 pL on-column for diesel. Much of the prior work in fire debris analysis referred to an estimated sensitivity of “0.1–0.5 μL” of gasoline [10,12,13,14,19,37]. This is difficult to place in context as this may refer to the volume left at the scene, the volume captured during exhibit extraction, the volume diluted in a solvent for injection, the un-split volume, or the post-split volume delivered to the GC column. Furthermore, if the chromatographic conditions used to arrive at the given estimate were suboptimal, low peak resolution or excessive band broadening of the analytes would degrade the signal to noise ratio resulting in poorer performance of the instrument. In an attempt to compare our value with the literature, we can consider the most popular extraction method (passive headspace concentration with activated carbon strip) [38] and presume an elution volume of 600 μL CS2. In this case, a recovery of 0.1 μL would result in a final extract concentration of ~1.7 μL/mL which, when split 1:80 (split ratios in the range of 1:50 to 1:80 are common) would result in a volume of ~2.1 pL delivered on-column. Given our LOI result of 0.625 pL for gasoline, this would suggest an increase in sensitivity of modern instrumentation relative to the instrumentation used in earlier work. In any case, it is impossible to know if this increase in sensitivity represents a real increase in instrumental performance or is the result of a lack of rigor in the historical estimates of sensitivity. It is more important to recognize that the sensitivity offered by fire debris analysis depends on proper collection and preservation of the evidence at the scene, efficient extraction procedures, properly optimized instrumental methods, skilled interpretation of the results, and the nature of the specific ignitable liquid present.
When the contribution of substrate pyrolysate is considered, higher LOIs of 6.25 pL for gasoline and more than 12.5 pL for diesel are found. This increase reflects the confounding effect of pyrolysate, although it is worth noting that interference from coelution of different compounds is largely resolved by using the mass filtering offered by EICs. The real issue of interference is the distortion of peak ratios present in the ignitable liquid due to production of those same compounds by pyrolysis. For example, peaks such as naphthalene, p,m-xylene, toluene and some of the C3-alkylbenzenes are regularly contributed by substrate pyrolysis [23,29,39], and in the case of gasoline these are all peaks of importance [27,29] which will be unavoidably distorted by the background. No amount of additional separation can resolve this particular issue, and both the magnitude and the specific chemistry of the substrate pyrolysis contribution will define the LOI in these cases.
Given the large difference between the LOIs for gasoline and diesel, the nature of the ignitable liquid itself is the most significant uncontrollable factor affecting sensitivity, and to our knowledge these values are the first rigorous estimators reported for the quantitative sensitivity of GC-MSD for gasoline and diesel identification.
4.3. Observations on GC-TOF Results
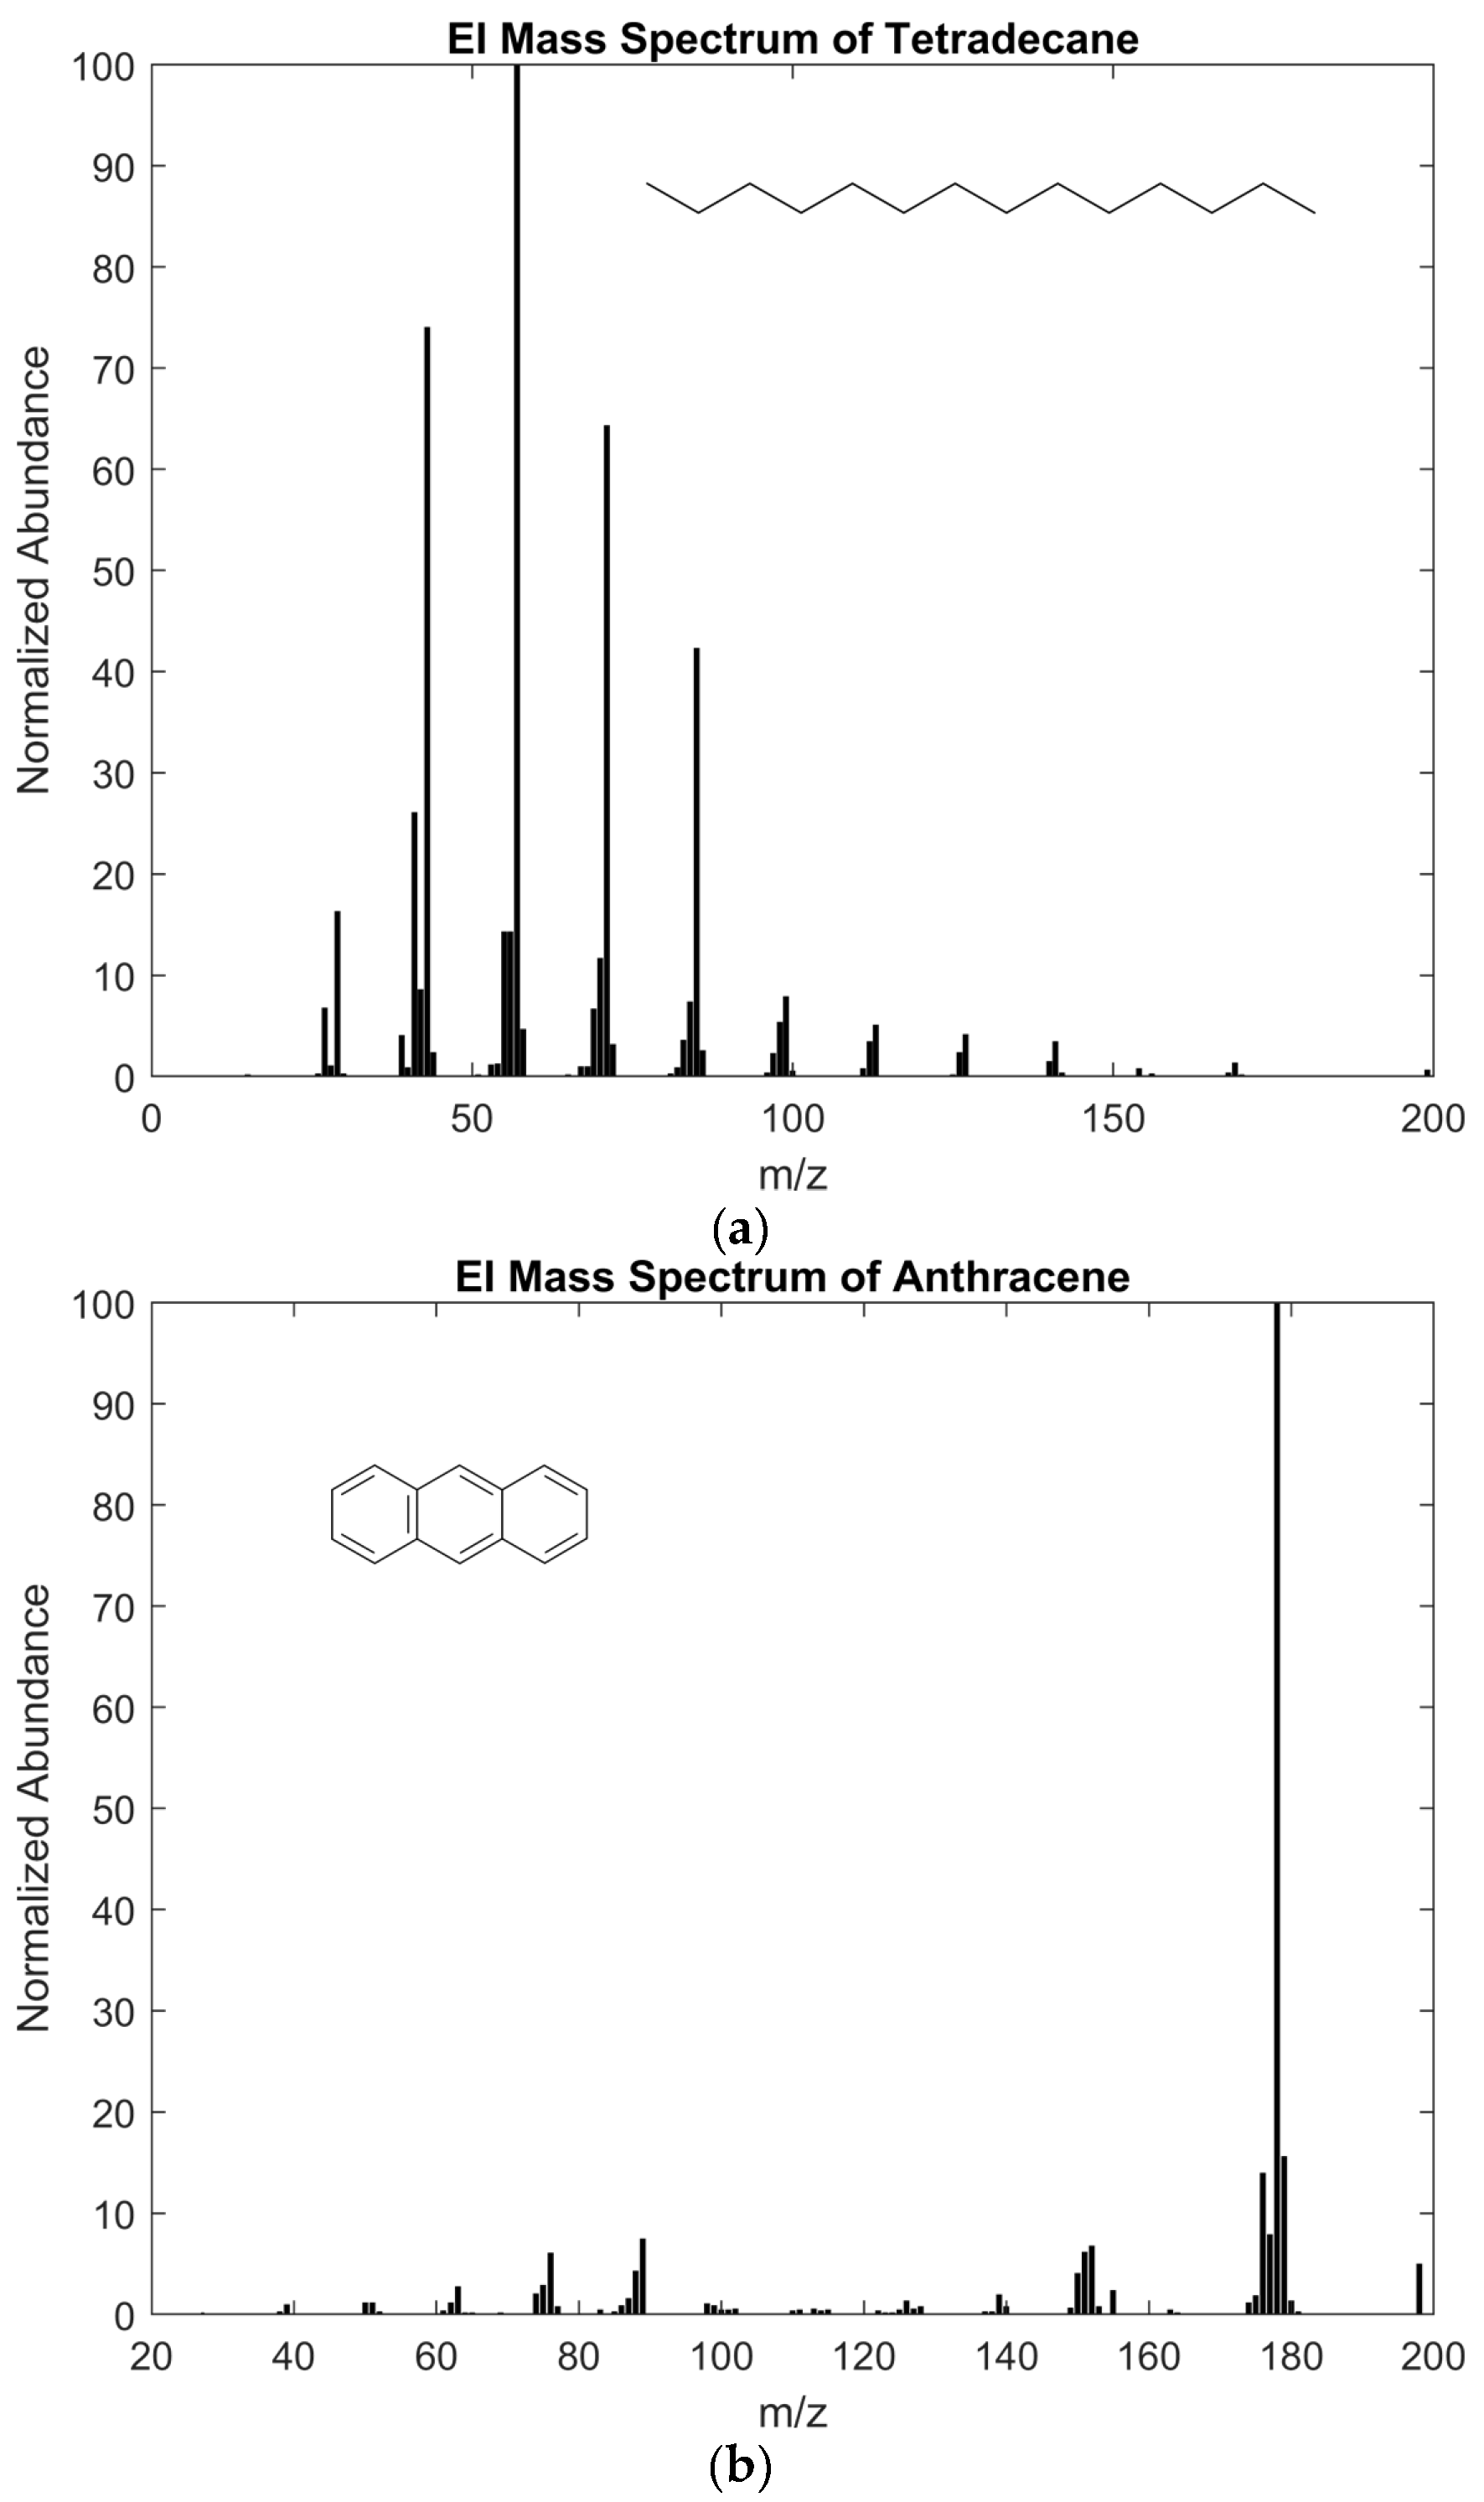
GC-TOF provided LOIs of 0.625 pL on-column for both gasolines, and 6.25 pL on-column for diesel. The similar performance of GC-MSD and GC-TOF for gasoline is relatively unsurprising given that most of the critical peaks are characterized by a relatively small number of ions, which will be represented reasonably well by the quadrupole relative to the TOF. What is more significant with the TOF is the lower concentrations required for the alkane pattern to be detected and correctly interpreted for both gasoline and diesel. Alkanes generate a wide range of ions during fragmentation, whereas aromatics generate comparatively few ions (Figure 4). This, coupled with differences in ion transmission through the different mass spectrometers, results in improved spectral quality for alkanes at lower absolute masses on-column. This improves trace level identification of both the linear and branched alkanes resulting in a lower LOI for diesel.
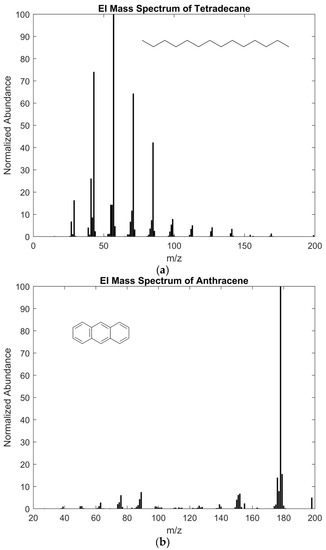
Figure 4.
Representative mass spectra from the NIST 11 library for: (a) tetradecane (NIST record #229858); and (b) anthracene (NIST record #228201).
When the contribution of substrate pyrolysate is considered, the LOIs again increase to 6.25 pL on-column for both gasolines, and to 12.5 pL diesel. These increases are a result of the same factors discussed in Section 4.2, with the greater sensitivity of the TOF towards alkanes accounting for the lower LOI for diesel. The differences in interpretation of the gasolines is not solely attributable to their alkane fraction, but arises from overall differences in their composition as a result of the formulation process at the refinery [32,33,34].
Overall, the increase in sensitivity offered by the GC-TOF relative to the GC-MSD is modest at best, although the value of more sensitive detection of alkanes should not be understated in the context of analysis of petroleum products.
4.4. Observations on GC×GC-TOF Results
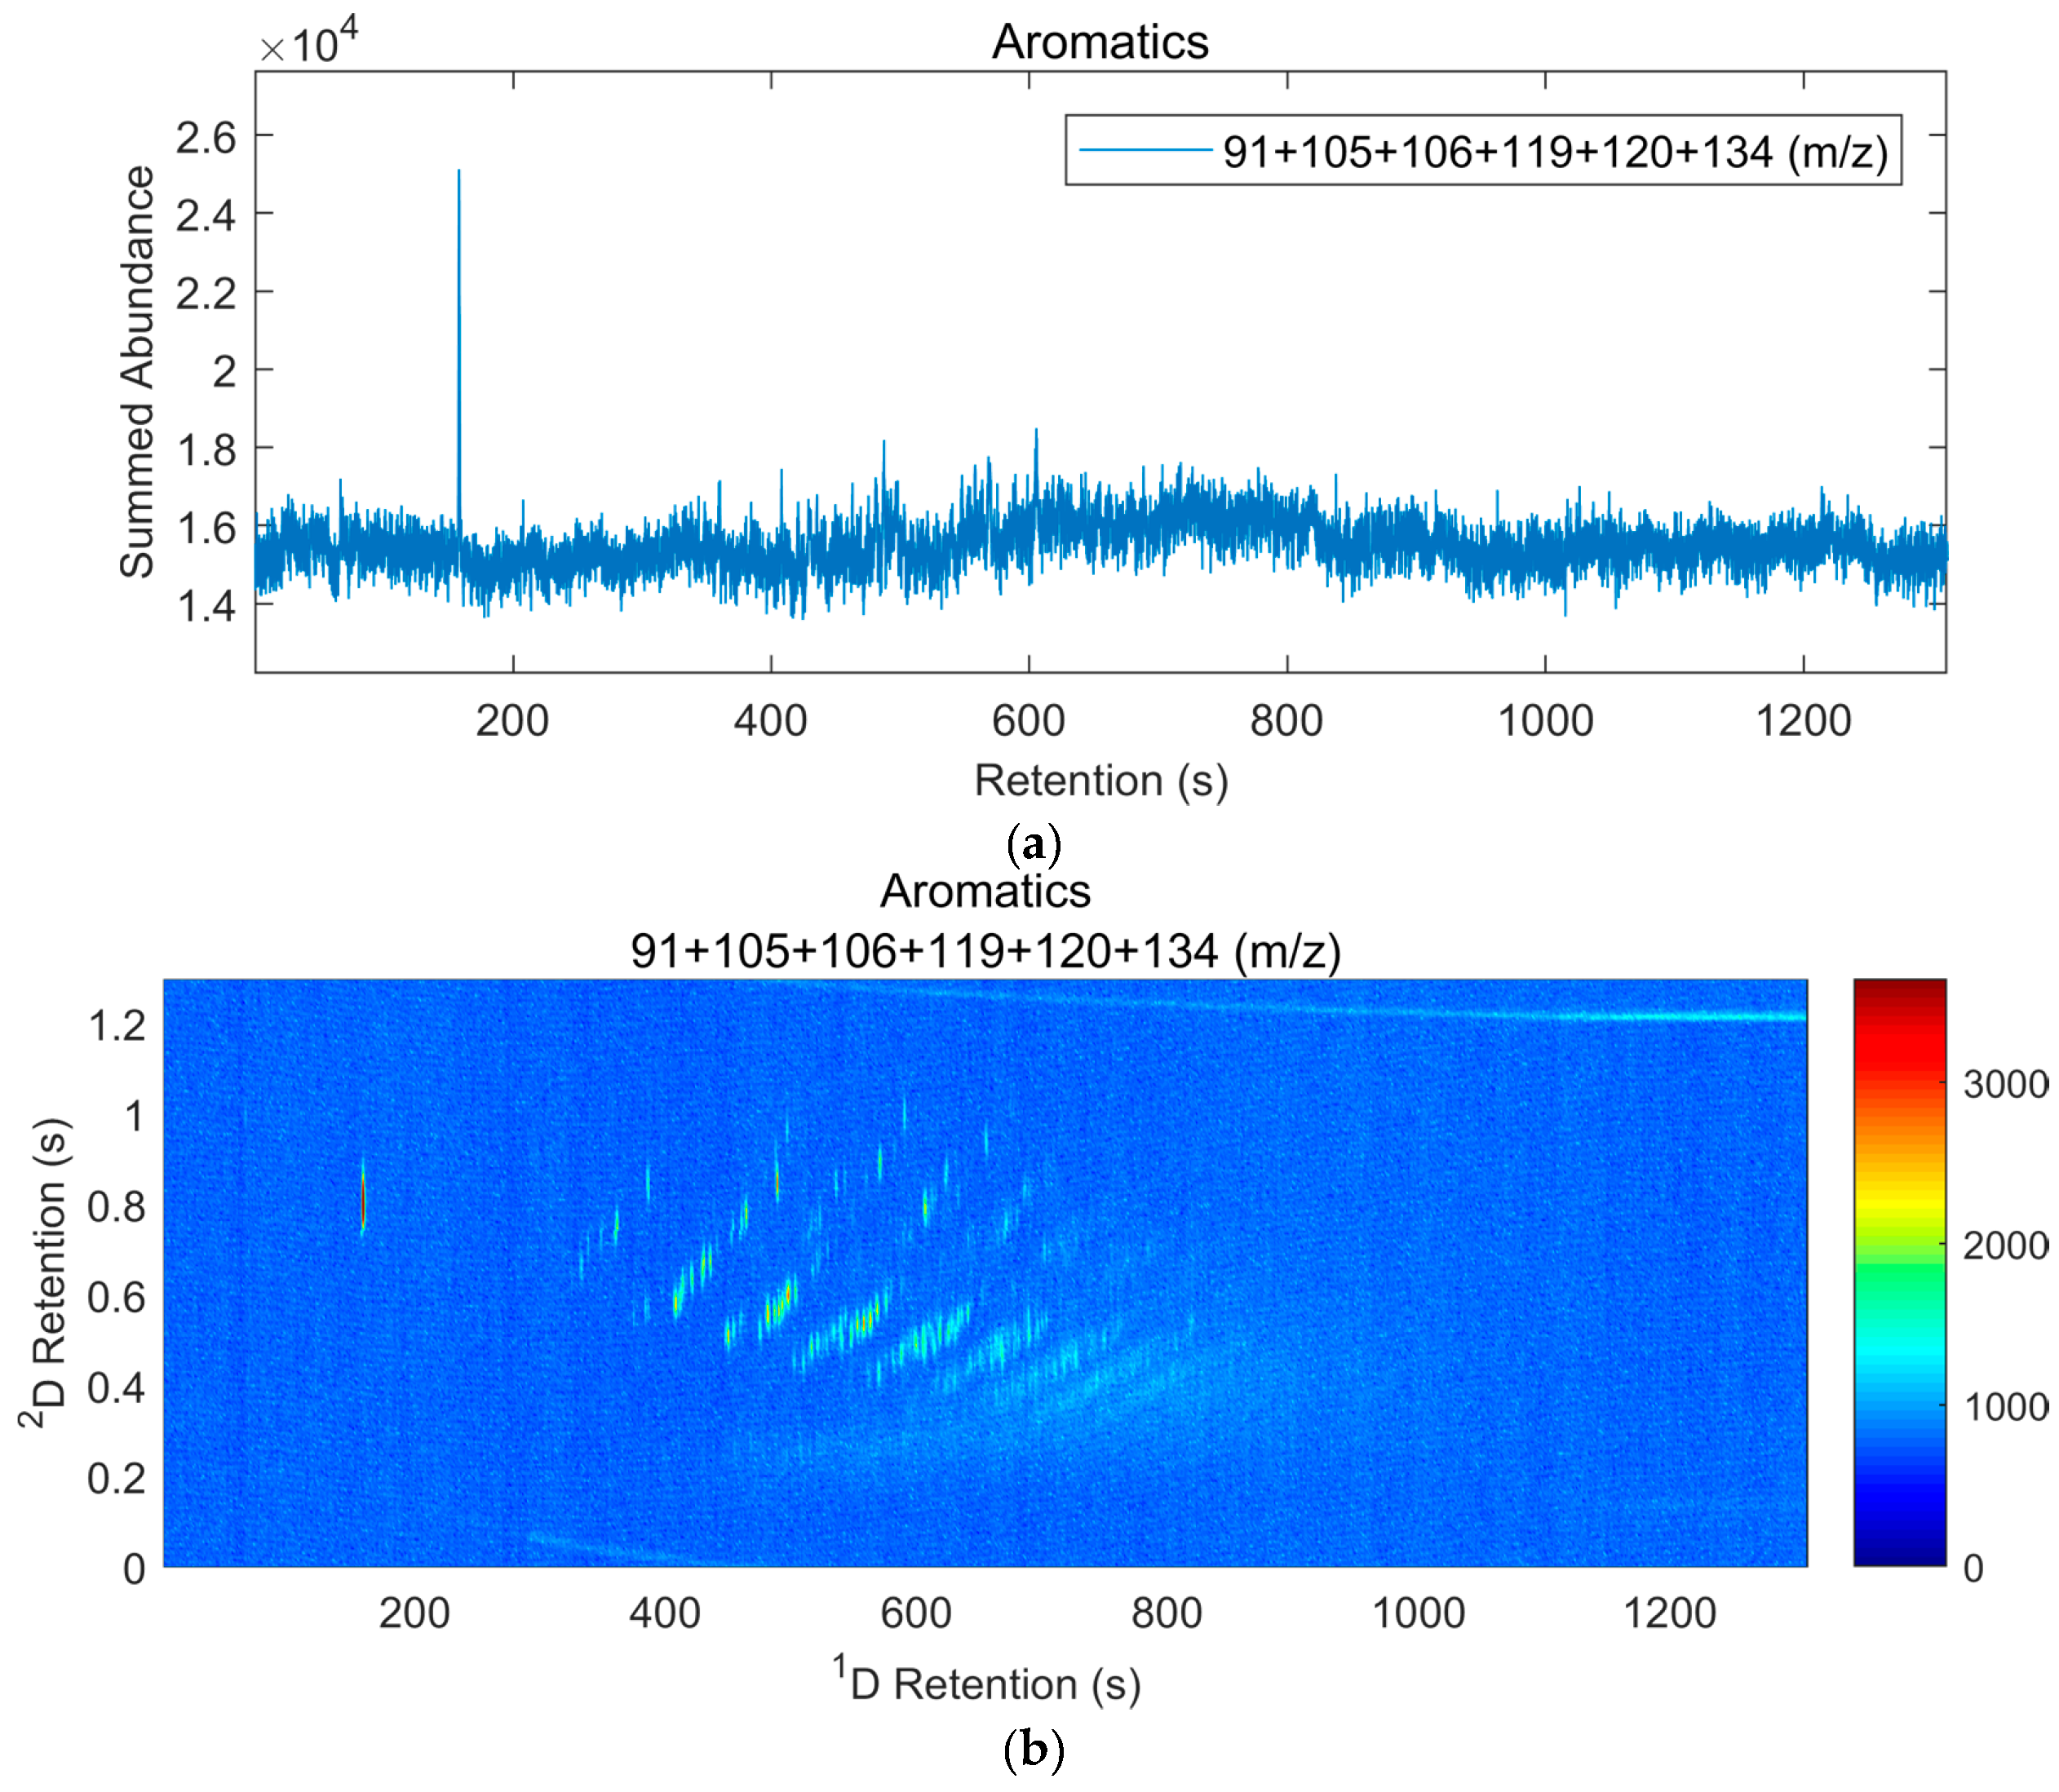
GC×GC-TOF provided LOIs of 0.125 pL on-column for Gasoline 1, 0.0625 pL on-column for Gasoline 2, and 0.625 pL on-column for diesel. These values represent a significant and consistent order of magnitude increase in sensitivity relative to both GC-MSD and GC-TOF resulting from a combination of the focusing effect achieved during modulation onto the second-dimension column, reduced noise due to the improved separation, and greater confidence in peak identification due to the structured retention information displayed in the 2D chromatogram [21].
When the contribution of substrate pyrolysis is considered, the LOIs increase to 0.625 pL on-column for gasoline, and 6.25 pL on-column for diesel, but these represent less of a decrease in sensitivity when compared to the 1D methods. While some have suggested that GC×GC offers better separation of pyrolysis compounds from the ignitable liquid compounds [21], we found this to be of very minor benefit during the interpretation process. The greater benefits offered by GC×GC in the context of fire debris analysis arise from the focusing effect of modulation and most importantly the structured retention information inherent in the chromatogram. Structured retention causes the hosts of heavier isomeric compounds to elute in easily recognized bands ordered by compound type and degree of substitution. This is especially advantageous in the presence of substrate interferences since pyrolysis does not produce the entire array of isomers observed in petroleum. The added sensitivity and structured retention of GC×GC means that compounds normally buried in the noise on 1D chromatograms are easily visualized. In 1D analysis, the interference of pyrolysate distorts peaks and disturbs the ratios within critical peak groupings. However, the ability to see the normally obscured heavy groupings of high isomerism in ignitable liquids allows comparison of richer areas of the chromatogram to ignitable liquid standards (Figure 5). As a result, confident identification can be made even when the critical ratios in classical analysis are heavily perturbed. This effect may alter the classification guidelines currently in use, or even require the creation of a new published standard covering analysis and interpretation of fire debris by 2D instrumentation.
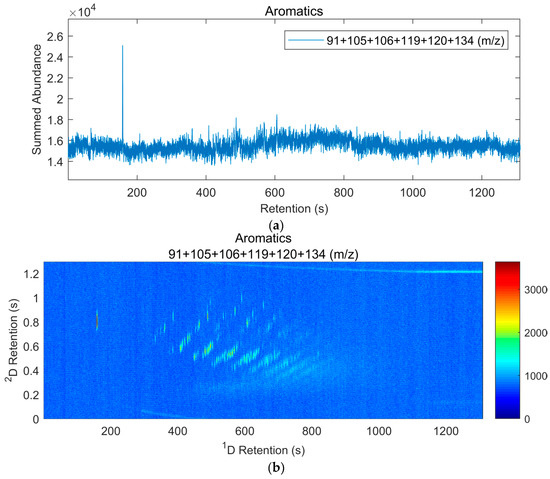
Figure 5.
Heavy aromatic compounds illustrating structured retention information and high isomerism as observed on the summed aromatic EIC for the 1.0 μL/mL diesel using: (a) GC-TOF; and (b) GC×GC-TOF. The 2D retention axis has been shifted downwards by 0.55 s in both figures to account for the 2D tm.
5. Conclusions
We have reported the first quantitative sensitivities of GC-MSD as LOIs (i.e., the concentration on-column at which the ignitable liquid can be reliably identified) for gasoline and diesel in the context of fire debris, and compared those sensitivities to GC-TOF and GC×GC-TOF techniques under equivalent conditions. These results will enable future quantitative assessment of the other parameters in fire debris collection and analysis, such as collection at the scene, and extraction efficiency in the lab. This work also provides a solid foundation for future work towards closing the identification gap between the forensic lab and the accelerant-detecting canine. Our results also demonstrate the superiority of GC×GC analysis relative to the classic 1D GC techniques and highlight new reasons for this superiority. However, further study will be required to determine what level of sensitivity is excessive and would result in inappropriately high significance attributed to insignificant amounts of ignitable liquid. We anticipate that our experimental approach will allow other labs to begin validating their instrumental sensitivities, as well as reporting LOIs for other less frequently encountered ignitable liquid classes. Ultimately, we hope to see increased use of GC×GC in fire debris analysis by mainstream forensic labs.
Supplementary Materials
Supplementary materials including chromatograms, and a brief description of criteria used to identify ignitable liquids are available online at https://tinyurl.com/ybxvmd4a.
Author Contributions
Conceptualization, R.J.A. and J.J.H.; Data curation, R.J.A.; Formal analysis, R.J.A.; Funding acquisition, J.J.H.; Investigation, R.J.A.; Methodology, R.J.A. and J.J.H.; Peer review of interpretation, G.Z. and P.M.L.S.; Project administration, J.J.H.; Resources, J.J.H.; Supervision, J.J.H.; Writing—original draft, R.J.A. and J.J.H.; and Writing—review and editing, J.J.H., G.Z. and P.M.L.S.
Funding
This research was funded by the Natural Sciences Engineering Research Council (NSERC) Canada through a Discovery Grant to JJH.
Conflicts of Interest
The authors declare no conflict of interest. The funders had no role in the design of the study; in the collection, analyses, or interpretation of data; in the writing of the manuscript, or in the decision to publish the results.
References
- Jackowski, J.P. The incidence of ignitable liquid residues in fire debris as determined by a sensitive and comprehensive analytical scheme. J. Forensic Sci. 1997, 42, 828–832. [Google Scholar] [CrossRef]
- Sandercock, P.M.L. Passive headspace extraction of ignitable liquids using activated carbon cloth. Can. Soc. Forensic Sci. J. 2016, 49, 176–188. [Google Scholar] [CrossRef]
- Lentini, J.J.; Dolan, J.A.; Cherry, C. The petroleum-laced background. J. Forensic Sci. 2000, 45, 968–989. [Google Scholar] [CrossRef] [PubMed]
- DeHaan, J.D. Fire investigations and the forensic lab: What the lab should be doing, or, it’s not about the GC. CAC News 2002, 4, 14–16. [Google Scholar]
- DeHaan, J.D. Our changing world, Part 3: Is more sensitive necessarily more better? and Part 4: A matter of time. Fire Arson Investig. 2002, 52, 20–23. [Google Scholar]
- Almirall, J.R.; Furton, K.G. Analysis and Interpretation of Fire Scene Evidence; CRC Press: Boca Raton, FL, USA, 2004; p. 262. [Google Scholar]
- Hetzel, S.S.; Moss, R.D. How long after waterproofing a deck can you still isolate an ignitable liquid? J. Forensic Sci. 2005, 50, 369–376. [Google Scholar] [CrossRef] [PubMed]
- Lang, T.; Dixon, B.M. The possible contamination of fire scenes by the use of positive pressure ventilation fans. Can. Soc. Forensic Sci. J. 2000, 33, 55–60. [Google Scholar] [CrossRef]
- Koussaifes, P.M. Evaluation of fire scene contamination by using positive-pressure ventilation fans. Forensic Sci. Commun. 2002, 4, 4. [Google Scholar]
- Armstrong, A.; Babrauskas, V.; Holmes, D.L.; Martin, C.; Powell, R.; Riggs, S.; Young, L.D. The evaluation of the extent of transporting or “tracking” an identifiable ignitable liquid (gasoline) throughout fire scenes during the investigative process. J. Forensic Sci. 2004, 49, 741–748. [Google Scholar] [CrossRef]
- Belchior, F.; Andrews, S.P. Evaluation of cross-contamination of nylon bags with heavy-loaded gasoline fire debris and with automotive paint thinner. J. Forensic Sci. 2016, 61, 1622–1631. [Google Scholar] [CrossRef]
- DeHaan, J.D. Canine accelerant detection teams: Validation and certification. CAC News 1994, 2, 17–21. [Google Scholar]
- Kurz, M.E.; Billard, M.; Rettig, M.; Augustiniak, J.; Lange, J.; Larsen, M.; Warrick, R.; Mohns, T.; Bora, R.; Broadus, K.; et al. Evaluation of canines for accelerant detection at fire scenes. J. Forensic Sci. 1994, 39, 1528–1536. [Google Scholar] [CrossRef] [PubMed]
- Tindall, R.; Lothridge, K. An evaluation of 42 accelerant detection canine teams. J. Forensic Sci. 1995, 40, 561–564. [Google Scholar] [CrossRef]
- Katz, S.R.; Midkiff, C.R. Unconfirmed canine accelerant detection: A reliability issue in court. J. Forensic Sci. 1998, 43, 329–333. [Google Scholar] [CrossRef]
- Ottley, B.L. Beyond the crime laboratory: The admissibility of unconfirmed forensic evidence in arson cases. N. Engl. J. Crim. Civ. Confin. 2010, 36, 263. [Google Scholar]
- Twibell, J.D.; Home, J.M.; Smalldon, K.W. A comparison of the relative sensitivities of the adsorption wire and other methods for the detection of accelerant residues in fire debris. J. Forensic Sci. Soc. 1980, 22, 155–159. [Google Scholar] [CrossRef]
- Loscalzo, P.; DeForest, P.R.; Chao, J. A study to determine the limit of detectability of gasoline vapor from simulated arson residues. J. Forensic Sci. 1980, 25, 162–167. [Google Scholar] [CrossRef]
- Thatcher, P.J. The scientific investigation of fire causes. Forensic Sci. Prog. 1986, 1, 117–152. [Google Scholar]
- Choodum, A.; Nic Daéid, N. Development and validation of an analytical method for hydrocarbon residues using gas chromatography-mass spectrometry. Anal. Methods 2011, 3, 1136–1142. [Google Scholar] [CrossRef]
- Frysinger, G.S.; Gaines, R.B. Forensic analysis of ignitable liquids in fire debris by comprehensive two-dimensional gas chromatography. J. Forensic Sci. 2002, 47, 471–482. [Google Scholar]
- Dolan, J. Recent advances in the applications of forensic science to fire debris analysis. Anal. Bioanal. Chem. 2003, 376, 1168–1171. [Google Scholar] [CrossRef] [PubMed]
- Stauffer, E.; Lentini, J.J. ASTM standards for fire debris analysis: A review. Forensic Sci. Int. 2003, 132, 63–67. [Google Scholar] [CrossRef]
- Taylor, C.M.; Rosenhan, A.K.; Raines, J.M.; Rodriguez, J.M. An arson investigation by using comprehensive two-dimensional gas chromatography-quadrupole mass spectrometry. J. Forensic Res. 2012, 3, 169. [Google Scholar]
- Klee, M.S.; Blumberg, L.M. Theoretical and practical aspects of fast gas chromatography and method translation. J. Chromatogr. Sci. 2002, 40, 234–247. [Google Scholar] [CrossRef] [PubMed]
- Blumberg, L.M.; Klee, M.S. Optimal heating rate in gas chromatography. J. Microcolumn Sep. 2000, 12, 508–514. [Google Scholar] [CrossRef]
- American Society for Testing and Materials. ASTM E1618-14 Standard Test Method for Ignitable Liquid Residues in Extracts from Fire Debris Samples by Gas Chromatography-Mass Spectrometry; ASTM International: West Conshohocken, PA, USA, 2014. [Google Scholar]
- McLafferty, F.W.; Tureček, F. Interpretation of Mass Spectra, 4th ed.; University Science Books: Mill Valley, CA, USA, 1993; p. 371. [Google Scholar]
- Stauffer, E.; Dolan, J.A.; Newman, R. Fire Debris Analysis, 1st ed.; Elsevier/Academic Press: London, UK, 2008. [Google Scholar]
- Sampat, A.; van Daelen, B.; Lopatka, M.; Mol, H.; van der Weg, G.; Vivó-Truyols, G.; Sjerps, M.; Schoenmakers, P.; van Asten, A. Detection and characterization of ignitable liquid residues in forensic fire debris samples by comprehensive two-dimensional gas chromatography. Separations 2018, 5, 43. [Google Scholar] [CrossRef]
- Doong, R.; Chang, S.; Sun, Y. Solid-phase microextraction for determining the distribution of sixteen US Environmental Protection Agency polycyclic aromatic hydrocarbons in water samples. J. Chromatogr. A 2000, 879, 177–188. [Google Scholar] [CrossRef]
- Speight, J.G. Handbook of Petroleum Analysis; John Wiley & Sons: New York, NY, USA, 2001; p. 473. [Google Scholar]
- Sandercock, P.M.L. A survey of Canadian gasoline (2004). Can. Soc. Forensic Sci. J. 2007, 40, 105–130. [Google Scholar] [CrossRef]
- Sandercock, P.M.L. Survey of Canadian gasoline (Winter 2010). Can. Soc. Forensic Sci. J. 2012, 45, 64–78. [Google Scholar] [CrossRef]
- Bertsch, W.; Zhang, Q.W.; Holzer, G. Using the tools of chromatography, mass spectrometry, and automated data processing in the detection of arson. J. High Resolut. Chromatogr. 1990, 13, 597–605. [Google Scholar] [CrossRef]
- Lentini, J.J. An improved method of obtaining ion profiles from ignitable liquid residue samples. CAC News 1995, 4, 18. [Google Scholar]
- Kurz, M.E.; Schultz, S.; Griffith, J.; Broadus, K.; Sparks, J.; Dabdoub, G.; Brock, J. Effect of background interference on accelerant detection by canines. J. Forensic Sci. 1996, 41, 868–873. [Google Scholar] [CrossRef] [PubMed]
- American Society for Testing and Materials. ASTM E1412-16 Standard Practice for Separation of Ignitable Liquid Residues from Fire Debris Samples by Passive Headspace Concentration with Activated Charcoal; ASTM International: West Conshohocken, PA, USA, 2016. [Google Scholar]
- Dehaan, J.D.; Bonarius, K. Pyrolysis products of structure fires. J. Forensic Sci. Soc. 1988, 28, 299–309. [Google Scholar] [CrossRef]
© 2018 by the authors. Licensee MDPI, Basel, Switzerland. This article is an open access article distributed under the terms and conditions of the Creative Commons Attribution (CC BY) license (http://creativecommons.org/licenses/by/4.0/).

