Article

Challenges in Determining the Size Distribution of Nanoparticles in Consumer Products by Asymmetric Flow Field-Flow Fractionation Coupled to Inductively Coupled Plasma-Mass Spectrometry: The Example of Al2O3, TiO2, and SiO2 Nanoparticles in Toothpaste

1
Division for Food Technology, National Food Institute, Technical University of Denmark, Kemitorvet 201, DK-2800 Kgs. Lyngby, Denmark
2
Eawag, Swiss Federal Institute of Aquatic Science and Technology, Ueberlandstrasse 133, CH-8600 Duebendorf, Switzerland
3
Group of Environmental and Soil Chemistry, Institute for Environmental Sciences, University of Koblenz-Landau, Fortstrasse 7, 76829 Landau, Germany
*
Author to whom correspondence should be addressed.
Separations 2018, 5(4), 56; https://doi.org/10.3390/separations5040056
Submission received: 31 October 2018 / Revised: 19 November 2018 / Accepted: 21 November 2018 / Published: 27 November 2018
(This article belongs to the Special Issue Analytic Techniques for Nano- and Microparticles Analysis)

Abstract

:
According to the current European regulation on cosmetics, any ingredient present as a nanomaterial should be indicated in the ingredient list. There is a need for analytical methods capable of determining the size of the relevant ingredients and thus assessing if these are nanomaterials or not. An analytical method based on asymmetric flow field-flow fractionation (AF4) and inductively coupled plasma-mass spectrometry (ICP-MS) was developed to determine the size of particles present in a commercial toothpaste. Multi-angle light scattering (MALS) was used for on-line size determination. The number-based particle size distributions (PSDs) of the particles were retrieved upon mathematical conversion of the mass-based PSDs recovered from the AF4-ICP-MS fractograms. AF4-ICP-MS allowed to separate and detect Al2O3 and TiO2 particles in the toothpaste and to retrieve a correct TiO2 number-based PSD. The potential presence of particles in the lower size range of the Al2O3 mass-based PSD had a strong impact on sizing and nanomaterial classification upon conversion. AF4 coupled with ICP-MS and MALS was found to be a powerful approach for characterization of different particles in a multiple-particle system such as toothpaste. Confirmation of particle size by a secondary method such as single particle ICP-MS or hydrodynamic chromatography was crucial.

1. Introduction

Nanotechnology is considered a key enabling technology in the European Union (EU) and nanomaterials are present in almost any industrial sector including chemicals, energy, consumer products, health, and the environment. In line with the growing interest in nano-applications, concerns have been raised regarding the potential risks and safety of nanomaterials, as their behavior and properties can be distinct compared to other chemicals and substances. Continuous efforts have been carried out for their risk assessment and to address nanomaterials in the relevant horizontal and sector-specific legislations [1].
Recently updated product-specific EU legislations explicitly address nanomaterials, including nanomaterial-specific information requirements, authorization of nanomaterials for specific uses, and a safety assessment that takes into account nano-specific characteristics [1]. For example, all ingredients present in the form of nanomaterials shall be clearly indicated in the list of ingredients [2].
In order to support and homogenize upcoming European legislation, the European Commission (EC) recommended a definition for the term nanomaterial [3]. Therein, a nanomaterial is defined as a natural, incidental, or manufactured material containing particles, in an unbound state or as an aggregate or as an agglomerate and where, for 50% or more of the particles in the number size distribution, one or more external dimensions is in the size range 1–100 nm. This definition has been under review in order to correct any issues found since its adoption [1]. The EC has also the intension of harmonizing the sector-specific regulatory definitions of nanomaterials with the revised EC recommendation (taking into account sector-specific needs) [1].
Considering this and in order to enforce the regulations, there is a need for analytical methods capable of assessing whether a product contains nanomaterials or not (according to the EU definition). For this purpose, the analytical method should ideally allow to reliably measure the number-based particle size distribution (PSD) within the interval of 1 nm to well above 100 nm and to provide the median value of the number-based PSD (D50 value) [4,5]. In case the D50 value is within the range of 1–100 nm, the material is considered to be a nanomaterial [4,5]. If other particles are present in the sample, the method should also allow to identify/discriminate the target particle, e.g., by accessing the chemical identity of the analyzed material [4,5].
Among the existing analytical techniques for characterizing nanoparticles, asymmetric flow field flow fractionation (AF4) hyphenated to multiple detectors such as multi angle light scattering (MALS) or inductively coupled plasma-mass spectrometry (ICP-MS) is a powerful method for the detection and characterization of nanoparticles in highly polydisperse systems and complex matrices [6,7]. The versatile size separation capacity of the AF4 system allows to resolve complex samples (after suitable sample preparation) and to separate particles and macromolecules in a broad size range (roughly from 1 nm to 1000 nm) [6,7]. By coupling this fractionation tool with ICP-MS, it is possible to acquire size and elemental information simultaneously [6,7]. The time-resolved ICP-MS signal can be used to selectively derive the mass-based PSD of the target particle(s) after proper calibration of the AF4 channel with size standards and given that only the target particles contribute to the signal [6]. Knowing the elemental composition and shape of the particles, it is then possible to mathematically convert the mass-based PSD into a number-based PSD [8].
There are only a few studies where AF4 coupled to ICP-MS has been exploited to analyze nanoparticles in consumer products or food, including e.g., SiO2 in coffee creamer [9] and tomato soup [10] as well as TiO2 in food items and toothpaste [8], in sunscreen [11,12,13] and in tattoo inks [14], or Ag in chicken meat [15]. In most of these studies, it was possible to detect and size the target particles, but there is still limited knowledge on the applicability of the method for classifying nanomaterials according to the EC recommendation for the definition of nanomaterial. In most cases, it is the mass-based and not the number-based PSD that is presented.
In this paper, we study the feasibility of AF4 coupled to ICP-MS for determining the size of nanoparticles in a specific consumer product, namely toothpaste. Toothpaste was selected among cosmetics since its ingredients can be partially ingested during use and thus the consumers may be exposed orally to nanomaterials. Furthermore, it is a complex chemical mixture that contains water, small molecules, surfactants, and different types of particles with a fraction that can be in the nano-size range (0–100 nm) [16]. Such a multiple particle system is a suitable example for complex systems found in many commercial products. Herein, we show the different methodological steps necessary to determine the PSD of particles in toothpaste, including the conversion from mass- to number-based PSD. To confirm the PSD determined by AF4, collected fractions were analyzed off-line by single particle ICP-MS (spICP-MS). We also discuss the challenges that had to be addressed during method development, the limitations of the methodology, as well as future considerations to be taken when developing AF4 methods for determining the size of nanomaterials in consumer products.

2. Materials and Methods

2.1. Materials

Ultrapure water (18.2 mΩ∙cm at 21.5 °C) was obtained from a Millipore Element apparatus (Millipore, Milford, MA, USA) and used throughout the work. ReagentPlus sodium dodecyl sulfate (SDS) with 98.5% purity and Alcian Blue 8GX powder were purchased from Sigma-Aldrich (St. Louis, MO, USA). Nitric acid (67–69%) of PlasmaPURE quality and single element PlasmaCAL standards of gold (Au), aluminum (Al), rhodium (Rh), silicon (Si), and titanium (Ti) at 1 mg/mL were obtained from SCP Science (Quebec, Canada). Fisherbrand FL-70 Concentrate (FL-70) was acquired from Fisher Scientific (Pittsburgh, MA, USA). For HDC experiments, sodium dodecyl sulfate (SDS), Brij L23, Triton X-100, and penicillamine were purchased from Alfa Aesar, Karlsruhe, Germany; NaOH (p.a.) and citrate-stabilized gold nanoparticles were supplied by Sigma-Aldrich, Schnelldorf, Germany; tuning solution containing P25 TiO2 nanoparticles were obtained from Degussa, Frankfurt, Germany; alpha-Al2O3 from Io-li-tech, Heilbronn, Germany; and 120 nm SiO2 particles from Nanocomposix, San Diego, CA, USA. Suprapur hydrogen peroxide (30%) and Suprapur hydrofluoric acid (40%) were purchased from Merck (Darmstad, Germany). Nanosphere 3000 Series polystyrene size standards with nominal sizes of 50 nm, 100 nm, and 200 nm (NIST traceable diameters of 51 ± 3 nm, 100 ± 3 nm and 203 ± 5 nm as determined by transmission electron microscopy (TEM) by the supplier) were obtained from Thermo Fischer Scientific (Fremont, CA, USA). All size standards were provided as stable stock aqueous dispersions with an approximate concentration of 1% solids (10 g/L). Gold nanoparticles at 60 nm in nominal diameter (RM8013) were obtained from the National Institute for Science and Technology, NIST (Gaithersburg, MD, USA). The toothpaste sample used in this work was provided by the EU FP7 Project “NanoDefine“ [17]. This product was a commercial toothpaste which was sourced directly from a Dutch supermarket (see Table S1 for the list of ingredients). For TEM analysis, TEM Cu grids (carbon supporting films, 200 mesh, Q20459) were acquired from Quantifoil Micro Tools GmbH (Jena, Germany). Polyethersulfone (PES) membranes were purchased from Microdyn-Nadir (Wiesbaden, Germany) and regenerated cellulose (RC) membranes from Wyatt Technology (Dernbach, Germany).

2.2. Methods

2.2.1. Total Element Concentration in Toothpaste by ICP-MS

For determining the total concentration of Al, Si, and Ti in the toothpaste by ICP-MS, a chemical digestion procedure with 67–69% nitric acid (HNO3) and 40% hydrofluoric acid (HF) was used. Firstly, a mass of approximately 200 mg of toothpaste was directly weighed into tared Teflon inserts for stainless steel pressure vessels (Berghof GmbH, Eningen, Germany). Secondly, 2 mL of HNO3 were added followed by 2 mL of HF. The pressure vessels were then placed in an oven (Heraeus Instrument, Hanau, Germany) and heated to 160 °C for 4 h. After cooling to room temperature, the samples were diluted with ultrapure water to a total mass of 20 g. Prior to the measurement by ICP-MS, the samples were further diluted 2000 times with ultrapure water. Three subsamples of toothpaste from the same tube were analyzed in this way. A Triple Quadrupole ICP-MS (Agilent 8800 ICP-QQQ-MS, Santa Clara, CA, USA) equipped with a MicroMist concentric nebulizer and a Scott type double-pass water-cooled spray chamber was used for analysis. The instrument was operated in MS/MS mode with the reaction gas consisting of hydrogen for Si (measuring 28Si on-mass) and 10% ammonia in helium for Ti (measuring 48Ti as the product ion [48Ti(14N1H3)6]+ with m/z 150) with 0.1 s integration time per mass. For Al, no gas mode was used and 27Al was measured on-mass. Typical plasma conditions were 1550 W RF power, 15 L/min plasma gas, 1.05 L/min carrier gas, and 0 L/min makeup gas. Cell gas flows were 2.2 mL/min for ammonia and 7.0 mL/min for 30% hydrogen in helium. Instrument parameters were optimized by Autotune in the MassHunter software (Agilent, Santa Clara, CA, USA) using a tune solution (1 µg/L Li, Mg, Co, Y, Ce, and Tl, Agilent). The autosampler (ASX-500, Agilent Technologies, Waldbronn, Germany) introduced the samples into the ICP-MS with a sample uptake time of 50 s (0.5 rps) and a stabilization time of 30 s (0.1 rps). Quantification was done by external calibration with an Al/Si/Ti standard mix prepared in 2% v/v nitric acid (HNO3) with internal standardization. Internal standard was added on-line (5 µg/L Sc) via a t-piece using the peristaltic pump.

2.2.2. Particle Size by Dynamic Light Scattering and Zeta Potential by Laser Doppler Velocimetry

For the pre-characterization studies by dynamic light scattering (DLS) and zeta potential measurements, the toothpaste was dispersed in ultrapure water. First, approximately 100 mg of toothpaste were weighted into a 20 mL glass vial. Thereafter, 10 mL of ultrapure water were added to obtain a final concentration of approximately 10 g toothpaste/L ultrapure water. This mixture was then vortexed (MS2 minishaker, IKA-Werke GmbH & Co, Staufen, Germany) at 2500 rpm until no sediment was visible at the bottom (typically after 2 min). The final toothpaste dispersion containing 1 g toothpaste/L ultrapure water was achieved by further dilution (1:10) in ultrapure water followed by vortexing.
DLS and laser Doppler velocimetry were used for obtaining information on the hydrodynamic diameter dh and zeta potential of the particles using a Zetasizer Nano-ZS instrument (Malvern Instruments, Malvern, UK). Prior to the measurement, the instrument was warmed up for at least 30 min. The measurements were carried our using a dust-free disposable cuvette (DTS0012, Malvern Instruments, UK) for the DLS measurement and a disposable zeta cell (DTS1070, Malvern Instruments, UK) for the zeta potential measurement. For the DLS measurements, the measurement volume was 1 mL, the angle of detection was 173°, and the temperature was 25 °C (achieved following equilibration for 1 min). The measurement position was fixed at the center of the cell/cuvette. The laser power (attenuator index) was determined automatically by the instrument. Five consecutive measurements were performed using a minimum of 11 runs of 10 s each. The DLS characteristics of the measured sample, given as Z-average (Zave) (intensity-weighted harmonic mean diameter) and polydispersity index (PDI), were determined by averaging the replicates values (N = 5). For determination of the zeta potential, 700 µL of toothpaste dispersion were transferred to the zeta cell. After 2 min of equilibration to a temperature of 25 °C, three consecutive measurements were performed. The Smoluchowski approximation was used for calculation of the zeta potential. The mean zeta potential of the toothpaste sample was obtained by averaging the replicates values (N = 3).

2.2.3. Evaluation of Particle Size and Morphology by Scanning Transmission Electron Microscopy in Combination with Energy-Dispersive X-ray Spectroscopy

Scanning transmission electron microscopy (STEM) in combination with energy-dispersive X-ray spectroscopy (EDX) mapping was used to evaluate the morphology and size of the particles in the toothpaste sample. For analysis, a toothpaste dispersion (1 g toothpaste/L) was prepared upon chemical oxidation with hydrogen peroxide (see following section) in order to remove most of the organic components of the toothpaste matrix. Prior to use, the TEM grids were treated with a solution of 1% (w/w) Alcian Blue to obtain a positive surface charge. After sample preparation, the toothpaste dispersion was further diluted 10 times with ultrapure water. Thereafter, 10 µL of the diluted toothpaste dispersion were deposited onto the Alcian Blue-treated TEM grids using high-speed centrifugation (15,000× g relative centrifugal force for 1 h). Images were taken with a FEI Talos 200 kV TEM with a high angle annular dark field (HAADF) detector in STEM mode. The images scanned by STEM were then mapped by chemical composition (Al, O, Si, T) using the EDX detector.

2.2.4. Particle Size and Concentration by AF4 Coupled to Multiple Detectors

Two sample preparation procedures for AF4 were tested: two-step dilution with ultrapure water and 0.1% w/w SDS (method 1) and chemical oxidation with hydrogen peroxide (H2O2) followed by dilution with 0.1% w/w SDS (method 2). For preparing the samples by method 1, approximately 100 mg of toothpaste were weighed into a disposable Wheaton screw cap glass vial (diameter 15 mm, height 46 mm, volume 4 mL, cap 13–425, MG5, Anton Paar, Lab Support, Hillerød, Denmark). A volume of 3 mL of ultrapure water was added and the mixture was vortexed until no sediment was visible at the bottom (typically for 2 min). Afterwards, a volume of 300 µL of dispersion was taken, diluted to a final mass of 10 g with 0.1% w/w SDS (corresponding to a toothpaste concentration in the resulting dispersion of approximately 1 mg toothpaste/mL) and vortexed again. For preparing the toothpaste dispersions by method 2, approximately 100 mg of toothpaste were weighted again into a glass vial. A volume of 3 mL of 30% H2O2 was added with a pipette and this mixture was vortexed as in method 1. A volume of 300 µL of the toothpaste–H2O2 mixture was then transferred to another glass vial and subsequently treated in a closed microwave digestion system (Multiwave 3000, Anton Paar, Graz, Austria) equipped with a 64MG5 rotor. The following microwave program was used: step 1—0→200 W (ramp) for 10 min; step 2—200 W for 5 min; step 3—200→500 W (ramp) for 10 min; step 4—500 W for 25 min; step 5—0 W (cooling) for 10 min. The temperature inside the microwave vial was monitored online using an infrared sensor and a maximum temperature of 120 °C was established. Typically, the temperature within the microwave vials reached a maximum of 75 to 85 °C at the beginning of step 4 and remained constant at around those values until step 5 (cooling). After digestion, the sample was left to cool at room temperature. The sample was then transferred to a 15 mL conical polypropylene tube (Sarstedt, Nümbrecht, Germany) and diluted with 0.1% w/w SDS to a total mass of 10 g (corresponding to a toothpaste concentration in the resulting dispersion of approximately 1 mg toothpaste/mL). Thereafter, the sample was vortexed as described above. Prior to injection into the AF4 system, the toothpaste dispersion was typically diluted two times in ultrapure water. The polystyrene size standards used for AF4 channel calibration were prepared by diluting the stock suspensions in ultrapure water to a concentration of 5 mg/L. Before dilution, the stock suspensions were gently mixed by inverting the bottles and dispersed by low power bath sonication (10–15 s), as recommended by the manufacturer.
The AF4 system used in this study consisted of an Agilent 1200 series autosampler (G1329A), a high performance liquid chromatography pump (G1311A) (Agilent Technologies, Santa Clara, CA, USA), an Eclipse 3 AF4 flow control module, and a short channel-type AF4 separation channel (Wyatt Technology Europe GmbH, Dernbach, Germany). The accumulation wall in the AF4 channel was PES membranes (Nadir UP010P) or regenerated cellulose (RC) membranes (Millipore PLGC) with a molecular weight cut-off of 10 kDa. The typically used AF4 separation program is shown in Table 1. The injection and relaxation of the sample occurs during steps three to five. For injection and relaxation, the stop-flow method was applied using the setup described in [18]. The focus flow rate was typically the same as the selected cross flow rate. An injection flow rate of 0.2 mL/min was selected based on previous experience [18] and injection volumes were in the range of 10 to 50 µL. The channel/spacer height, which is one of the main parameters influencing the separation of particles according to AF4 theory, was kept constant throughout the experiments. A 350 µm spacer height was chosen based on previous work [18]. Since satisfactory recoveries and separation were achieved with these conditions, it was decided to keep these parameters constant throughout method development. The separation of the particles in the sample occurred during step 6 and the cross flow rate was optimized during method development. In step 7, the separation force was removed by setting the cross flow rate to zero to investigate if a fraction of the sample was released (in a “release peak”) following strong retention in the channel. In step 8, the injection system including injection loop, injection tubings, and inject port was flushed with carrier liquid to test if a fraction of the sample had remained in the system.
The AF4 carrier liquids were produced by dissolving SDS in ultrapure water or by dilution of FL-70 in ultrapure water. Following separation, various detectors were used to collect information about the eluting fractions. A series 1100 diode array detector (Agilent G1315A, DAD) was used to record the absorbance signal at pre-defined wavelengths. Additionally, absorption spectra were recorded in the wavelength range of 191–949 nm (steps of 10 nm) during the separation every 2 s. A DAWN HELEOS (Wyatt Technology Europe GmbH, Dernbach, Germany) MALS detector with 17 observation angles operated with a linear polarized laser light at 658 nm was used to record the light scattering signal. The MALS detector was set to a sampling time interval of 1 s per data point. The detector at angle 90° was used for light scattering detection of the particles by AF4 (AF4-LS). Data from the light scattering detectors was processed using the ASTRA V software (version 5.3.2.15, Wyatt Technology Corporation, Santa Barbara, CA, USA). The root mean square (rms) diameter was determined using a 3rd order Debye model because of its robustness and fitting capabilities for both spherical and non-spherical particles [10].
An ICP-MS instrument (ICP-MS 7500ce, Agilent Technologies, Tokyo, Japan) was the final detector. The instrument was equipped with a MicroMist concentric nebulizer and a Scott type double-pass water-cooled spray chamber and was operated without a reaction/collision gas. Typical plasma conditions were 1500 W RF power, 15 L/min plasma gas, 0.83 L/min carrier gas, and 0.25 L/min makeup gas. Internal standard (50 or 10 µg/L Rh) was added on-line via a t-piece using the peristaltic pump. The isotopes 27Al, 47Ti, 28Si, and 103Rh were monitored with 0.5 s integration time per isotope. Mass calibration was done by post-channel calibration with Al and Ti standard mix solutions (0 µg/L, 2.5 µg/L, 5 µg/L, 7.5 µg/L, and 10 µg/L) in 2% v/v HNO3. The standards were injected directly into the AF4 flow prior to the t-piece using a 200 µL manual injection loop (Rheodyne, Cotati, CA, USA). Baseline corrections were performed on all fractograms, and peak areas were determined using the Peak Analyzer in OriginPro 9.0.0 (OriginLab Corporation, MA, USA). The intensity signals were all normalized to the internal standard (103Rh) in order to compensate for variations in the ICP-MS sensitivity. For determining retention time values (at peak maximum), linear regression, non-linear peak fitting, and signal smoothing the same software was used. For evaluating the separation between void and main peak, peak resolution Rs was determined according to the following equation [19]:
R s = 2 | ( t r , 1 t r , 2 ) | w 1 + w 2
where tr,1 and tr,2 are the retention times associated with peak maxima of the void and main peak respectively. w1 and w2 are the corresponding baseline widths of the peaks. For determination of Rs, the peaks were fitted with a Gaussian function.
The mass-based PSDs were determined after conversion of the retention time to hydrodynamic diameter based on size calibration with polystyrene size standards. To obtain the number-based PSD the particle mass concentrations were converted to particle number concentrations by assuming spherical α-Al2O3 and TiO2 (anatase) particles with a density of 3.9 g/cm³ each [20], and using the following equation:
c n = 6 · c m ρ · π · d 3
where cn is the particle number concentration, cm is the particle mass concentration, ρ the density of the particle, and d the (hydrodynamic) diameter of the particle. The Al2O3 and TiO2 particle mass concentrations were calculated from the Al and Ti mass concentrations by multiplying by 1.89 and 1.67, respectively. It was assumed that all detected Al or Ti was present in the form of Al2O3 or TiO2 particles.
For determining AF4 recoveries, flow injections of the samples through the AF4 channel (no cross flow) were performed. The AF4 recovery was calculated as the ratio between the area of the fractograms (with cross flow) and the area of the peaks from the flow injections, for which a 100% recovery was assumed. AF4 recoveries were calculated based on fractograms/flow injections recorded with the MALS detector (90° light scattering signal) and ICP-MS.

2.2.5. Particle Size by spICP-MS

For spICP-MS analysis, fractions from the AF4 eluate were collected directly after the MALS detector (no ICP-MS hyphenation). An iCAP Q ICP-MS (Thermo Fisher Scientific GmbH, Bremen, Germany) was used for single particle analysis. The instrument was equipped with a low-flow concentric nebulizer and a cyclonic, Peltier-cooled spray chamber and operated without cell gas. Typical plasma conditions were 1549 W RF power, 14 L/min plasma gas, 1.04 L/min carrier gas, and 0.79 L/min makeup gas. The “high sensitivity” skimmer cone insert (2.8) was used. For spICP-MS analysis, the collected AF4 fractions were diluted 10 times and the “bulk” sample 10,000 and 20,000 times. For each sample, the signal intensities for 27Al and 47Ti were recorded separately for 180 s using a dwell time of 10 ms (18,000 recorded data points). The recorded signal intensity data was plotted versus number of “events”, to create a signal distribution histogram using Microsoft Excel (Microsoft, WA, USA). The signal intensity threshold above which events were considered as nanoparticles was determined as mean + 6 times the standard deviation of the (time resolved) signal of the sample preparation blank. Conversion of signal intensity to particle mass was based on determination of the transport efficiency using the “particle size” method and calibration with ionic standards [21]. For determination of transport efficiency, first a calibration curve that related 197Au signal intensity to particle mass was created using 60 nm reference gold nanoparticles (NIST RM 8013, calculated particle mass 1.8 fg) diluted 106 times in ultrapure water. Second, a corresponding calibration curve was constructed by determining the average 197Au signal intensity for ionic gold standards at 0.5 and 1.0 µg/L. The gold concentration was converted to mass by multiplication with sample flow rate and dwell time. Finally, the transport efficiency was determined by dividing the slope from the calibration curve made from the ionic gold standards by the slope from the calibration curve created from the gold nanoparticles. A calibration curve for converting the recorded 27Al/47Ti intensities into Al/Ti mass in the particle was constructed from a blank (ultrapure water) and four concentration levels of certified standard solutions of ionic Al and Ti in 0.1% HNO3 ranging from 0.5 to 10 µg/L. No stable signal was obtained when the ionic standards were prepared in ultrapure water. The ICP-MS signal intensity for each standard solution was acquired by averaging the signal intensity recorded during the 60 s measurement time. Al2O3/TiO2 particle masses were calculated by considering the fraction of the analytes Al/Ti in the particle (0.60/0.53). Finally, particle masses were converted to (mass-equivalent) particle diameters by assuming spherical particles with a density of 3.9 g/cm³ each.
Unless stated otherwise, results based on repeated measurements are given as mean ± one standard deviation. The number of repetitions N is stated in parentheses.

2.2.6. Particle Size and Concentration by Hydrodynamic Chromatography Coupled to ICP-MS (HDC-ICP-MS)

As a complement to AF4, toothpaste samples were also analyzed using HDC-ICP-MS. The samples were measured without further dilution or filtration step at a concentration of 1 mg/L. Size separation was achieved at room temperature using a PL-PSDA type 2 hydrodynamic-chromatography column (separation range: 20–1200 nm, Agilent, Germany) connected to an HPLC system (Agilent 1220, Germany). The eluent was an aqueous solution of 0.5 g/L SDS, 1 g/L Brij L23, and 1 g/L Triton X-100, and 7.46 mg/L penicillamine. The pH was adjusted to 10.12 with NaOH. Previously characterized citrate-stabilized spherical gold nanoparticles with diameters between 30–250 nm were used for size calibration [22]. Citrate-stabilized gold nanoparticles with a diameter of 5 nm were injected one minute after each sample for time marking and as an internal standard. The flow-rate of the eluent was 2.6 mL/min and the injection volume was 30 µL for samples and 5 µL for the internal standard. For determining the recovery rate, all samples were also measured without HDC-column (flow injections). The HDC-column was exchanged by a connection fitting and the samples were eluted at a flow-rate of 2.0 mL/min. The recovery rate was then calculated by dividing the integrated signal with column by the integrated signal without column (assumed to result in 100% recovery).
The ICP-MS detector was a quadrupole ICP-MS XSeries 2 (Thermo Scientific) equipped with a PTFE spray chamber, thermostated with a Peltier cooler and a platinum sample cone. The instrument was tuned before each run using a tuning solution containing P25 TiO2 nanoparticles, alpha-Al2O3, and 120 nm SiO2 particles suspended in the HDC eluent. The isotopes: 47Ti, 48Ti, 29Si, 27Al, and 197Au were measured with a dwell time of 100 ms in cell mode (gas: 7% H2 in He). The chromatograms obtained from the ICP-MS software were produced using a homemade script written for the program R 3.5.0 (RStudio). The retention time of the internal standard was used to calculate the retention factor and the intensities were normalized by the main peak intensity of the corresponding chromatogram. The size distribution modes were determined from the peak retention time after a polynomial smoothing using the software Unichrom [23].

3. Results and Discussion

3.1. Pre-Characterisation of the Particles Present in the Toothpaste

The ingredient list of the product (Table S1) stated that the toothpaste contained alumina (Al2O3), hydrated silica (SiO2), and CI 77891 (color index for TiO2 used as pigment). Characterization of the crystal structure of the particles in the toothpaste by X-ray diffraction was provided by NanoDefine project partners and confirmed the presence of alpha-Al2O3 (corundum, crystallite size of 26 nm) and TiO2 anatase (crystallite size of 36 nm) particles in the toothpaste [24]. Alpha-Al2O3 is the most common form of Al2O3 and is used as an abrasive agent in certain whitening toothpastes for its superior polishing/abrasive properties [25,26,27]. Hydrated silica consists of synthetic amorphous SiO2 produced by wet synthesis that can contain surface- or pore-bound water and is added to toothpaste as abrasive and binding/thickening agent [16,27,28,29]. Particulate TiO2 anatase is allowed as a pigment/colorant in cosmetics including toothpaste as CI 77891 [2,27,30]. It could be coated with small amounts of Al2O3, SiO2, or both, to improve the technological properties of the product [2,30].
The average mass concentrations of Al, Si, and Ti in the toothpaste determined by ICP-MS after HNO3 and HF digestion were 5.2 ± 1.2, 111.4 ± 3.2 and 5.2 ± 0.4 mg/g, respectively. A higher mass concentration of Al in the toothpaste (~27 mg/g) was obtained after digestion with a mixture of sulphuric and phosphoric acid [personal communication, Anna Undas, RIKILT]. As the correctness of the latter digestion method was proven by spiking experiments with ionic Al (recoveries between 84% and 125%), we used the Al concentration of 27 mg/g for the following calculations. There were no other components containing Al, Si, and Ti in the ingredient list. Therefore, we assumed that most of the elemental Al, Si, and Ti were present as Al2O3, SiO2, and TiO2 particles, respectively. Considering this, the obtained Al2O3, SiO2, and TiO2 particles concentrations were 50.8, 238.4, and 9.9 mg/g (5.1, 23.8, and 0.9% w/w), respectively. These values were close to typical mass contents of abrasive agents and pigments found in toothpastes (20–50 and 0.05–0.5% w/w, respectively) [16]. The determined concentrations were suitable for AF4 separation followed by MALS/ICP-MS detection after dilution of the samples. The particle concentration values were used for defining the initial injection mass of toothpaste (10 µg, which corresponded to injected masses of 0.507, 0.086, and 2.400 ng for Al2O3, SiO2, and TiO2, respectively) for AF4 method development.
DLS was used to evaluate size of the particles present in the toothpaste after dispersion in water (Figure S1). The obtained PSD was characterized by a broad peak centered at around 426 nm. The Zave was 413.8 nm and the PDI was 0.233. These results only allowed to obtain overall information about the particles in the toothpaste, as all three constituent particles (Al2O3, SiO2, TiO2,) contributed to the light scattering signal. The PSD obtained by DLS covered a size range going from 150 nm to 1500 nm, which was suitable for AF4 and HDC fractionation.
Investigation of the Al2O3, SiO2, and TiO2 particles by STEM-HAADF/EDX showed that all three particle types were present in the toothpaste as large structures of a few hundred nanometers (Figures S2 and S3). This was in agreement with the broad PSD observed by DLS. Al2O3 and SiO2 particles were found as large agglomerates/aggregates (200–400 nm for Al2O3 and 300 nm to several micrometers for SiO2). The Al2O3 agglomerates/aggregates consisted of small primary particles of around 15 nm (Figure S3). Al2O3 was also present as 200–400 nm platelets (Figures S2 and S3). TiO2 particles were found as 200–400 nm aggregates/agglomerates consisting of a few spherical primary particles of 20–80 nm. It was not possible to determine a reliable number-based PSD by STEM/EDX due to the complexity of the sample.
The measured zeta potential for the toothpaste particles in ultrapure water (pH 5–6) was around zero (2.28 ± 0.41 mV). This indicated that steric stabilization could play a role in stabilizing these particles in water. In fact, the toothpaste formulation included a number of surfactants/dispersants (see ingredient list in Table S1). It should be noted that the measured zeta potential is a mean value of all particles and that the constituent particles could have different surface charges. The three particle types present in the toothpaste have a distinct point of zero charge (pzc): The pzc of most commercial alpha-Al2O3 particles is ~8–9, with a few exceptions [31,32,33]. The pzc of TiO2 anatase particles is usually ~6–7 [31,32,33], while the pzc for amorphous SiO2 is normally below 3 [31]. This means that at pH 5–6, the surface charge of the TiO2 particles should be close to neutral. However, the Al2O3 particles should be positively charged and the SiO2 particles negatively charged. Some of the surfactants present in the toothpaste may also alter the surface charge of the particles and stabilize them up to a certain degree upon dilution in ultrapure water. Furthermore, heteroaggregates of Al2O3, TiO2, and SiO2 particles, as observed in Figures S2 and S3, would have an electrophoretic mobility reflecting the proportion of the different types of particles in aggregates. This could result in a total mean electrophoretic mobility close to zero.

3.2. Sample Preparation for AF4

The two tested sample preparation procedures (method 1: two-step dilution with ultrapure water and 0.1% w/w SDS; method 2: chemical oxidation with 30% H2O2 followed by dilution with 0.1% w/w SDS) were first evaluated by visual observation, DLS, and zeta potential measurements. After both procedures, the resulting toothpaste samples could be easily dispersed in 0.1% w/w SDS solution (pH 5–6) by vortex mixing. SDS was selected as dispersing agent because it was suitable for dispersing Al2O3 and TiO2 particles at pH 5–6, by providing a negative surface charge and allowing particle stabilization by electrostatic repulsion [34,35,36,37,38]. At those pH values the pristine SiO2 particles should also be negatively charged (pzc usually below 3, see Section 3.1), thereby allowing electrostatic stabilization of the particles.
The DLS intensity-based PSDs obtained for the toothpaste dispersions prepared by method 1 and method 2 were similar (Figure S1) and characterized by broad peaks centered on 296 nm and 295 nm, respectively. This meant that the chemical oxidation did not cause pronounced changes to the particles (e.g., agglomeration, dissolution). The Zave (303.2 nm and 307.8 nm for methods 1 and 2, respectively) and PDI (0.190 and 0.202 for methods 1 and 2, respectively) were lower than after dispersion of the toothpaste in ultrapure water (413.8 nm and 0.233, respectively; see Section 3.1). These results indicated that the dispersion of the toothpaste particles was improved in the presence of SDS compared to ultrapure water. The zeta potentials were −38.0 mV and −42.6 mV for methods 1 and 2, respectively (after dilution with 0.1% SDS solution)). In contrast, the zeta potential for the toothpaste particles in ultrapure water was close to zero (2.28 mV, see Section 3.1). These results showed that SDS stabilized the toothpaste particles (or some of them) by coating their surface and providing an overall negative surface charge. The DLS and zeta potential results obtained after method 1 and method 2 were very similar, confirming that the constituent particles were stable after the chemical oxidation treatment.
In order to evaluate the suitability of the two sample approaches for AF4 separation, the corresponding toothpaste dispersions were subjected to preliminary analysis by AF4-LS. In order to stabilize the particles as efficiently as possible in the carrier liquid, it was decided to use initially the highest possible SDS concentration (0.05% w/w SDS/ 1.7 mM) that would still be safely below the critical micelle concentration (7−9 mM depending on pH). A 10 kDa PES membrane was selected based on previous experience. A relatively low initial cross flow of 0.5 mL/min was selected considering the relatively large particle (aggregate) sizes (up to 400 nm for Al2O3/TiO2 particles and up to micrometers for SiO2 particles according to TEM). Dispersions prepared by method 1 or 2 where diluted two times with ultrapure water and a volume of 20 µL injected. This corresponded to the injection of approximately 10 µg of toothpaste or 0.5, 2.4 and 0.1 µg of Al2O3, SiO2, and TiO2 particles, respectively (based on the concentrations determined by ICP-MS). The injected masses ensured that the concentrations of the less abundant Al2O3 and TiO2 were sufficient for detection by ICP-MS following separation.
The obtained AF4-LS fractograms are shown in Figure 1 and include rms diameters determined by MALS (gray diamonds and black circles). The AF4-LS fractograms and MALS data provide overall information on the fractionation of all the three particle types (Al2O3, TiO2, and SiO2) present in the samples since all of these contribute to the LS signal. The AF4-LS fractogram obtained for the sample prepared by method 1 (Figure 1, gray line), showed an unusual elution profile with a flat-topped peak (tr = 30 to 45 min). A minor void peak (0.2% of the main peak area) was observed in the early phase of elution (tr = 0 to 4 min), which could result from a fraction of particles that were not retained during separation and small particles (<30 nm) and hence eluted at the void time t0. After tr = 65 min, the cross flow rate was set to 0 mL/min and a larger peak (“release peak”, corresponding to 12% of the main peak area) was observed at tr = 66 min, corresponding to the elution of strongly retained toothpaste particles which could not elute during step six of the separation program (Table 1). The AF4-LS fractogram obtained for the sample prepared by method 2 showed a typical elution profile (Figure 1, black line) with a peak centered at tr = 32–34 min (main peak) indicating a proper separation of the toothpaste particles. For this sample, there was also a void peak of reduced magnitude (tr = 0 to 4 min, 0.2% of the main peak area). There was, however, a high release peak (tr = 67 min, 23% of the main peak area) due to strongly retained particles.
The MALS data confirmed that the fractionation of the particles was suitable for both samples prepared by method 1 and method 2, with a proportional increase of the rms diameter with retention time (for tr > 15 min). The determined rms diameters were in the interval 150–280 nm, which were in agreement with the hydrodynamic diameters determined by DLS (Zave of 307.8 nm), considering the theoretical ratio of rms and geometric diameter for a solid sphere of 0.77. The AF4 recovery based on the LS signal was 52% in case of method 1 and 61% for method 2. For further method development, method 2 was preferred over method 1, considering that method 1 resulted in lower recovery and unusual peak shape. The chemical oxidation step present in method 2 and the associated digestion of organic components in the toothpaste were required in order to achieve a typical AF4 fractogram It is likely that some of the organic components (e.g., surfactants, binders) interacted with the AF4 membrane and thus affected the separation process, as observed for method 1. The use of a digestion procedure for degrading the organic matrix has also been required for proper AF4 separation of particles in previous studies, such as Ag in chicken meat (mild enzymatic digestion) [15], TiO2 in food and toothpaste (mild chemical oxidation with 30% H2O2, as used in this study) [8] or SiO2 in tomato soup (acid digestion with nitric acid and hydrogen peroxide) [10]. In this study, the preliminary experiments with chemical oxidation by 30% H2O2 provided good results. Therefore, it was decided not to test a harsher sample preparation such as acid digestion with concentrated nitric acid.

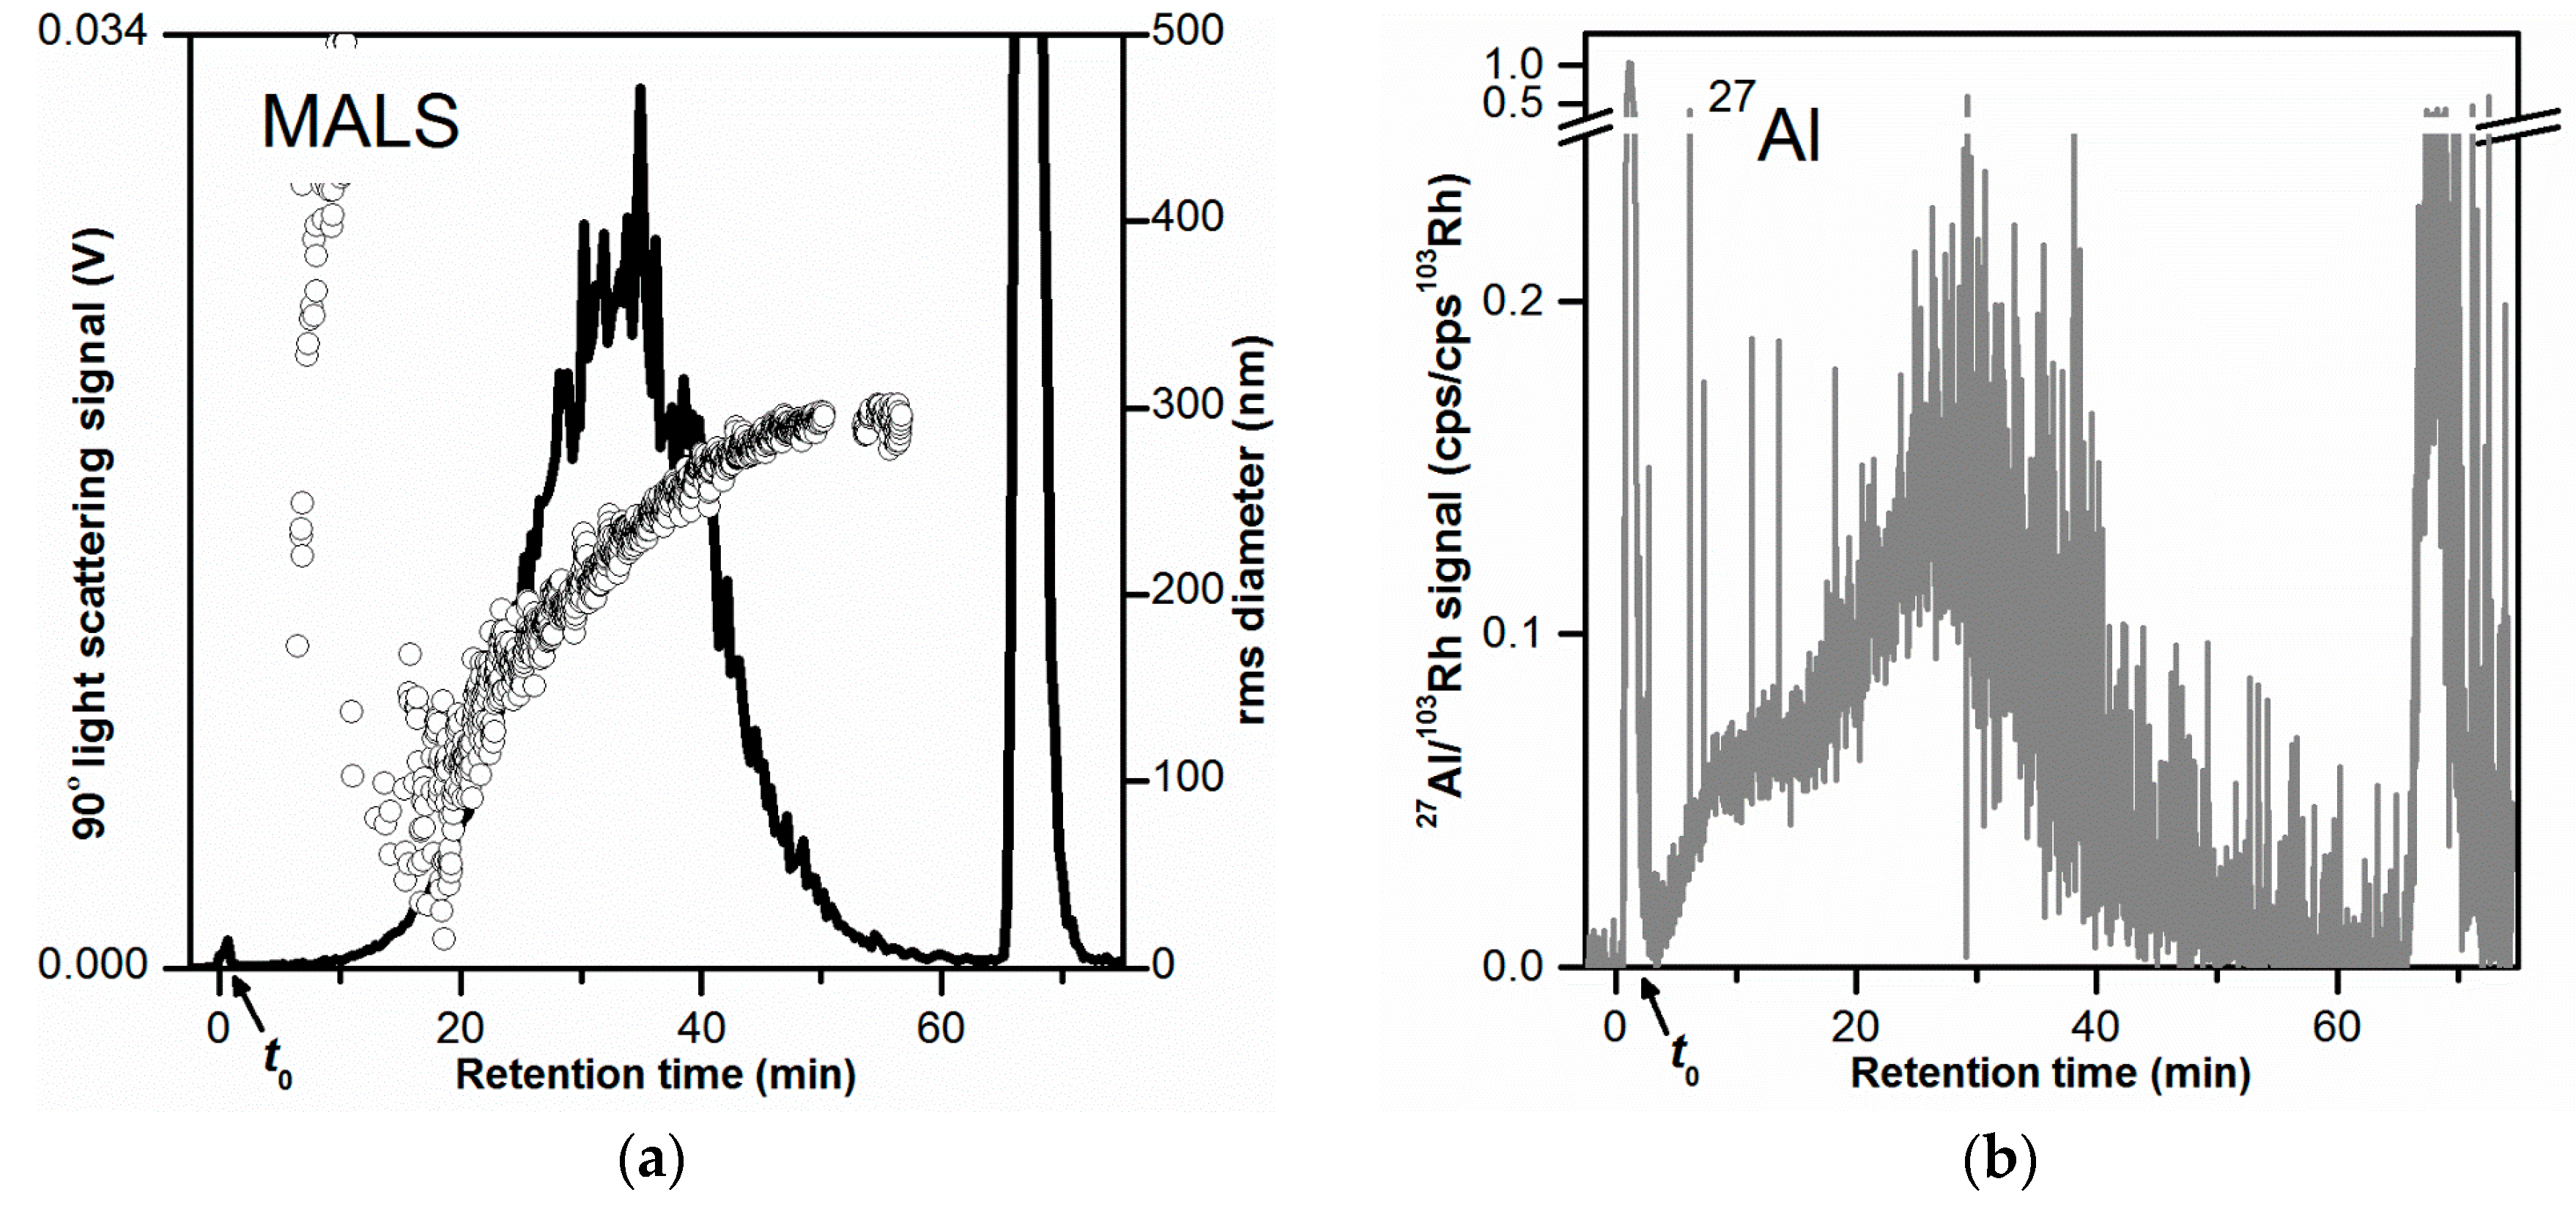
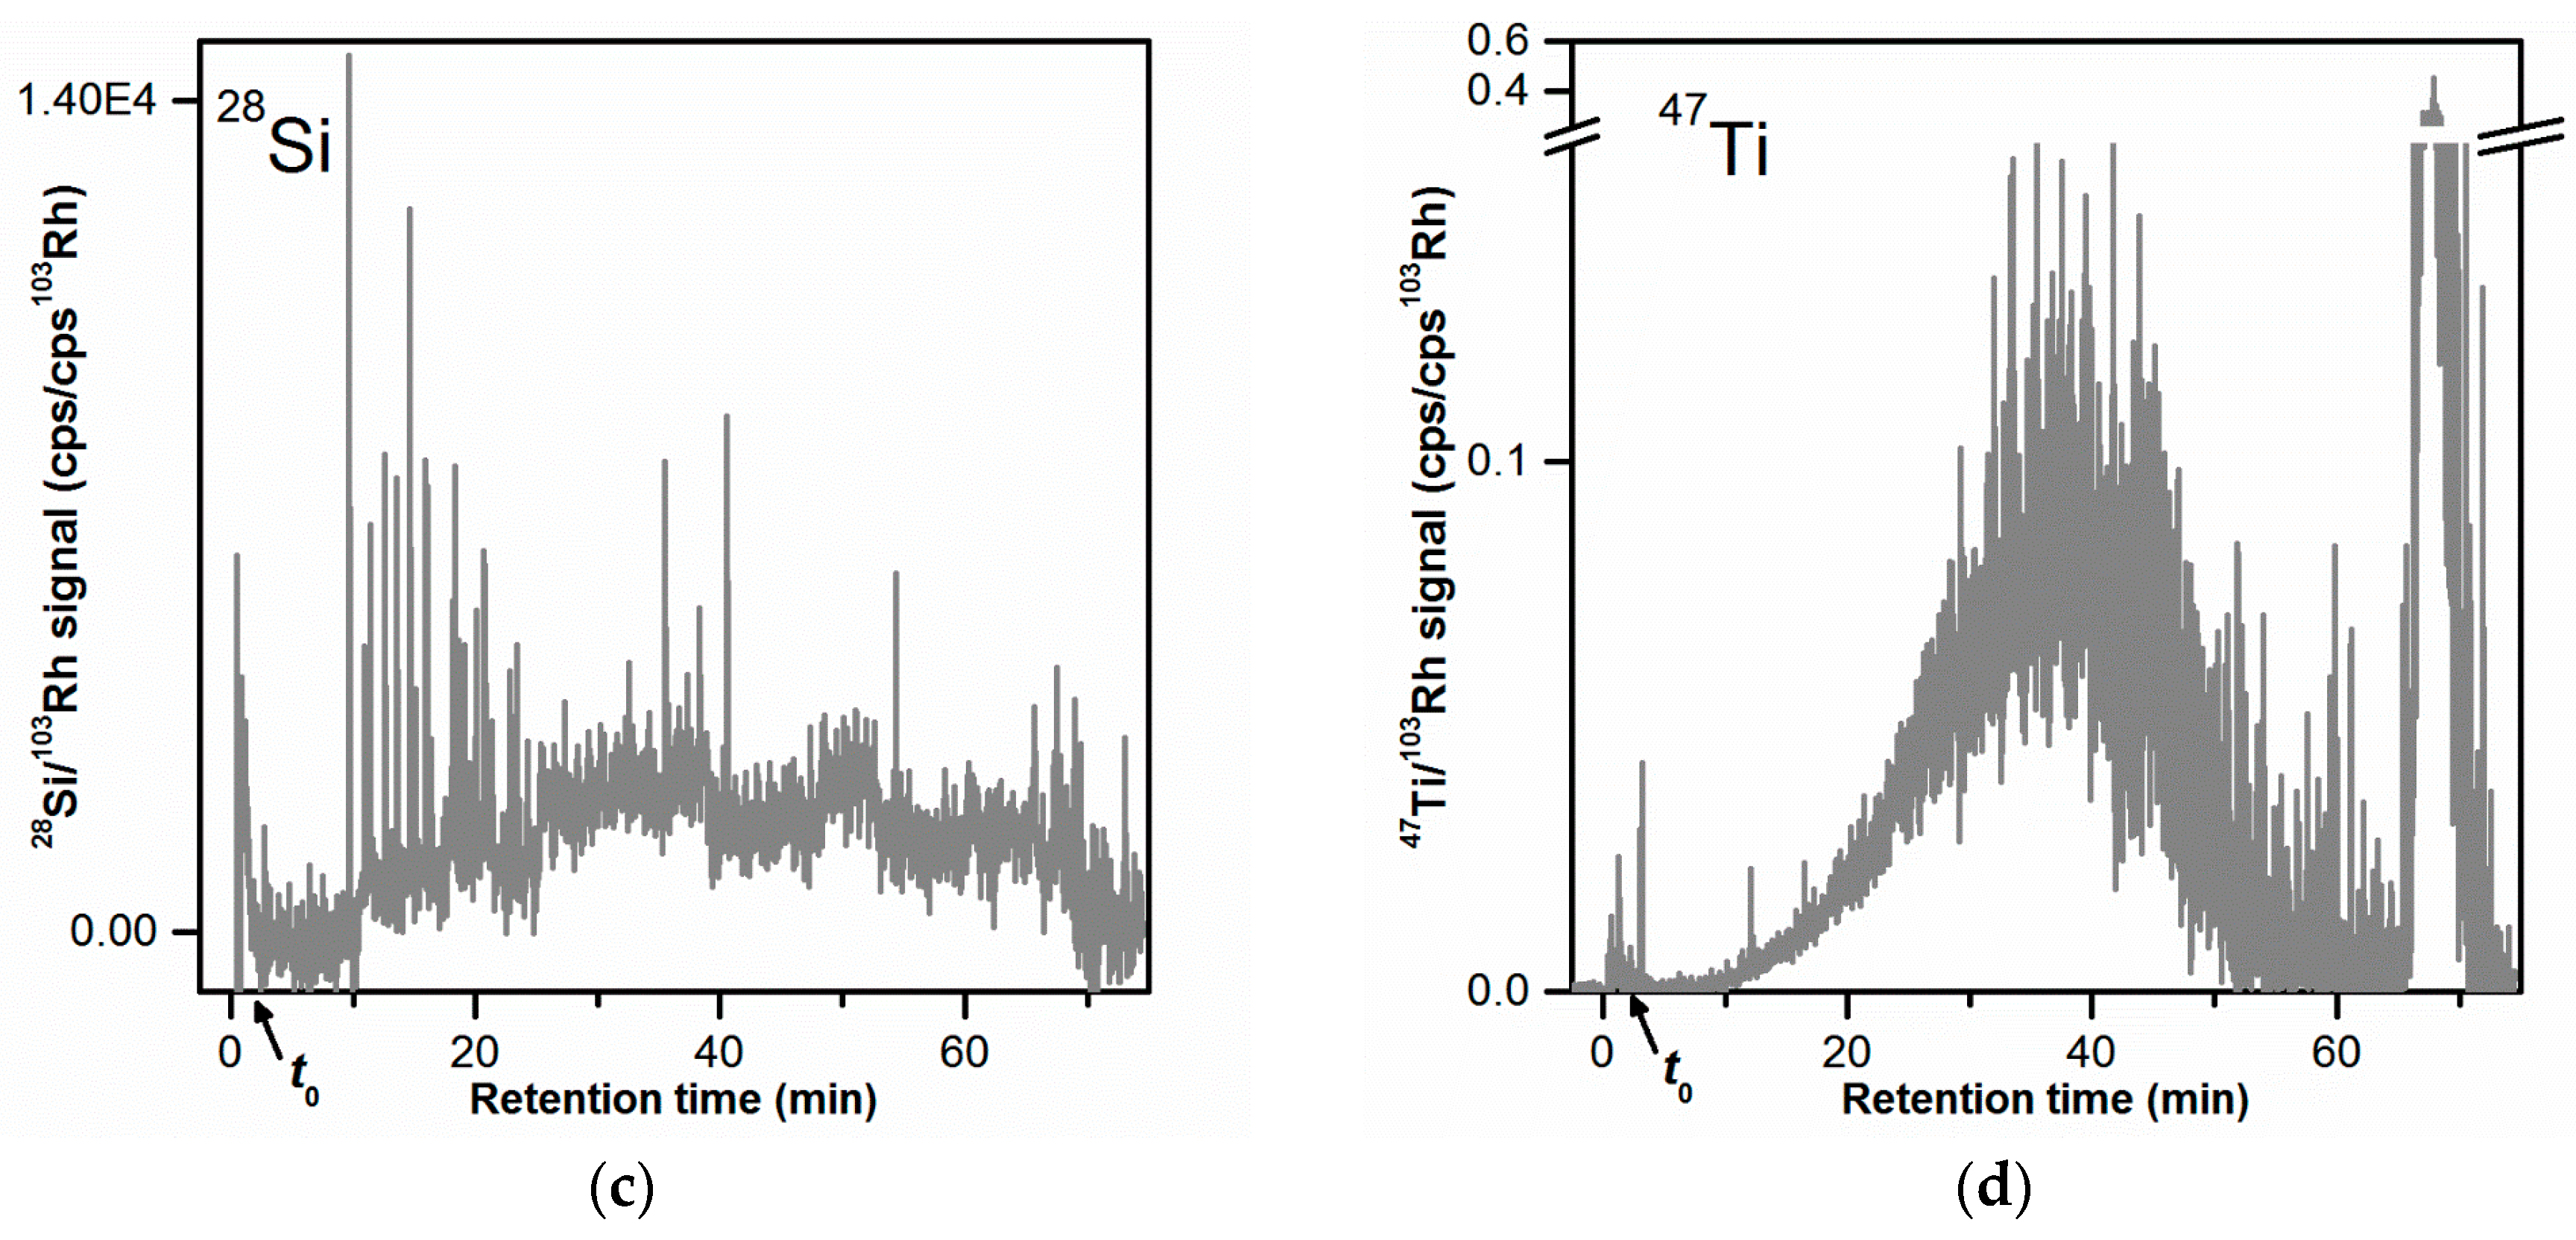
3.3. Detection Methods

Before optimizing the AF4 method, the suitability of the available detectors was evaluated. Following separation by AF4, signals were recorded on-line with three detection methods: LS, ICP-MS and UV-visible absorption. Typical fractograms recorded using LS and ICP-MS (27Al, 28Si, and 47Ti signals, all normalized to internal standard signal 103 Rh) are shown in Figure 2.
As previously discussed, the obtained LS signal (Figure 2a, black line) provided overall information on the fractionation of all three particle types (Al2O3, SiO2, and TiO2), and thus does not allow determination of their individual size and concentration. Therefore, LS was used as a qualitative method to detect the presence of particles in the toothpaste samples based on their scattering and for evaluating the repeatability of the separations. MALS (Figure 2a, black circles) provided the rms diameter, thus enabling the evaluation of the size separation of the particles in the AF4 channel.
ICP-MS was used for the detection of the isotopes 27Al, 28Si, and 47Ti (Figure 2b–d, respectively). The corresponding signals were proportional to the Al, Si, and Ti concentration in the eluate, respectively, and thus could be used for the selective detection of Al2O3, SiO2, and TiO2. Any other Al-, Si-, and Ti- containing species (e.g., molecules) could also contribute to the ICP-MS signals. The fractograms obtained for the 27Al and 47Ti signals (Figure 2b,d) both comprised one broad main peak. The 27Al peak was slightly broader than the 47Ti peak and had its peak mode at lower retention times (tr = 28–31 min for 27Al and tr = 36–38 min for 47Ti). The 27Al main peak comprised also a small shoulder at tr = 6–10 min, which could be due to a smaller size fraction of Al2O3 particles or Al-containing particles. The 27Al fractogram showed a clear void peak (16% of the main peak area) in the early phase of elution (tr = 0 to 4 min), which could be due to unretained Al2O3 particles or any other Al-containing material. A void peak (tr = 0 to 4 min) was also observed for the 47Ti fractogram but of much smaller magnitude (0.4% of the main peak area), showing that there were almost no unretained TiO2 particles. In both 27Al and 47Ti fractograms, a large release peak was observed at tr = 36–38 min (25% and 36% of the main peak area, respectively), corresponding to Al- and Ti-containing material/particles (likely Al2O3 and TiO2 particles) that were strongly retained during separation.
The fractogram obtained with the 28Si signal (Figure 2c) showed no elution peak. The signal displayed high signal spikes especially at tr = 9–25 min. Signal spikes were also visible in the 27Al and 48Ti time traces but not to the same extent as for the 28Si signal. The presence of signal spikes in ICP-MS time-resolved data could most likely be attributed to the ionization of large particles (micrometer-sized) in the plasma. The occurrence of large SiO2 agglomerates/aggregates with sizes ranging from 300 nm to several micrometers was shown by STEM analysis (Figures S2 and S3). The elution of micrometer-sized particles at tr = 9–25 min could be explained with steric elution. To confirm the elution of SiO2 particles at tr = 9–25 min the injected mass of toothpaste was increased by ten times (from 10 µg to 100 µg). This corresponded to an injected SiO2 mass of 24 µg (instead of initially 2.4 µg). An overlay of the AF4-ICP-MS 28Si fractograms obtained with these two injected masses is shown in Figure S4. The 28Si fractogram obtained for higher SiO2 injected mass (black line in Figure S4), shows a peak with a maximum at tr = 19–22 min with large signal spikes as observed for the lower injected mass value. This finding confirmed the elution of SiO2 particles and demonstrated that it could be possible to detect the SiO2 particles in the sample. However, the detection and particle size analysis of the SiO2 particles by AF4-MALS-ICP-MS would not be straightforward, at least simultaneously with the other particles. The large size of the SiO2 particles (with a fraction in the micrometer size range), would make it difficult to obtain direct size information by MALS and most likely results in a different elution mode compared to the Al2O3 and TiO2 particles (steric elution). Therefore, it would require a different AF4 method for separating and analyzing the SiO2 particles. Additionally, detection of the SiO2 particles appeared to require a higher injected mass of toothpaste (100 µg), which could result in channel overload. Considering the above, it was decided to focus AF4 method development on the Al2O3 and TiO2 particles.
With the UV-visible absorbance detector, signals were recorded at three different wavelengths: 250 nm, 400 nm, and 700 nm. For none of the wavelengths, a clear eluting peak was obtained. The absorbance signals were not reproducible and often not distinguishable from the background (results not presented). For these reasons, it was decided to rely on MALS and ICP-MS for further method development.

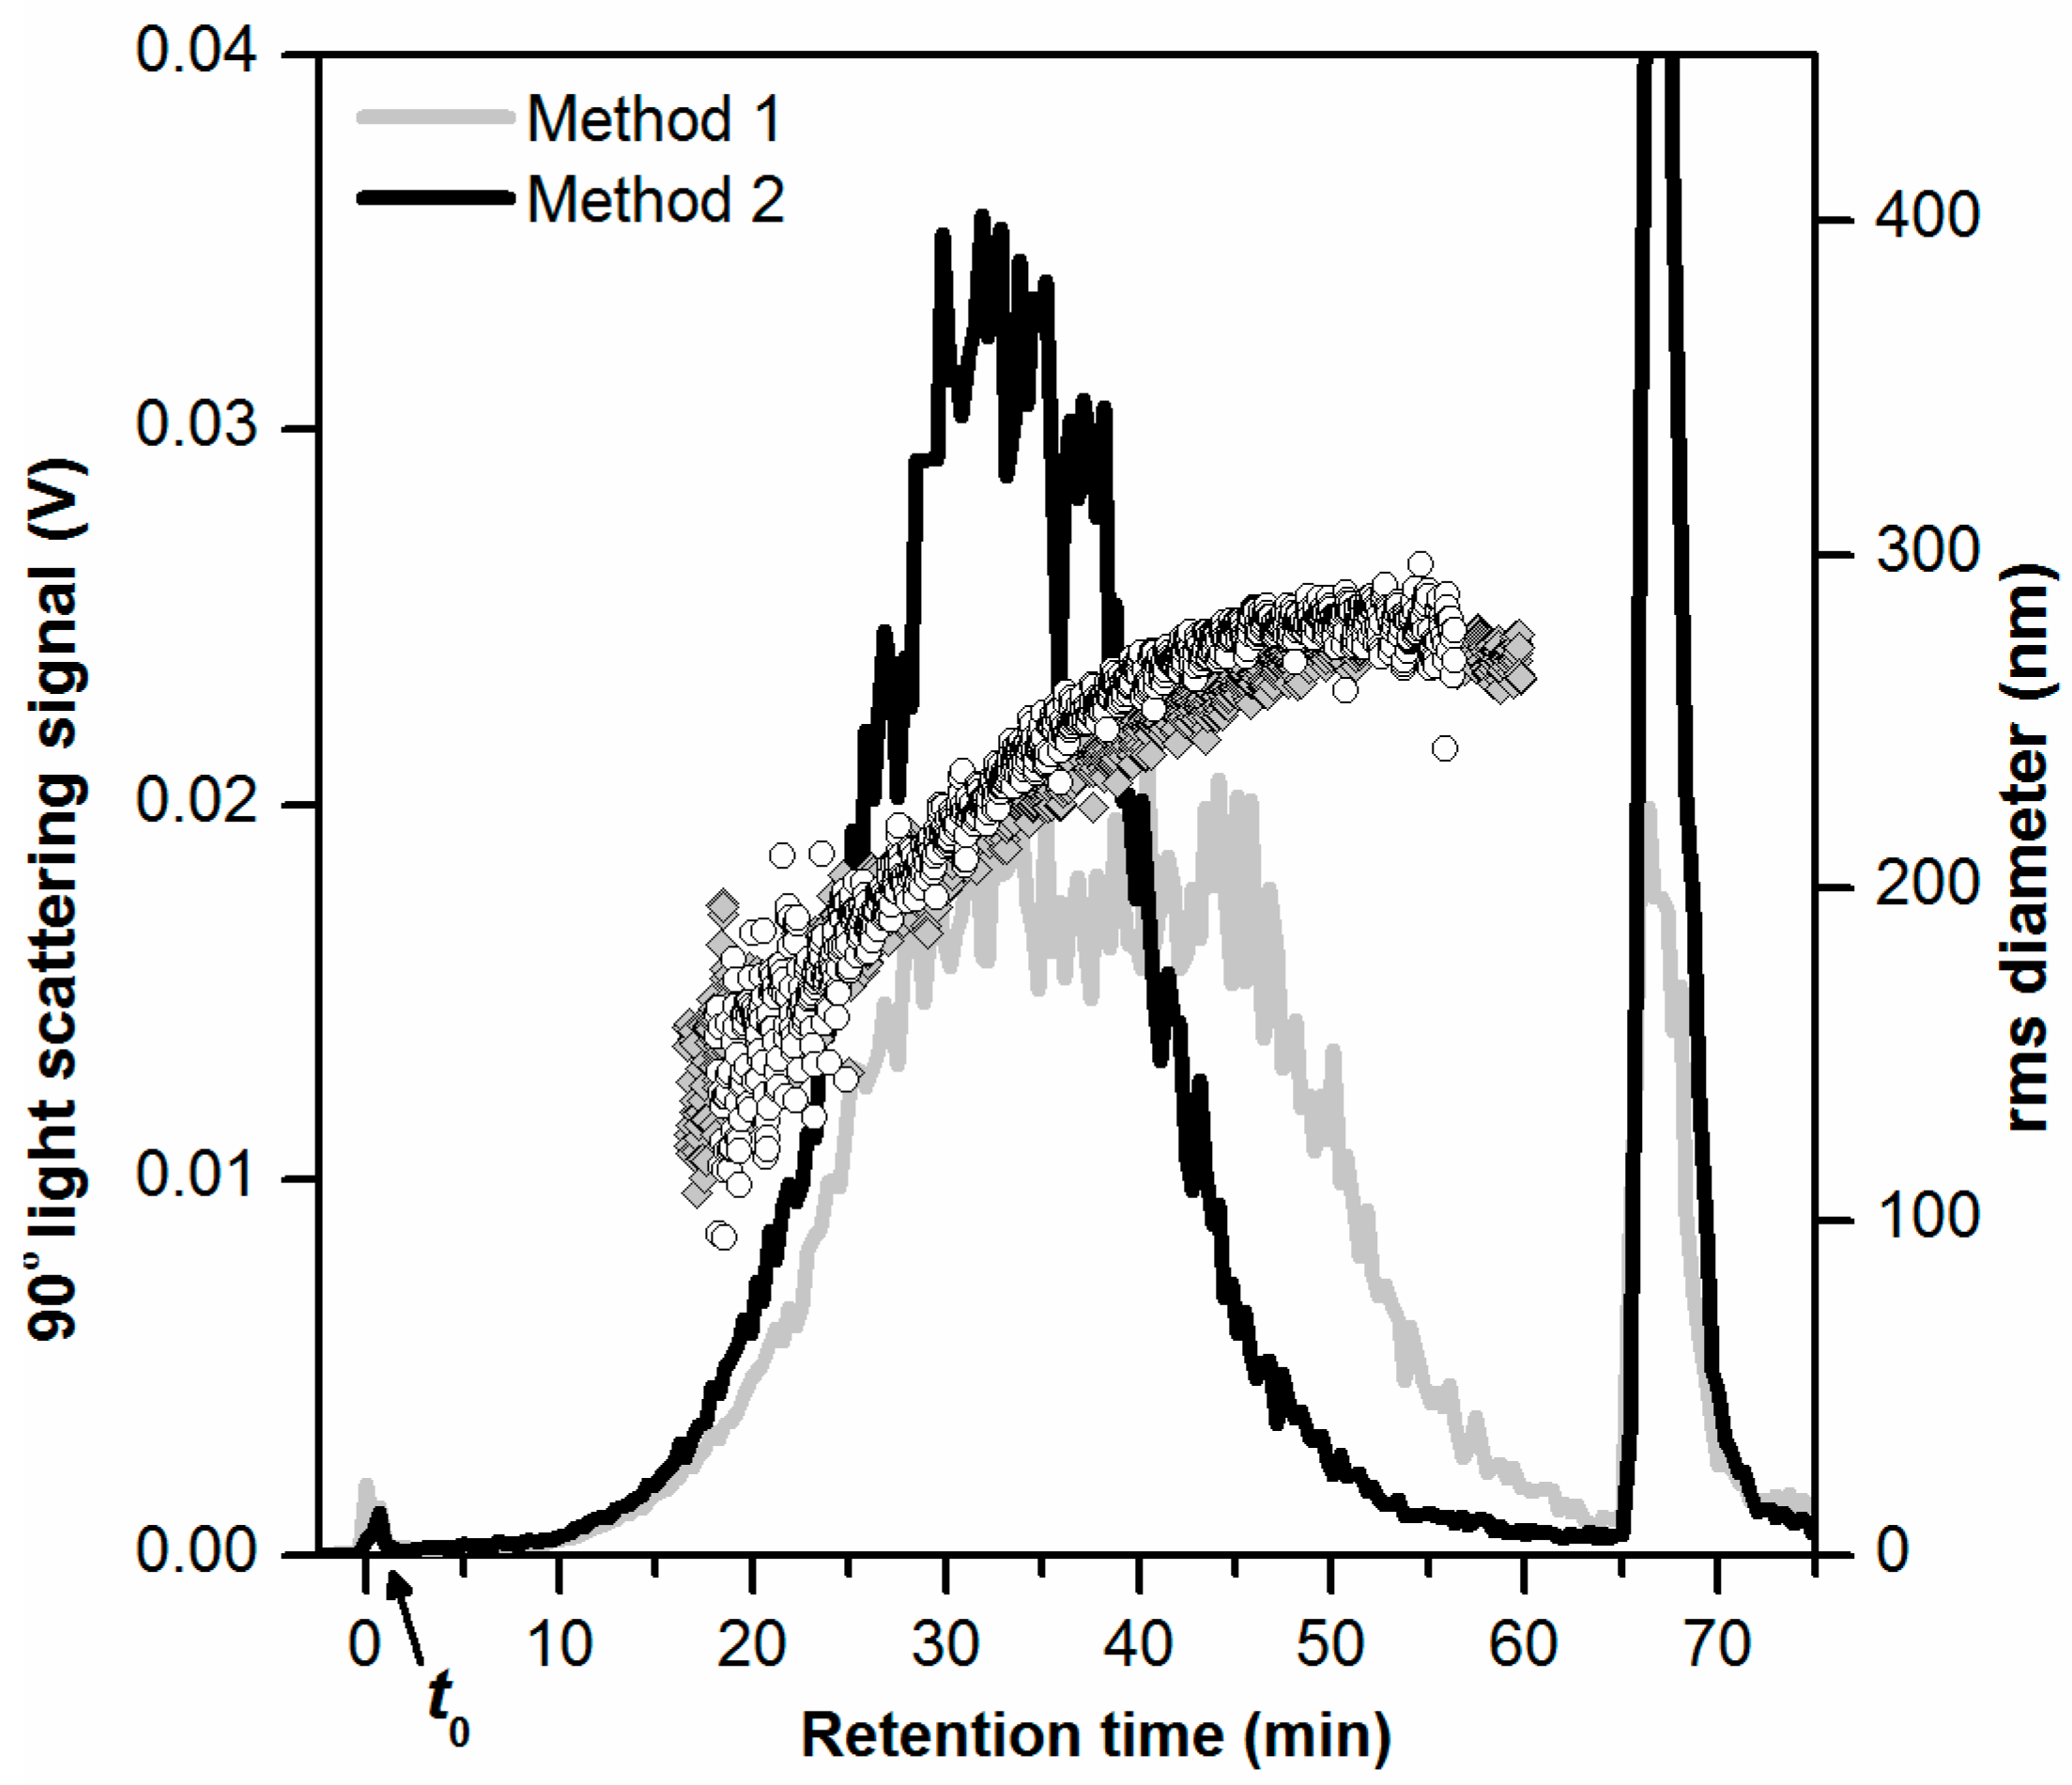
3.4. Carrier Liquid Composition

In order to obtain ideal or at least near-ideal separation conditions where particle fractionation and elution occurs according to AF4 theory, the interactions between particles and membrane need to be reduced. If this is not ensured, the PSD obtained after conversion of retention times to hydrodynamic diameters may be under- or overestimated. These interactions can depend on several parameters, including the surface charge of the particles, the surface charge of the membrane, the carrier liquid composition, ionic strength, and pH. The pH of the prepared SDS solutions (the non-adjusted pH was 5–6) was expected to be in a suitable range for dispersion and stabilization of the toothpaste particles, achieved upon electrostatic stabilization by coating with SDS (Al2O3 and TiO2 particles) or by negative surface charge (SiO2 particles). The initial results obtained with 0.05% w/w SDS as carrier liquid were quite satisfactory. As mentioned before, the initial SDS concentration (0.05% w/w) was selected as being the highest possible concentration (still safely below the critical micelle concentration) in order to disperse the particles as efficiently as possible. To evaluate the influence of the concentration of SDS on the separation, a lower concentration of 0.025% w/w SDS was also tested (Figure S5). The results showed that the decrease of SDS concentration led to a decrease in AF4 recovery for both the 27Al and 47Ti signals from 16% to 7% and from 89% to 54%, respectively.
The alkaline detergent mix FL-70 was selected for testing because it has been successfully used for AF4 analysis of different types of inorganic particles [39], including Al2O3 [40], SiO2 [9,10,41], and TiO2 [8,13,42]. There were some differences in the AF4-ICP-MS fractograms obtained for toothpaste dispersions in 0.05% w/w SDS (pH 5–6) and 0.025% v/v FL-70 (pH 10.3), mostly for the 27Al signal (Figure S6). The AF4-ICP-MS fractogram obtained for the 47Ti signal in 0.025% v/v FL-70 (Figure S6b, gray line) showed a normal main peak centered at tr = 27–29 min. The 47Ti peak was sharper than the one obtained in 0.05% v/v SDS (black line) and shifted to a lower retention time (from tr = 36–38 to tr = 27–29 min). On the other hand, the 27Al fractogram acquired using 0.025% v/v FL-70 as a carrier liquid (Figure S6a, gray line) was characterized by a significantly lower peak in comparison to 0.05% v/v SDS. Additionally, the background level for 27Al was much higher in 0.025% FL70, most likely due to the impurity of FL70. It was decided to use SDS for the remaining experiments and for method development.

3.5. Membrane Composition

PES and RC were tested and compared as these are the most commonly used membrane materials for AF4 analysis of nanoparticles [39,43]. For both membrane types, a molecular weight cut-off of 10 kDa was selected to make sure that also small Al2O3 and TiO2 par were retained during AF4 separation. To evaluate the performance of the two different membrane materials, three independent AF4-ICP-MS measurements (separate days, new membrane used for each measurement) were performed for each membrane type (Figure S7 and Table S2). The 27Al and 47Ti fractograms obtained using PES membranes were reproducible in terms of shape, recovery and retention times. On the other hand, the 27Al and 47Ti fractograms obtained using the RC membranes were not reproducible. The 47Ti AF4 recoveries of the RC membrane measurements were in the same range as the ones obtained with the PES membranes. Compared to the PES membranes, it was possible to obtain higher 27Al AF4 recoveries and much lower void peaks using the RC membranes. This could be related to a stronger electrostatic repulsion of the Al2O3 particles from the membrane. As the PES membranes led to more reproducible measurements than the RC membranes, they were more suitable for obtaining reproducible PSDs. Therefore, the PES membranes were selected for the final method despite the higher 27Al recoveries obtained with the RC membranes.

3.6. Injected Mass

To make sure that the injected particle concentration is low enough to avoid particle interactions caused by AF4 channel overloading, it is recommended to compare retention times and recoveries for sample masses that differ by at least a factor of five [39]. Considering this, the influence of sample load on the AF4 separation was evaluated for injected toothpaste masses of 5, 10, and 25 µg (corresponding to 0.253, 0.507, 1.266 ng Al2O3 and 0.043, 0.086, 0.217 µg TiO2). The 27Al and 47Ti AF4-ICP-MS fractograms were similar in terms of elution profile and retention time (Figure S8). The 27Al and 47Ti AF4-ICP-MS main peak areas depended linearly on the injected mass in the tested range (Figure S9), showing that the separation method could be applied for an injected toothpaste mass of at least up to 25 µg.

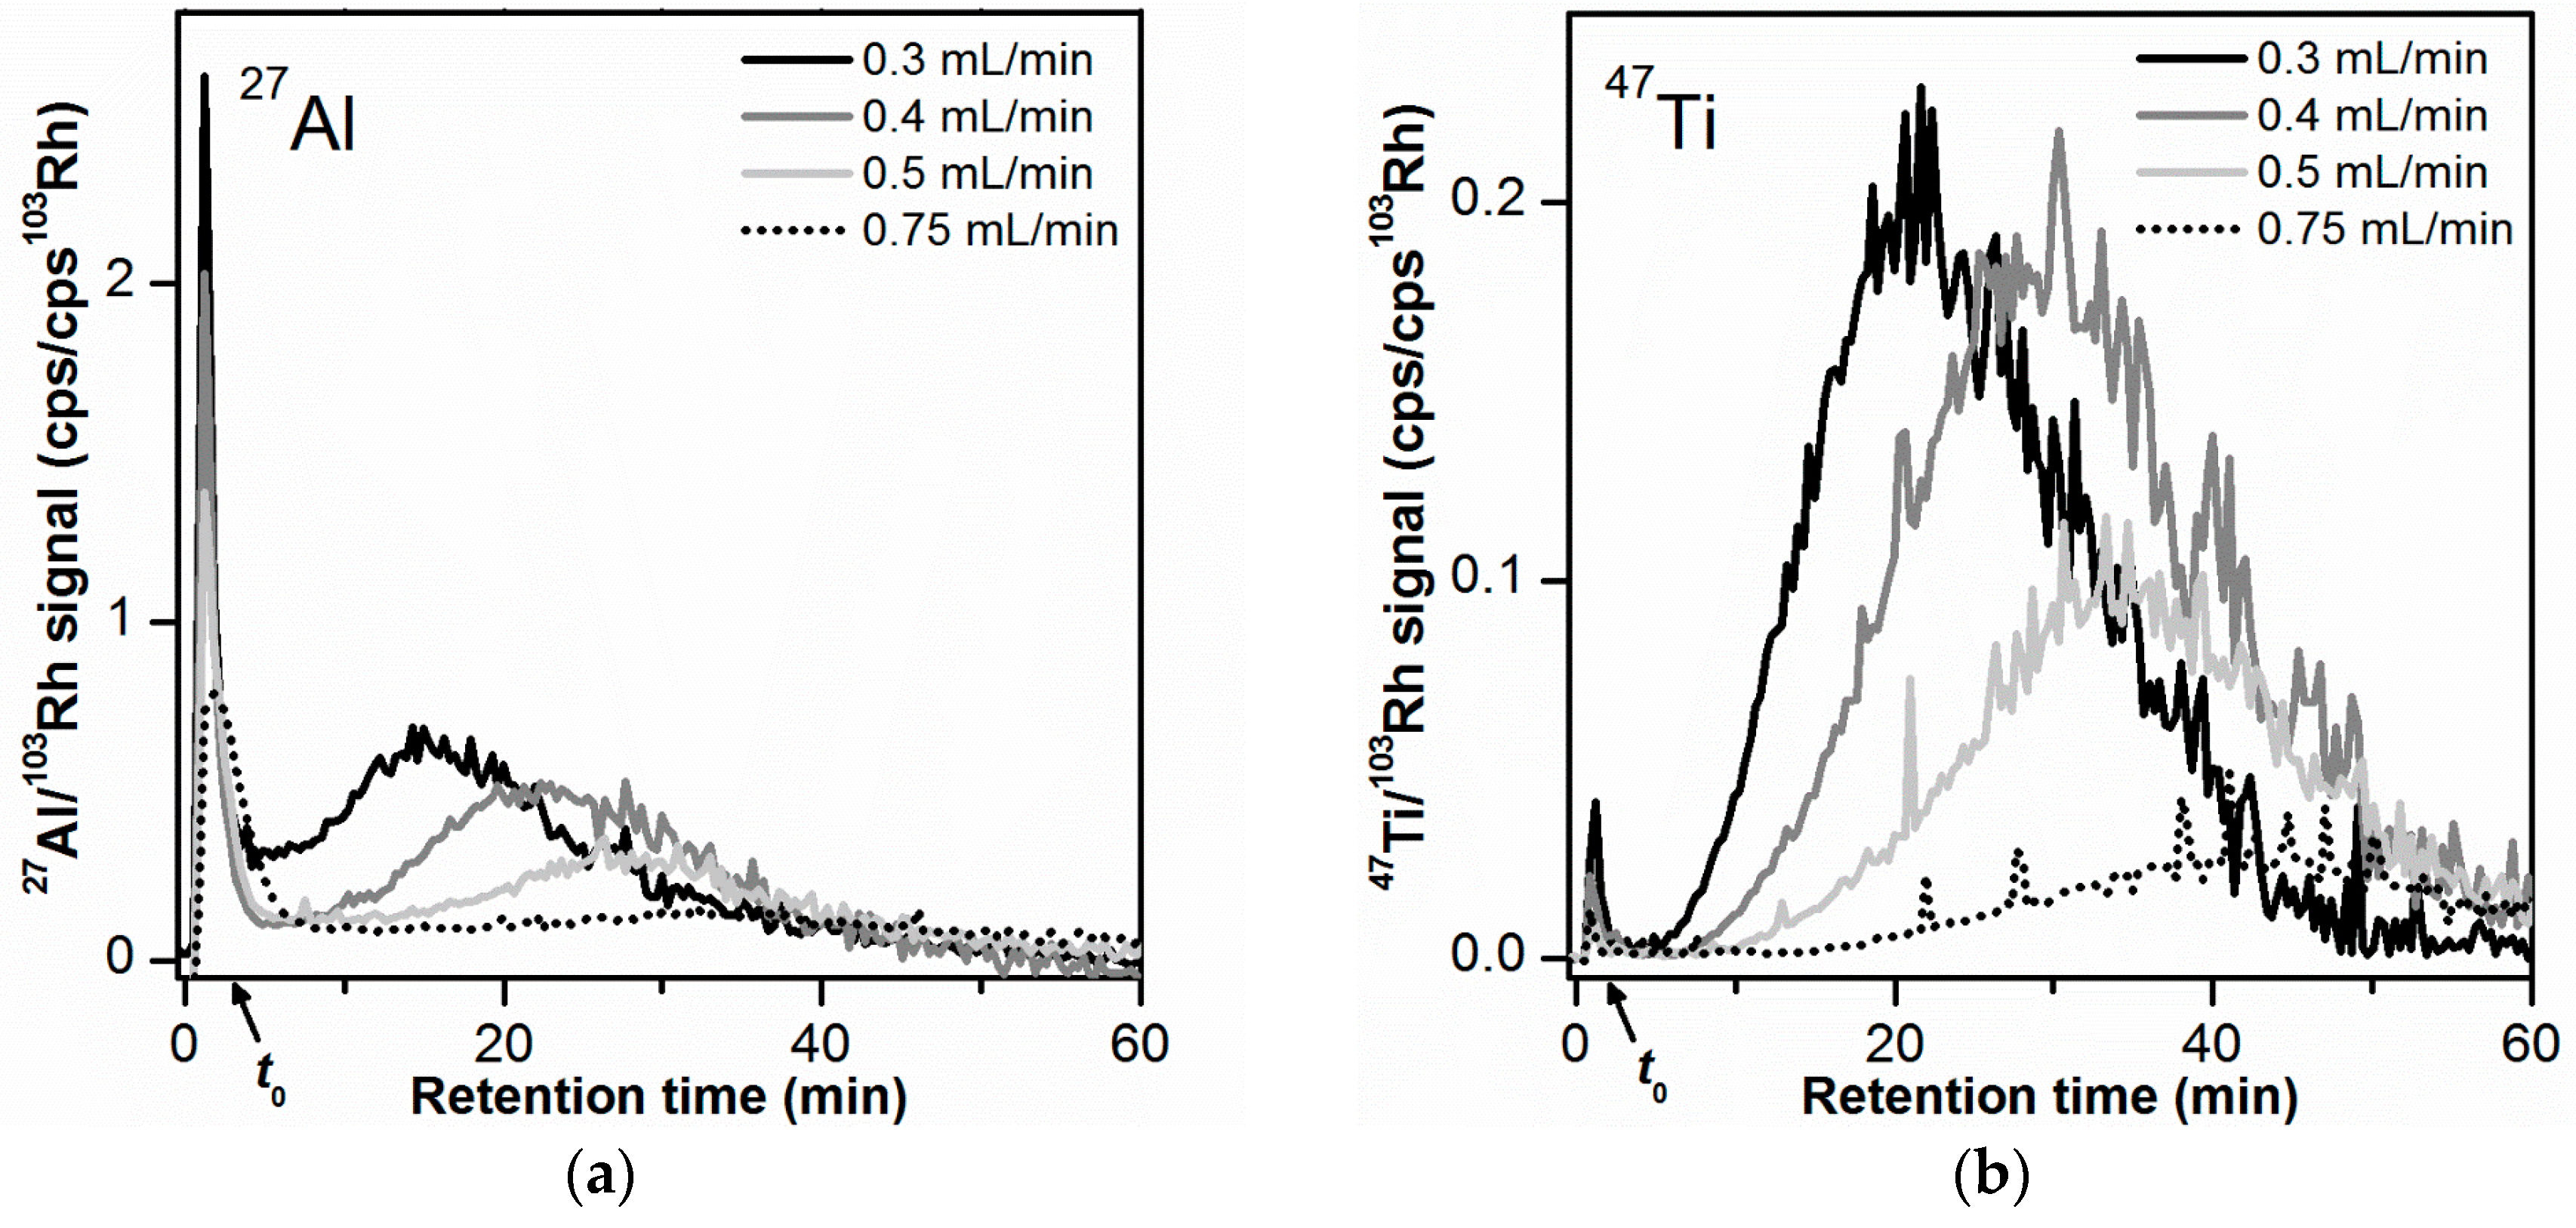
3.7. Cross Flow Rate Optimization

According to AF4 theory, the retention time of a given elution peak increases with increasing cross flow rate [39]. The adjustment of the cross flow allows optimizing the separation of the particles present in the sample. The cross flow rate was varied between 0.3 and 0.75 mL/min for a constant channel flow rate of 1.0 mL/min and a carrier liquid composition with 0.05% w/w SDS (Figure 3). Retention times, peak width of the main peak, and AF4 recoveries are presented in Table 2. The separation of the void and the main peak was particularly relevant for a successful conversion of the AF4-ICP-MS time trace into a number-based PSD (see Section 3.8). To evaluate the separation from the void peak, the resolution RS was calculated (Table 2).
For both 27Al and 47Ti signals (Figure 3a,b, and Table 2) the retention time of the main peak tr and peak width w were found to increase with increasing cross flow rate, as expected from AF4 theory. The ratio between the tr values (main peak) obtained for the 27Al signal and the 47Ti signal was constant in the interval 1.28–1.45, independent of the cross flow. This demonstrated that the effect of the separation force on the main Al and Ti peak was similar. The separation between void and main peak became more pronounced with increasing cross flow rate (Figure 3). For the 27Al and 47Ti signal, the resolution RS increased to maximum values of 2.5 and 3.1, respectively, at a cross flow rate of 0.5 mL/min (see Table 2). RS did not further improve for the highest cross flow of 0.75 mL/min.
With the increase of the cross flow rate, there was also a decrease in AF4 recovery for the main peak (for both 27Al and 47Ti signals, see Table 2), which could indicate a possible loss of particles to the membrane when submitted to a higher cross flow field force. The AF4 total recoveries (which consider the contribution of the void and release peak in addition to the main peak) did not change considerably between 0.3 and 0.5 mL/min (15–20% for 27Al and 72–93% for 47Ti). This could be explained by the simultaneous increase in release peak recovery with cross flow rate, which compensated the lower recovery values determined at the main peak. For a cross flow of 0.75 mL/min, some of the larger particles did not elute within the defined elution time where the cross flow was present (main peak) and only eluted when the cross flow was set to 0 mL/min (release peak).
A cross flow rate of 0.5 mL/min was selected as the optimum cross flow rate as it enabled the best separation between void and main peak, while allowing acceptable AF4 recoveries (18% total recovery and 10% main peak recovery for 27Al, 72% total recovery and 50% main peak recovery for 47Ti). The observed differences between the main peak and total recoveries can be attributed to larger particles that eluted in the release peak. The contribution of these large particles is minimal when converting the mass-based PSD (based on AF4-ICP-MS) into a number-based PSD. Therefore, these recovery differences were accepted. The elution time (with a cross flow present) was kept at 60 min to maintain analysis time at a minimum.
To evaluate the final AF4 method, separations of different toothpaste samples on different days and different membranes (N = 7) were performed (Figure S10). The main peak retention times (tr = 25.3 ± 1.8 min for 27Al and tr = 35.6 ± 1.5 min) and recovery rates (15 ± 2% total recovery and 11 ± 2% main peak recovery for 27Al, 85 ± 9% total recovery and 63 ± 7% main peak recovery for 47Ti) were similar with relative standard deviations below 10%. This demonstrated that the developed AF4-ICP-MS method had the potential for reproducible determination of PSD.

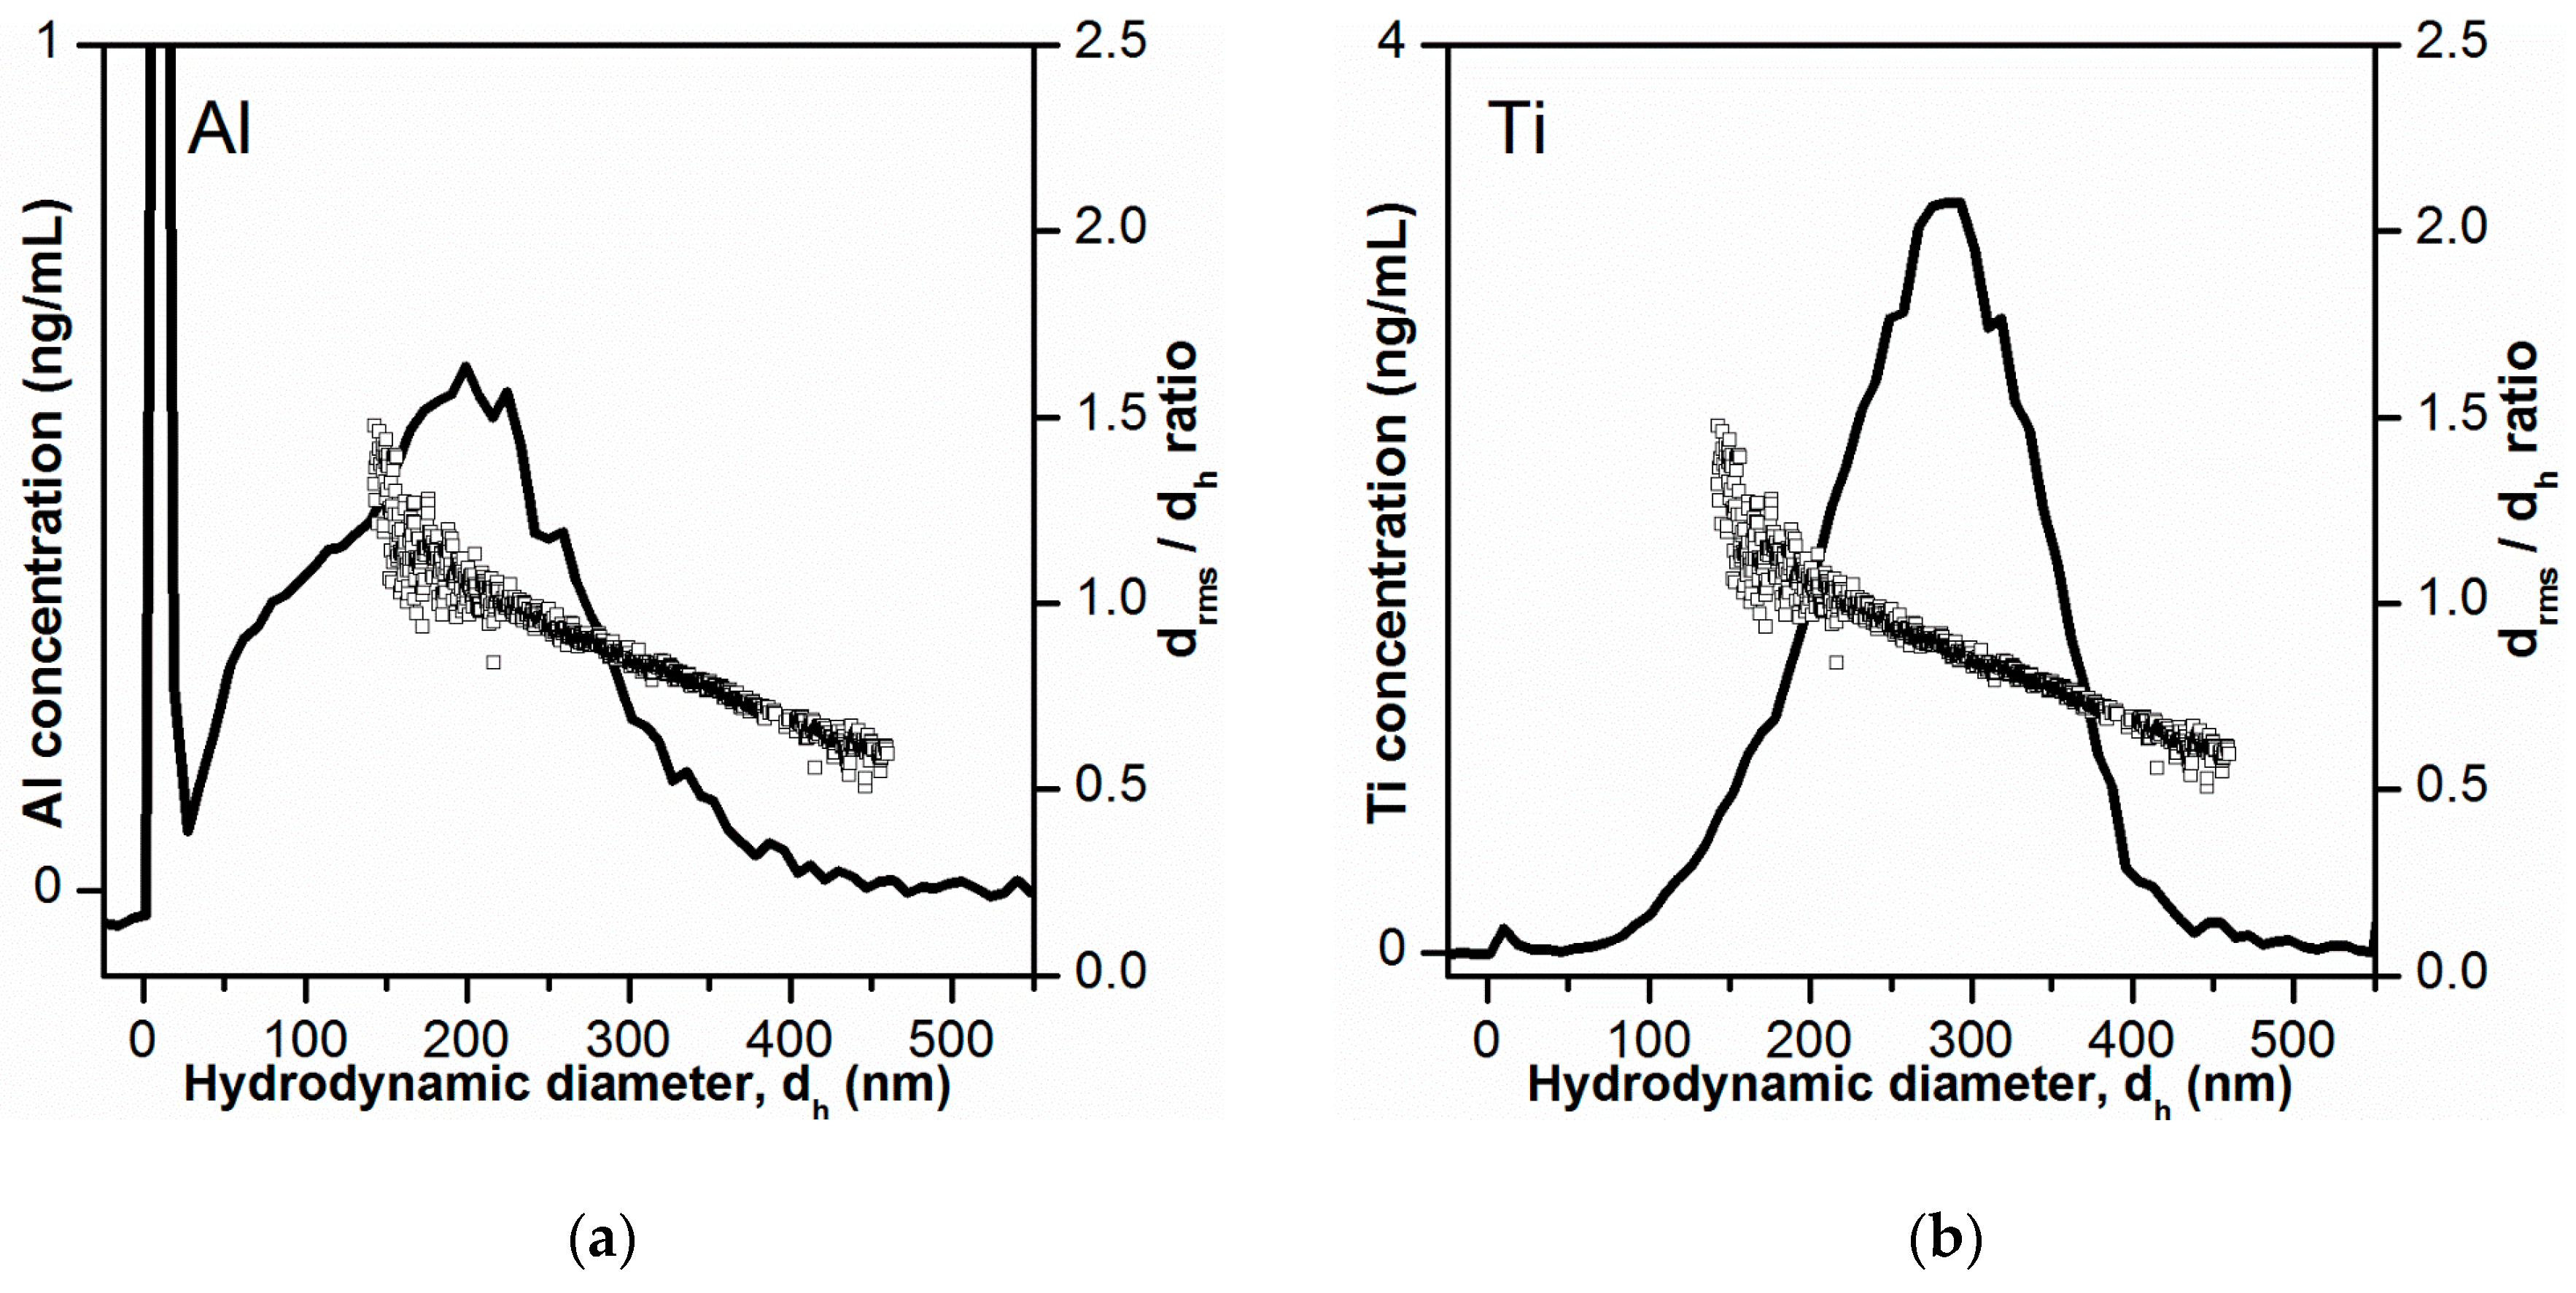
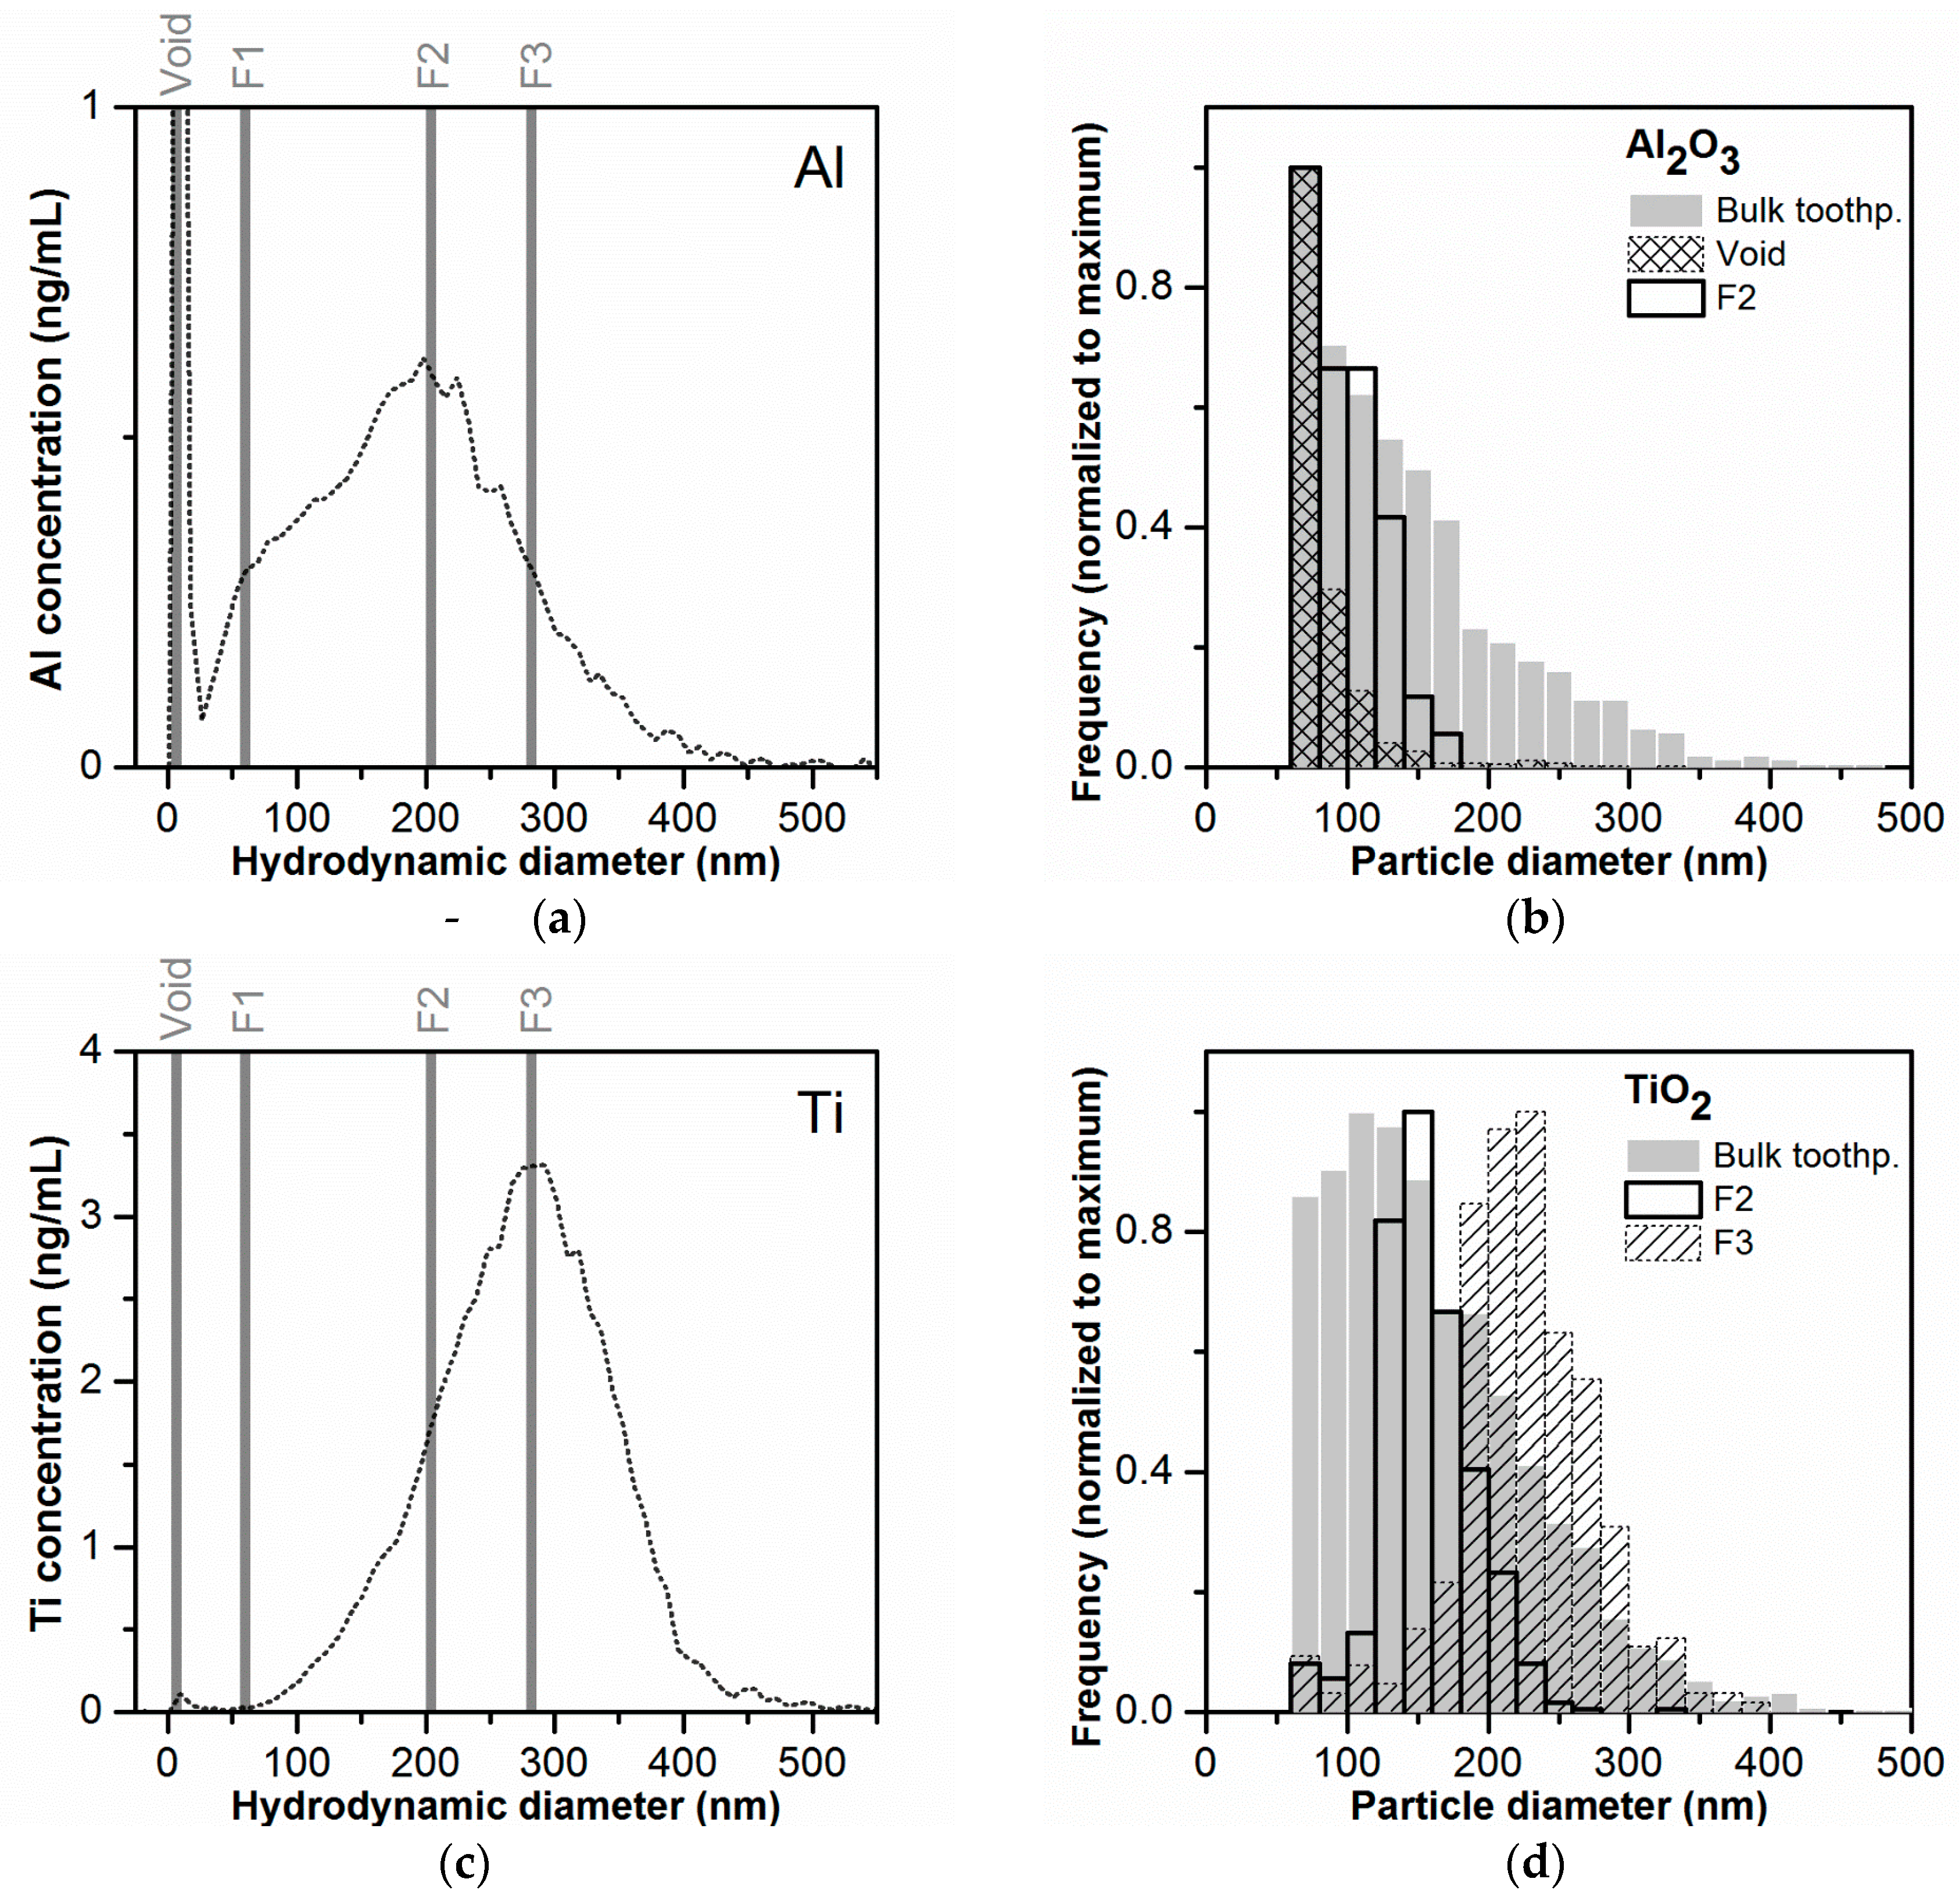
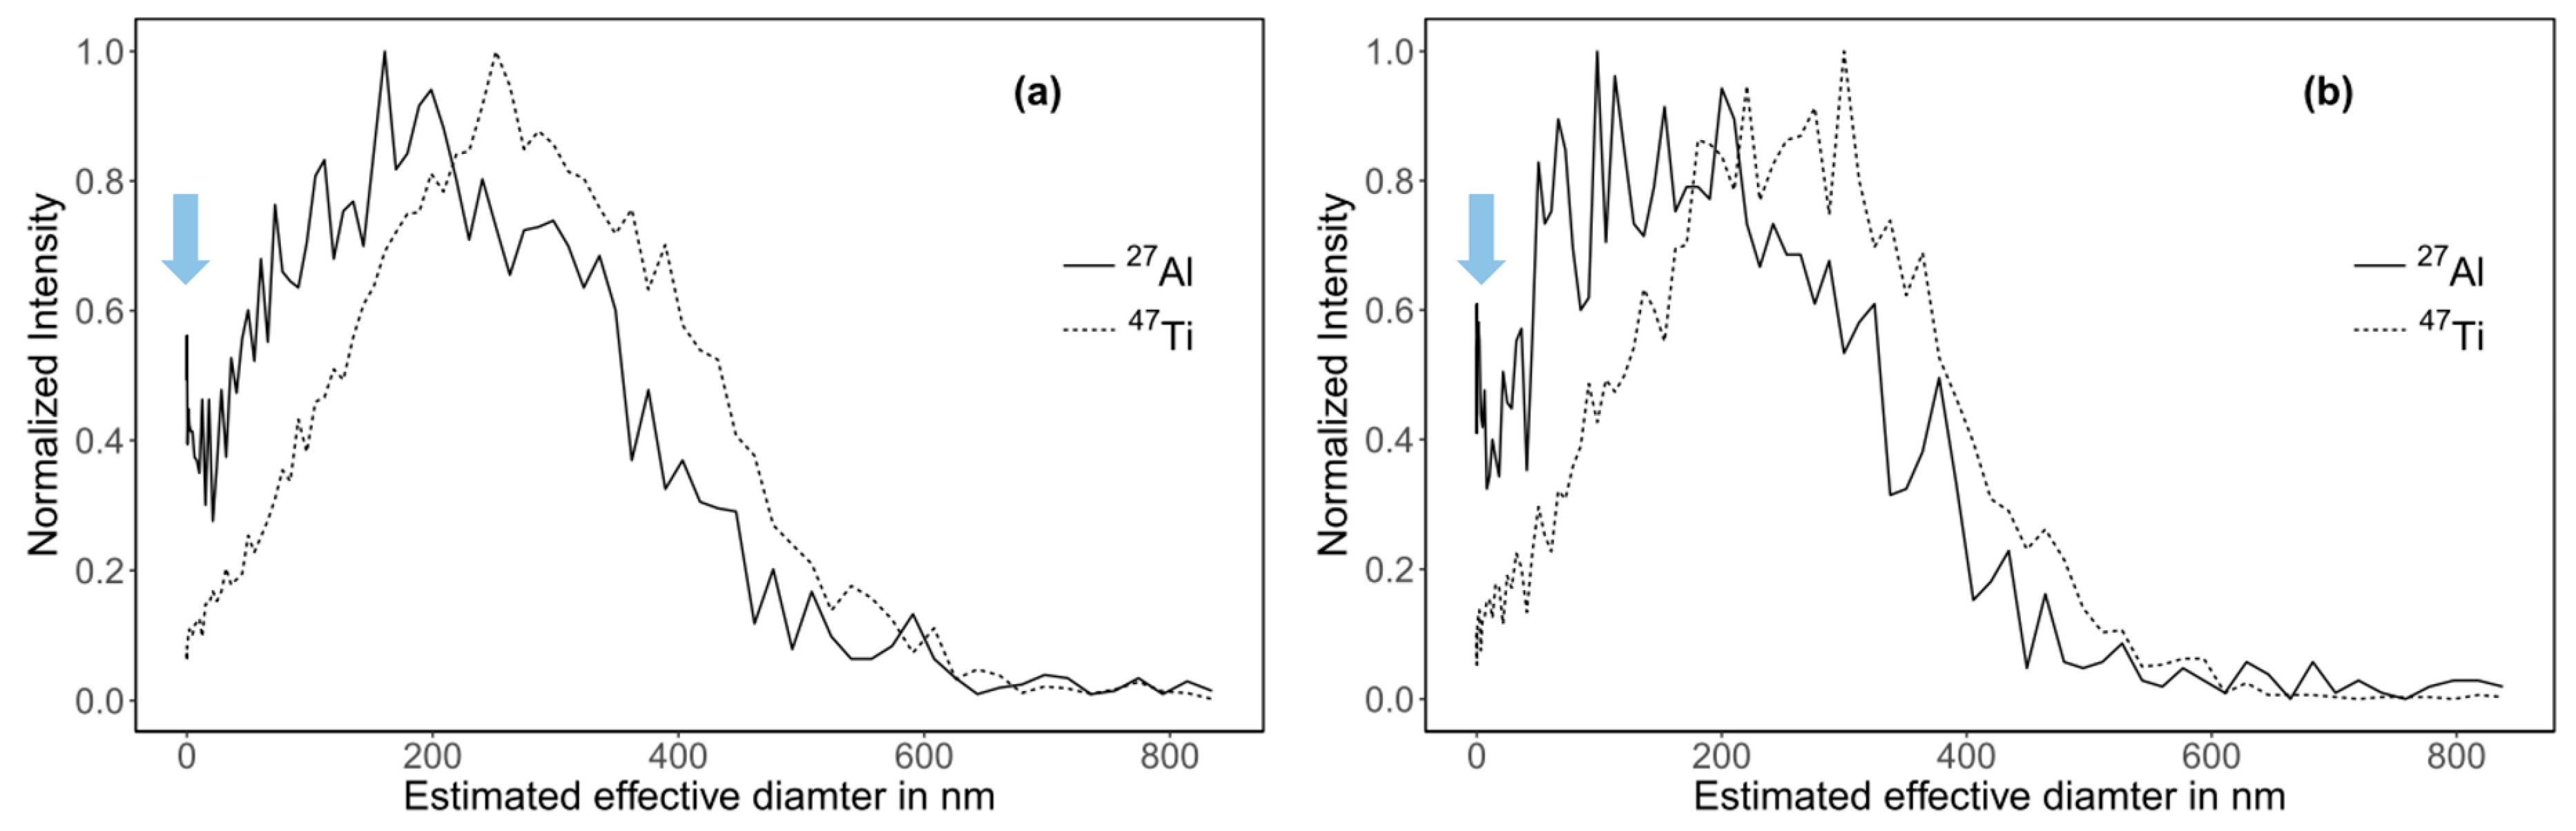
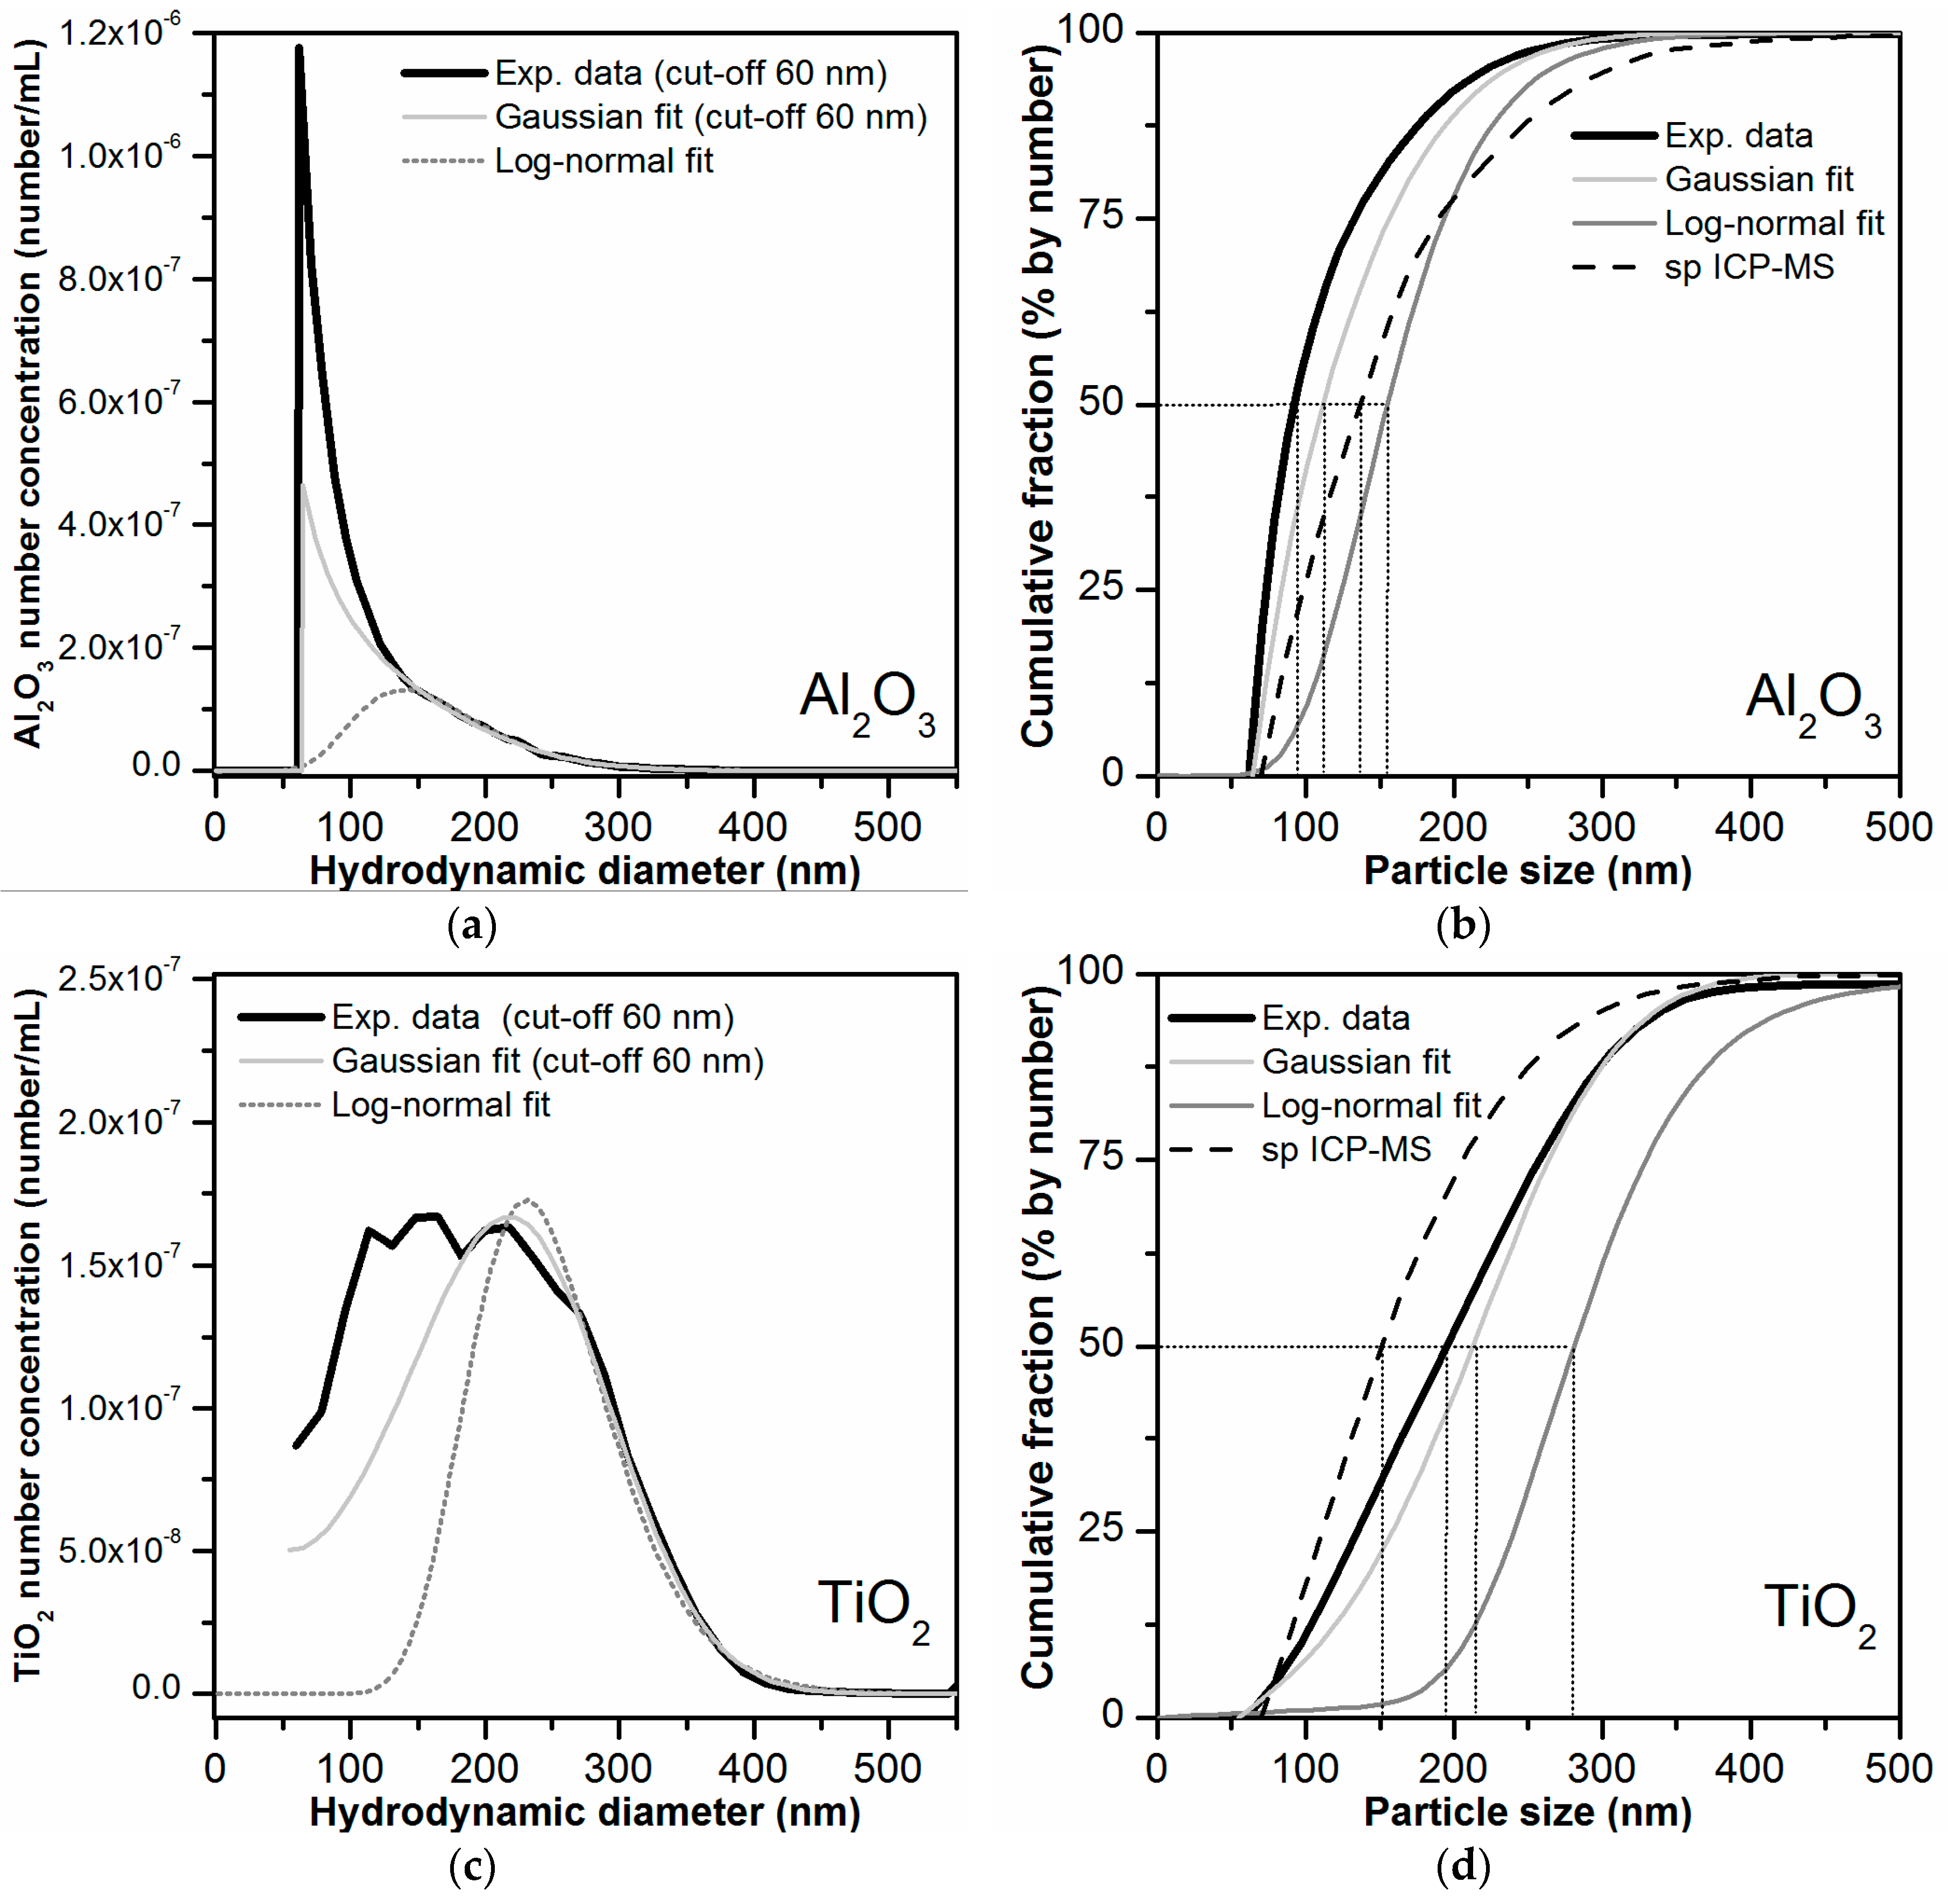
3.8. Determination of Particle Size Distribution

Following previous studies [10,18,44], we used size calibration with polystyrene size standards for converting the AF4-ICP-MS signals to a mass-based PSD (Figure S11). The calibration procedure was performed using the same AF4 method, including carrier liquid composition, since 0.05% SDS is known to be suitable for AF4 separation of polystyrene size standards [18]. Standards of 51 nm, 100 nm and 203 nm in diameter were selected to cover the relatively broad PSD of the particles in the toothpaste sample and taking into consideration the size information provided by the MALS detector (rms diameters were in the range of 150–300 nm, see Section 3.3).
The determined Al and Ti mass-based PSDs obtained after conversion of retention times into hydrodynamic diameters are presented in Figure 4. The PSD obtained for Al- containing particles (Figure 4a) was quite broad (10–450 nm), with a mode of 200 nm. Additionally, a shoulder was visible at 50–100 nm. This could indicate the presence of a smaller size fraction of Al-containing particles and thereby the existence of a bimodal PSD. The size range covered by the PSD correlated well with the observations from STEM-HAADF/EDX analysis of the bulk toothpaste (see Section 3.1), which showed that most Al-containing particles were present as 200–400 nm structures consisting of platelets or aggregates/agglomerates of ~15 nm primary particles. The mass-based PSD obtained for Ti-containing particles (Figure 4b) was less broad (100–400 nm), with a mode of 290 nm. This was also in agreement with STEM-HAADF/EDX analysis, where TiO2 particles were found as 200–400 nm aggregates/agglomerates consisting of few spherical primary particles of 20–80 nm.
For confirmation of the determined PSDs, three approaches were used. The first approach consisted of the direct comparison of the obtained mass-based PSD with the rms diameters from MALS. The ratios between rms and hydrodynamic diameters (drms/dh) are shown in Figure 4 together with the mass-based PSDs. The drms/dh ratio is equal to the shape factor which is the ratio of radius of gyration and hydrodynamic radius [45]. The shape factor provides an indication on the shape of the particles and for homogenous spheres the expected shape factor is 0.775. In the lower size range (dh values of 130–250 nm) the shape factor (drms/dh ratio) was 0.95–1.5, which is higher than the expected shape factor for homogeneous spheres. This positive deviation in shape factor can be explained by the elution of non-spherical particles or platelets [45]. In fact, it was in this elution region (dh values of 130–250 nm), where most of the Al2O3 particles should elude (peak maximum for Al mass-based PSD). With increase in hydrodynamic diameter dh (and retention time), there was a linear decrease of the shape factor (drms/dh ratio) from 1.5-1-1 (at dh = 130 nm) to ~0.6 (at dh = 470 nm). This progressive drop in shape factor values correlated with the increased elution of TiO2 particles which are known to be spherical in shape, though forming some agglomerates. With the increased contribution of eluding TiO2 spherical particles to the light scattering signal (and reduced contribution of the irregularly shaped Al2O3 particles), the shape factor approached the value for homogeneous spheres of 0.775. The decrease below this value to 0.6 could be explained by a slight overestimation of the hydrodynamic diameter.
The comparison with rms diameters did not allow an independent evaluation of the Al and Ti mass-based PSDs, as all particles contributed to the LS signal. Therefore, a second approach was used for size confirmation based on fraction collection after AF4 separation (see Figure 5a,c) and subsequent analysis of these fractions by spICP-MS. The Al2O3 and TiO2 number-based PSDs obtained for the fractions collected at different time points and for a sample of “bulk” toothpaste (no separation by AF4, same sample preparation as for AF4) are shown in Figure 5b,d, respectively. The minimum detectable particle sizes by spICP-MS were 55–65 nm for both particle types. The detailed spICP-MS results are summarized in Table S3. For the Al2O3 particles, the collected fraction corresponding to the void peak contained the highest number of particles of all fractions (1181) with a broad size range (53 to 340 nm), indicating non-ideal elution of a part of the particles in the sample. Almost no Al-containing particles were detected in fraction F1, corresponding to the peak shoulder in the Al mass-based PSD (AF4), eventually due to the small size of the particles eluting in this fraction (<size LOD). However, no increase in the Al-background signal was observed either. It cannot be excluded that losses of the small particles and ions occurred, e.g., due to the adhesion to tubings. In fractions F2 and F3, corresponding to the mode and the right side of the Al mass-based PSD (AF4), the number of detected particles was 417 and 96 and the median particle diameter 99 and 116 nm. Due to the limited number of detected particles, it was only possible to determine a PSD for fraction F2 (Figure 5b). The number-based PSD for fraction F2 was narrower than the one determined for the bulk toothpaste, confirming that the separation was efficient. The median particle diameter in fraction F2 (99 nm) was about half of the hydrodynamic diameter (200–208 nm). This could be explained by the structure of the Al2O3 particles, which were present as fractal structures of agglomerates/aggregates. Considering that the hydrodynamic diameters encompass the free space in the fractal structures, it is not surprising that the mass-derived diameter from spICP-MS was significantly smaller.
The better separation behavior of the TiO2 particles could be confirmed by the spICP-MS measurements of the collected fractions. No particles were detected in the void peak and in fraction F1. The PSDs obtained for fractions F2 and F3 were well defined and presented sharper peaks compared to the bulk toothpaste. Furthermore, there was an increase in the median particle diameter from 152 nm in F2 to and 224 nm in F3. The median particle diameters were 20–25% smaller compared to the hydrodynamic diameters (200–208 nm and 276–284 nm for F2 and F3 respectively). The smaller difference between the median particle diameter values obtained by spICP-MS and hydrodynamic diameters in comparison to the Al2O3 particles could be explained with the smaller agglomerate/aggregate size (with a geometry closer to a sphere) of the TiO2 particles.
In order to confirm the nature of the left part of the main peak for Al, we estimated the size distribution (effective diameter) of the toothpaste particles using a third independent method: HDC-ICP-MS. In HDC, the separation mechanism corresponds to the steric mode in AF4 enabling the determination of the effective diameter of the particles, which may differ from the hydrodynamic diameter dh estimated from the diffusion coefficient obtained using AF4, especially if particles are not spherical [46]. The broadness of the size distribution is slightly overestimated due to peak broadening in the HDC column. This cannot be corrected in our case since the measured particles have an irregular shape [46,47]. Therefore, we did not attempt to compare PSDs obtained using HDC with PSDs obtained using AF4. Nonetheless, considering the distribution modes, HDC provides a reliable sizing of particles in the size range 20–1200 nm differing in composition and coating and fairly free of matrix effects, albeit the particle shape affects the size estimation, as for any size separation method [48,49,50,51].
PSDs and recoveries obtained using HDC were similar to the ones obtained with AF4 (Figure 6 and Table S4). The Al-peaks modes were 179 and 148 nm for the sample digested following method 1 and 2, respectively. The corresponding Ti-peaks modes were 248 and 238 nm. The modes were slightly lower than the ones obtained by AF4 measurements (200 and 290 nm for Al and Ti, respectively). Furthermore, the HDC-ICP-MS chromatograms for Al confirmed the presence of a peak shoulder (Figure S12). This shoulder was less visible in the mass-based PSDs because it was outside of the calibrated size range (Figure 6, blue arrows).
Finally, the mass-based PSDs obtained by AF4-ICP-MS were converted to number-based PSDs. Prior to mathematical conversion, the mass-based PSDs were fitted with Gaussian or log-normal functions. These two functions were selected because they are typically used as models for describing the PSDs of particle populations [52]. The Al mass-based PSD was only fitted in the size range 140–550 nm in order to exclude the peak shoulder present at 50–100 nm (as it could not be confirmed that this were in deed particles). Both Gaussian and log-normal functions were found to be appropriate to fit the Al mass-based PSD (Figure S13), although the Gaussian fit was more similar to the experimental mass-based PSD. The Ti mass-based PSD could also be fitted correctly using the Gaussian function. The log-normal fitted curve deviated more from the experimental mass-based PSD.
As mentioned earlier the mathematical conversion from mass-based to number-based PSD is prone to introduce uncertainties in the lower side of the PSD (especially from 20 nm and down). Ideally, baseline separation between void and main peak is achieved. For the log-normal fitted data, baseline separation was obtained. In the other cases (experimental data and Gaussian fits), it was necessary to establish a cut-off value of around 60 nm. No data below the size cut-off was considered for conversion. The obtained number-based PSDs for Al2O3 and for TiO2 particles are shown in Figure 7 together with the PSD determined by spICP-MS analysis of the bulk toothpaste. The D50 value is defined by the particle size value at a cumulative fraction value of 50%. For the TiO2 particles, the D50 value was clearly above 100 nm in all the data sets, indicating that the TiO2 in the toothpaste is not a nanomaterial according to the EU definition. This was in agreement with the D50 values obtained by spICP-MS for the bulk toothpaste (136/143 nm). For Al2O3 the D50 values were closer to the 100 nm threshold. For the original experimental data, which considered the presence of the peak shoulder (50–100 nm) in the mass-based PSD, the D50 value was 92 nm. This would result in the classification of Al2O3 as a nanomaterial according to the EU definition. For the PSDs resulting from the Gaussian and log-normal fit, where the peak shoulder was partly or completely dismissed, the D50 values were 112 nm and 156 nm, respectively. These values were closer to the D50 value of 113 and 121 nm retrieved from the spICP-MS analysis of the bulk toothpaste, which however was not able to detect particles below 55–60 nm. Our data clearly demonstrates that the presence of small particles in the 0–50 nm region can influence tremendously the D50 value and thus the classification of a material as nanomaterial according to the definition.

4. Summary and Conclusions

AF4 coupled to MALS and ICP-MS was found to be a useful technique for the characterization of particles of different composition in a complex sample such as toothpaste. Al2O3 and TiO2 particles could be reproducibly separated and their mass concentration and size determined. The analysis of the Al2O3 particles was challenged by the presence of a peak shoulder in the Al fractograms. It was not possible to directly confirm the presence of particles in this peak by spICP-MS or HDC-ICP-MS. This could lead to incorrect Al2O3 number-based PSDs upon direct mathematical conversion. The obtained recoveries for Al2O3 were relatively low for both AF4- and HDC-ICP-MS and were probably related to the large size of the Al2O3 particle aggregates. A decrease in recovery with increase in particle size in AF4 has been described previously and was explained with the tendency of larger particles to accumulate closest to the membrane, thus being more prone to interactions [43].
One major challenge for developing the AF4-ICP-MS method was that the pristine particles were not available. This made it difficult to select suitable parameters for the separation, as it was not possible to develop an initial AF4 method for the pristine particles knowing their physico-chemical characteristics, as done in other studies [10,15]. The approach described in this study is, however, closer to the real world scenario where control laboratories would have to check for correct labelling of particles present in a certain consumer product from the market. In such case, the constituent particles would not be available either. To compensate for the lack of (pristine) reference particles, pre-characterization studies were performed to obtain characteristics such as particle concentration, crystal structure, overall particle size and surface charge as well as agglomeration state. Based on this information, initial AF4 parameters could be established and thereafter optimized.
Another challenge was the verification of the determined particle sizes. In this study it was not possible to compare the obtained AF4 fractograms with the ones of the pristine particles and thereby excluding sample preparation-induced changes and verifying the correct size fractionation during method development as described in other studies in the literature [10,15]. Direct particle size determination by MALS was important during method development to show the correct separation of the toothpaste particles. Finally, it was crucial to validate the obtained PSDs for the individual particles by a secondary confirmatory method such as spICP-MS and HDC-ICP-MS.
The final challenge was the mathematical conversion from mass-based to number-based PSD. Given the resolution of the AF4 technique, it should be possible to obtain number-based PSDs with sizes down to 10–20 nm. However, in this study it was only possible to obtain number-based PSDs down to a 60 nm due to the required cut-off values for conversion. This minimum size was similar to the minimum particle sizes detected by spICP-MS. Most likely, it would be possible to achieve a lower cut-off value for the TiO2 particles by using a higher cross flow rate but this would imply a considerable decrease in AF4 recovery. In polydisperse samples (containing particles from a few to several hundred of nanometers), it is difficult to evaluate the whole PSD in a single AF4-ICP-MS measurement. An alternative would be to have two different separation programs as suggested in [53]: one with a higher cross-flow regime to separate the smaller particles and another with a low cross flow regime to provide a complete analysis of larger particles.
Our study showed that AF4-ICP-MS is not an ideal method for determining the number-based PSD, especially in complex and polydisperse samples. Nevertheless, it can be very helpful for understanding complex samples and for obtaining reliable mass-based PSD. Obtaining number-based PSDs in toothpaste containing three types of particles is expected to be difficult for other techniques such as TEM as well due to the complexity of the sample. However, it needs to be highlighted that TEM remains the only technique that can distinguish primary particles and particle aggregates. An interesting question is if a method developed for a certain particle type (e.g., TiO2) would be applicable in similar matrices. This is expected to be challenging considering that the surface properties of the particles vary from product to product (e.g., different surface coatings/surface charges of TiO2 particles). The next step to address this will be to test the developed methodology for analyzing particles in different toothpastes.

Supplementary Materials

The following are available online at https://www.mdpi.com/2297-8739/5/4/56/s1, Table S1. Chemical composition of the tested toothpaste as labelled in the acquired products. The function of each ingredient is described. Figure S1. Intensity-based PSD obtained by DLS measurements of toothpaste dispersions (1 mg toothpaste/mL) in ultrapure water (dashed line), prepared by a two-step dilution in 0.1% w/w SDS (sample preparation method 1, gray line) and chemical oxidation with 30% H2O2 followed by dilution in 0.1% w/w SDS (sample preparation method 1, black line). Figure S2. STEM-HAADF/EDX analysis of the toothpaste sample. The left panel shows an STEM-HAADF image of the particles present in toothpaste. The right panel shows the corresponding STEM-EDX mapping of the same area for Al and Ti. The Al- and Ti-containing particles are displayed in red and blue, respectively, and should correspond to the constituent Al2O3 and TiO2 particles. Figure S3. STEM-HAADF/EDX analysis of the toothpaste sample. The Al-, Ti- and Si-containing particles are displayed in red, blue and green, respectively, and should correspond to the constituent Al2O3, TiO2 and SiO2 particles. At the bottom a magnified HAADF image of the Al2O3 particles is shown, where their morphology can be seen in more detail. Figure S4. AF4-ICP-MS 28Si fractograms obtained for 10 µg and 100 µg injected toothpaste mass values (corresponding to 2.4 and 24 µg of injected SiO2, respectively). The AF4-ICP-MS measurements were performed on the same membrane. Figure S5. Influence of SDS concentration on the AF4 fractionation of the toothpaste particles (10 µg injected mass). The AF4-ICP-MS fractograms were obtained using 0.025% (gray line) or 0.05% w/w SDS (black line) or: (a) 27Al signal and (b) 47Ti signal. The AF4-ICP-MS measurements were performed on two different membranes. Figure S6. Influence of carrier liquid composition on the AF4 separation of particles in toothpaste (10 µg injected mass). AF4-ICP-MS fractograms obtained using 0.05% w/w SDS (black line) or 0.025% v/v FL70 (gray line) as carrier liquid: (a) 27Al signal and (b) 47Ti signal. The AF4-ICP-MS measurements were performed on two different membranes. Figure S7. Influence of membrane composition on the AF4 fractionation of the toothpaste particles (10 µg injected mass). The AF4-ICP-MS fractograms were obtained using either a PES membrane (cyan, blue and navy lines, (a) 27Al signal and (b) 47Ti signal) or RC membrane (orange, red and wine color lines, (c) 27Al signal and (d) 47Ti signal). For each of the AF4-ICP-MS measurements a new PES or RC membrane was used and the measurements were all performed on separate days. Table S2. Retention times (tr) and AF4 recoveries determined for Al and Ti for PES and RC membranes. For each of the AF4-ICP-MS measurements a new PES or RC membrane was used and the measurements were all performed on separate days (N = 3). Figure S8. AF4-ICP-MS fractograms obtained for different injected masses of toothpaste (5, 10 and 25 µg injected mass): (a) 27Al signal and (b) 47Ti signal. The AF4-ICP-MS measurements were performed using the same PES membrane and on the same day. In these experiments, the cross-flow rate was 0.4 mL/min. Figure S9. Linear dependence of AF4-ICP-MS signals (main peak area) on toothpaste injected mass (5, 10 and 25 µg injected mass): (a) 27Al signal and (b) 47Ti signal. The experimental data points are displayed (open circles) and were fitted with a linear model (red trace).The AF4-ICP-MS measurements were performed using the same PES membrane and on the same day. In these experiments, the cross-flow rate was 0.4 mL/min. Figure S10. AF4-ICP-MS fractograms obtained using the final method (N = 7, where N is the number of independent measurements) for separation and detection of Al2O3 and TiO2 particles in toothpaste (10 µg injected mass): (a) 27Al signal and (b) 47Ti signal. For each of the AF4-ICP-MS measurements a new PES membrane was used and the measurements were all performed on separate days. Figure S11. AF4 size calibration by polystyrene size standards (51 nm, 100 nm, and 203 nm). The calibration curve was based on a linear fitting of the retention times of the AF4-LS peak maxima obtained for the different size standards. The size standards were analyzed separately using the same AF4 separation method that was used for the toothpaste. Table S3. Results of spICP-MS analysis of the collected AF4 fractions and of the corresponding bulk digestate of the toothpaste sample. Table S4. Results of HDC-ICP-MS analysis of the toothpaste sample. Standard deviations (N = 3) are given right to the mode values. Figure S12. HDC-ICP-MS chromatograms for a toothpaste sample prepared by method 2 for Ti (upper graph) and Al (lower graph). Figure S13. Fitting of the obtained Al and Ti AF4-ICP-MS mass-based particle size distributions (black lines in (a) and (b), respectively) with Gaussian and log-normal functions (solid gray and dotted lines, respectively). The Al mass-based particle size distribution was only fitted in the range 140–525 nm in order to exclude the shoulder/possible artifact observed at 40–120 nm. For the Gaussian fits, the adjacent R-square values of 99.3% for Al and 99.3% for Ti were obtained. For the log-normal fits, the adjacent R-square values were 99.4% for Al and 94.6% for Ti, respectively. Fitting of the obtained Al and Ti AF4-ICP-MS mass-based particle size distributions (black lines in (a) and (b), respectively) with Gaussian and log-normal functions (solid gray and dotted lines, respectively). The Al mass-based particle size distribution was only fitted in the range 140–525 nm in order to exclude the shoulder/possible artifact observed at 40–120 nm. For the Gaussian fits, the adjacent R-square values of 99.3% for Al and 99.3% for Ti were obtained. For the log-normal fits, the adjacent R-square values were 99.4% for Al and 94.6% for Ti, respectively.

Author Contributions

M.C. and K.L. conceived and designed the experiments; M.C. performed the sample preparation work, DLS experiments, and AF4-MALS-ICP-MS experiments; T.U. performed the STEM-EDX analysis; A.P. performed the HDC-ICP-MS analysis; M.C. and K.L. wrote the paper; T.U. and A.P. revised the paper.

Acknowledgments

The authors wish to thank Marianne Hansen, Annette Landin, and Birgitte Koch Herbst for supporting the experimental work and the NanoDefine Partners for their collaboration and pre-characterization information. M.C., T.U., and K.L received funding from the European Union Seventh Framework Programme (FP7/2007–2013) under grant agreement n° 604347 (NanoDefine - Development of an integrated approach based on validated and standardized methods to support the implementation of the EC recommendation for a definition of nanomaterial). A.P. received funding from the German Research Foundation within research unit INTERNANO (FOR 1536 “Mobility, aging and functioning of engineered inorganic nanoparticles at the aquatic—terrestrial interface”, subprojects SCHA849/16). Furthermore, we thank Agilent for providing the 8800 Triple Quadrupole ICP-MS and acknowledge support of the Scientific Center for Optical and Electron Microscopy ScopeM of the Swiss Federal Institute of Technology ETHZ.

Conflicts of Interest

The authors declare no conflict of interest. The founding sponsors had no role in the design of the study; in the collection, analyses, or interpretation of data; in the writing of the manuscript, and in the decision to publish the results.

References

  1. Rauscher, H.; Rasmussen, K.; Sokull-Klüttgen, B. Regulatory Aspects of Nanomaterials in the EU. Chem. Ing. Tech. 2017, 89, 224–231. [Google Scholar] [CrossRef] [Green Version]
  2. The European Parliament and the Council of the European Union Regulation (EC) No 1223/2009 of the European Parliament and of the Council of 30 November 2009 on cosmetic products. Off. J. Eur. Union 2009, L 342, 1–59.
  3. The European Commission Commission recommendation of 18 October 2011 on the definition of nanomaterial (2011/696/EU). Off. J. Eur. Union 2011, L 275, 38–40.
  4. Linsinger, T.P.J.; Roebben, G.; Gilliland, D.; Calzolai, L.; Rossi, F.; Gibson, N.; Klein, C. Requirements on Measurements for the Implementation of the European Commission Definition of the Term “Nanomaterial”; Publications Office of the European Union: Luxembourg, 2012. [Google Scholar]
  5. Rauscher, H.; Roebben, G.; Amenta, V.; Boix Sanfeliu, A.; Calzolai, L.; Emons, H.; Gaillard, C.; Gibson, N.; Linsinger, T.; Mech, A.; et al. Towards a Review of the EC Recommendation for a Definition of the Term “Nanomaterial”—Part 1: Compilation of Information Concerning the Experience with the Definition; Rauscher, H., Roebben, G., Eds.; Publications Office of the European Union: Luxembourg, 2014. [Google Scholar]
  6. von der Kammer, F.; Legros, S.; Hofmann, T.; Larsen, E.H.; Loeschner, K. Separation and characterization of nanoparticles in complex food and environmental samples by field-flow fractionation. TrAC Trends Anal. Chem. 2011, 30, 425–436. [Google Scholar] [CrossRef]
  7. Mattarozzi, M.; Suman, M.; Cascio, C.; Calestani, D.; Weigel, S.; Undas, A.; Peters, R. Analytical approaches for the characterization and quantification of nanoparticles in food and beverages. Anal. Bioanal. Chem. 2017, 409, 63–80. [Google Scholar] [CrossRef] [PubMed]
  8. Peters, R.J.B.; van Bemmel, G.; Herrera-Rivera, Z.; Helsper, H.P.F.G.; Marvin, H.J.P.; Weigel, S.; Tromp, P.C.; Oomen, A.G.; Rietveld, A.G.; Bouwmeester, H. Characterization of titanium dioxide nanoparticles in food products: Analytical methods to define nanoparticles. J. Agric. Food Chem. 2014, 62, 6285–6293. [Google Scholar] [CrossRef] [PubMed]
  9. Heroult, J.; Nischwitz, V.; Bartczak, D.; Goenaga-Infante, H. The potential of asymmetric flow field-flow fractionation hyphenated to multiple detectors for the quantification and size estimation of silica nanoparticles in a food matrix. Anal. Bioanal. Chem. 2014, 406, 3919–3927. [Google Scholar] [CrossRef] [PubMed]
  10. Wagner, S.; Legros, S.; Loeschner, K.; Liu, J.; Navratilova, J.; Grombe, R.; Linsinger, T.P.J.; Larsen, E.H.; von der Kammer, F.; Hofmann, T. First steps towards a generic sample preparation scheme for inorganic engineered nanoparticles in a complex matrix for detection, characterization, and quantification by asymmetric flow-field flow fractionation coupled to multi-angle light scattering. J. Anal. At. Spectrom. 2015, 30, 1286–1296. [Google Scholar] [CrossRef] [Green Version]
  11. Contado, C.; Pagnoni, A. TiO2 in commercial sunscreen lotion: Flow field-flow fractionation and ICP-AES together for size analysis. Anal. Chem. 2008, 80, 7594–7608. [Google Scholar] [CrossRef] [PubMed]
  12. Nischwitz, V.; Goenaga-Infante, H. Improved sample preparation and quality control for the characterisation of titanium dioxide nanoparticles in sunscreens using flow field flow fractionation on-line with inductively coupled plasma mass spectrometry. J. Anal. At. Spectrom. 2012, 27, 1084–1092. [Google Scholar] [CrossRef]
  13. Müller, D.; Cattaneo, S.; Meier, F.; Welz, R.; de Vries, T.; Portugal-Cohen, M.; Antonio, D.C.; Cascio, C.; Calzolai, L.; Gilliland, D.; et al. Inverse supercritical fluid extraction as a sample preparation method for the analysis of the nanoparticle content in sunscreen agents. J. Chromatogr. A 2016, 1440, 31–36. [Google Scholar] [CrossRef] [PubMed]
  14. Bocca, B.; Sabbioni, E.; Micetic, I.; Alimonti, A.; Petrucci, F. Size and metal composition characterization of nano- and microparticles in tattoo inks by a combination of analytical techniques. J. Anal. At. Spectrom. 2017, 32, 616–628. [Google Scholar] [CrossRef]
  15. Loeschner, K.; Navratilova, J.; Købler, C.; Mølhave, K.; Wagner, S.; von der Kammer, F.; Larsen, E.H. Detection and characterization of silver nanoparticles in chicken meat by asymmetric flow field flow fractionation with detection by conventional or single particle ICP-MS. Anal. Bioanal. Chem. 2013, 405, 8185–8195. [Google Scholar] [CrossRef] [PubMed] [Green Version]
  16. Storehagen, S.; Ose, N.; Midha, S. Dentifrices and Mouthwashes Ingredients and Their Use; University of Oslo: Oslo, Norway, 2003. [Google Scholar]
  17. NanoDefine Project Development of Methods and Standards Supporting the Implementation of the Commission Recommendation for a Definition of Nanomaterial (FP7-NMP-2013-LARGE-7, no. 604347). Available online: http://www.nanodefine.eu (accessed on 6 May 2018).
  18. Loeschner, K.; Navratilova, J.; Legros, S.; Wagner, S.; Grombe, R.; Snell, J.; von der Kammer, F.; Larsen, E.H. Optimization and evaluation of asymmetric flow field-flow fractionation of silver nanoparticles. J. Chromatogr. A 2013, 1272, 116–125. [Google Scholar] [CrossRef] [PubMed]
  19. Harris, D.C. Quantitative Chemical Analysis; WH Freeman: New York, NY, USA, 2010; ISBN 9781464135385. [Google Scholar]
  20. Park, J.; Lakes, R.S. Biomaterials: An Introduction, 3rd ed.; Springer-Verlag: New York, NY, USA, 2007; ISBN 9780387378794. [Google Scholar]
  21. Pace, H.E.; Rogers, N.J.; Jarolimek, C.; Coleman, V.A.; Higgins, C.P.; Ranville, J.F. Determining transport efficiency for the purpose of counting and sizing nanoparticles via single particle inductively coupled plasma mass spectrometry. Anal. Chem. 2011, 83, 9361–9369. [Google Scholar] [CrossRef] [PubMed]
  22. Rakcheev, D.; Philippe, A.; Schaumann, G.E. Hydrodynamic chromatography coupled with single particle-inductively coupled plasma Mass Spectrometry for investigating nanoparticles agglomerates. Anal. Chem. 2013, 85, 10643–10647. [Google Scholar] [CrossRef] [PubMed]
  23. UniChrom. Available online: http://www.unichrom.com (accessed on 26 November 2018).
  24. Koeber, R.; Kestens, V.; Bienert, R.; Müller, P. NanoDefine Technical Report D1.6—Characterization Dossier for Reference Materials. Available online: http://www.nanodefine.eu/publications/reports/NanoDefine_TechnicalReport_D1.6.pdf (accessed on 6 May 2018).
  25. Wiilknitz, P. Cleaning Power and Abrasivity of European Toothpastes. Adv. Dent. Res. 1997, 11, 576–579. [Google Scholar] [CrossRef] [PubMed] [Green Version]
  26. Becker, L.C.; Boyer, I.; Bergfeld, W.F.; Belsito, D.V.; Hill, R.A.; Klaassen, C.D.; Liebler, D.C.; Marks, J.G.; Shank, R.C.; Slaga, T.J.; et al. Safety Assessment of Alumina and Aluminum Hydroxide as Used in Cosmetics. Int. J. Toxicol. 2016, 35, 16S–33S. [Google Scholar] [CrossRef] [PubMed]
  27. European Comission Comission Decision of February 2006 amending Decision 96/335/EC establishing an inventory and a common nomenclature of ingredients employed in cosmetic products. Off. J. Eur. Union 2006, L 97, 1–528.
  28. Fruijtier-Pölloth, C. The safety of nanostructured synthetic amorphous silica (SAS) as a food additive (E 551) (The preparation of this manuscript was financially supported by the Association of Amorphous Silica Producers). Arch. Toxicol. 2016, 90, 2885–2916. [Google Scholar] [CrossRef] [PubMed]
  29. Seidel, A. (Ed.) Kirk-Othmer Chemical Technology of Cosmetics; John Wiley & Sons, Inc.: Hoboken, NJ, USA, 2012. [Google Scholar]
  30. The European Parliament and the Council of the European Union Commission Regulation (EU) No 231/2012 of 9 March 2012 laying down specifications for food additives listed in Annexes II and III to Regulation (EC) No 1333/2008 of the European Parliament and of the Council. Off. J. Eur. Union 2012, L 83, 1–295.
  31. Kosmulski, M. The pH dependent surface charging and points of zero charge. VI. Update. J. Colloid Interface Sci. 2014, 426, 209–212. [Google Scholar] [CrossRef] [PubMed]
  32. Nogi, K.; Naito, M. (Eds.) Nanoparticle Technology Handbook; Elsevier: Amsterdam, The Netherlands, 2012; ISBN 9780444563361. [Google Scholar]
  33. Nelson, R.D. Dispersing Powders in Liquids. In Handbook of Powder Technology; Elsevier: Amsterdam, The Netherlands, 1988; Volume 7, ISBN 9780444430045. [Google Scholar]
  34. Xu, Z.; Ducker, W.; Israelachvili, J. Forces between Crystalline Alumina (Sapphire) Surfaces in Aqueous Sodium Dodecyl Sulfate Surfactant Solutions. Langmuir 1996, 12, 2263–2270. [Google Scholar] [CrossRef]
  35. Palla, B.J. Mixed surfactant systems to control dispersion stability in severe environments for enhancing chemical mechanical polishing (CMP) of metal surfaces. Ph.D. Thesis, University of Florida, Gainesville, FL, USA, 2000. [Google Scholar]
  36. Imae, T.; Muto, K.; Ikeda, S. The pH dependence of dispersion of TiO2 particles in aqueous surfactant solutions. Colloid Polym. Sci. 1991, 269, 43–48. [Google Scholar] [CrossRef]
  37. Wang, X.-J.; Li, H.; Li, X.-F.; Wang, Z.-F.; Lin, F. Stability of TiO2 and Al2O3 Nanofluids. Chin. Phys. Lett. 2011, 28, 86601. [Google Scholar] [CrossRef]
  38. Veronovski, N.; Andreozzi, P.; La Mesa, C.; Sfiligoj-Smole, M. Stable TiO2 dispersions for nanocoating preparation. Surf. Coatings Technol. 2010, 204, 1445–1451. [Google Scholar] [CrossRef]
  39. Schimpf, M.; Caldwell, K.; Giddings, J.C. (Eds.) Field-Flow Fractionation Handbook; John Wiley & Sons, Inc.: New York, NY, USA, 2000; ISBN 0-471-18430-6. [Google Scholar]
  40. Siripinyanond, A.; Barnes, R.M. Flow field-flow fractionation-inductively coupled plasma mass spectrometry of chemical mechanical polishing slurries. Spectrochim. Acta Part B At. Spectrosc. 2002, 57, 1885–1896. [Google Scholar] [CrossRef]
  41. Aureli, F.; D’Amato, M.; Raggi, A.; Cubadda, F. Quantitative characterization of silica nanoparticles by asymmetric flow field flow fractionation coupled with online multiangle light scattering and ICP-MS/MS detection. J. Anal. At. Spectrom. 2015, 30, 1266–1273. [Google Scholar] [CrossRef]
  42. Helsper, J.P.F.G.; Peters, R.J.B.; van Bemmel, M.E.M.; Rivera, Z.E.H.; Wagner, S.; von der Kammer, F.; Tromp, P.C.; Hofmann, T.; Weigel, S. Physicochemical characterization of titanium dioxide pigments using various techniques for size determination and asymmetric flow field flow fractionation hyphenated with inductively coupled plasma mass spectrometry. Anal. Bioanal. Chem. 2016, 408, 6679–6691. [Google Scholar] [CrossRef] [PubMed] [Green Version]
  43. Bendixen, N.; Losert, S.; Adlhart, C.; Lattuada, M.; Ulrich, A. Membrane–particle interactions in an asymmetric flow field flow fractionation channel studied with titanium dioxide nanoparticles. J. Chromatogr. A 2014, 1334, 92–100. [Google Scholar] [CrossRef] [PubMed]
  44. Barahona, F.; Geiss, O.; Urbán, P.; Ojea-Jimenez, I.; Gilliland, D.; Barrero-Moreno, J. Simultaneous Determination of Size and Quantification of Silica Nanoparticles by Asymmetric Flow Field-Flow Fractionation Coupled to ICPMS Using Silica Nanoparticles Standards. Anal. Chem. 2015, 87, 3039–3047. [Google Scholar] [CrossRef] [PubMed]
  45. von der Kammer, F.; Baborowski, M.; Friese, K. Field-flow fractionation coupled to multi-angle laser light scattering detectors: Applicability and analytical benefits for the analysis of environmental colloids. Anal. Chim. Acta 2005, 552, 166–174. [Google Scholar] [CrossRef]
  46. Striegel, A.M.; Brewer, A.K. Hydrodynamic Chromatography. Annu. Rev. Anal. Chem. 2012, 5, 15–34. [Google Scholar] [CrossRef] [PubMed]
  47. Stegeman, G.; Kraak, J.C.; Poppe, H. Dispersion in packed-column hydrodynamic chromatography. J. Chromatogr. A 1993, 634, 149–159. [Google Scholar] [CrossRef]
  48. Tiede, K.; Boxall, A.B.A.; Tiede, D.; Tear, S.P.; David, H.; Lewis, J. A robust size-characterisation methodology for studying nanoparticle behaviour in ‘real’ environmental samples, using hydrodynamic chromatography coupled to ICP-MS. J. Anal. At. Spectrom. 2009, 24, 964. [Google Scholar] [CrossRef]
  49. Tiede, K.; Boxall, A.B.A.; Wang, X.; Gore, D.; Tiede, D.; Baxter, M.; David, H.; Tear, S.P.; Lewis, J. Application of hydrodynamic chromatography-ICP-MS to investigate the fate of silver nanoparticles in activated sludge. J. Anal. At. Spectrom. 2010, 25, 1149. [Google Scholar] [CrossRef]
  50. Philippe, A.; Schaumann, G.E. Evaluation of Hydrodynamic Chromatography Coupled with UV-Visible, Fluorescence and Inductively Coupled Plasma Mass Spectrometry Detectors for Sizing and Quantifying Colloids in Environmental Media. PLoS ONE 2014, 9, e90559. [Google Scholar] [CrossRef] [PubMed]
  51. Philippe, A.; Gangloff, M.; Rakcheev, D.; Schaumann, G.E. Evaluation of hydrodynamic chromatography coupled with inductively coupled plasma mass spectrometry detector for analysis of colloids in environmental media—Effects of colloid composition, coating and shape. Anal. Methods 2014, 6, 8722–8728. [Google Scholar] [CrossRef]
  52. Holdich, R.G. Fundamentals of Particle Technology; Midland Information Technology and Publishing: Nottingham, UK, 2002; ISBN 9780954388102. [Google Scholar]
  53. Gigault, J.; El Hadri, H.; Reynaud, S.; Deniau, E.; Grassl, B. Asymmetrical flow field flow fractionation methods to characterize submicron particles: application to carbon-based aggregates and nanoplastics. Anal. Bioanal. Chem. 2017, 409, 6761–6769. [Google Scholar] [CrossRef] [PubMed]
Figure 1. AF4-LS fractograms obtained for toothpaste dispersions (carrier liquid 0.05% w/w SDS, 10 µg injected toothpaste mass) prepared by a two-step dilution in 0.1% w/w SDS (method 1, gray line) and chemical oxidation with 30% H2O2 followed by dilution in 0.1% w/w SDS (method 2, black line). The rms diameter values obtained by MALS are shown as gray diamonds and black circles, respectively. The AF4-LS measurements were performed on different AF4 membranes.
Separations 05 00056 g001
Figure 2. AF4-LS and AF4-ICP-MS fractograms obtained for the toothpaste dispersion in 0.05% w/w SDS (10 µg injected toothpaste mass). (a) AF4-LS fractogram based on the 90° LS signal. The rms diameters are shown as black circles. (bd) AF4-ICP-MS fractograms based on the 27Al, 28Si, and 47Ti signals (normalized to the internal standard 103Rh), respectively. (a,b,d) were obtained from the same AF4 separation. For (c), the sensitivity of the ICP-MS instrument was reduced due to the high background signal at 28Si. The 27Al, 47Ti fractograms obtained for that separation were reproducible but noisier. All AF4 separations were performed on the same membrane. The LS signal was smoothed.
Separations 05 00056 g002aSeparations 05 00056 g002b
Figure 3. Influence of cross flow rate on the AF4 fractionation of the toothpaste particles (10 µg injected mass): (a) 27Al signal, (b) 47Ti signal. All AF4-ICP-MS measurements were performed on the same membrane. Signal smoothing was applied.
Separations 05 00056 g003
Figure 4. Mass-based particle size distribution (PSD) obtained by AF4-ICP-MS for Al- and Ti-containing particles in toothpaste (black lines in (a,b), respectively)). The AF4-ICP-MS retention times were converted to hydrodynamic diameters after AF4 channel calibration with polystyrene size standards. The ratios between rms diameters and hydrodynamic diameters values (drms/dh) are shown as white squares.
Separations 05 00056 g004
Figure 5. Fraction collection after toothpaste separation by AF4 and validation of the mass-based PSD by spICP-MS. (a,c) Presentation of the collected fractions on the corresponding mass-based PSDs. Fractions were collected at different time intervals corresponding to the void peak (tr = 0.7–1.7 min), to the peak shoulder region observed in the Al mass-based PSD (F1, tr = 7–8 min) and to the maximum of the Al and Ti mass-based PSDs (F2 − tr = 24–25 min and F3 − tr = 33–34 min, respectively) (b,d) Number-based PSDs for Al2O3 and TiO2 obtained after spICP-MS measurements of the collected fractions and of the bulk toothpaste after sample preparation (not submitted to AF4 separation).
Separations 05 00056 g005
Figure 6. Mass-based PSD of toothpaste particles obtained using HDC-ICP-MS. (a) Sample digested following method 1 (b) Sample digested following method 2.
Separations 05 00056 g006
Figure 7. (a,c) Number-based PSDs obtained after mathematical conversion of the mass-based AF4-ICP-MS particle size data. The number-based PSDs obtained after conversion of the original mass-based PSDs (based on the experimental data), and of the fitted curves of the mass-based PSDs (Gaussian and log-normal fits) are shown for comparison. (b,d) Corresponding cumulative PSDs obtained for experimental and the fitted data (Gaussian and log-normal fits). The D50 values obtained for each distribution are highlighted by dotted lines.
Separations 05 00056 g007
Table 1. Asymmetric flow field-flow fractionation (AF4) separation program (typical conditions).
StepDuration (min)ModeCross Flow Rate (mL/min)
12Elution-
22ElutionUsually same as step 6; final method: 0.5 mL/min
31Focus-
45Focus + injection-
510Focus-
665 ElutionTested: 0.3–0.75 mL/min;
final method: 0.5 mL/min
75Elution-
85Elution + injection-
Tested carrier liquids: 0.05% w/w SDS (pH 5–6), 0.025% w/w SDS (pH 5–6), and 0.025% v/v FL-70 (pH 9–10); final method: 0.05% w/w SDS (pH 5–6); Membrane material: PES or RC; final method: PES; Membrane cut-off: 10 kDa; Spacer height: 350 μm; Detector flow rate: 1.0 mL/min; Injection flow rate: 0.2 mL/min; Injection volume: 10–50 µL; final method: 50 µL.
Table 2. Experimental parameters determined for the 27Al and 47Ti signals at different cross flow rates (N = 2, where N is the number of repeated measurements). Retention times (tr), peak width (w), calculated resolution for the void and main peak (RS), and obtained AF4 recoveries.
m/zCross Flow Rate (mL/min)tr, Main Peak (min)w, Main Peak (min)RSRec.
Void Peak (%)
Rec.
Main Peak (%)
Rec.
Release Peak (%)
Rec.
Total (%)
27Al0.316.7 ± 0.816.5 ± 1.01.8 ± 0.23 ± 016 ± 11 ± 120 ± 1
0.422.2 ± 1.617.8 ± 0.32.2 ± 0.23 ± 010 ± 32 ± 115 ± 3
0.527.0 ± 0.019.0 ± 1.42.5 ± 0.23 ± 010 ± 16 ± 218 ± 2
0.7529.1 ± 3.435.2 ± 6.41.3 ± 0.53 ± 14 ± 29 ± 1016 ± 13
47Ti0.323.1 ± 0.117.0 ± 0.22.5 ± 0.11 ± 088 ± 84 ± 193 ± 8
0.429.7 ± 0.718.7 ± 0.83.0 ± 0.00 ± 073 ± 2211 ± 385 ± 19
0.534.8 ± 0.120.9 ± 0.43.1 ± 0.10 ± 050 ± 122 ± 472 ± 2
0.7542.3 ± 0.828.1 ± 2.12.9 ± 0.30 ± 016 ± 350 ± 1066 ± 13

