Article

Separation Optimization of a Mixture of Ionized and Non-Ionized Solutes under Isocratic and Gradient Conditions in Reversed-Phase HPLC by Means of Microsoft Excel Spreadsheets

by
Chrysostomi Zisi
,
Athina Maria Mangipa
,
Eleftheria Boutou
and
Adriani Pappa-Louisi
*
Department of Chemistry, Aristotle University of Thessaloniki, 54124 Thessaloniki, Greece
*
Author to whom correspondence should be addressed.
Separations 2018, 5(1), 19; https://doi.org/10.3390/separations5010019
Submission received: 2 February 2018 / Revised: 9 March 2018 / Accepted: 12 March 2018 / Published: 18 March 2018
(This article belongs to the Special Issue Research as Development Perspective)

Abstract

:
Τhe crucial role of mobile phase pH for optimizing the separation of a mixture of ionized and non-ionized compounds on a Phenomenex extended pH-range reversed-phase column (Kinetex 5 µm EVO C18) was examined. A previously developed Excel-spreadsheet-based software was used for the whole separation optimization procedure of the sample of interest under isocratic conditions as well as under single linear organic modifier-gradients in different eluent pHs. The importance and the advantages of performing a computer-aided separation optimization compared with a trial-and-error optimization method were realized. Additionally, this study showed that the optimized separation conditions for a given stationary phase may be used to achieve successful separations on new columns of the same type and size. In general, the results of this work could give chromatographers a feel of confidence to establish desired separations of a mixture of ionizable and neutral compounds in reversed-phase columns.

1. Introduction

Reversed-phase liquid chromatography (RPLC) is one of the most widely used chromatographic techniques. It is a consequence of its universality, relatively low costs, and general simplicity of analytical procedures. Still, the development of any method with the desired RPLC separation might be long due to the large number of chromatographic settings that might be adjusted (mobile phase composition, pH, temperature, etc.). The most popular trial-and-error approach has several disadvantages since it is often time-consuming, usually requires a large number of preliminary experiments, and might not be fully efficient. Model-based techniques (fully or semi-automated software programs) can be used in the process of searching for desired RPLC separations [1,2,3,4,5]. These methods usually provide very successful separations based on a series of preliminary experiments. We believe that the number of experimental data may be reduced by utilizing the optimal separation conditions predicted for a specific column by an optimization software to other new columns of the same type and size.
In the present contribution, we report on the optimization of reversed-phase separations of mixture of ionized and non-ionized solutes under isocratic conditions as well as under single linear organic modifier-gradients in different eluent pHs using the Excel-spreadsheet-based software previously developed for simulating and optimizing liquid chromatographic separations [6]. Furthermore, the importance and the advantages of performing a computer-aided separation optimization compared with a trial-and-error optimization method will be confirmed as well as the crucial role of mobile phase pH for optimizing the separation of ionizable compounds [7,8]. This study also provides an example that the optimized separation conditions predicted for a certain column by an optimization software result in almost baseline separation of the test analytes in different columns of the same type and size.

2. Materials and Methods

2.1. Materials and Reagents

All chemicals were used as received from commercial sources. The solutes tested are: four monoprotic acids, 2-bromo-4-nitrophenol (2B-4NP), 4-bromo-2-nitrophenol (4B-2NP), 3-bromophenol (3-BP), and 2,4-dibromophenol (2,4-DBP); two monoprotic bases, p-chloro aniline (p-CA) and p-bromoaniline (p-BA); and two non-ionized compounds, benzene (B) and toluene (T). The orthophosphate system (85% H3PO4, KH2PO4, Na2HPO4) was employed for the preparation of buffer solutions in HPLC studies. Acetonitrile (ACN) or methanol (MeOH) of HPLC grade was used as organic modifiers.

2.2. Buffers and Standard Sample Solutions

Aqueous phosphate buffers with a total ionic strength of 0.2 M were used for preparing the mobile phases with different pH values. The composition of the different buffers employed was found in [9]. The working solutions with single solute or solute mixtures were prepared at a concentration of 360 μg mL−1 for benzenes, 240 μg mL−1 for 3-BP and 2,4-DBP, 24 μg mL−1 for 2B-4NP and 4B-2NP and 8 μg mL−1 for anilines.

2.3. HPLC System and Conditions

The liquid chromatography system consisted of a Shimadzu LC-20AD pump, a Shimadzu DGU-20A3 degasser, a model 7125 syringe loading sample injector fitted with a 5 μL loop and a Shimadzu UV–visible spectrophotometric detector (Model SPD-10A, Kyoto, Japan) operating at 254 nm. The column was thermostatted at 25 °C by a CTO-10AS Shimadzu column oven.
Four different Phenomenex reversed phase columns of the same size (150 × 4.6 mm) were used. Three of them (Kinetex 5 µm EVO C18, Kinetex 5 µm XB-C18 and Kinetex 2.6 µm XB-C18) were of core–shell technology i.e., with core–shell silica of different particle sizes. The Kinetex 5 µm EVO C18 column exhibits high pH stability from 1–12 similar with that of fully porous organo-silica column (Gemini 5 µm NX-C18), which was also used in this study.
The systematic chromatographic behavior of solutes was investigated on the Kinetex 5 µm EVO C18 column and in mobile phases consisting of diluted aqueous phosphate buffers with a total ionic strength of 0.02 M and a fixed pH value at 2, 3, 5, 7, or 9 modified with ACN. The mobile phase pHs were measured in aqueous buffers before the addition of the organic solvent. Three isocratic runs were performed in different eluent pHs with different ACN volume fraction, (ϕ = 0.3, 0.4, and 0.5) and three ϕ-gradient runs were performed by linearly increasing the ACN content in the mobile phase from an initial value of volume fraction ϕ0 = 0.3 to a final one ϕf = 0.5. In all gradients, a linear elution program was applied with the same starting time (tin = 0 min) but with different gradient duration, tG. Moreover, the effect brought on retention of test solutes the use of MeOH as organic modifier instead of ACN was investigated at a fixed eluent pH = 3 performing three isocratic runs with ϕMeOH = 0.4, 0.5 and 0.6 as well as three simple linear ϕMeOH-gradient runs from ϕ0 = 0.4 to ϕf = 0.6 with different gradient duration. The retention data obtained under the above chromatographic conditions, as well as under optimal conditions determined by the optimization procedure adopted in this study, are given in Table S1 in the Supporting Information.
The hold-up time of the Kinetex 5 µm EVO C18 column was estimated to be t0 = 0.983 min, whereas the dwell time tD = 0.73 min, at the flow rate set at 1.0 mL min−1.

2.4. Excel-Spreadsheet-Based Optimization Software

The separation optimization procedure under isocratic and simple gradient conditions in different eluent pHs modified with ACN or MeOH was performed using the Excel-spreadsheet-based program developed for simulating and optimizing liquid chromatographic separations [6]. The Excel-spreadsheet-based software ‘Isocr&GradSeparationOptimization’, with detailed instructions, available on the ACS Publications website at doi:10.1021/acs.jchemed.7b00108 was modified in order to be used for the separation optimization of the mixture of solutes under consideration. An Excel file with the name “Optimization in eluent pH 3 modified with ACN” is provided in the Supporting Information as an example for the whole computer-aided separation optimization procedure adopted in this study.

3. Results

3.1. Effect of the Eluent pH on the Retention of Ionizable Solutes

The effect of eluent pH on the retention factor, k, of a monoprotic acid ( H A H + + A ) or base ( B H + H + + B ) may be expressed as [10,11,12]
k = k 0 + k 1 10 j ( p H p K ) 1 + 10 j ( p H p K )  
where k0 and k1 are the retention factors of the neutral and fully ionized species of these ionogenic analytes, j is an indicator parameter, which is equal to 1 for acids and −1 for bases and p K = l o g K , K being the equilibrium constant of the appropriate acid/base equilibrium in the eluent, given by K = [ H + ] [ A ] [ H A ] for a monoprotic acid and by K = [ H + ] [ B ] [ B H + ] for a monoprotic base. Note that the values of k0, k1, and pK depends on the organic content of mobile phase and can be determined by fitting to Equation (1) either isocratic data obtained in different eluent pHs modified with the same organic content or by fitting gradient data of a fixed change of organic content with a fixed gradient duration in different eluent pHs [13].
The influence of eluent pH on the retention of each of the examined solutes is shown in Figure 1 created by fitting to Equation (1) the experimental retention data obtained under isocratic conditions in different eluent pHs with ϕACN = 0.3, which are given in Table S1. From this figure it is clear the influence of pH on the different types of ionogenic analytes, as well as the superiority of eluent pH 3 in the separation of the test mixture of ionized and non-ionized solutes tested.

3.2. Computer-Aided Separation Optimization in Different Eluent pHs

A computer-assisted separation optimization of a mixture of solutes comprising a visualization of predicted chromatograms involves the following steps [6]:
  • An initial experimental study of the chromatographic behavior of solutes obtained by the least number of chromatographic runs adequately selected.
  • The fitting of the experimental retention data of each solute to a retention model in order to determine its adjustable parameters.
  • The modeling of the peak shape of analytes in the form of a preferred function.
  • The determination of the optimal separation conditions—i.e., the conditions that lead to the best separation of solutes under consideration—based on the above determined retention and peak shape parameters of solutes.
  • The comparison of the simulated chromatogram plotted under the optimal predicted conditions with the corresponding experimental chromatogram recorded under the same conditions in order to test the accuracy of the optimization process.
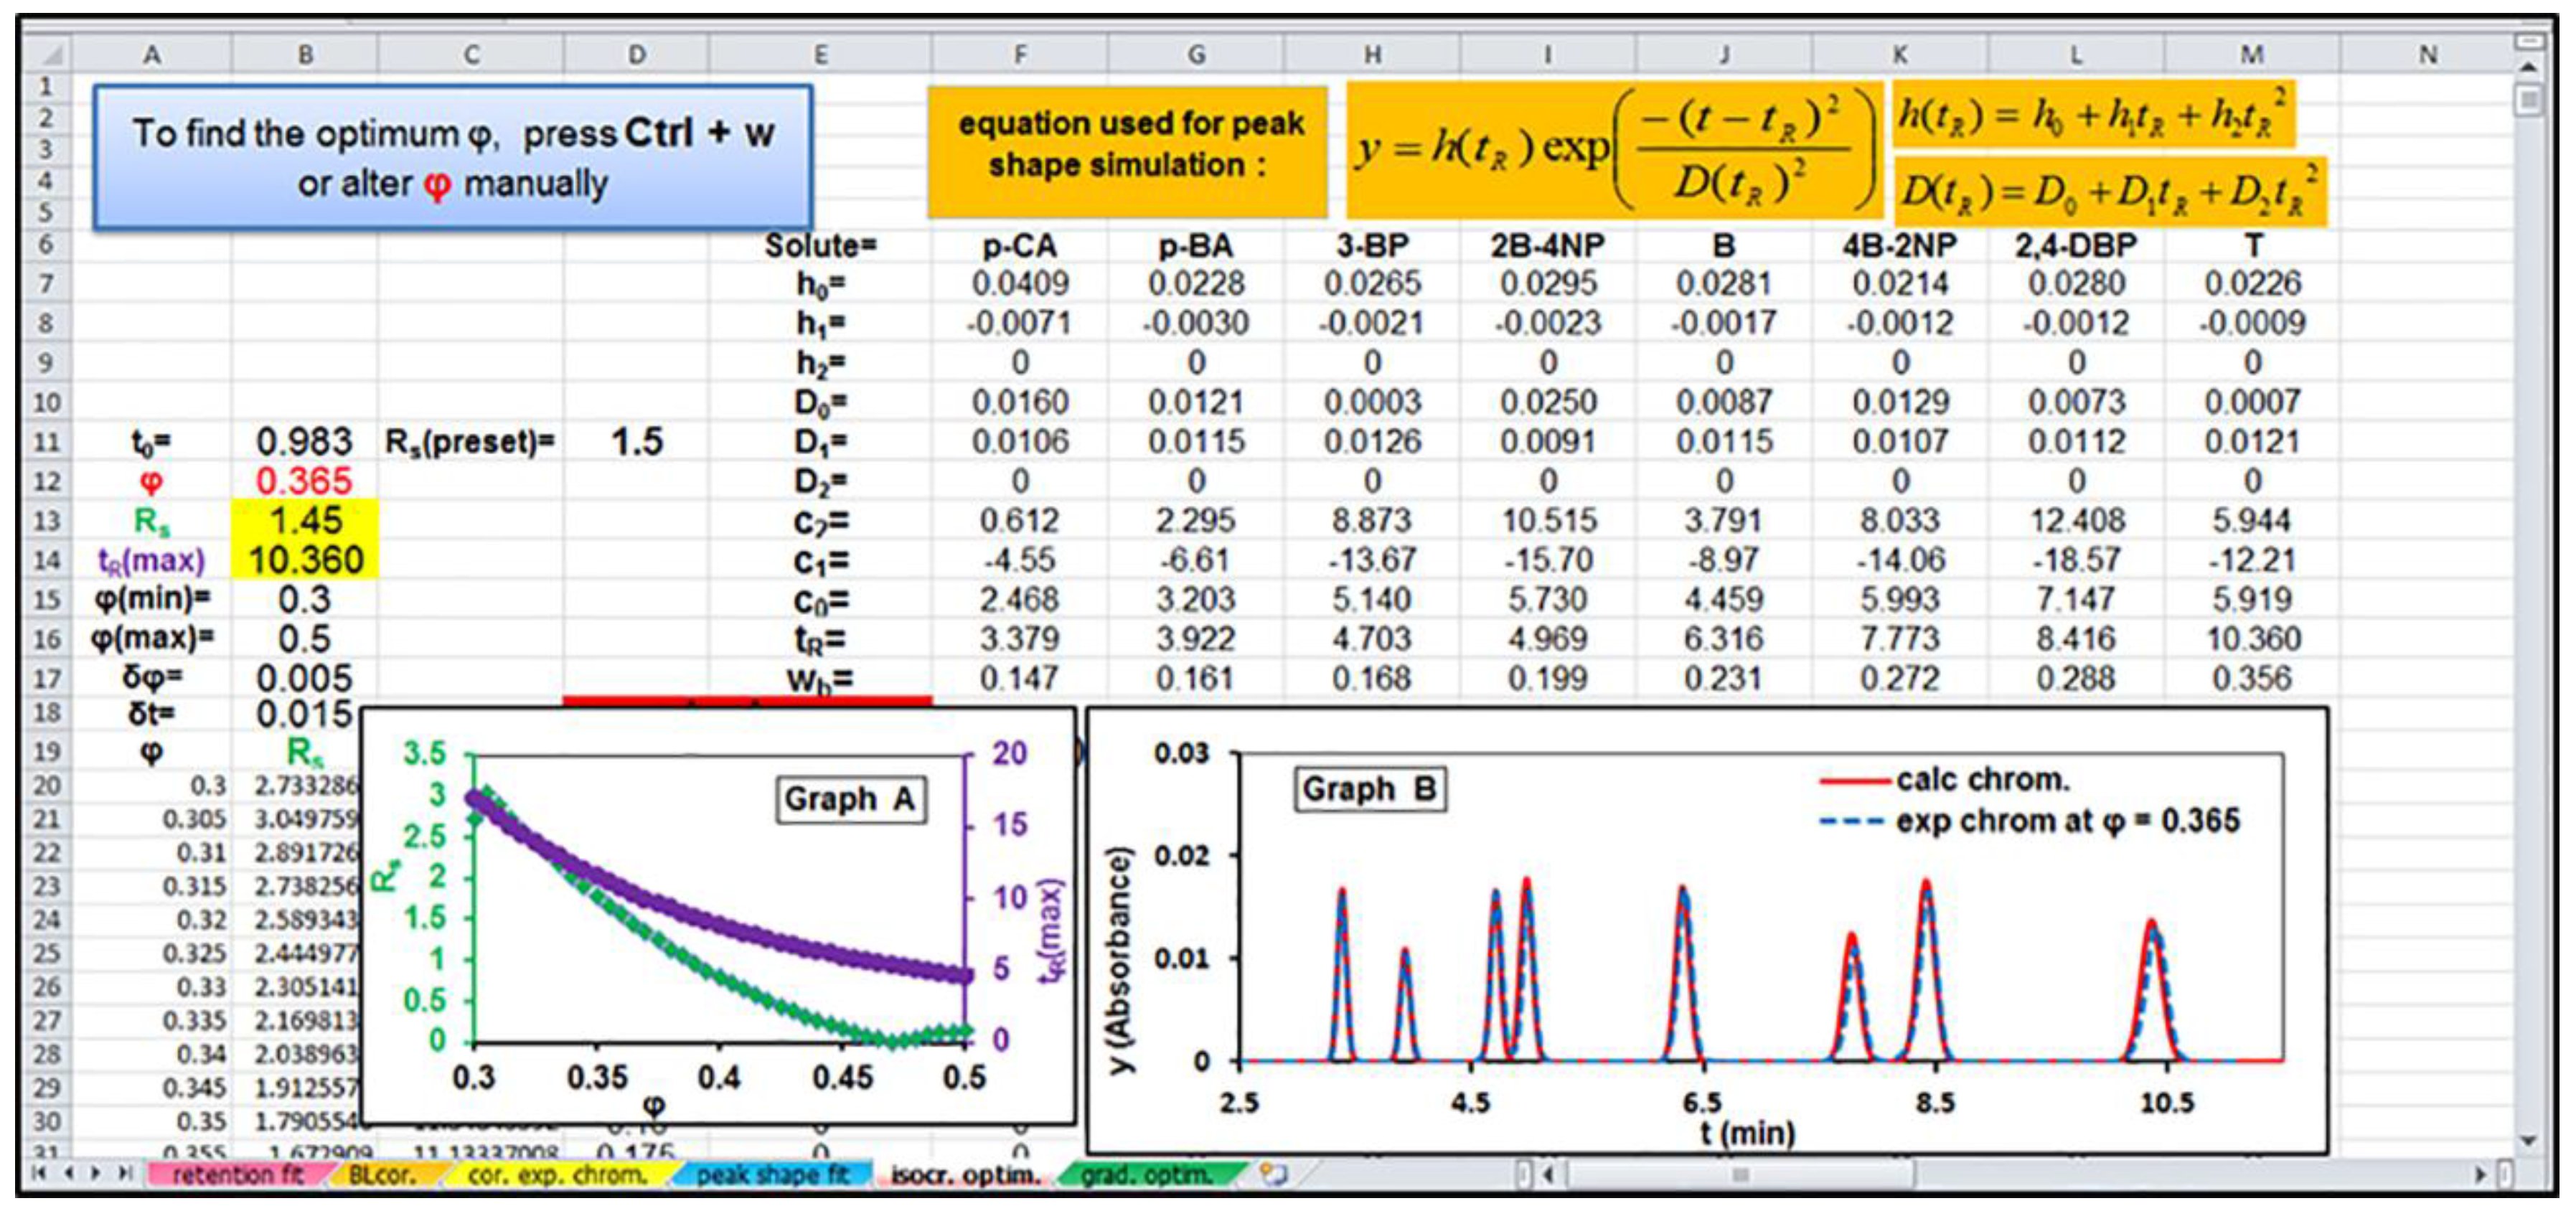
The whole separation optimization procedure of the test analytes under isocratic conditions as well as under single linear ϕ-gradients in different eluent pHs was implemented on different MS Excel spreadsheets. The optimization procedure followed for separation optimization in eluent pH 3 is given as an example.
The isocratic retention data of solutes, tR(exp), given in Table S1 and obtained on the Kinetex 5 µm EVO C18 column with different ACN volume fraction (ϕ = 0.3, 0.4, and 0.5) in eluent pH 3 were fitted to the quadratic retention model l n k = c 0 + c 1 φ + c 2 φ 2 [14] (where k is the solute retention factor, k = ( t R t 0 ) / t 0 , and ϕ is the volume fraction of ACN in the mobile phase) using the spreadsheet ‘retention fit’ of the file “Optimization in eluent pH 3 modified with ACN” provided in the Supporting Information. Note that, although the spreadsheet ‘retention fit’ is designed for fitting isocratic retention data to the quadratic retention model, the linear retention model, l n k = c 0 + c 1 φ , could be used instead, if the chromatographic behavior of solutes was studied in a very narrow range of ϕ.
After correction of the baseline of the experimental chromatograms recorded in eluents with ϕACN = 0.3 and 0.4 by pressing Ctrl+q on the spreadsheet with the name ‘BLcor.’, available in “Optimization in eluent pH 3 modified with ACN” file, modeling of the peak shapes is straightforward. For fitting the peak shapes of each solute recorded in different chromatograms with ϕACN = 0.3 and 0.4 to the model
y = h ( t R ) e x p ( ( t t R ) 2 D ( t R ) 2 )
the spreadsheet ‘peak shape fit’ is used. This spreadsheet is designed to estimate the peak shape parameters (h0, h1, h2, D0, D1, and D2) of a quadratic dependence of both peak height, h, and peak width, D, on tR, given by h ( t R ) = h 0 + h 1 t R + h 2 t R 2 and D ( t R ) = D 0 + D 1 t R + D 2 t R 2 . It should be noted that the data for two experimental chromatograms are enough for the above procedure since the peaks experimentally recorded in this study permit a linear dependence of both the peak height and peak width on tR instead of the quadratic one initially assumed.
After the retention times and peak shape parameters for all of the solutes studied under isocratic conditions have been estimated, the values of these parameters (i.e., c0, c1, c2, h0, h1, h2, D0, D1, and D2) are transferred into the spreadsheet ‘isocr.optim.’ in “Optimization in eluent pH 3 modified with ACN” file. A screenshot of this spreadsheet is displayed in Figure 2. The isocratic separation optimization of the sample mixture is easily automated by pressing Ctrl+w. Then, the minimum resolution, Rs, and the maximum of tR values, tR(max), of all solutes separated under isocratic conditions in eluent pH 3 are recorded as a function of the organic content ϕ on columns A, B, and C, where ϕ is altered between two values (ϕ(min) = 0.3 and ϕ(max) = 0.5, preset in cells B15 and B16) with a selected interval δϕ = 0.005 placed in cell B17. Simultaneously, the values of Rs and tR(max) vs. ϕ are plotted in a graph, see the inset Graph A of the layout of this worksheet, and simulated chromatograms are generated for each mobile phase strength ϕ in the inset Graph B of the worksheet. The execution of the macro is accomplished by finding the optimal eluent, ϕACN = 0.365, which leads to the best separation of the sample—i.e., the separation with a desirable value of resolution—Rs = 1.5 (preset in cell D11), in the shortest separation time, which in this case is only 10.36 min. The inset Graph B of Figure 2 depicts a perfect similarity between the simulated chromatogram created for the optimal eluent with ϕACN = 0.365 (plotted as the red solid line) and the original experimental one (plotted as the blue dashed line).
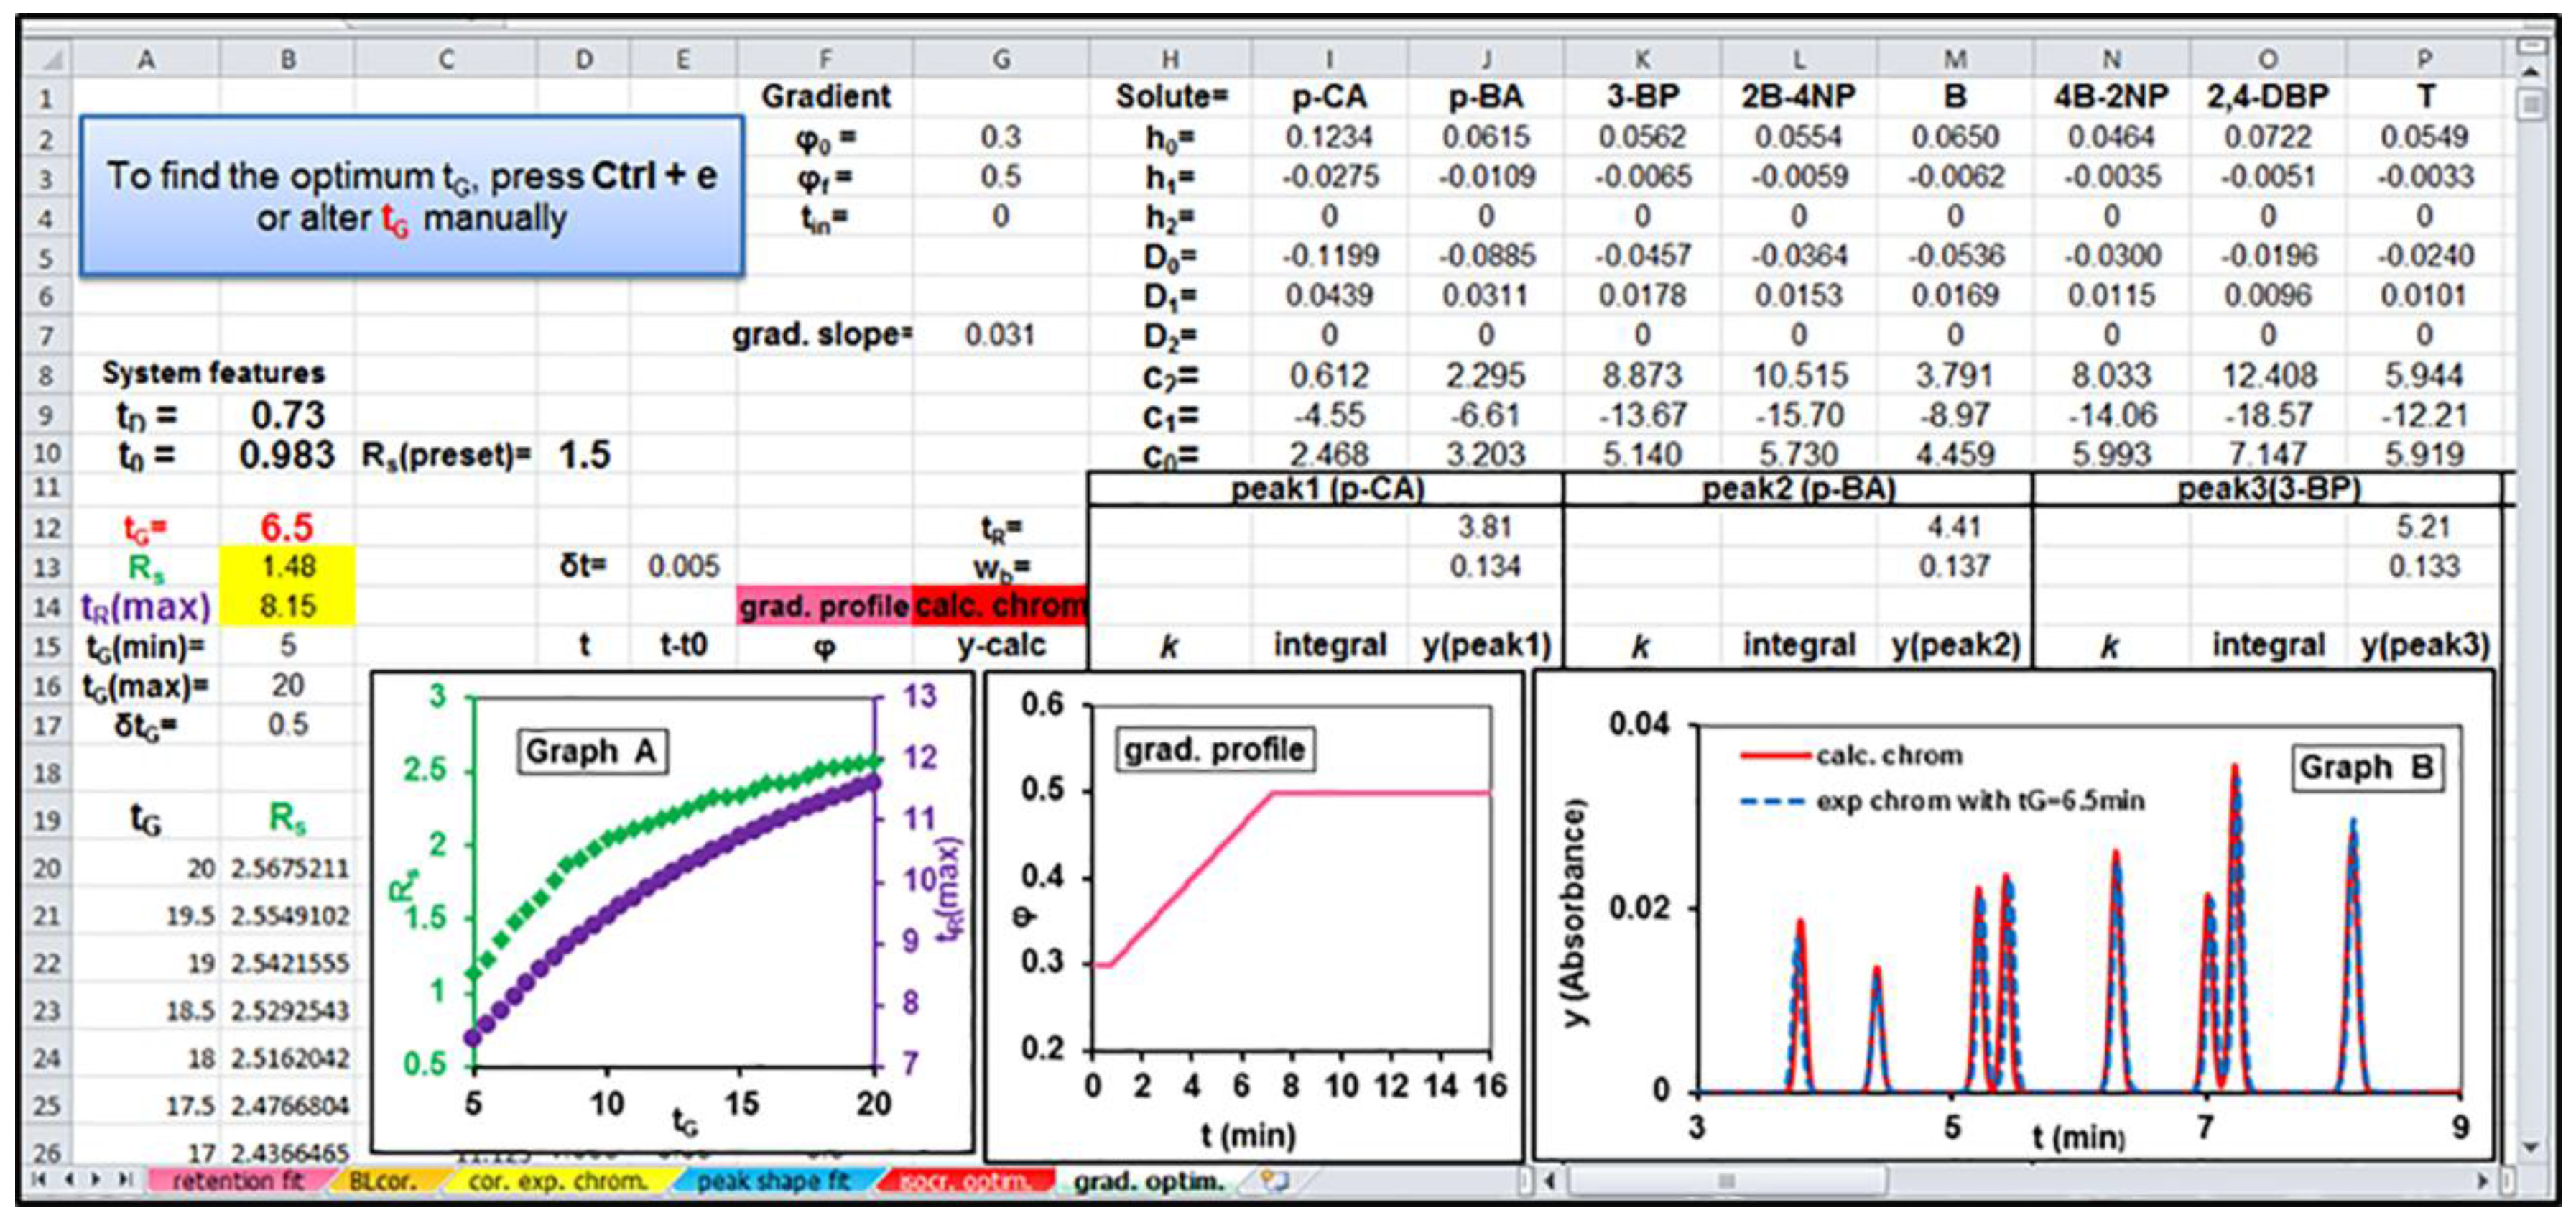
A procedure similar with that described above for isocratic separation optimization and simulation is also followed for optimizing single linear gradient conditions and simulating chromatograms obtained under selected different gradient profiles. A screenshot of the spreadsheet ‘grad. optim.’ is depicted in Figure 3.
The values of ϕ0 and ϕf—i.e., ϕ0 = 0.3 and ϕf = 0.5 for the data set analyzed—are placed in cells G2 and G3, respectively, the features of chromatographic system—i.e., the values of tD = 0.73 min and t0 = 0.983 min in cells B9 and B10—whereas the estimated retention and peak shape parameters of all solutes are transferred in cells I2:Q10. Note that, in this procedure the retention adjustable parameters, c0, c1, and c2, were determined in the worksheet ‘retention fit’ from initial isocratic conditions. In contrast, the peak shape parameters, h0, h1, h2, D0, D1, and D2, were obtained from gradient runs between ϕ0 = 0.3 to ϕf = 0.5 with different gradient durations, tG = 5 and 20 min, in the worksheet ‘peak shape fit’, since the peak widths in gradient elution are normally compressed compared to those obtained under isocratic conditions. By pressing Ctrl+e, the minimum resolution, Rs, and the maximum of tR values, tR(max), of all solutes separated under gradient conditions with different gradient durations, tG, are calculated in columns A, B, and C, where tG, varied between two values, tG(min) = 5 min and tG(max) = 20 min, defined in cells B15 and B16 with a selected interval δtG = 0.5 min (placed in cell B17). Moreover, a plot is simultaneously created with these values of Rs and tR(max) vs. tG, as well as a graph is generated for simulated chromatograms obtained under different gradient profiles. Again, the execution of the macro is accomplished by finding the optimal gradient duration, tG = 6.5 min, which leads to the best separation of the sample—i.e., the separation with a satisfactory resolution, i.e., Rs = 1.5 (preset in cell D10)—in the shortest separation time, which in this case is only 8.15 min. The inset Graph B of Figure 3 depicts a perfect similarity between the predicted/simulated chromatogram in the optimal gradient elution with a duration tG = 6.5 min (plotted as the red solid line) and the original experimental one (plotted as the blue dashed line).
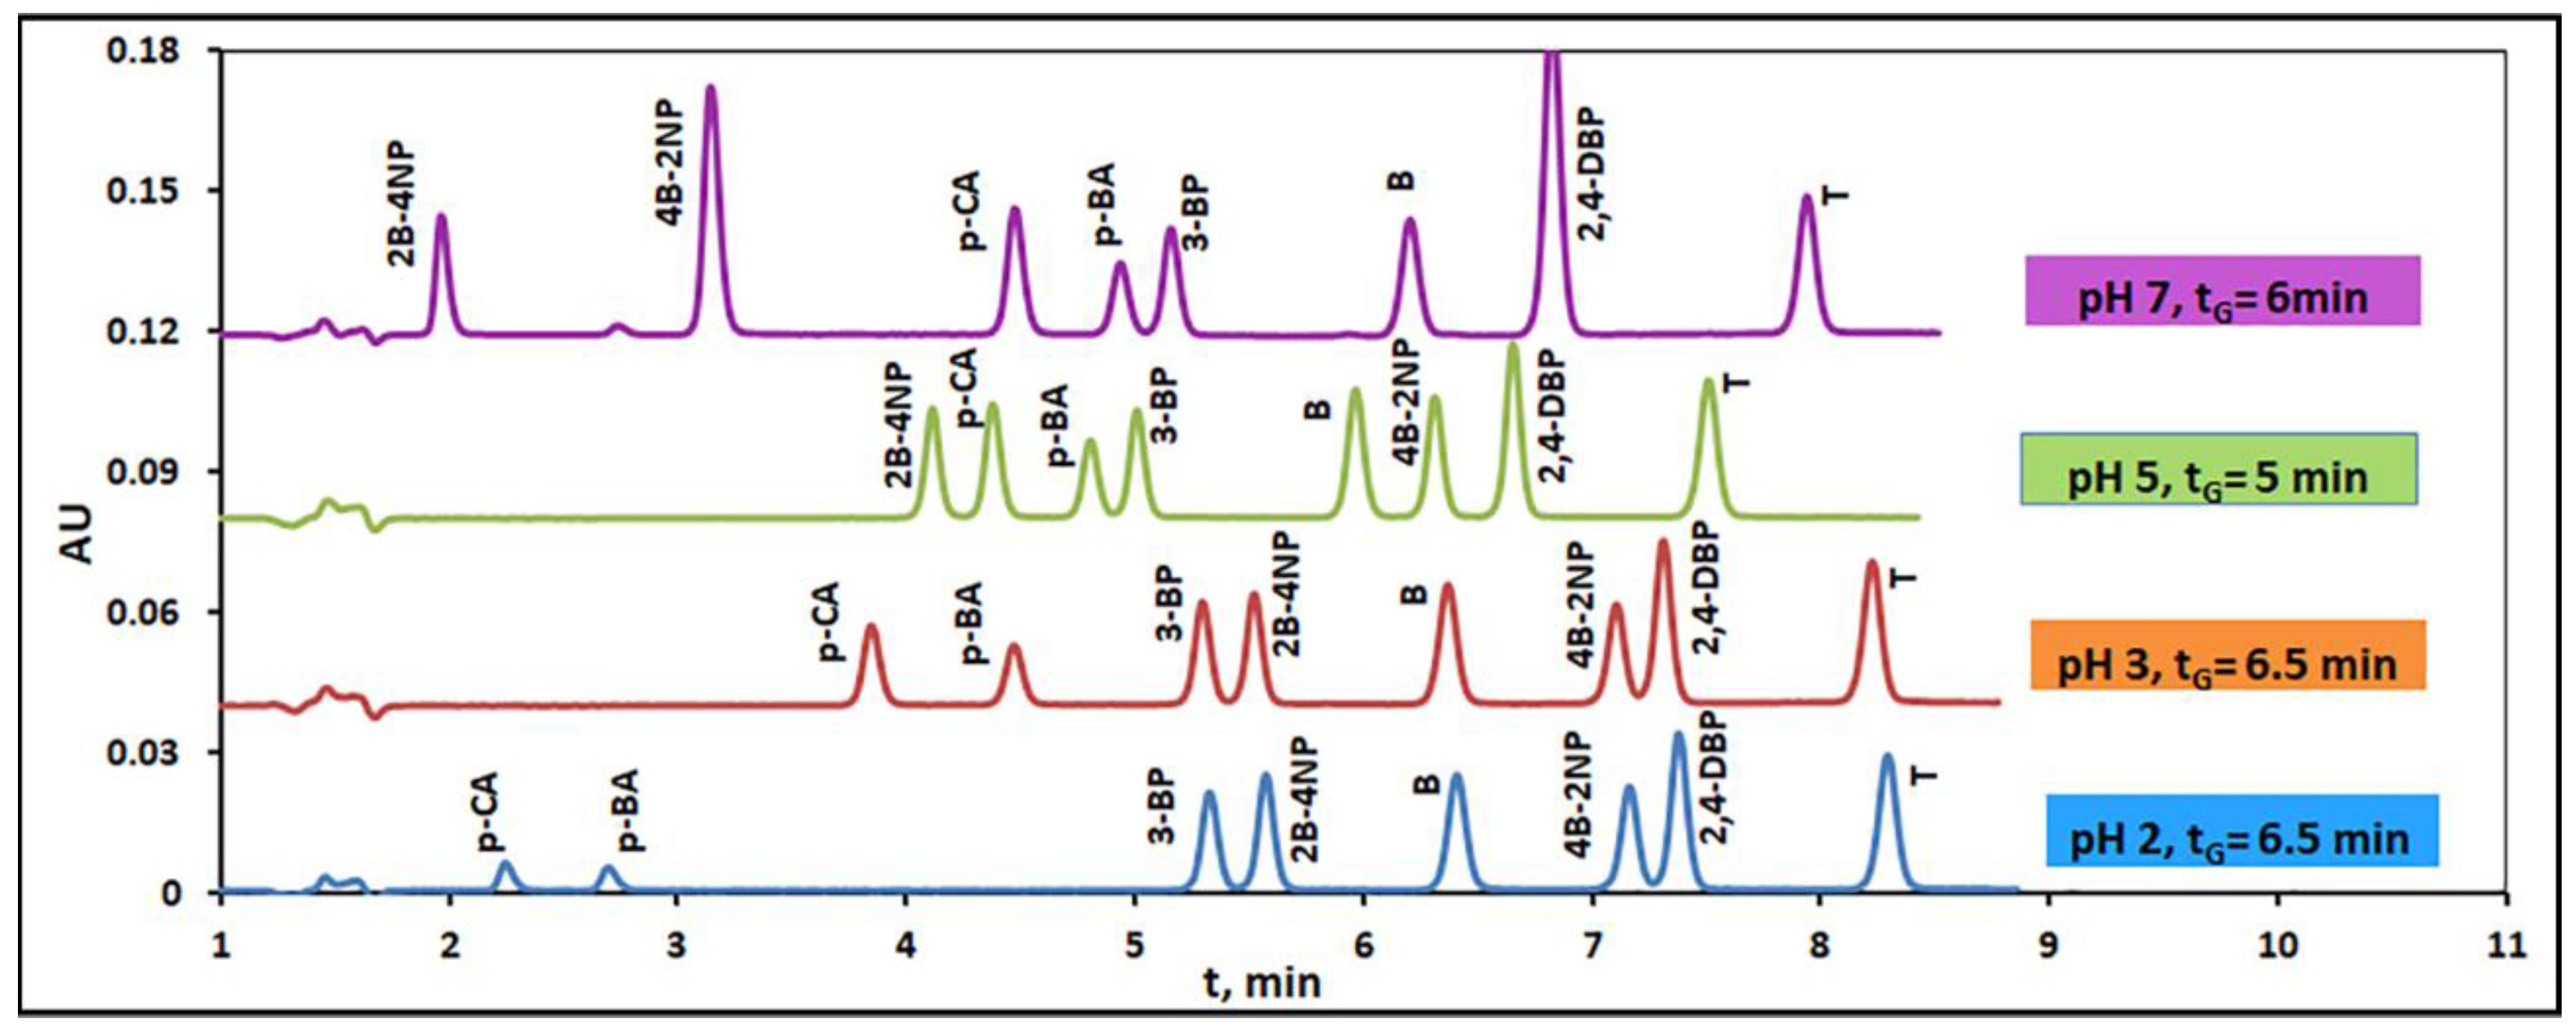
The same optimization approach is applied to chromatographic data obtained under isocratic conditions as well as under single linear ϕ-gradients in other examined eluent pHs—i.e., at pH = 2, 5 and 7, respectively—depicted in Table S1. The retention data recorded in eluent pH = 9 were not analyzed by means of the above spreadsheet optimization program since peak shape distortions appeared for some solutes at that mobile phase pH. The optimal conditions found for the separation of test mixture of solutes on the Kinetex 5 µm EVO C18 column in different eluent pHs are summarized in Table 1. The chromatograms recorded under the optimal gradient conditions found by the optimization algorithm are depicted in Figure 4. In the same Figure, the influence of mobile phase pH on the elution order as well as on the peak shape of ionizable compounds is also illustrated.

3.3. Utility of Computer-Aided Separation Optimization

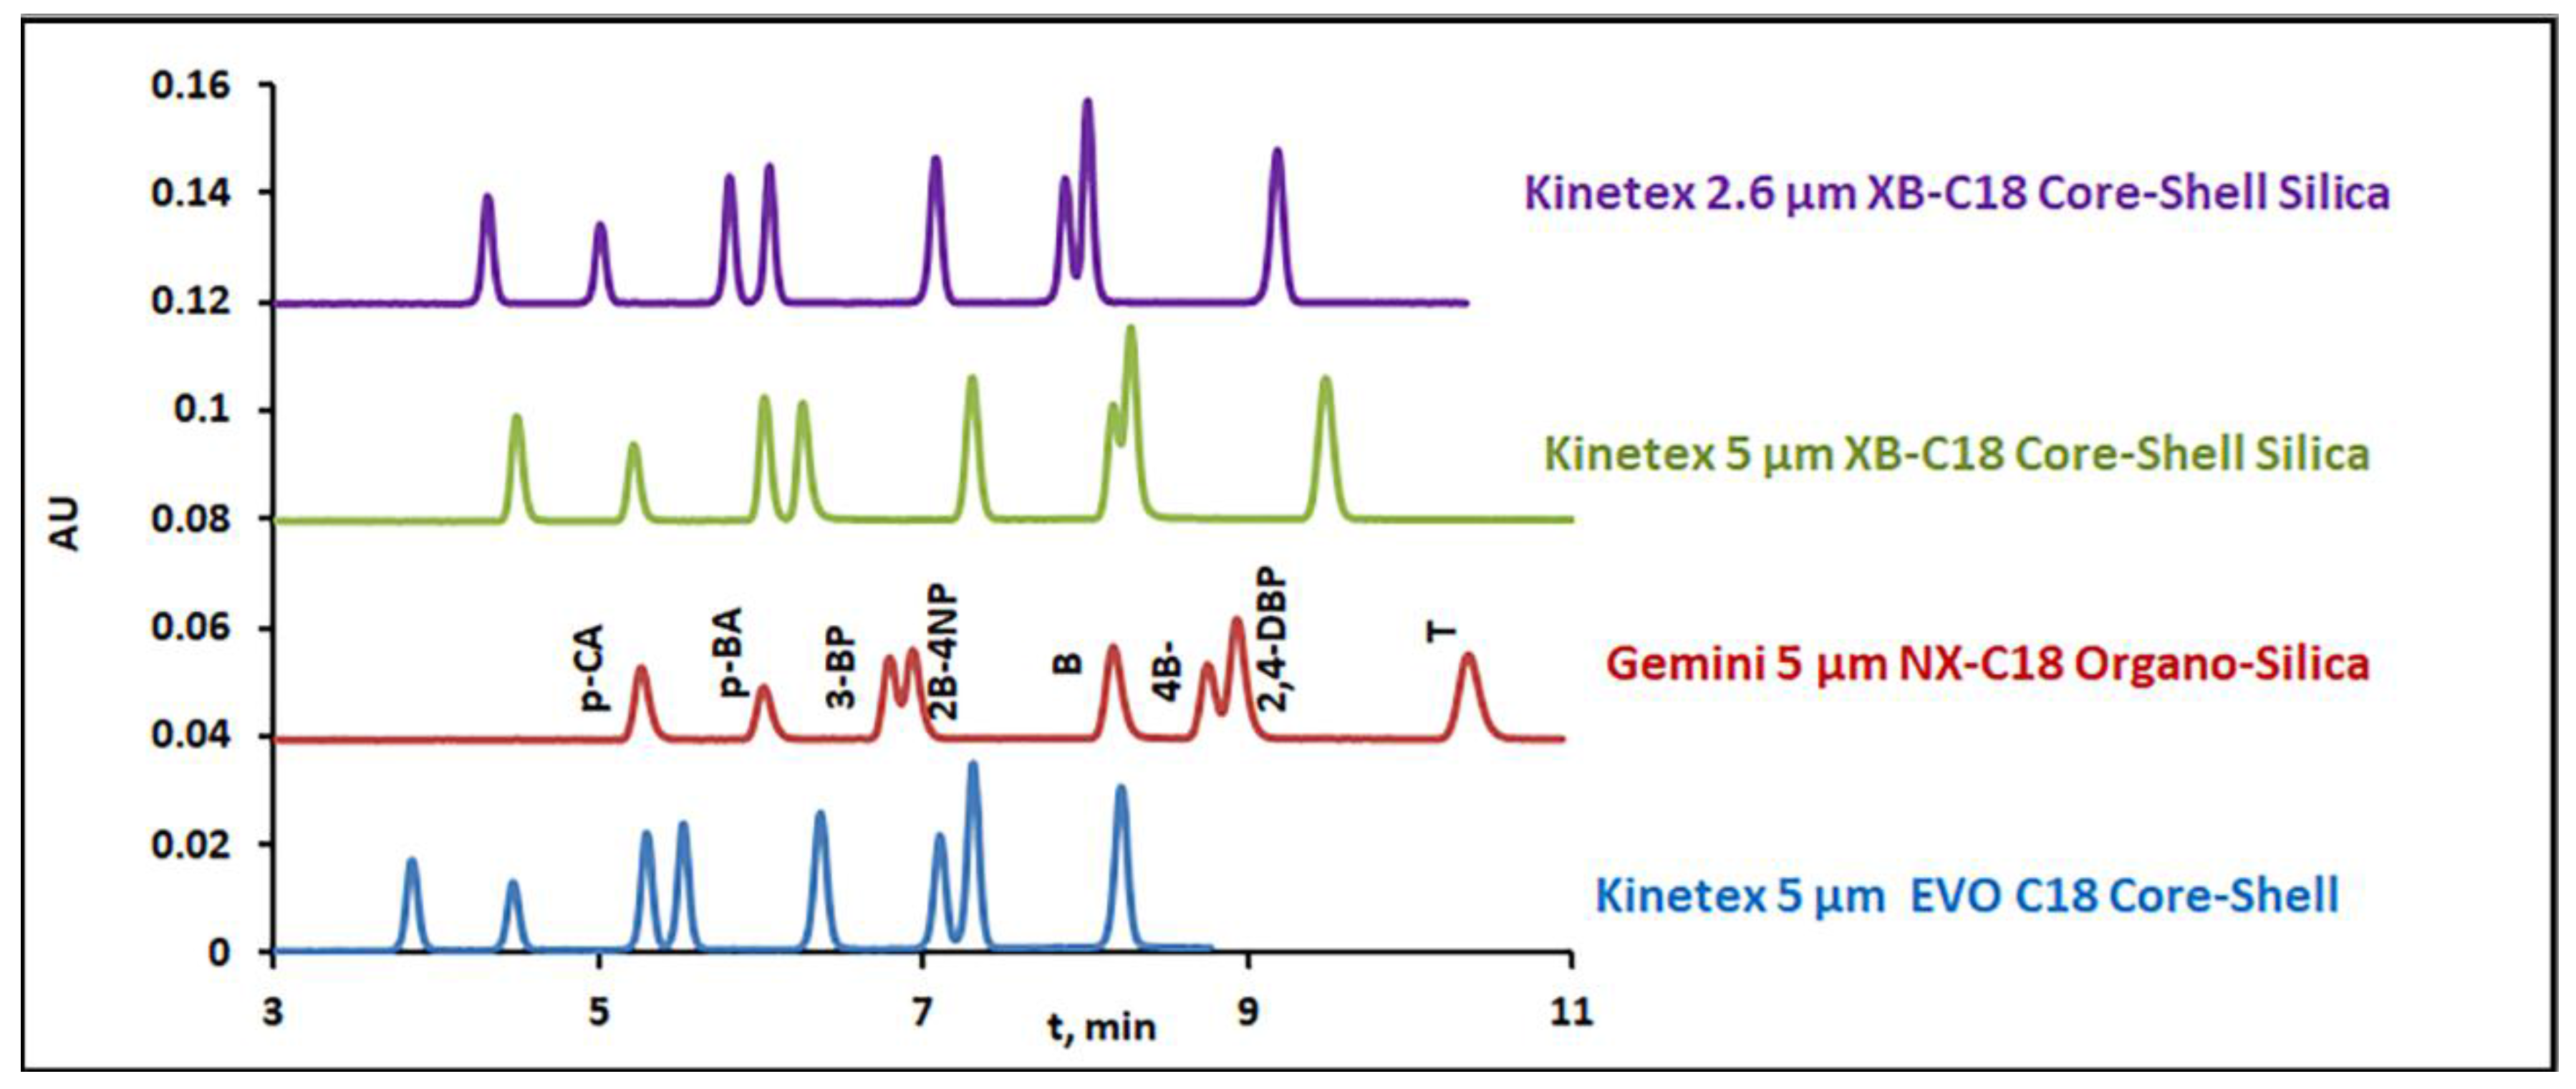
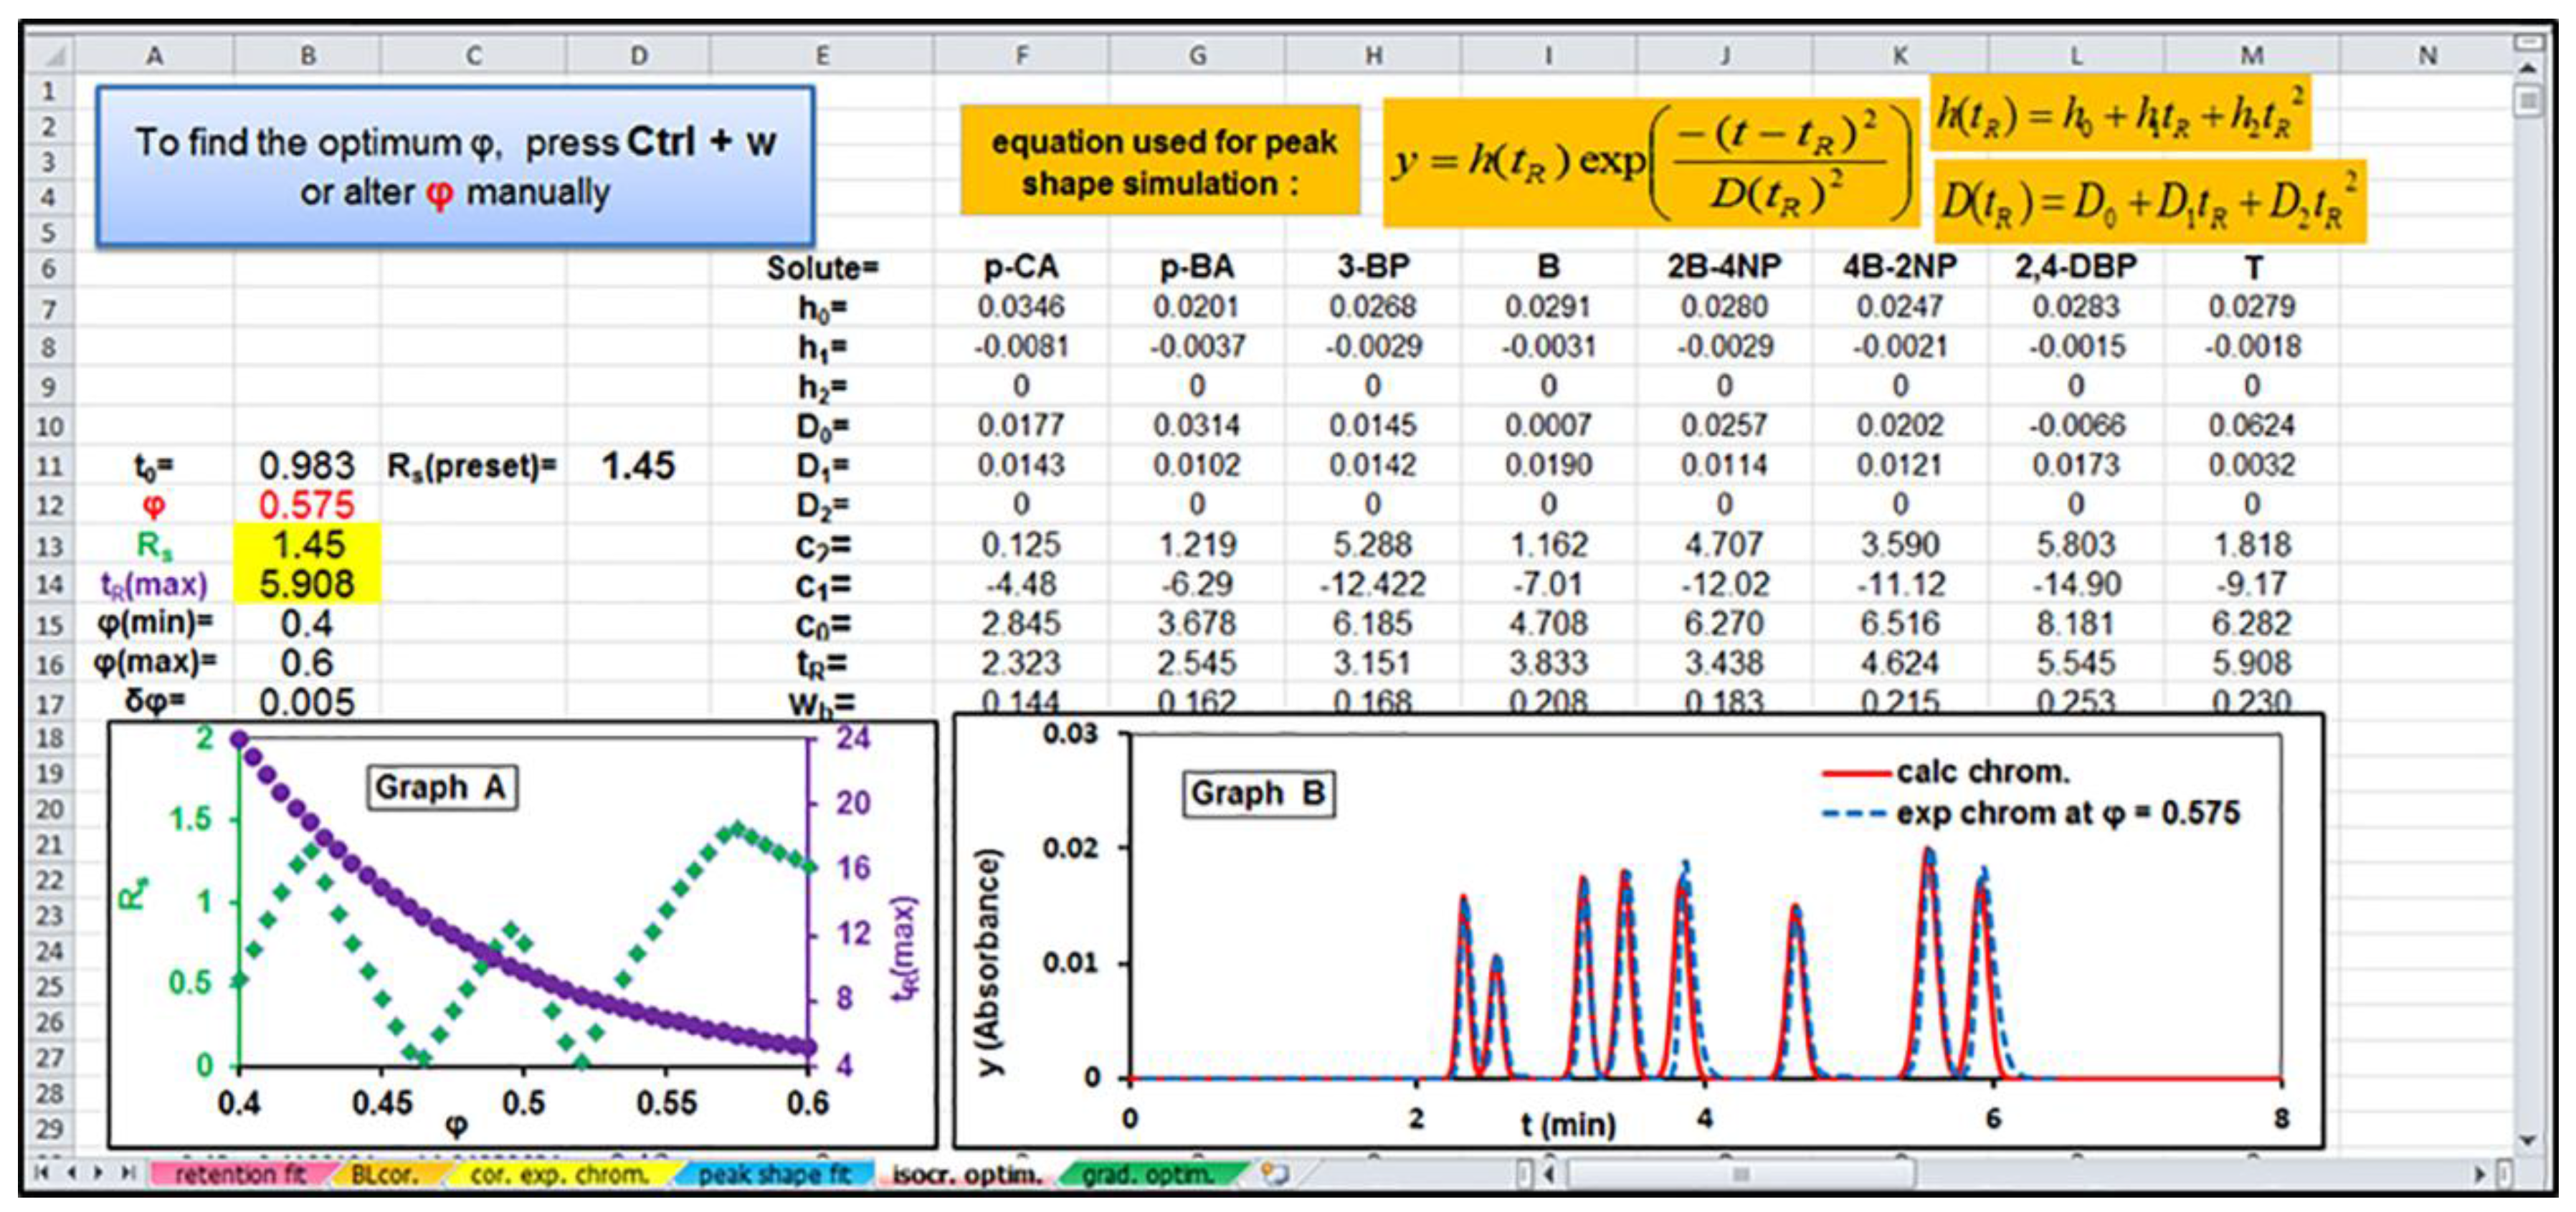
Once the optimal separation conditions of the sample of interest were found for the Kinetex 5 µm EVO C18 column by the proposed Excel-spreadsheet-based software, the effectiveness of the same optimal conditions into separation of solutes in different reversed-phase-type columns of the same size was tested. Indeed, a perfect resolution of the sample of interest is achieved in the chromatograms recorded in different columns under the optimal conditions determined for the Kinetex 5 µm EVO C18 column; see, as an example, Figure 5 for the application of optimal gradient conditions determined at eluent pH 3. Consequently, the optimal conditions derived for the separation of a sample on a certain column by the optimization algorithm could be successfully applied to other columns of the same type and size. Moreover, in Figure 5, the superiority of the core–shell technology columns and especially of the Kinetex EVO column is illustrated, since it is clear that a complete separation of test compounds was achieved within the minimum run time.
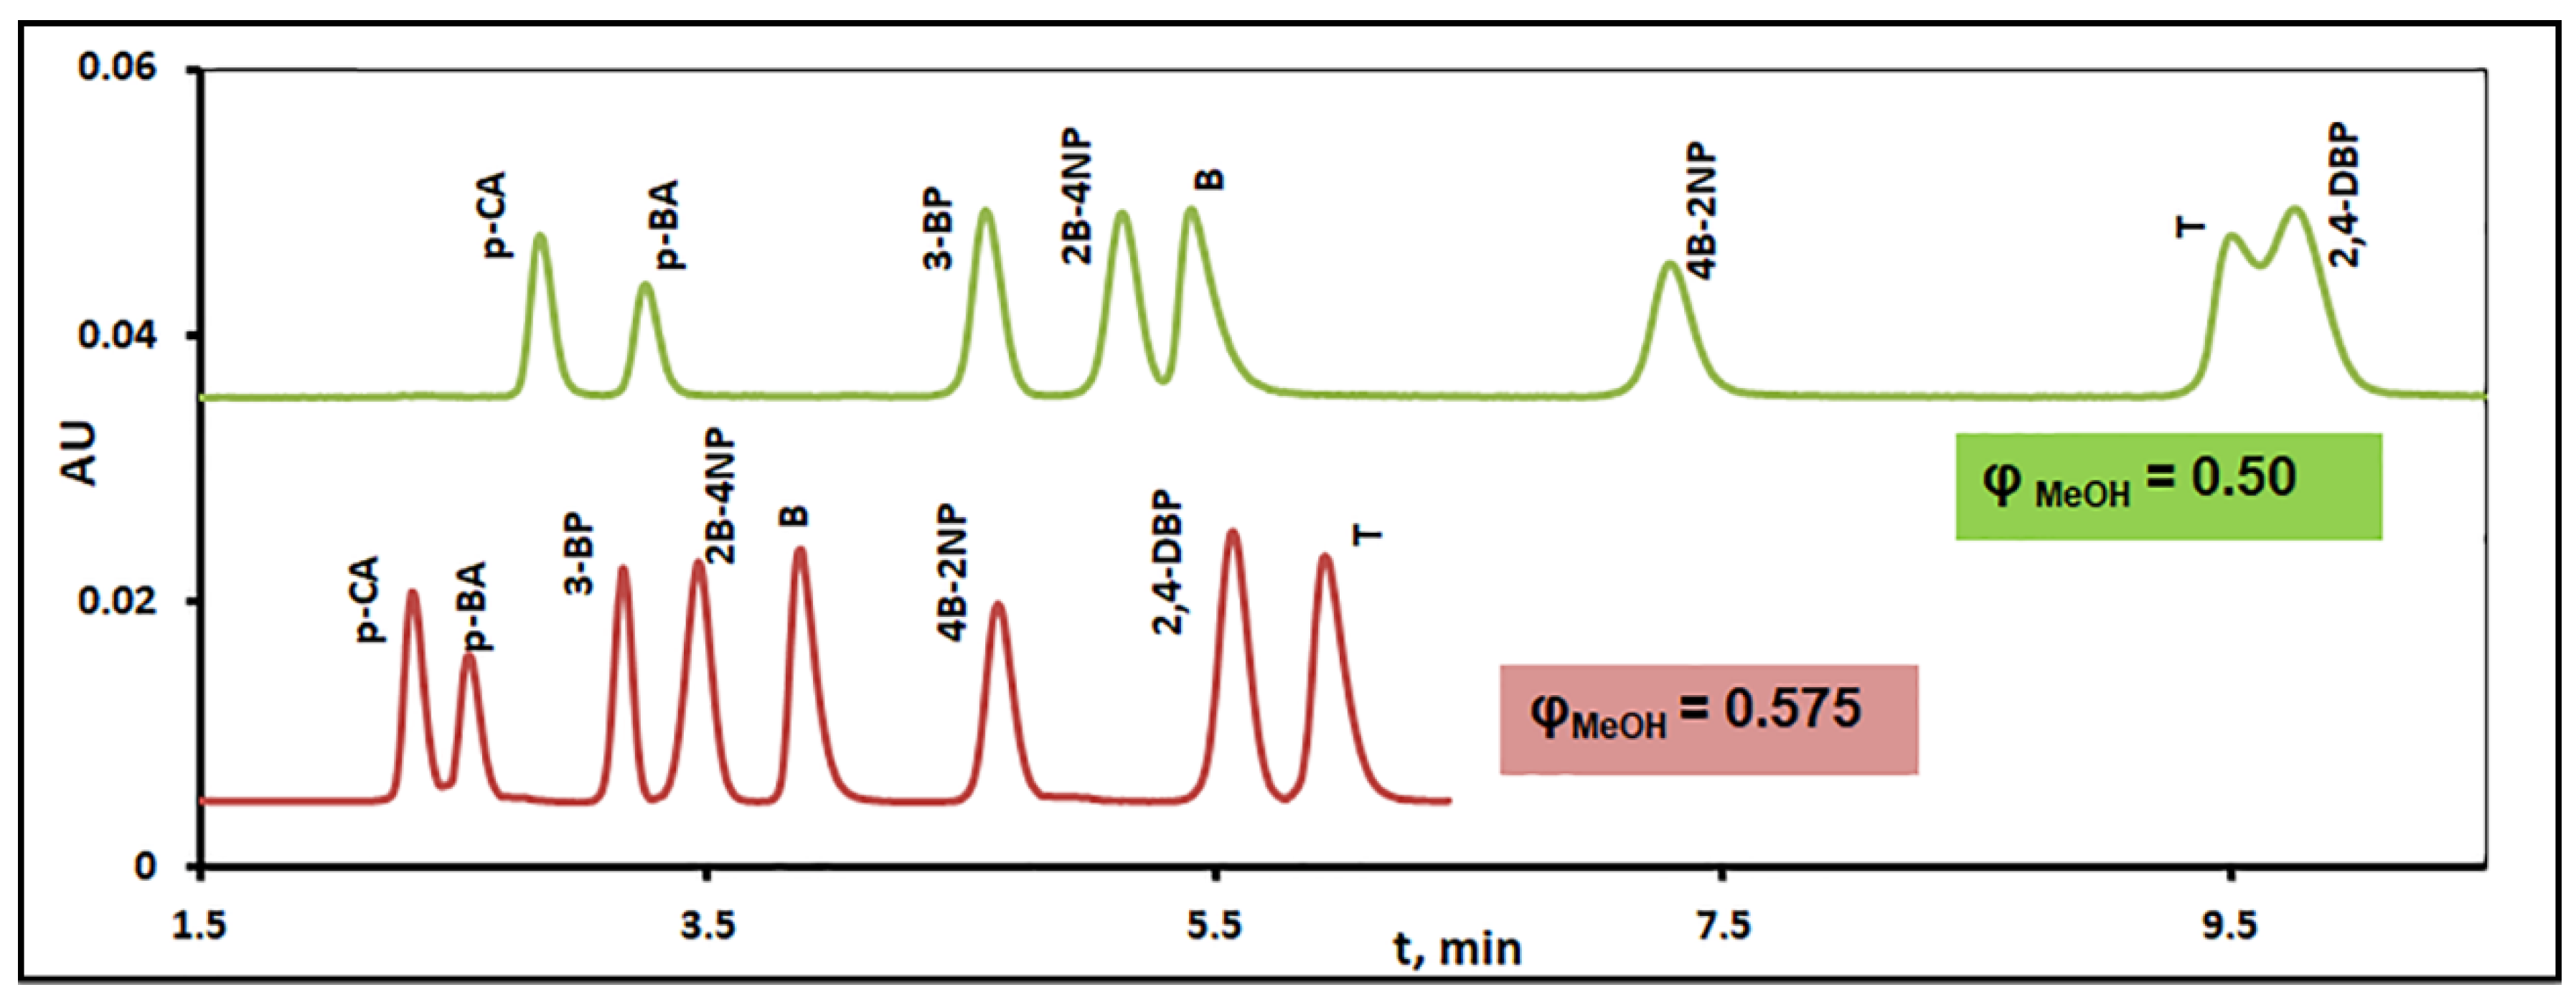
The importance and the advantages of performing a computer-aided separation optimization are clearly shown in Figure 6 and Figure 7. Figure 6 is a screenshot of the MS Excel spreadsheet ‘isocr. optim.’ used for isocratic separation optimization of test solutes in eluent pH 3 modified with MeOH. The retention data recorded in this eluent, depicted in Table S1, were analyzed by means of the Excel-spreadsheet optimization program following a procedure similar to that described above for separation optimization in eluent pH 3 modified with ACN. The optimal eluent, ϕMeOH= 0.575 was automatically found by pressing Ctrl+w. However, the selection of the optimal separation conditions is also possible from a good appreciation of the inset Graph A of Figure 6, which is also automatically created as described above. As shown in this figure, tR(max), decreases with increasing organic content ϕ in the mobile phase (purple circle markers), as is expected for a reversed-phase-type elution. However, the dependence of Rs (the resolution of the least resolved pair of adjacent solutes) on ϕ (depicted by the green diamond markers) is rather peculiar. For example, the resolution in mobile phases with either ϕMeOH = 0.46 or ϕMeOH = 0.52 is almost zero, which means that at least two solutes co-elute under the above isocratic conditions even though the run times, i.e., the values of tR(max) correspond to these eluent concentrations are longer than that in the optimal eluent with ϕMeOH = 0.575. Consequently, the foreknowledge of the precise dependence of Rs and tR(max) upon ϕ, provided by Excel-spreadsheet-based software adopted in this study and not by a trial-and-error method gives chromatographers a feel of confidence for the selection of the optimal conditions for a desired separation. Indeed, Figure 7 depicts a perfect resolution of the test solutes in the chromatogram recorded on the Kinetex 5 µm EVO C18 column and in the optimal eluent with ϕMeOH = 0.575. In contrast, the resolution of the same sample in a mobile phase with ϕMeOH = 0.5 is worse than that in an eluent ϕMeOH = 0.575 even though the separation time is longer, see also Figure 7.

4. Conclusions

In this study, the whole separation optimization procedure of the test analytes under isocratic conditions as well as under single linear ϕ-gradients in different eluent pHs was successfully implemented by using an Excel-spreadsheet-based software, a user-friendly and widespread software platform, based on a few initial experiments for each eluent pH: three isocratic runs and two single linear ϕ-gradient runs performed in the studied range of mobile phase strength, ϕ. In the adopted optimization process, for computational simplicity, the solute retention parameters were obtained from the analysis of isocratic data, whereas a Gaussian function was used to fit peak shapes. The importance and the advantages of performing a computer-aided separation optimization compared with a trial-and-error optimization method were realized. The optimal separation conditions derived by the optimization algorithm for the separation of the sample of interest on a certain reversed-phase column were successfully applied to other same-type columns of the same size. The superiority of the core–shell technology columns and especially of the Kinetex EVO column was illustrated. In general, we consider that the results of this study could give chromatographers a feel of confidence for the selection of the optimal separation conditions for a sample of ionizable and neutral compounds in reversed-phase columns.

Supplementary Materials

The following are available online at https://www.mdpi.com/2297-8739/5/1/19/s1, Table S1: Experimental retention data, tR(exp) in min, of test solutes obtained on the Kinetex 5 µm EVO C18 column and under isocratic and linear gradient conditions in different eluent pHs modified with ACN or MeOH (PDF), Excel-spreadsheet-based software: “Optimization in eluent pH 3 modified with ACN” (ZIP).

Author Contributions

The experimental design was constructed and supervised by A.P.-L. The experiments were performed by A.M.M. and E.B. The data were analyzed by C.Z. The manuscript was drafted and written by A.P.-L. and C.Z.

Conflicts of Interest

The authors declare no conflict of interest.

References

  1. Jupille, T.; Snyder, L.; Molnar, I. Optimizing multi-linear gradients in HPLC. LC-GC Eur. 2002, 15, 596–601. [Google Scholar]
  2. Concha-Herrara, V.; Vivó-Truyols, G.; Torres-Lapasio, J.R.; García-Alvarez-Coque, M.C. Limits of multi-linear gradient optimization in reversed-phase liquid chromatography. J. Chromatogr. A 2005, 1063, 79–88. [Google Scholar] [CrossRef]
  3. Fasoula, S.; Zisi, C.; Gika, H.; Pappa-Louisi, A.; Nikitas, P. Retention prediction and separation optimization under multilinear gradient elution in liquid chromatography with Microsoft Excel macros. J. Chromatogr. A 2015, 1395, 109–115. [Google Scholar] [CrossRef] [PubMed]
  4. Debrus, B.; Lebrun, P.; Rozet, E.; Schofield, T.; Mbinze, J.K.; Marini, R.D.; Rudaz, S.; Boulanger, B.; Hubert, P. A new method for quality by design robust method optimization in liquid chromatography. LC-GC Eur. 2013, 26, 370–375. [Google Scholar]
  5. Tyteca, E.; Liekens, A.; Clicq, D.; Fanigliulo, A.; Debrus, B.; Rudaz, S.; Guillarme, D.; Desmet, G. Predictive elution window shifting and stretching as a generic search strategy for automated method development for liquid chromatography. Anal. Chem. 2012, 84, 7823–7830. [Google Scholar] [CrossRef] [PubMed]
  6. Fasoula, S.; Nikitas, P.; Pappa-Louisi, A. Teaching simulation and computer-aided separation optimization in liquid chromatography by means of illustrative Microsoft Excel spreadsheets. J. Chem. Educ. 2017, 94, 1167–1173. [Google Scholar] [CrossRef]
  7. Canals, I.; Valkó, K.; Bosch, E.; Hill, A.P.; Rosés, M. Retention of ionisable compounds on HPLC. 8. Influence of mobile-phase pH change on the chromatographic retention of acids and bases during gradient elution. Anal. Chem. 2001, 73, 4937–4945. [Google Scholar] [CrossRef] [PubMed]
  8. Andrés, A.; Rosés, M.; Bosch, E. Gradient retention prediction of acid–base analytes in reversed phase liquid chromatography: A simplified approach for acetonitrile–water mobile phases. J. Chromatogr. A 2014, 1370, 129–134. [Google Scholar] [CrossRef] [PubMed]
  9. Christian, G.D.; Purdy, W.C. The residual current in orthophosphate medium. J. Electroanal. Chem. 1962, 3, 363–367. [Google Scholar] [CrossRef]
  10. Horvath, C.; Melander, W.; Molnar, I. Liquid chromatography of ionogenic substances with nonpolar stationary Phases. Anal. Chem. 1977, 49, 142–154. [Google Scholar] [CrossRef]
  11. Wiczling, P.; Kaliszan, R. pH gradient as a tool for the separation of ionizable analytes in reversed-phase high-performance chromatography. Anal. Chem. 2010, 82, 3692–3698. [Google Scholar] [CrossRef] [PubMed]
  12. Nikitas, P.; Pappa-Louisi, A.; Zisi, C. pH-gradient reversed-phase liquid Chromatography of ionogenic analytes revisited. Anal. Chem. 2012, 84, 6611–6618. [Google Scholar] [CrossRef] [PubMed]
  13. Fasoula, S.; Zisi, C.; Nikitas, P.; Pappa-Louisi, A. Retention prediction and separation optimization of ionizable analytes in reversed-phase liquid chromatography by organic modifier gradients in different eluent pHs. J. Chromatogr. A 2013, 1305, 131–138. [Google Scholar] [CrossRef] [PubMed]
  14. Schoenmakers, P.J.; Billiet, H.A.H.; de Galan, L. Description of solute retention over the full range of mobile phase compositions in reversed-phase liquid chromatography. J. Chromatogr. A 1983, 282, 107–121. [Google Scholar] [CrossRef]
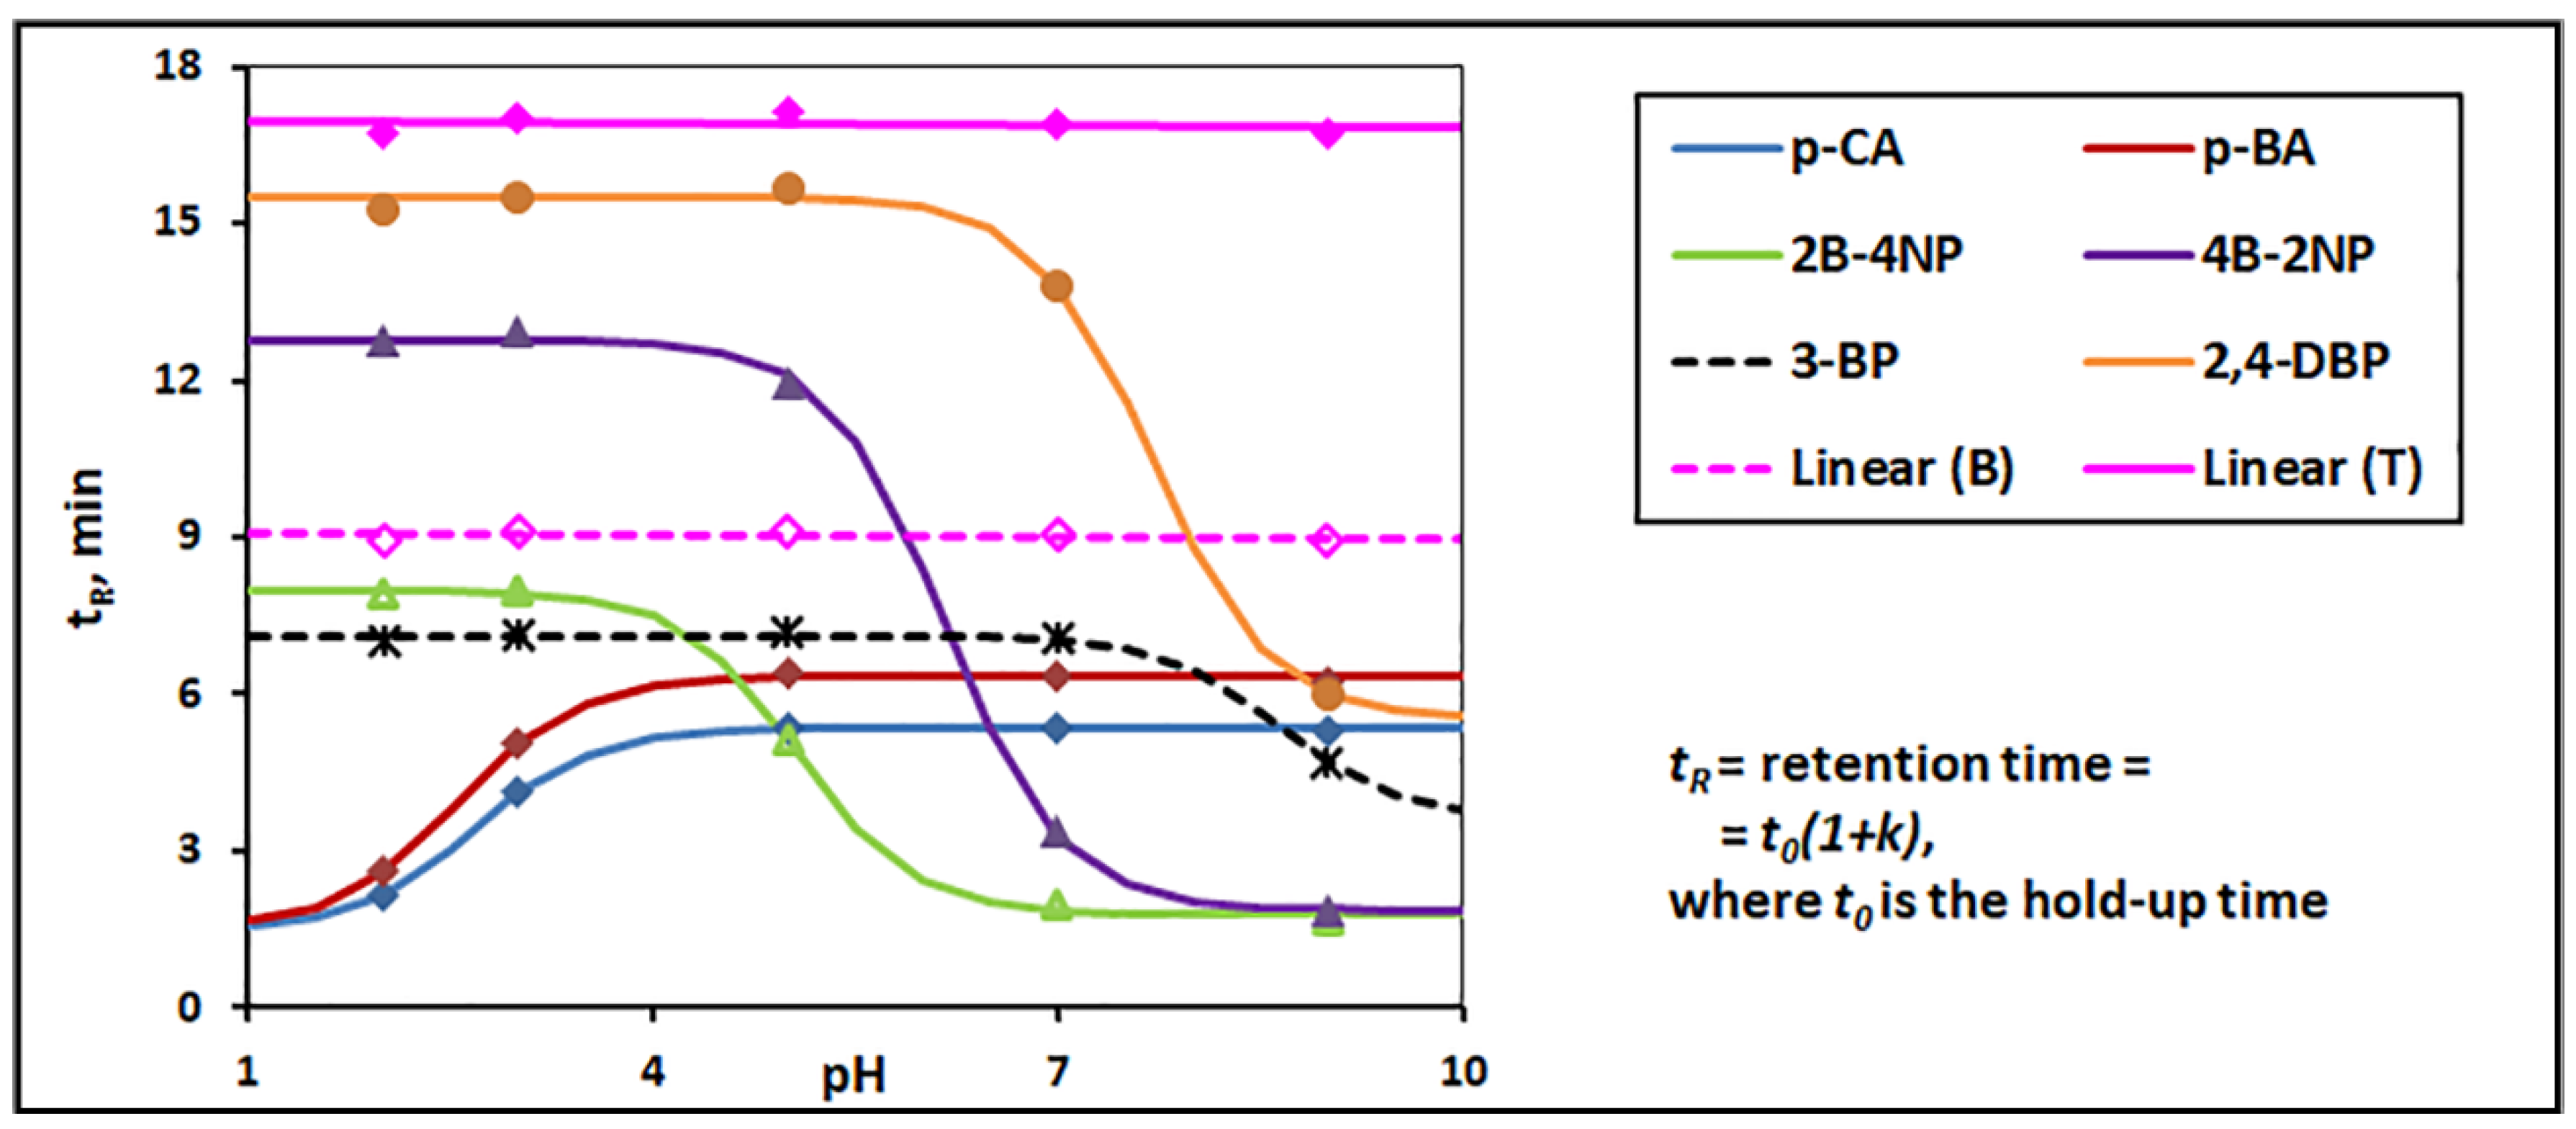
Figure 1. Variation of tR as a function of mobile phase pH for each of the examined solutes. Points are experimental data taken from Table S1 for isocratic runs performed in different eluent pHs with ϕACN = 0.3. Lines are obtained by fitting experimental data of ionized solutes to Equation (1).
Separations 05 00019 g001
Figure 2. Screenshot of the MS Excel supplementary spreadsheet ‘isocr. optim.’ used for isocratic separation optimization of solutes in eluent pH 3 modified with ACN. See the text for details.
Separations 05 00019 g002
Figure 3. Screenshot of the MS Excel supplementary spreadsheet ‘grad. optim.’ used for separation optimization under single linear gradient conditions of solutes in eluent pH 3 modified with ACN. See the text for details.
Separations 05 00019 g003
Figure 4. UV detected chromatograms of the mixture of 8 ionized and non-ionized solutes obtained on Kinetex 5 µm EVO column under optimal gradient conditions in different eluent pHs. The elution order of solutes is shown in the Figure. See Table 1 for details of optimal gradient conditions.
Separations 05 00019 g004
Figure 5. UV detected chromatograms of the mixture of 8 ionized and non-ionized solutes obtained on different columns under optimal gradient conditions found for eluent pH = 3 and Kinetex 5 µm EVO column. The elution order of solutes is shown in the Figure. See Table 1 for details of optimal gradient conditions.
Separations 05 00019 g005
Figure 6. Screenshot of the MS Excel spreadsheet ‘isocr. optim.’ used for isocratic separation optimization of solutes in eluent pH 3 modified with MeOH. See the text for details.
Separations 05 00019 g006
Figure 7. UV detected chromatograms of the mixture of eight ionized and non-ionized solutes obtained on Kinetex 5 µm EVO column under different isocratic conditions in eluent pH = 3 modified with MeOH. The elution order of solutes is shown in the Figure.
Separations 05 00019 g007
Table 1. Optimal conditions found for the separation of the mixture of solutes using an Excel spreadsheet-based optimization program.
pHOptimum Isocratic Conditions
in an Eluent Modified with ACN
Optimum Gradient Conditions for the Linear Variation of ϕACN from ϕ0 = 0.3 to ϕf = 0.5
ϕACNRstR(max), mintG, minRstR(max), min
20.3701.419.876.51.478.10
30.3651.4510.966.51.488.15
50.3651.3810.405.01.437.46
70.3701.4210.076.01.427.93