


Abstract
Secondary aluminum dross (SAD) from the aluminum industry is a hazardous residue that restricts sustainable aluminum production. Residual aluminum nitride (AlN) and insoluble fluorides after conventional pretreatment are major barriers to the safe utilization of SAD. In this study, a low-temperature intensified roasting–alkaline leaching process was developed to remove harmful elements by using reaction heat and waste heat to expose enveloped AlN and fluoride phases, form soluble sodium-bearing compounds, and intensify AlN oxidation. Without additives, roasting at 750 °C for 3 h converted 91.65% of AlN, leaving 1.37% AlN in the roasted SAD. With Na2O2 as an oxygen donor in situ, NaF as a mineralizer to reduce roasting temperature, and sodium-bearing species as reactants for soluble NaAlO2/Na2SiO3 formation, the AlN conversion increased up to 97.01% under 5% NaF and 2.5% Na2O2 at 750 °C for 3 h. Afterwards, higher temperature, longer duration, lower roasted SAD dosage, and higher caustic soda concentration all improved fluorine removal in the subsequent alkaline leaching. Under 100 g/L Na2O, 20 g/L roasted SAD, and 100 °C, fluorine and chlorine removal efficiencies reached 92.52% and 99.47%, respectively. The final high-alumina residue contained 74% Al2O3, mainly in the forms of α-Al2O3, NaAl11O17, and MgAl2O4, with only 0.19% F and 0.03% Cl, making it suitable for the preparation of various alumina-bearing materials and alumina production.
1. Introduction
Secondary aluminum dross (SAD), primarily derived from aluminum electrolysis, processing, and recycling [1,2,3], is classified as hazardous waste and constitutes a major impediment to the sustainable and green development of the aluminum industry [4,5,6,7]. The reactive aluminum-bearing species in SAD (e.g., Al, AlN, and Al4C3) readily generate flammable, explosive, and toxic gases (such as H2, NH3, and CH4) in aqueous solution and moist air [6,8,9]. Meanwhile, the soluble NaF and NaCl pose a severe risk of soil and groundwater contamination, and a large amount of insoluble fluorides also gives rise to environmental risk. Consequently, the critical challenge for the comprehensive and safe utilization of SAD lies in the economic removal of harmful elements.
Owing to the quick conversion of Al into alumina, many papers have focused on denitrification by converting the reactive AlN into alumina or aluminum hydroxide through pyrometallurgy and hydrometallurgy [3,5,8,10,11,12,13,14,15,16,17]. Previous denitrification studies largely concentrated on oxidative roasting and additive-assisted activation at high temperature, such as directly roasting at more than 1100 °C, which transformed AlN to α-Al2O3 without additives, while low temperature led to 93.8% transformation efficiency [18]. Meanwhile, additives (e.g., Na2CO3, CaO, Na3AlF6, NaF, cryolite) accelerated the conversion [1,19,20,21]. However, the enveloped corundum layer (25–45 nm) and the mutual enveloped AlN within the inert corundum/spinel/β-Al2O3 generally leave some residual AlN (1.5–2%) after roasting, posing significant environmental risk. Furthermore, pyrometallurgical treatment often generates some NO under temperature/particle-size heterogeneity [12], even though 99.7% of nitrogen is transformed into N2 at 1400 °C [13]. Meanwhile, the wet denitrification process has often been reported in water, alkaline and acidic solution without the safe utilization of H2 from Al and Si [22]. As about 1~3% of AlN remains in SAD after water washing in practice, a dilute solution with less than 20 g/L NaOH is generally defined as a catalyst to promote the hydrolysis of AlN in SAD [11,23]. Although high AlN removal efficiency was achieved, the uncontrolled reaction accompanied by a sustainable exothermal reaction led to danger due to uncontrolled gases. The residual AlN and the irritative NH3 remaining in the residue notably limit the application of SAD [23]. Therefore, the efficient transformation of enveloped AlN is a key problem.
In contrast to the considerable research on denitrification, the removal of fluorine and chlorine from SAD has often been neglected [7,15,24]. High-temperature pyrometallurgical treatment often volatilizes NaCl, whereas fluorides are difficult to volatilize because of the stability of CaF2, Na3AlF6 and AlF3. Furthermore, formation of calcium-bearing compounds was believed to efficiently solidify fluorine by adding CaO, Ca(OH)2 and CaCO3. In contrast, NaCl is readily removed in hydrometallurgy while fluorine removal is significantly constrained (typically <50%) because of the insoluble CaF2, MgF2, Na3AlF6 and AlF3 [9,23,25,26]. Water leaching/multi-stage process [27], sodium aluminate solution [28,29], and concentrated NaOH solution [25] have been adopted. Tang et al. [30,31] reported that sodium aluminate solutions achieved approximately 55% removal efficiency of fluorine in the concentrated sodium aluminate solution (Bayer liquor). Overall, depending on the occurring forms of fluorides, the halide problem generally appears as “Cl easy, F hard” in traditional hydrometallurgical processes. To efficiently remove fluorides, the combined pyro–hydro processes (e.g., water leaching plus roasting) and alternative strategies have been proposed. F and Cl removal efficiency of 87.68% and 99.02% via water leaching at 60 °C following 10 min of ball milling were both achieved [32]. Meanwhile, 97.5% F removal efficiency (reducing residual F content to 0.2%) was achieved by combining water leaching at 80 °C with subsequent roasting at more than 950 °C. The low removal efficiency of fluorides is mainly attributed to the insoluble fluorides and enveloped fluorides encapsulated by the inert alumina [33,34]. Therefore, destroying the inert layer of alumina enveloped on fluorides and AlN is a key process to efficiently remove AlN and fluorides in safe utilization of SAD. An intensified roasting at low-temperature alkaline leaching is then provided to efficiently remove harmful elements through utilizing the waste heat and reaction heat in roasting, dissolving the encapsulating layer during leaching.
Herein, this study first investigates the effects of additives on the conversion of AlN at 750 °C. The influences of leaching temperature, duration, liquid-to-solid ratio, and alkali concentration on fluorine removal are then systematically examined. The phase distribution of the leaching residues is also analyzed to elucidate the underlying mechanisms. A high-alumina residue characterized by low fluorine and zero chlorine content is successfully obtained. The results provide a novel approach to efficiently remove harmful elements in SAD, ultimately facilitating its safe and comprehensive utilization.
2. Experimental
2.1. Material
2.1.1. Secondary Aluminum Dross
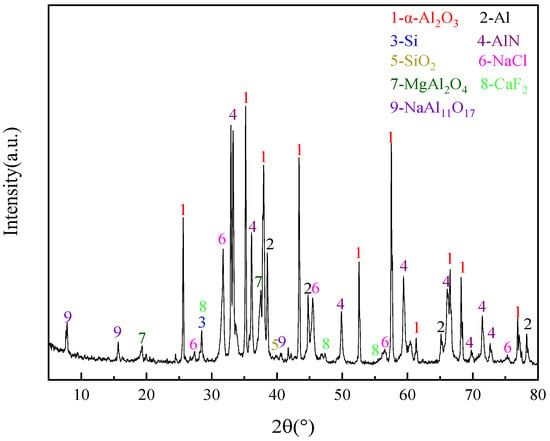
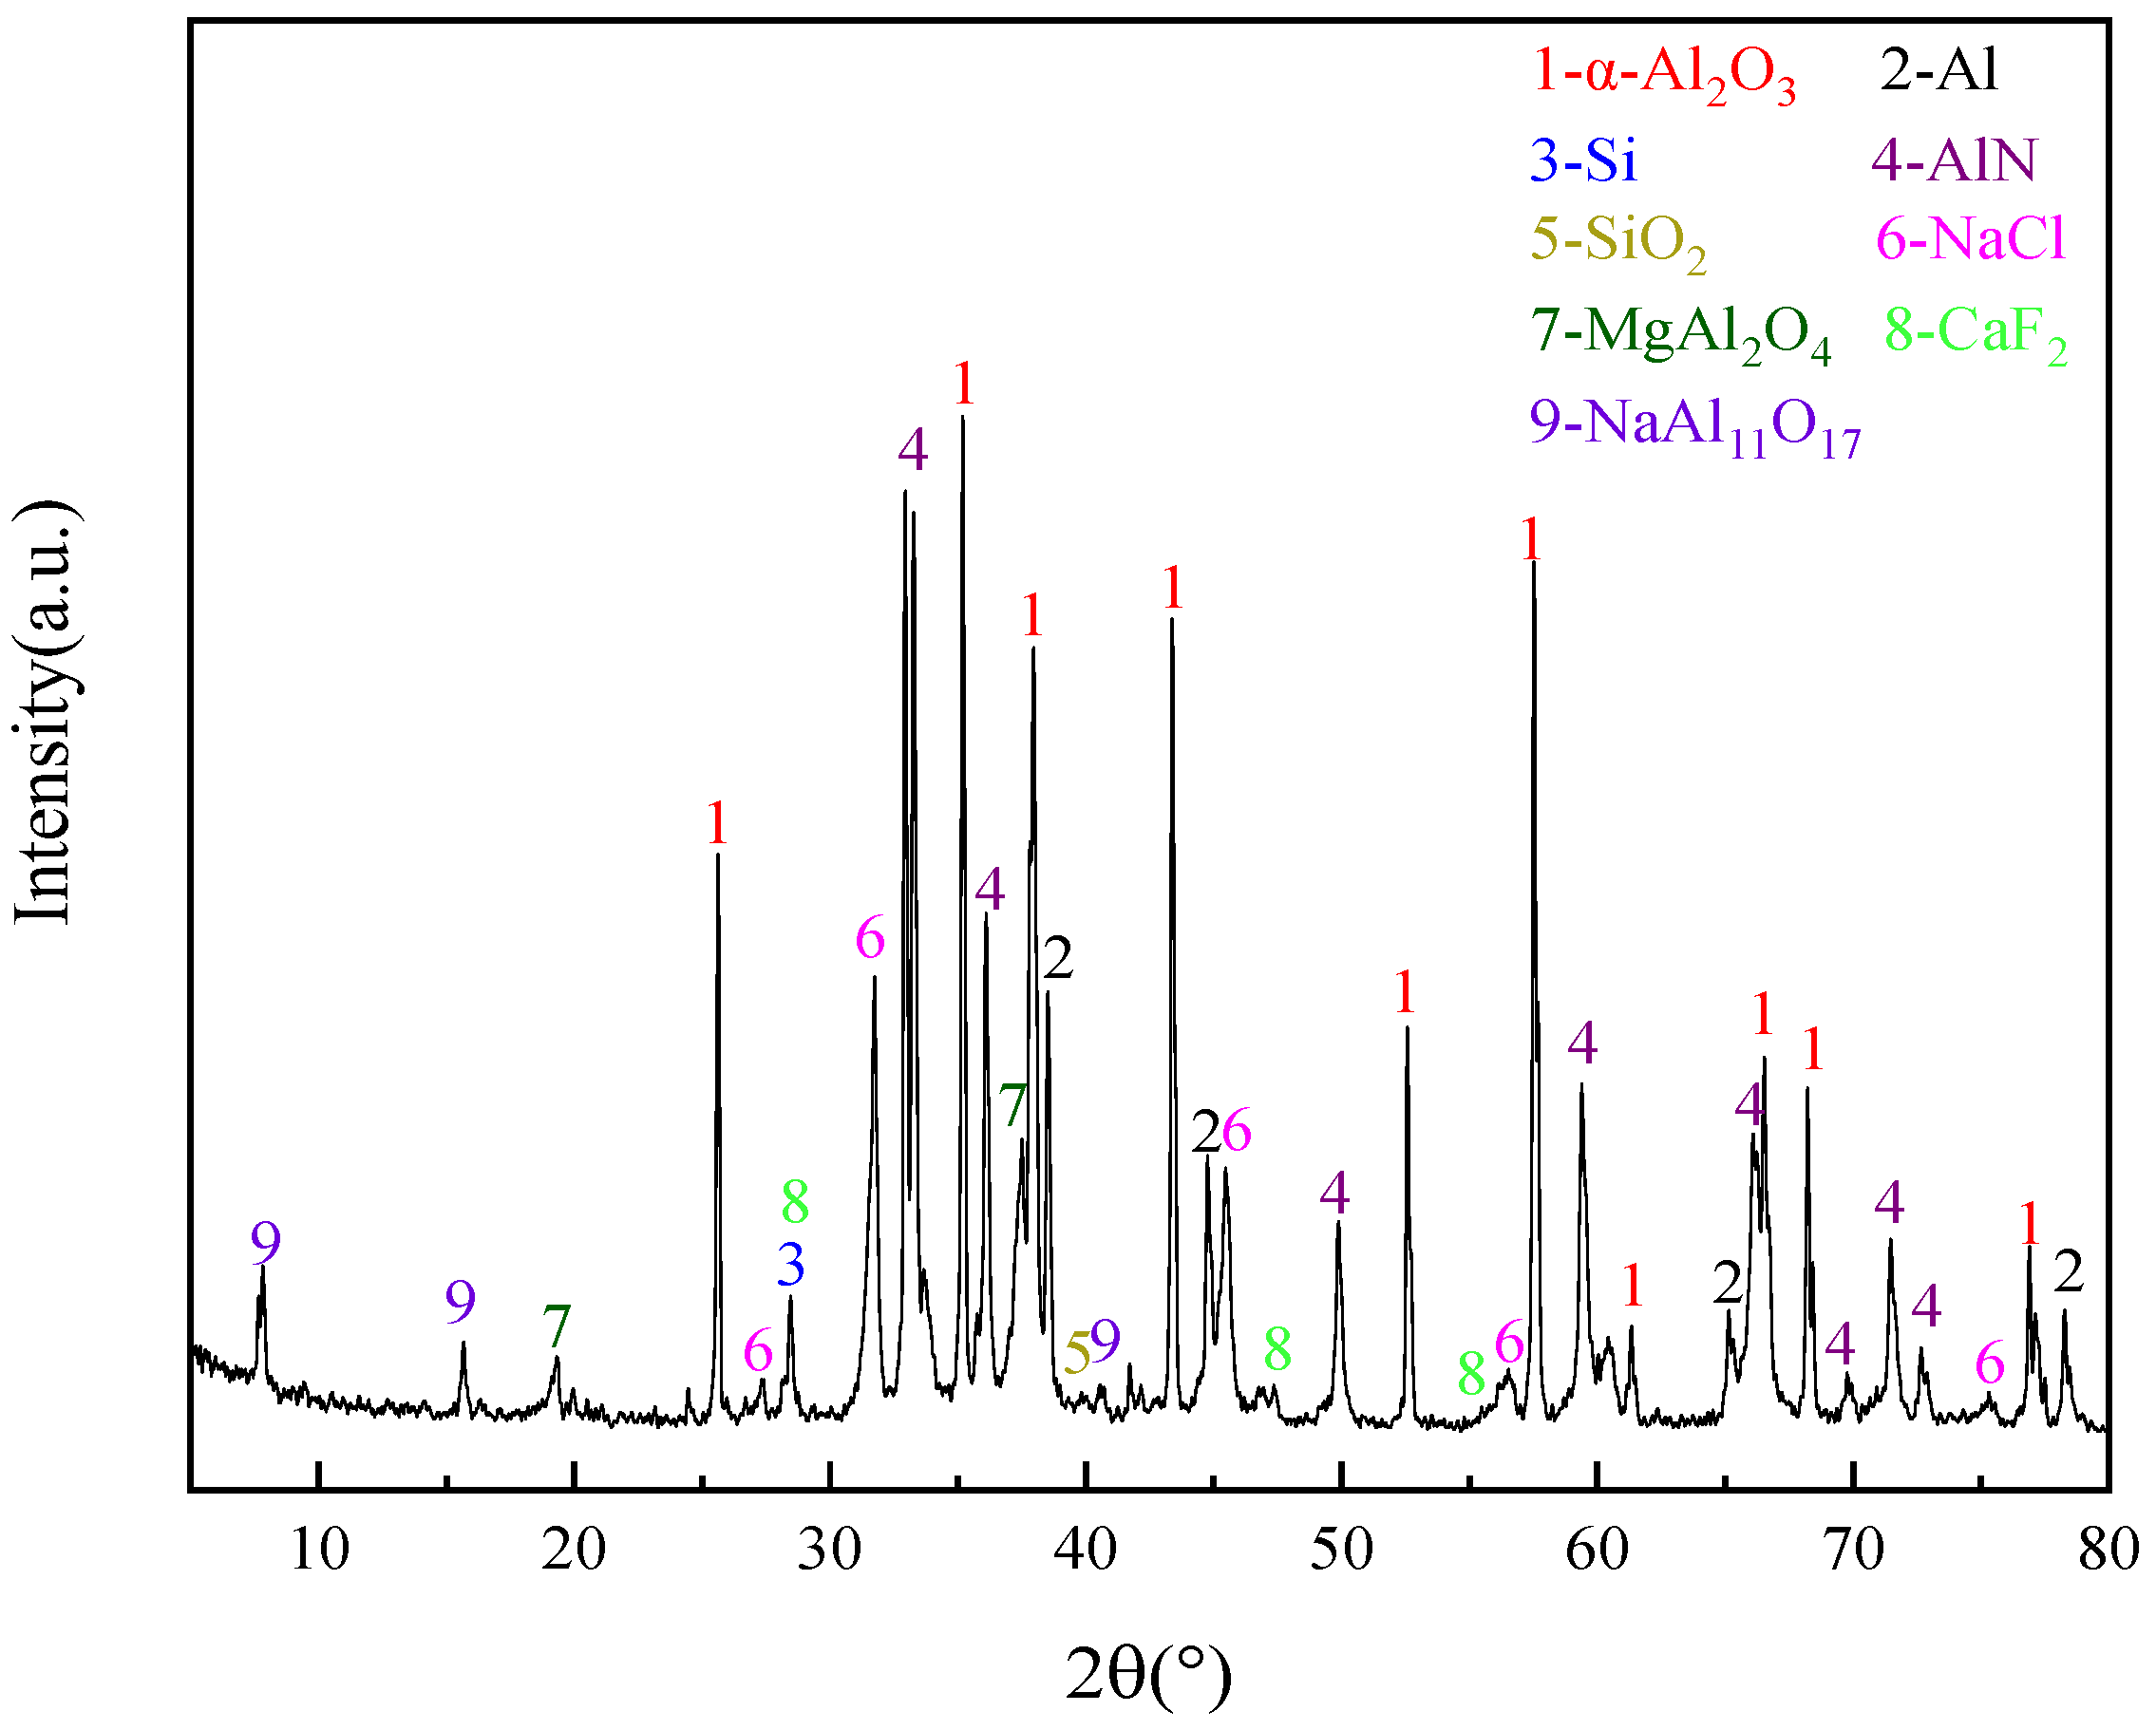
SAD was sourced from industrial aluminum electrolysis and processing. As shown in Figure 1, the sample contained inert compounds, reactive substances, and soluble salts. The reactive aluminum-bearing phases consisted predominantly of metallic Al and AlN, whereas the inert aluminum-bearing compounds included MgAl2O4 (magnesium–aluminum spinel), α-Al2O3 (corundum), and NaAl11O17 (β-Al2O3). Fluorine and chlorine were mainly present as CaF2 and NaCl, respectively. Minor Si and SiO2 were also detected. Semi-quantitative XRD analysis performed using MDI Jade 9 (Table 1) indicated that α-Al2O3 (57.6 wt%) and AlN (16.4 wt%) were the major crystalline phases.
Figure 1.
XRD pattern of SAD.
Table 1.
Semi-quantitative XRD phase analysis results of SAD (wt%).
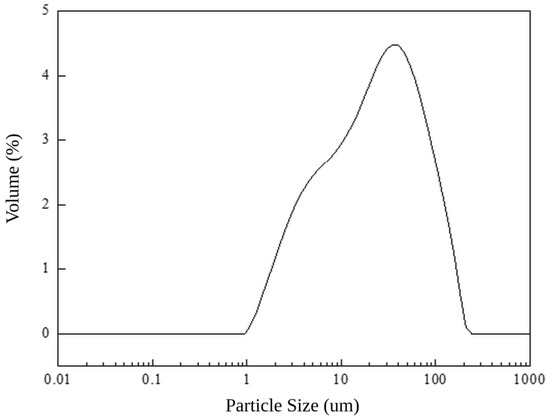
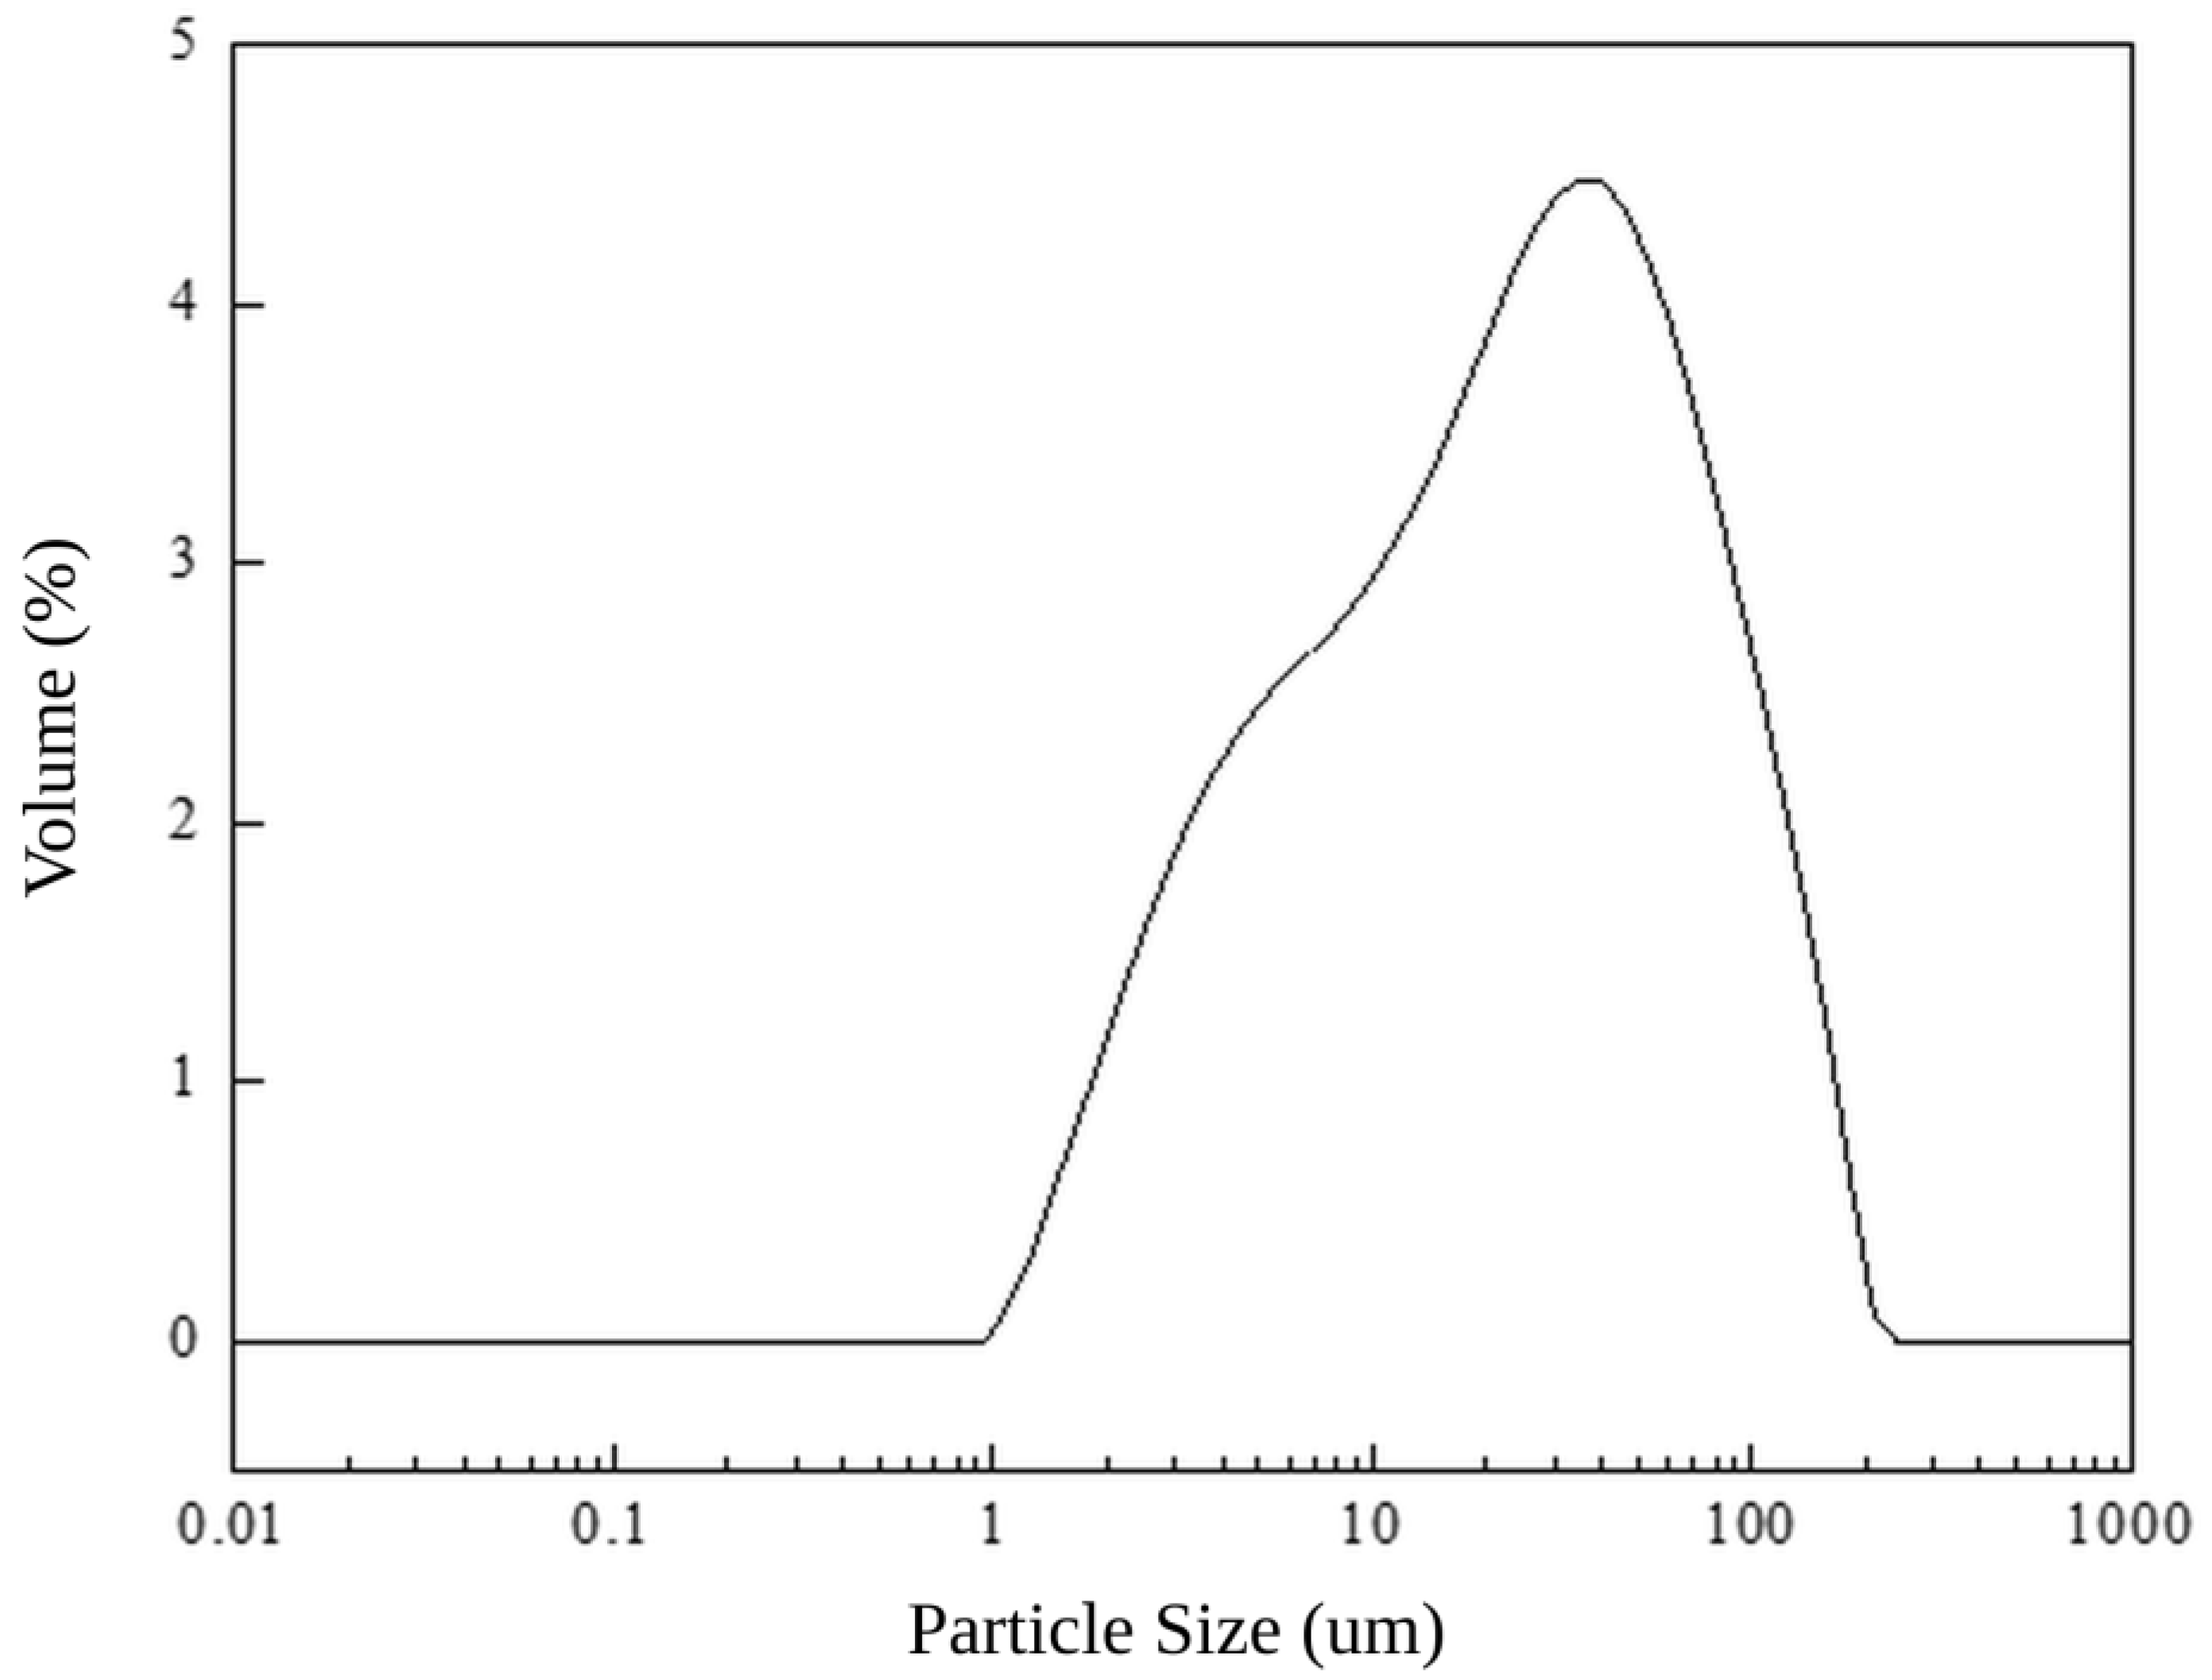
The particle size distribution (PSD) curve of SAD is shown in Table 2 and Figure 2. SAD was characterized by a wide and heterogeneous size distribution in Figure 2. The predominant fraction occurred between 1 and 100 μm, yielding a median diameter (d50) of 21.0 μm.
Table 2.
Particle size distribution of SAD.
Figure 2.
Particle size distribution (PSD) of SAD.
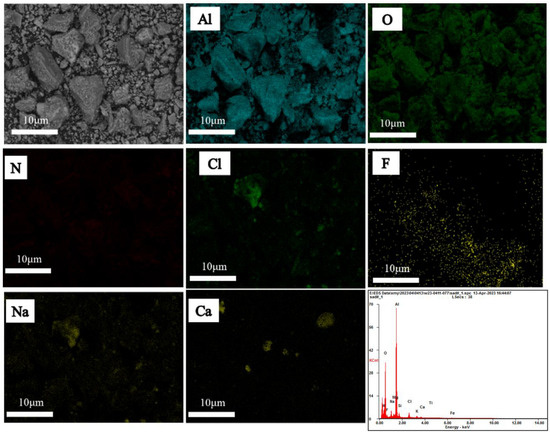
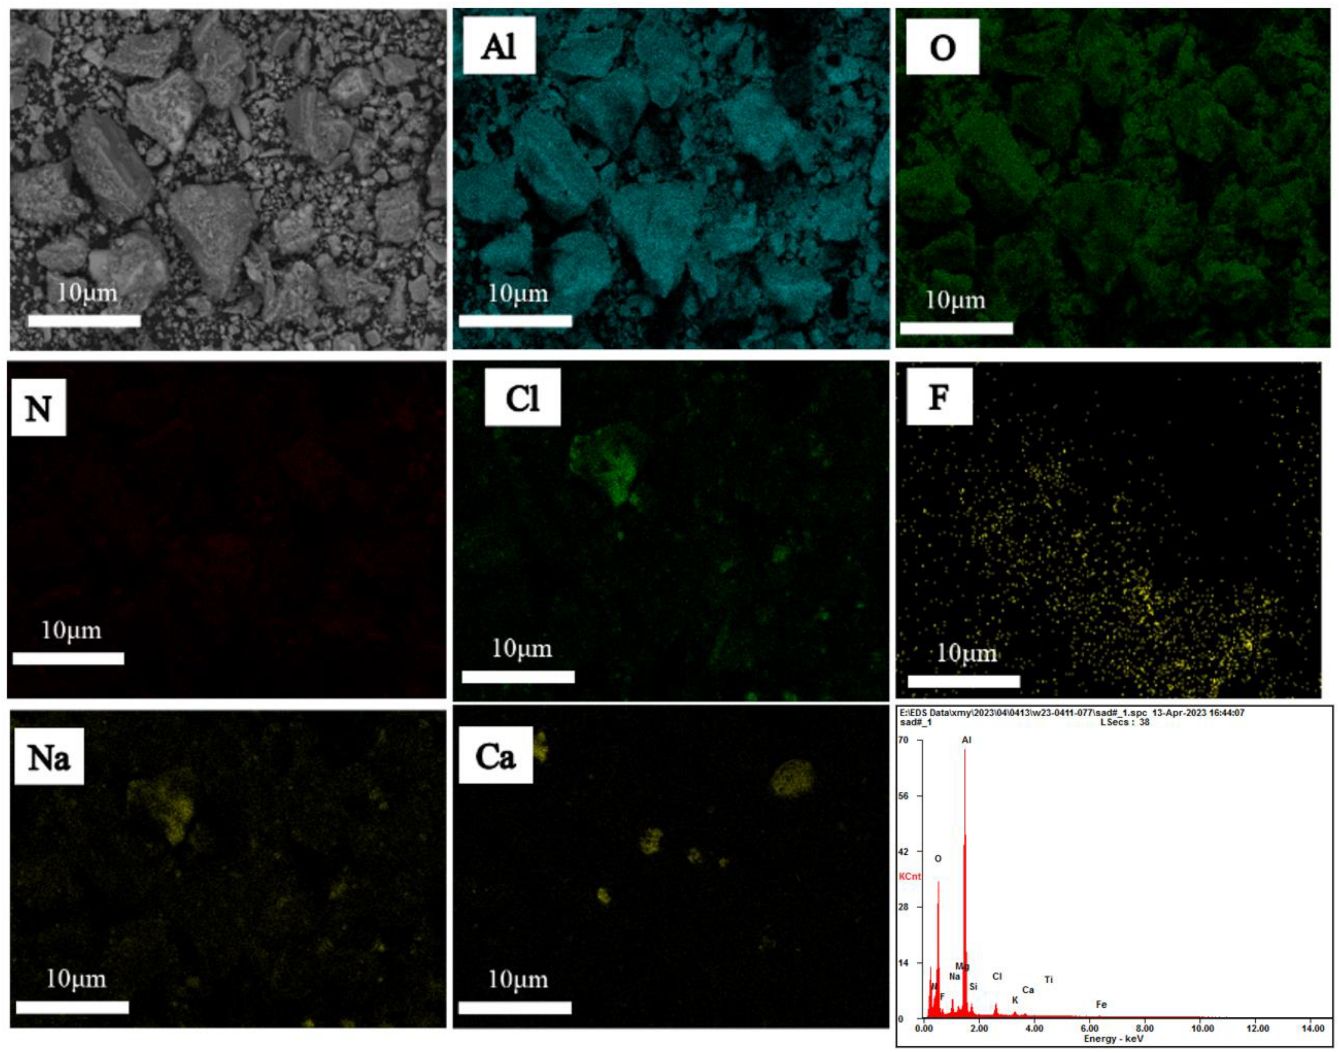
The SEM images and EDS maps of the SAD are shown in Figure 3. Alumina (Al2O3), aluminum nitride (AlN), and metallic aluminum (Al) were intergrown and enveloped within one another. Specifically, NaCl existed as large discrete particles, while sodium (calcium, magnesium) fluorides were dispersed within the aluminum-bearing compounds. The distribution of aluminum and oxygen was highly uniform and dense.
Figure 3.
SEM image and EDS mapping of SAD.
In addition, aluminum hydroxide and sodium hydroxide were used to prepare sodium aluminate solution according to the composition of Bayer liquor. The spent liquor had a high molar ratio (αk) of caustic soda (Na2O) to alumina (Al2O3) in solution.
2.1.2. Experiment Procedure
For each roasting test, 4.00 g of dried SAD was thoroughly mixed with the required additives for 4 h. Additive dosages were calculated as mass percentages relative to the dry SAD mass as Figure 4 shown. For example, 5% NaF and 2.5% Na2O2 corresponded to 0.200 g NaF and 0.100 g Na2O2 for 4.00 g of SAD. The mixture was placed in a 100 mL corundum crucible, introduced into a muffle furnace, and roasted at the desired temperature for the specified duration under air without additional atmosphere control. After furnace cooling, the clinker was weighed and transferred into 200 mL of sodium aluminate solution for dechlorination and defluorination. Leaching was conducted in a 250 mL thermostatic glass reactor equipped with a reflux condenser and a mechanical stirrer at 400 rpm. The reactor was covered during leaching to minimize evaporation and CO2 absorption, and the alkaline filtrate environment was controlled by the initial Na2O concentration and αk (molar ratio of Na2O to Al2O3) of the sodium aluminate solution. After leaching, the slurry was vacuum filtered. The filter cake was washed with boiling water and dried at 105 °C for 2 h, and the filtrate was sealed immediately for the analysis of F and Cl.
Figure 4.
Schematic diagram of the experimental procedure.
2.1.3. Characterizations and Methods
X-ray diffraction (XRD) patterns were obtained using a Rigaku TTR-III diffractometer (Rigaku Corporation, Tokyo, Japan)with Cu Kα radiation at a scanning rate of 10° min−1; the tube voltage and current were 40 kV and 250 mA, respectively. XRD phase identification and semi-quantitative analysis were conducted using MDI Jade 9. The morphology of SAD, roasted products, and residues was characterized by scanning electron microscopy (SEM; JSM-6360LV, JEOL, Tokyo, Japan) at an accelerating voltage of 20 kV. Particle size distribution (PSD) was measured using a laser particle analyzer (MS 2000, Malvern Instruments, Malvern, UK) after sample was dispersed in water with 90 W ultrasonic wave.
Fluorine and chlorine concentrations in the filtrates were determined by ion chromatography after appropriate dilution and calibration with fluoride and chloride standards. Before analysis, the filtrates were filtered through 0.22 μm membranes and diluted with pure water to ensure that the analyte concentrations were within the calibration range. Duplicate analytical determinations were performed for each filtrate sample to reduce analytical fluctuation. Selected residue compositions were verified by chemical analysis/ICP-based elemental analysis after digestion. The Na2O and Al2O3 concentrations of sodium aluminate solutions were determined by titration. Na2O and Al2O3 concentration of sodium aluminate solution was determined by titration.
AlN content in the raw and roasted SAD samples was calculated by NH3 volume in the leaching process. The NH3 volume was then determined from the (NH4)2SO4–H2SO4 solution using an NH3 gas-sensing electrode (PNH3–1, Leici Instrument Co., Ltd., Shanghai, China) [30]. To account for the mass change during roasting, the AlN conversion efficiency was calculated based on both the sample mass and the AlN mass fraction, according to Equation:
where wAlN,0 and wAlN,t are the AlN contents of the raw SAD and the roasted SAD after roasting for t hours, respectively.
F (or Cl) removal efficiency was calculated on basis of equation, The F (or Cl) removal efficiency (ηF or ηCl) was calculated from the dissolved amount in the leachate relative to the initial element content in SAD.
where C1 and V1 are concentration (g/L) of fluorine or chlorine in a V volume (mL), respectively. α represents mass percent in SAD, and M is mass of SAD.
The main quantitative trends are reported as average values from duplicate analytical determinations. The duplicate analyses were used to reduce analytical fluctuation, while broader process uncertainty caused by feed heterogeneity and scale-up operation will be further evaluated in pilot-scale experiments [6,8,9,15,16,17,35].
3. Results and Discussions
3.1. Transformation of AlN and Al in SAD During Roasting at Low Temperature
To inhibit volatilization of halides and evaluate the chemical transformation of the reactive species, Al and AlN reactions during the roasting process at low temperature were carried out. Meanwhile, the effect of additives on AlN transformation was carefully discussed.
3.1.1. Effect of Additives on Al and AlN Reactions in Thermodynamics During Roasting
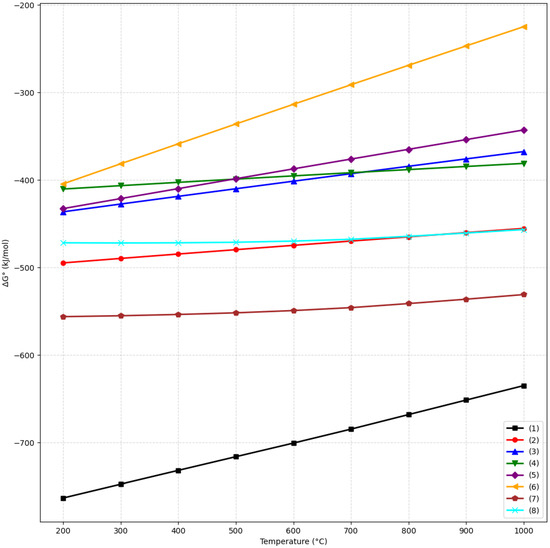
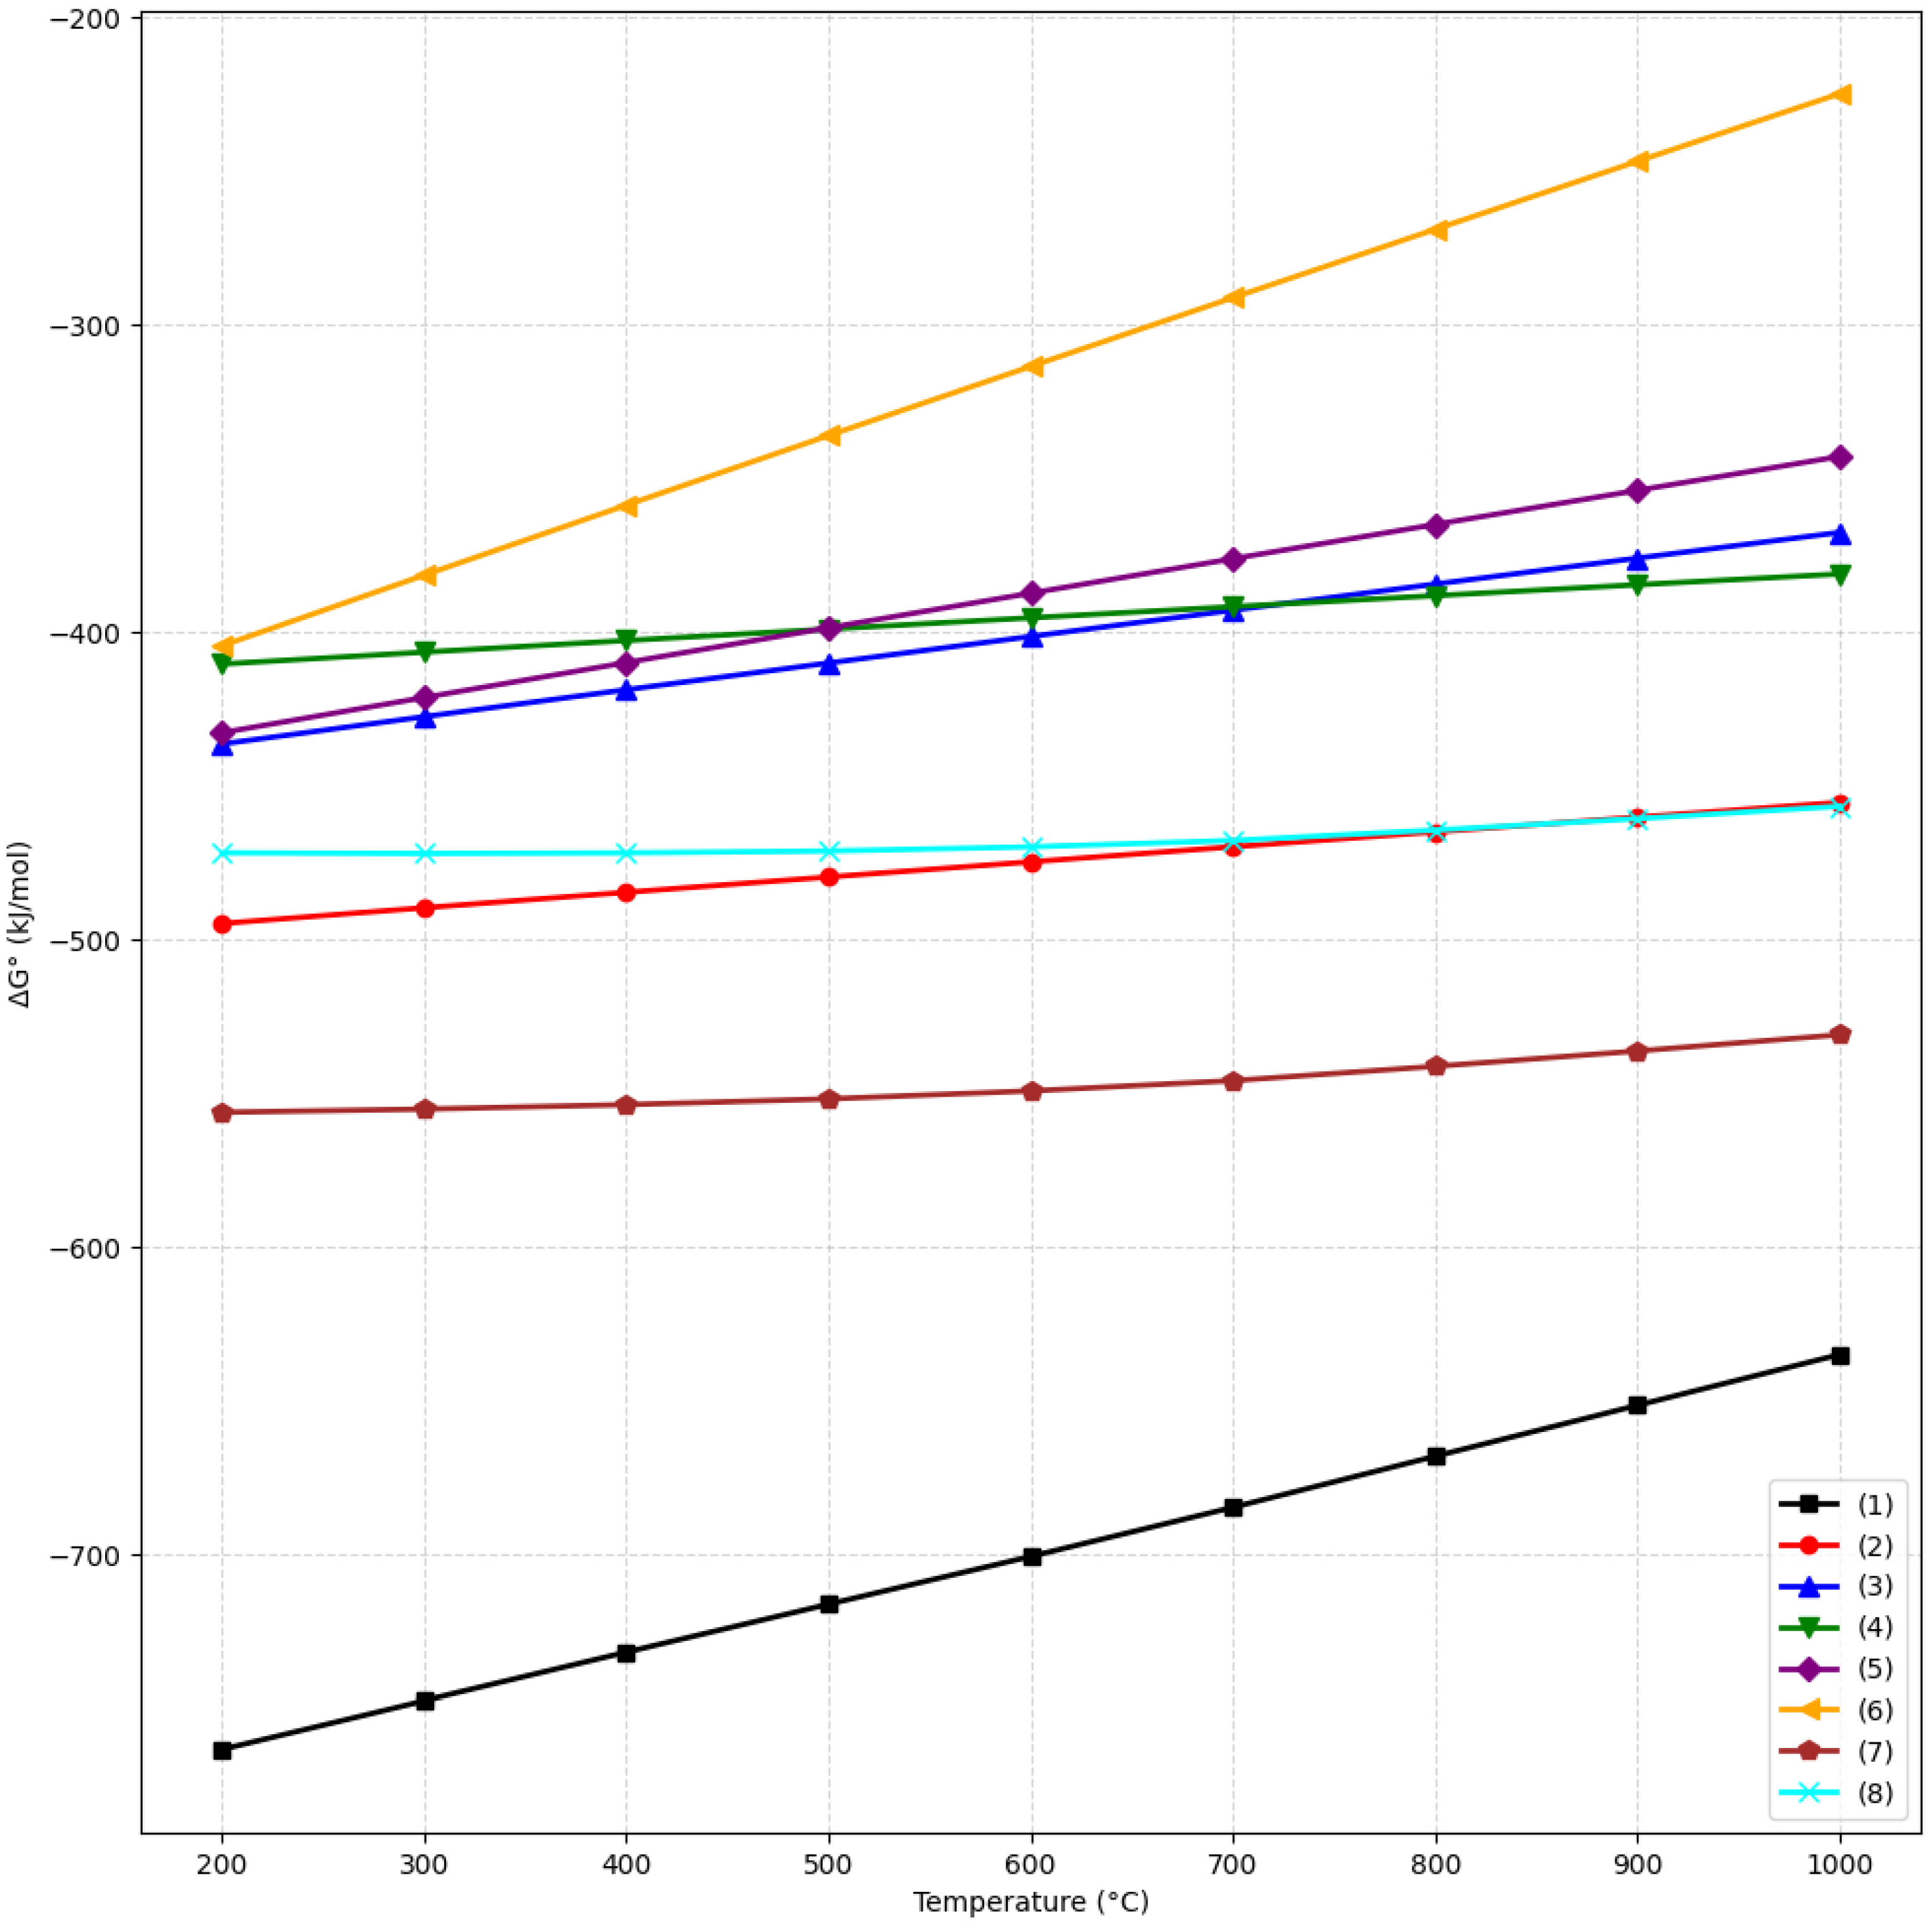
Both Al and AlN can be converted into alumina spontaneously in air through the reactions listed in Table 3. The standard reaction Gibbs free energy (ΔGrθ) for each reaction was calculated using HSC Chemistry 6.0, and the corresponding temperature-dependent curves were plotted using OriginPro (2025 10.2). The calculated ΔGrθ values at 750 °C are also listed in Table 3 to provide a direct quantitative comparison with Figure 5. The strongly negative ΔGrθ for Al oxidation and the negative ΔGrθ value for AlN oxidation (Equations (2)–(6)) indicate the thermodynamic feasibility of these transformations. Among the possible gaseous products, N2 is expected to be favored, although nitrogen oxides (NO, NO2, N2O, and N2O5) are also thermodynamically possible under specific oxygen potentials.
Table 3.
Possible chemical reactions of Al and AlN during roasting.
Figure 5.
Relationship between reaction Gibbs free energy change (ΔGθ) and temperature for Reactions (1)–(8).
The thermodynamic results also indicate that the additive-induced reactions of Al and AlN are spontaneous, as evidenced by the negative ΔGrθ values. In particular, the reaction between AlN and Na2O2 (Equation (7)) has a more negative ΔGrθ than the conventional oxidation pathways in Equations (2)–(4), indicating a stronger thermodynamic driving force for NaAlO2 formation. Equation (8) is also thermodynamically spontaneous. These results support the use of Na2O2-NaF additives to promote the conversion of nitrogen-bearing phases into Al2O3 and NaAlO2 at low temperature.
3.1.2. SAD Traditionally Roasted in the Absence of Additives
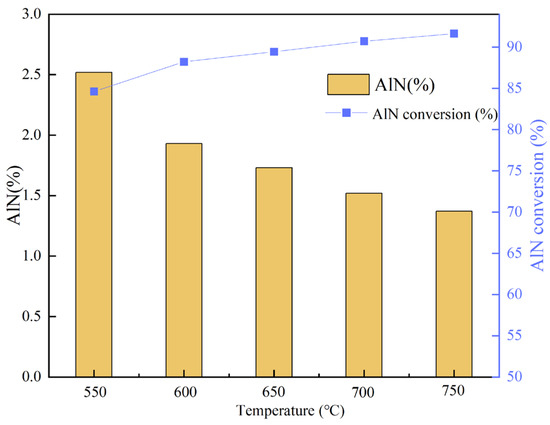
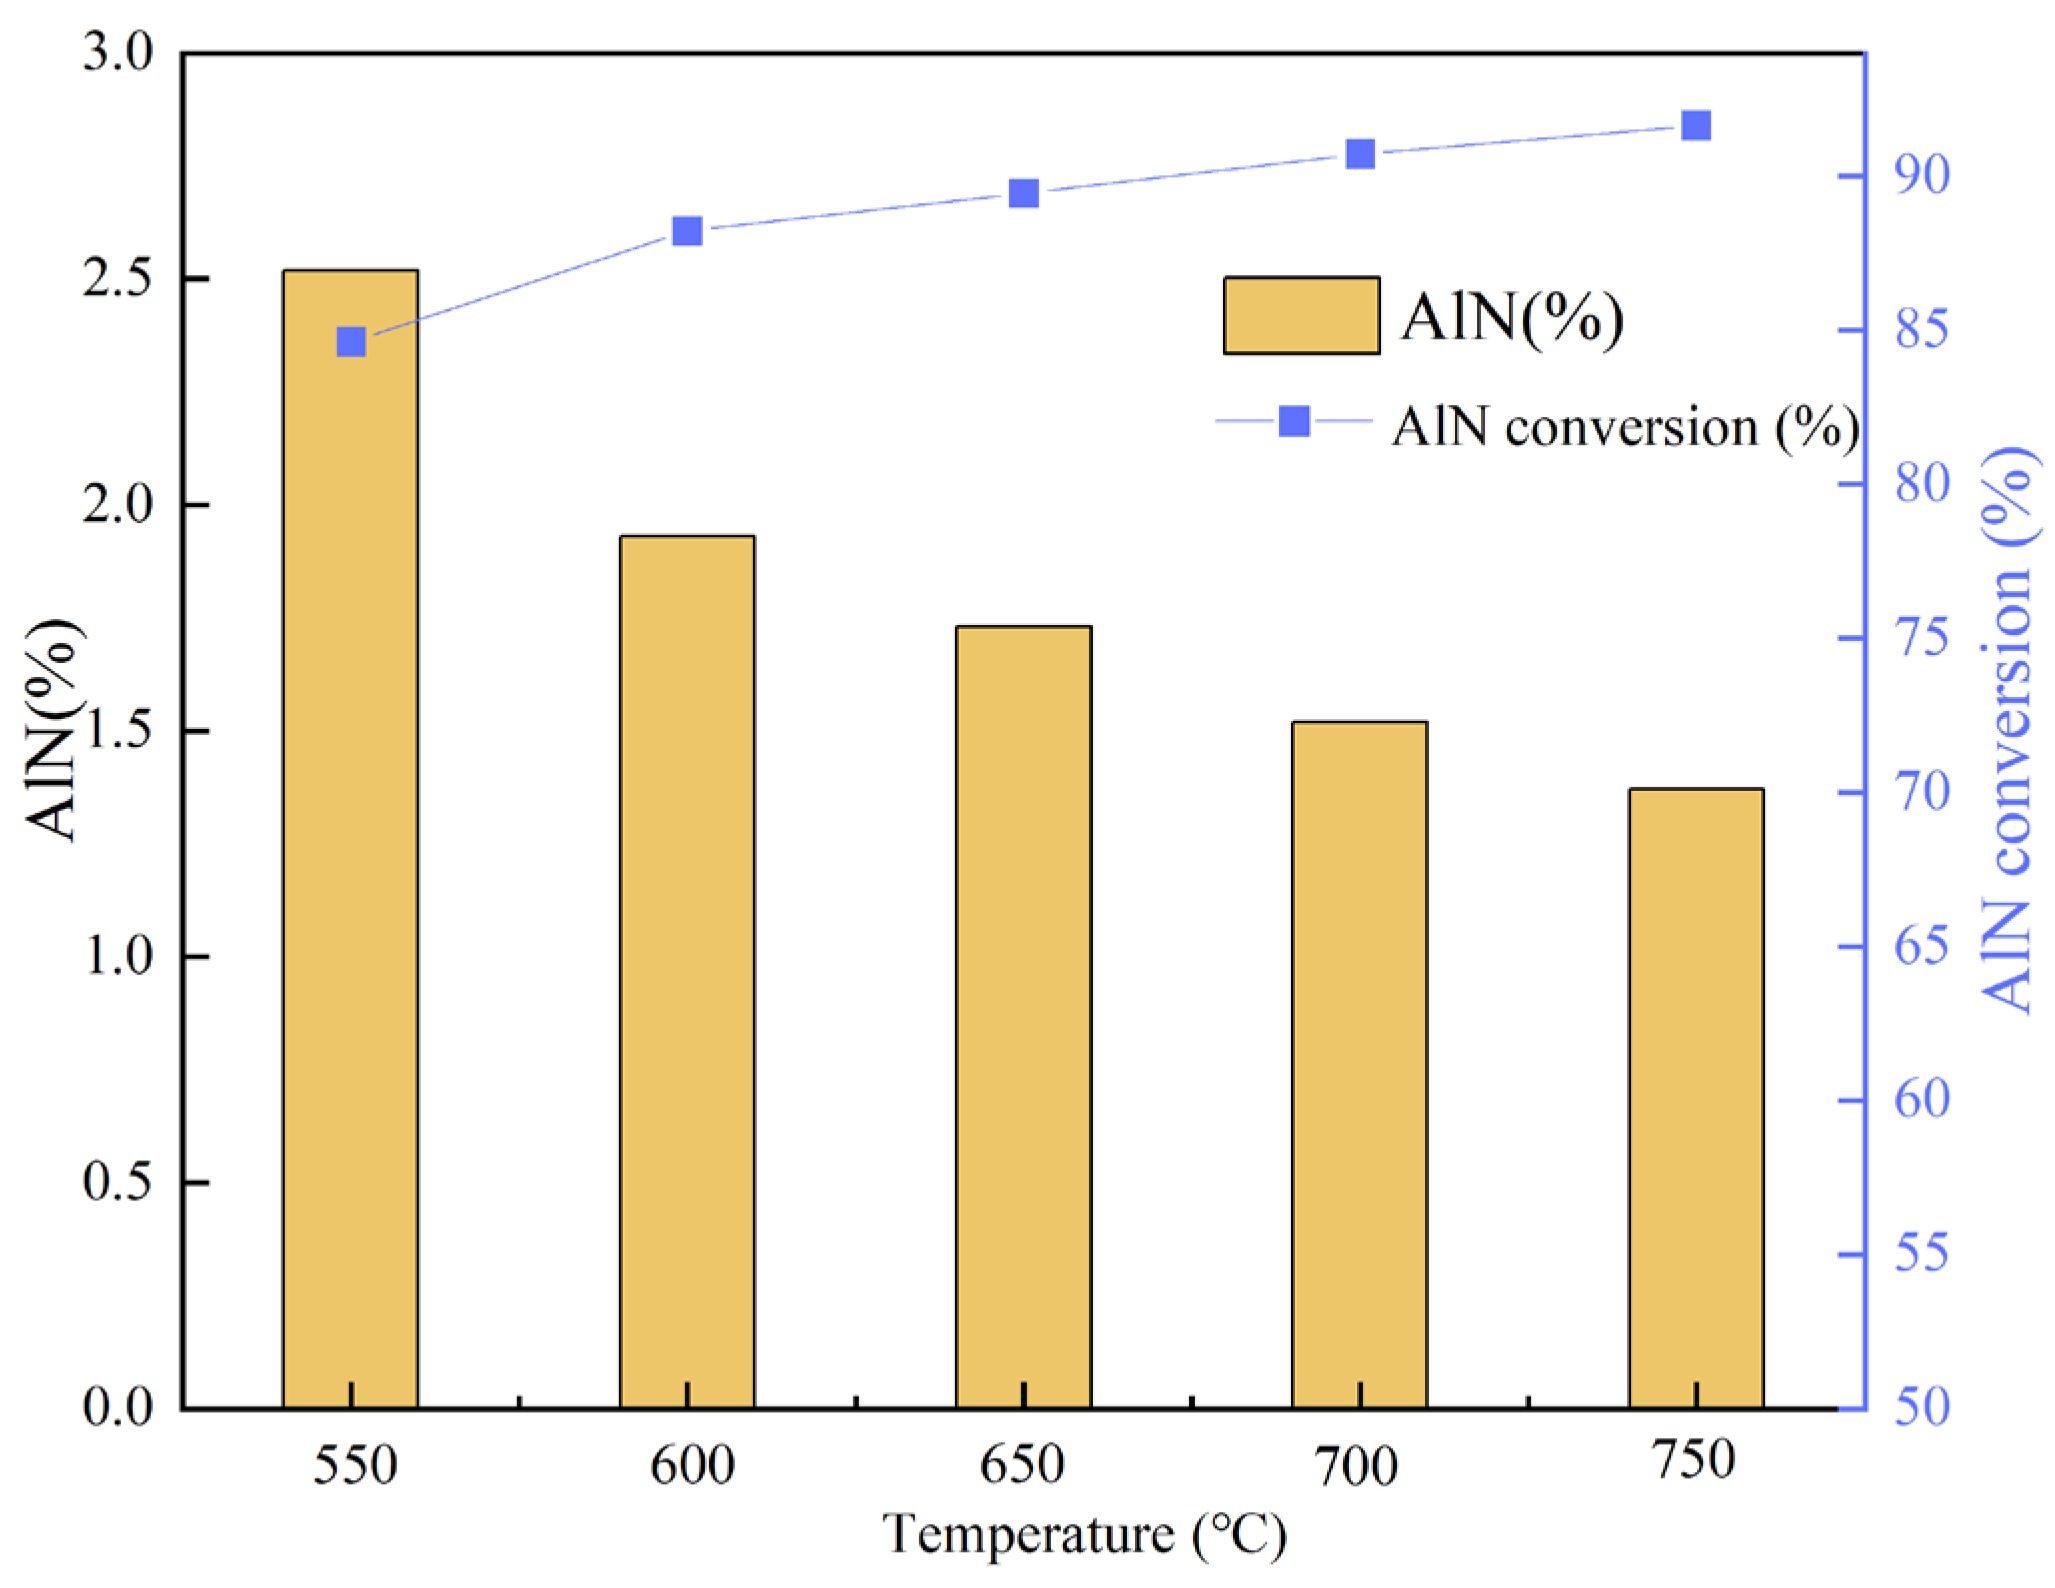
SAD was roasted directly at 550 °C, 600 °C, 650 °C, 700 °C, and 750 °C for 3 h, as shown in Figure 6. Elevating roasting temperature remarkably reduced AlN content in SAD. AlN conversion efficiency was 84.63% at 550 °C, while elevating temperature raised conversion efficiency. The conversion efficiency reached its maximum of 91.65% with 1.37% AlN remaining at 750 °C. These results indicate that the complete transformation of AlN is extremely difficult through direct roasting alone [11] when volatilization of chloride and fluoride are inhibited at low temperature.
Figure 6.
Effect of roasting temperature on the AlN conversion in SAD. Experimental conditions: t = 3 h.
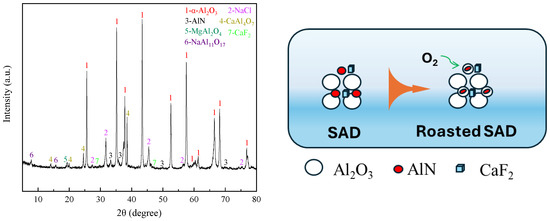
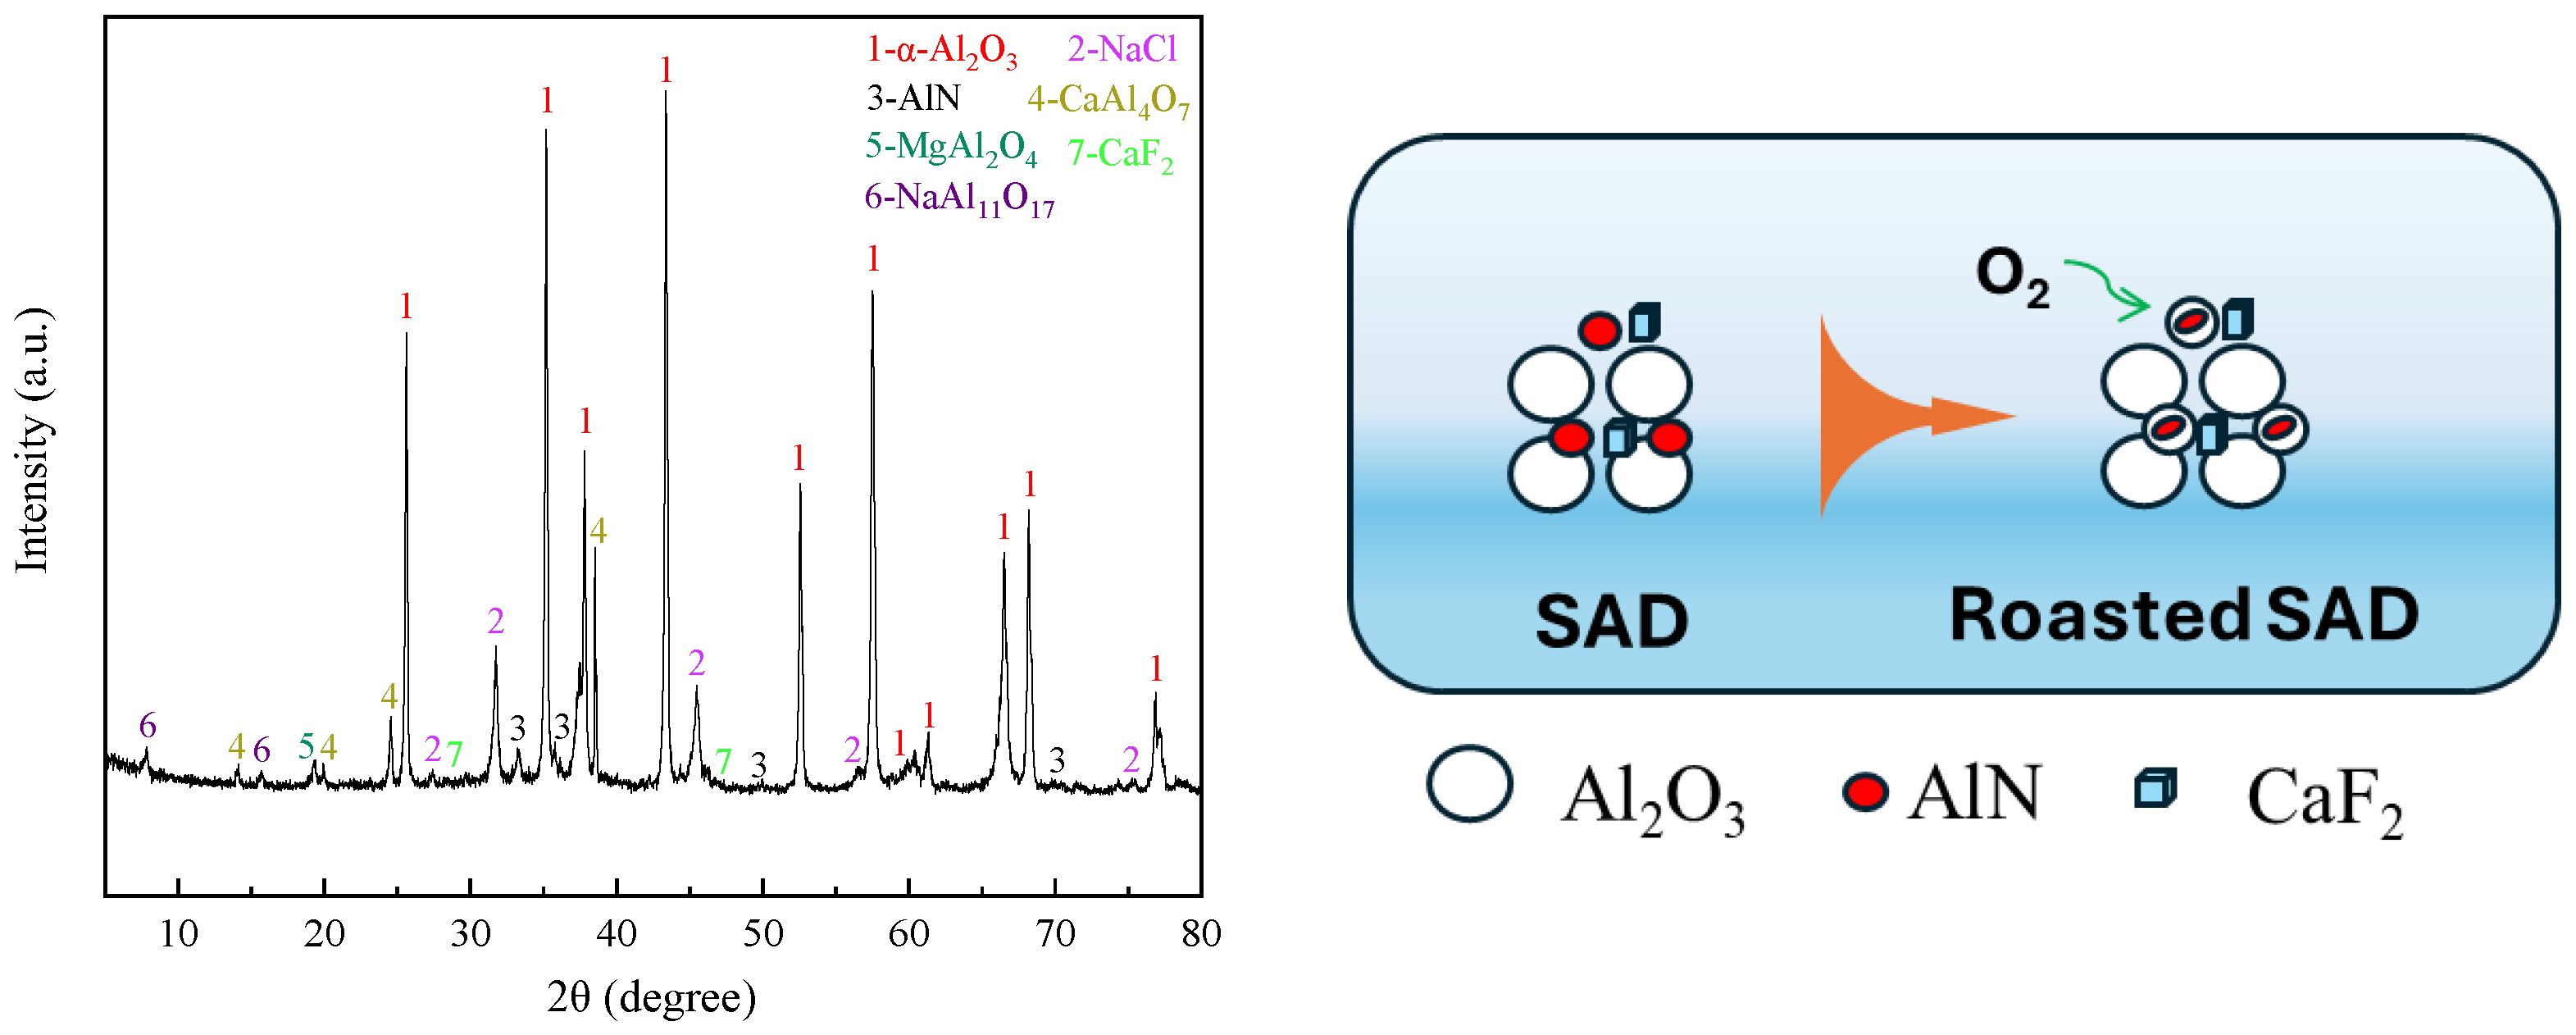
XRD patterns of roasted SAD are shown in Figure 7. After roasting at 750 °C for 3 h, the good characteristic peaks were assigned to α-Al2O3, while the peaks for Al and Si were all disappeared, proving complete transformation of Al and Si during roasting. Meanwhile, the intensity of AlN peaks decreased remarkably, except for MgAl2O4, NaAl11O17, and CaF2. These observations confirm that a large portion of the reactive species are oxidized during roasting. Because the reactive AlN were enveloped by the fresh alumina (corundum), O2 from air has extremely difficulty reacting with AlN through diffusion; some AlN, thereby, always remained in the roasted SAD, as shown in Figure 7. Even though temperature was elevated up to 1200 °C, more than 1% AlN remained in SAD in practice. Furthermore, the distinct peaks of NaCl and CaF2 in the roasted SAD suggest that the volatilization of NaCl is difficult at 750 °C.
Figure 7.
XRD pattern of SAD after direct roasting at 750 °C for 3 h (left) and schematic diagram of AlN remaining in the roasted SAD (right).
3.2. Enhanced AlN Conversion via Intensified Roasting
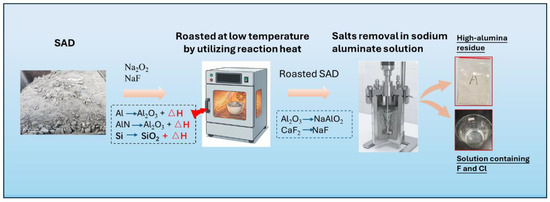
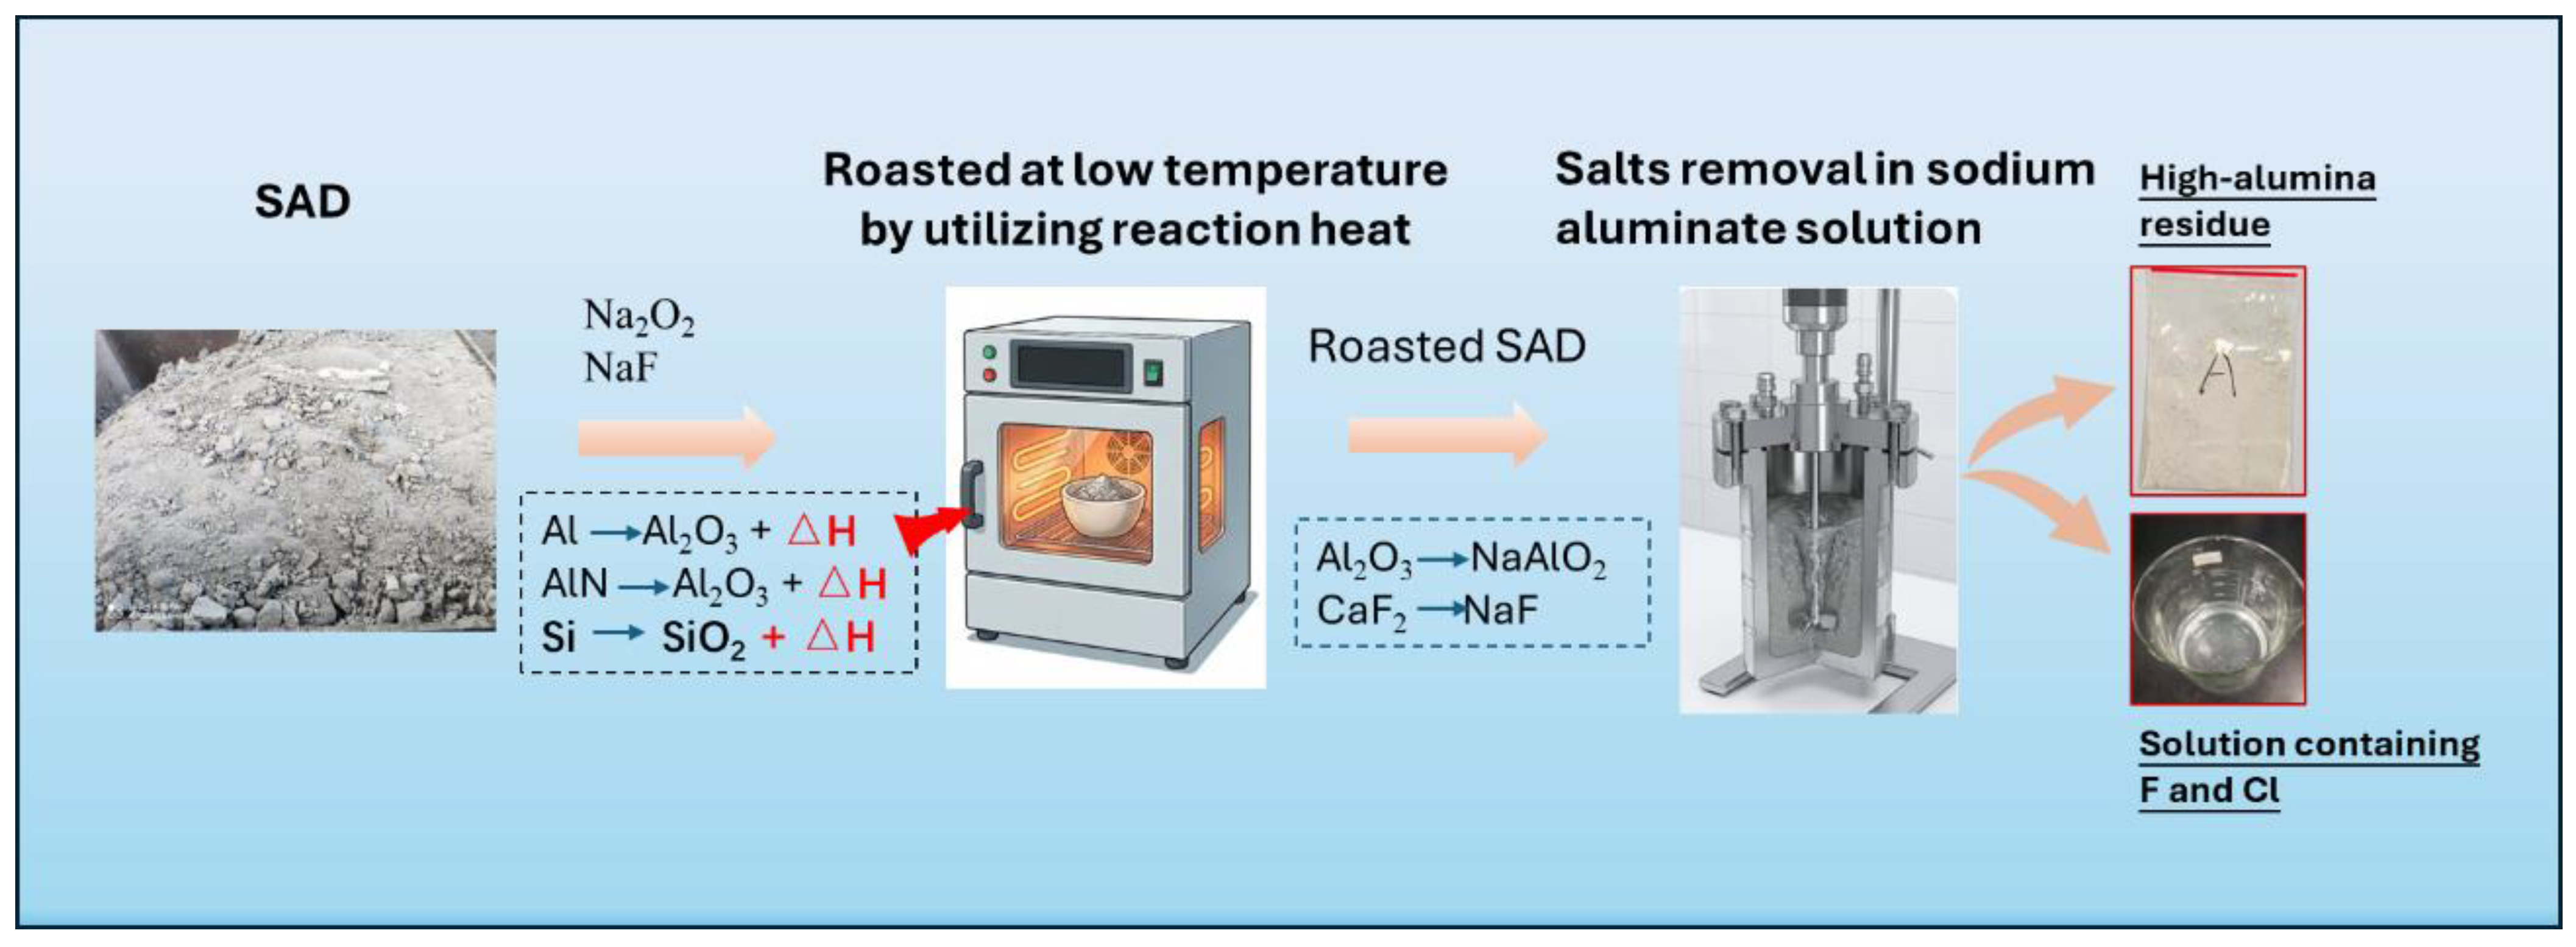
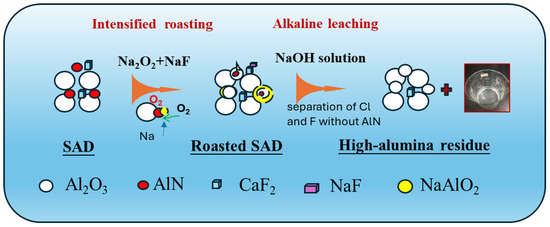
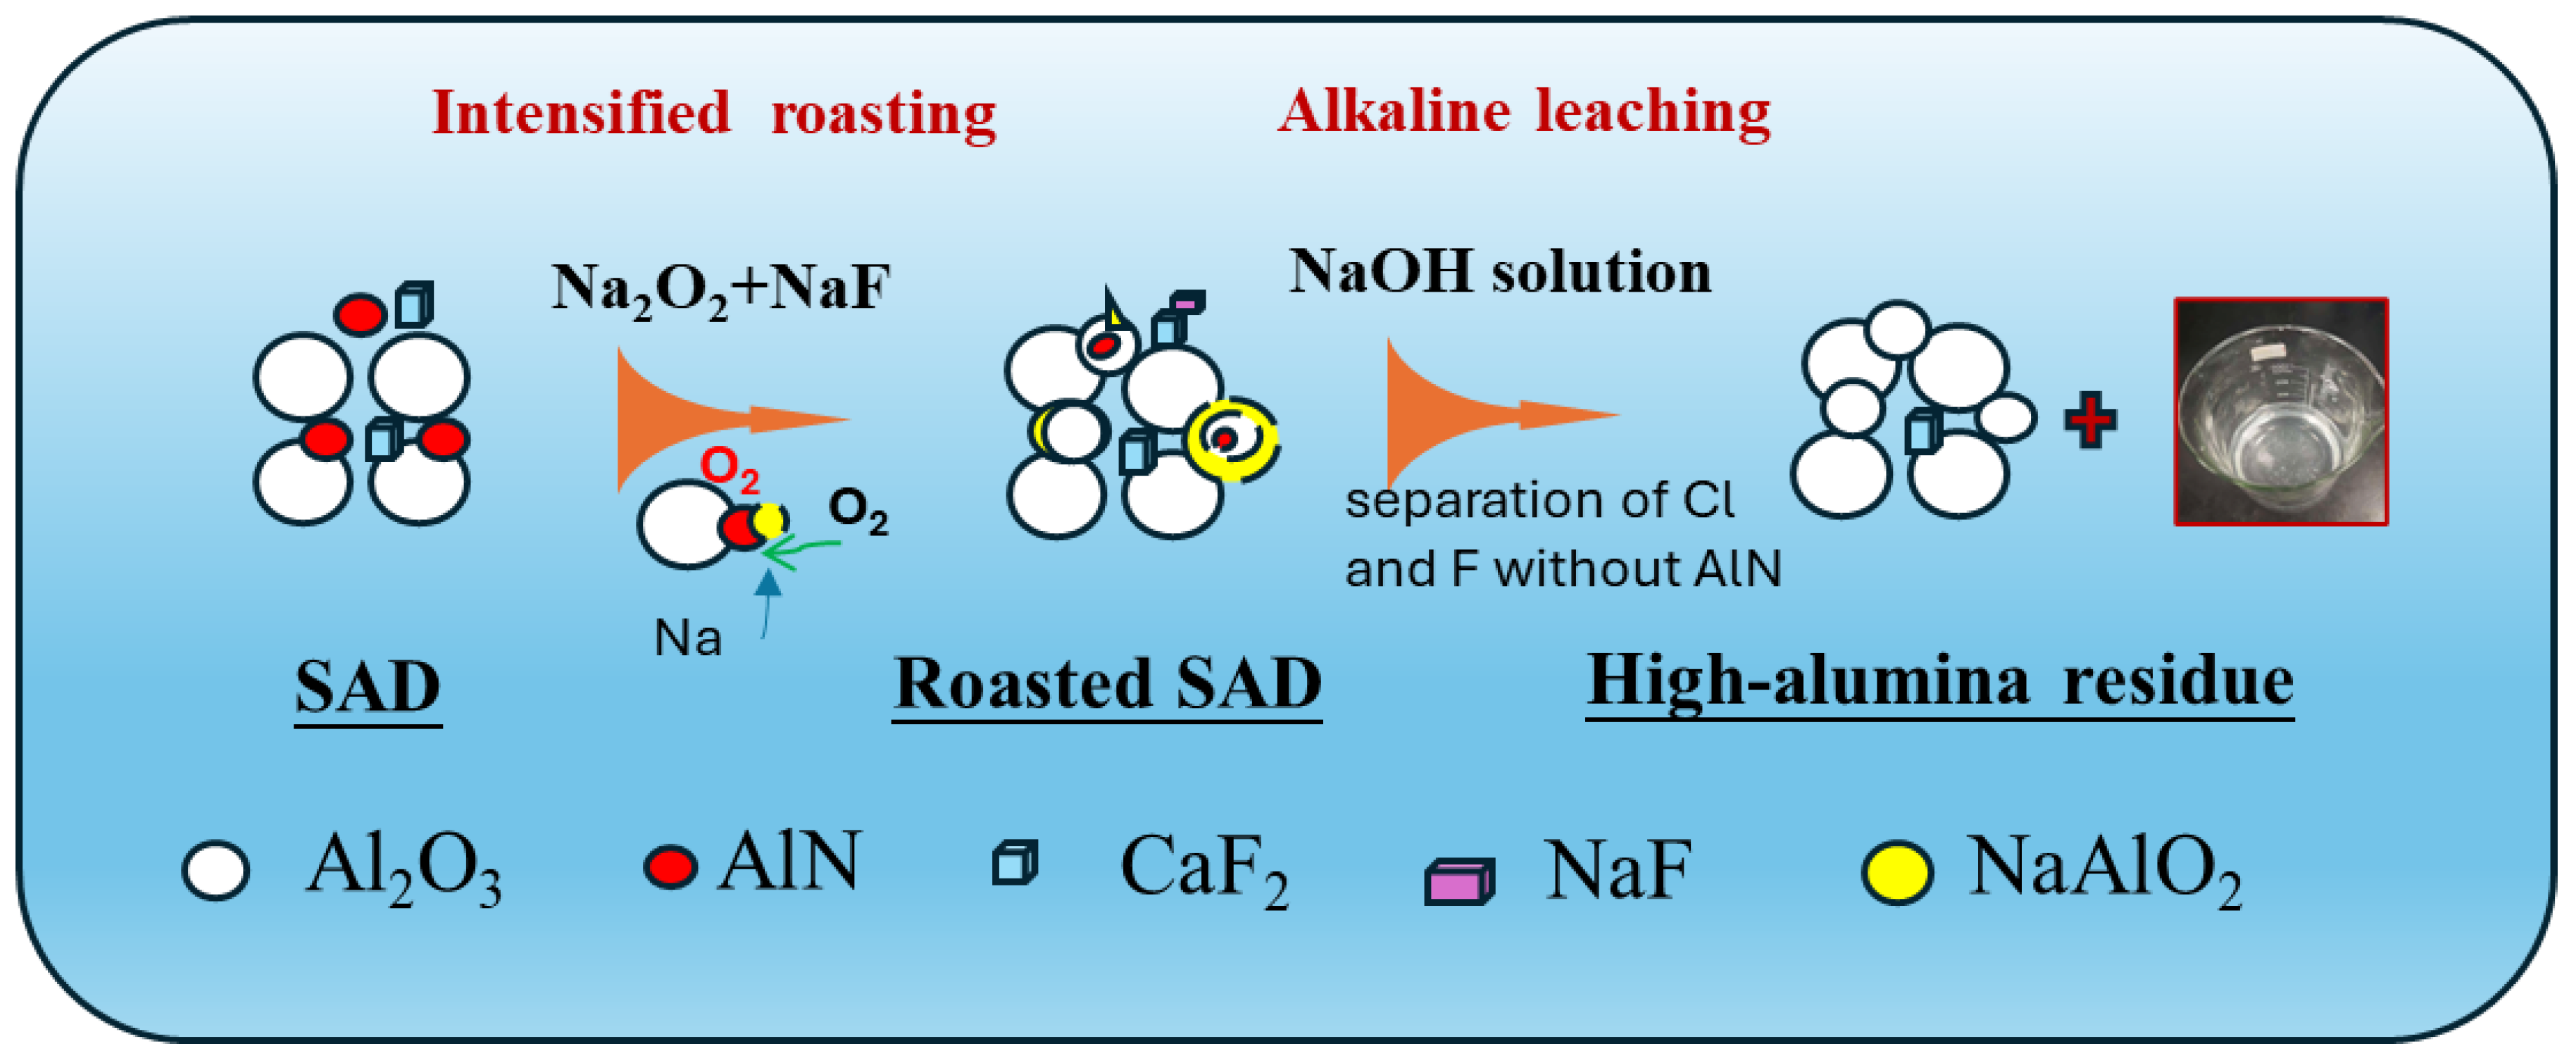
During the roasting process, the formation of Al2O3 on the surface of Al and AlN particles tends to encapsulate the internal AlN, thereby inhibiting further oxidation. Although further increasing the roasting temperature (>1200 °C) can promote AlN oxidation, it is accompanied by substantial halide volatilization To accelerate oxidation and enhance the AlN conversion at low temperature to inhibit volatilization of halides, in addition to roasting at low temperature, Na2O2 was introduced as a powerful oxidant to enrich O2 in situ for intensified oxidation on basis of results in Figure 5 (as shown in Figure 8). Additionally, NaF was added as a mineralizer to lower the reaction temperature and further promote the conversion of AlN [20]. Meanwhile, sodium-bearing species also promoted formation of soluble NaAlO2 and Na2SiO3 to destroy the enveloped AlN and fluorides, and efficient removal of harmful elements was possibly achieved. In addition, sodium aluminate solution was used because of reactive compounds converting into sodium aluminate solution in NaOH solution, while Al(OH)3 was readily precipitated from the saturated sodium aluminate solution, and sodium aluminate solution was then recycled without wastewater. Therefore, the present Na2O2–NaF combination was selected to couple strong oxidation at 750 °C. In this work, the role of NaF is discussed in terms of roasting activation and possible modification of fluoride occurrence, rather than as direct evidence of net fluorine removal. The formation of NaAlO2 from the Na-bearing Na2O2 may benefit further oxidation and fluorine removal. The intensified roasting–alkaline leaching approach is shown in Figure 8.
Figure 8.
Schematic diagram of harmful element removal by adding additives roasted at low temperature.
The enriched O2 from Na2O2 and air both raised the oxidation of AlN, and NaF reduced roasting temperature, both leading to high conversion of AlN. Meanwhile, sodium from Na2O2 and NaF favored the formation of the soluble NaAlO2, benefiting the destruction of the enveloped AlN and fluorides. All raised the removal efficiency of the harmful elements.
3.2.1. Effect of Oxidization Dosage
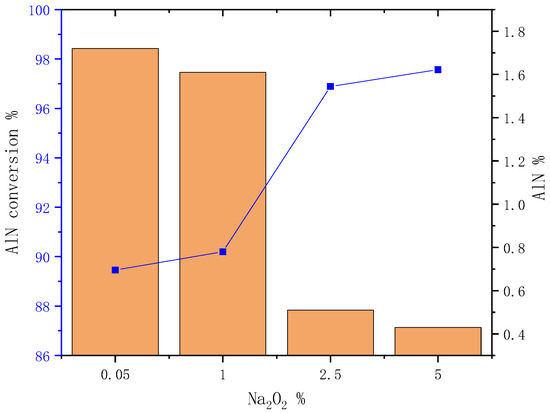
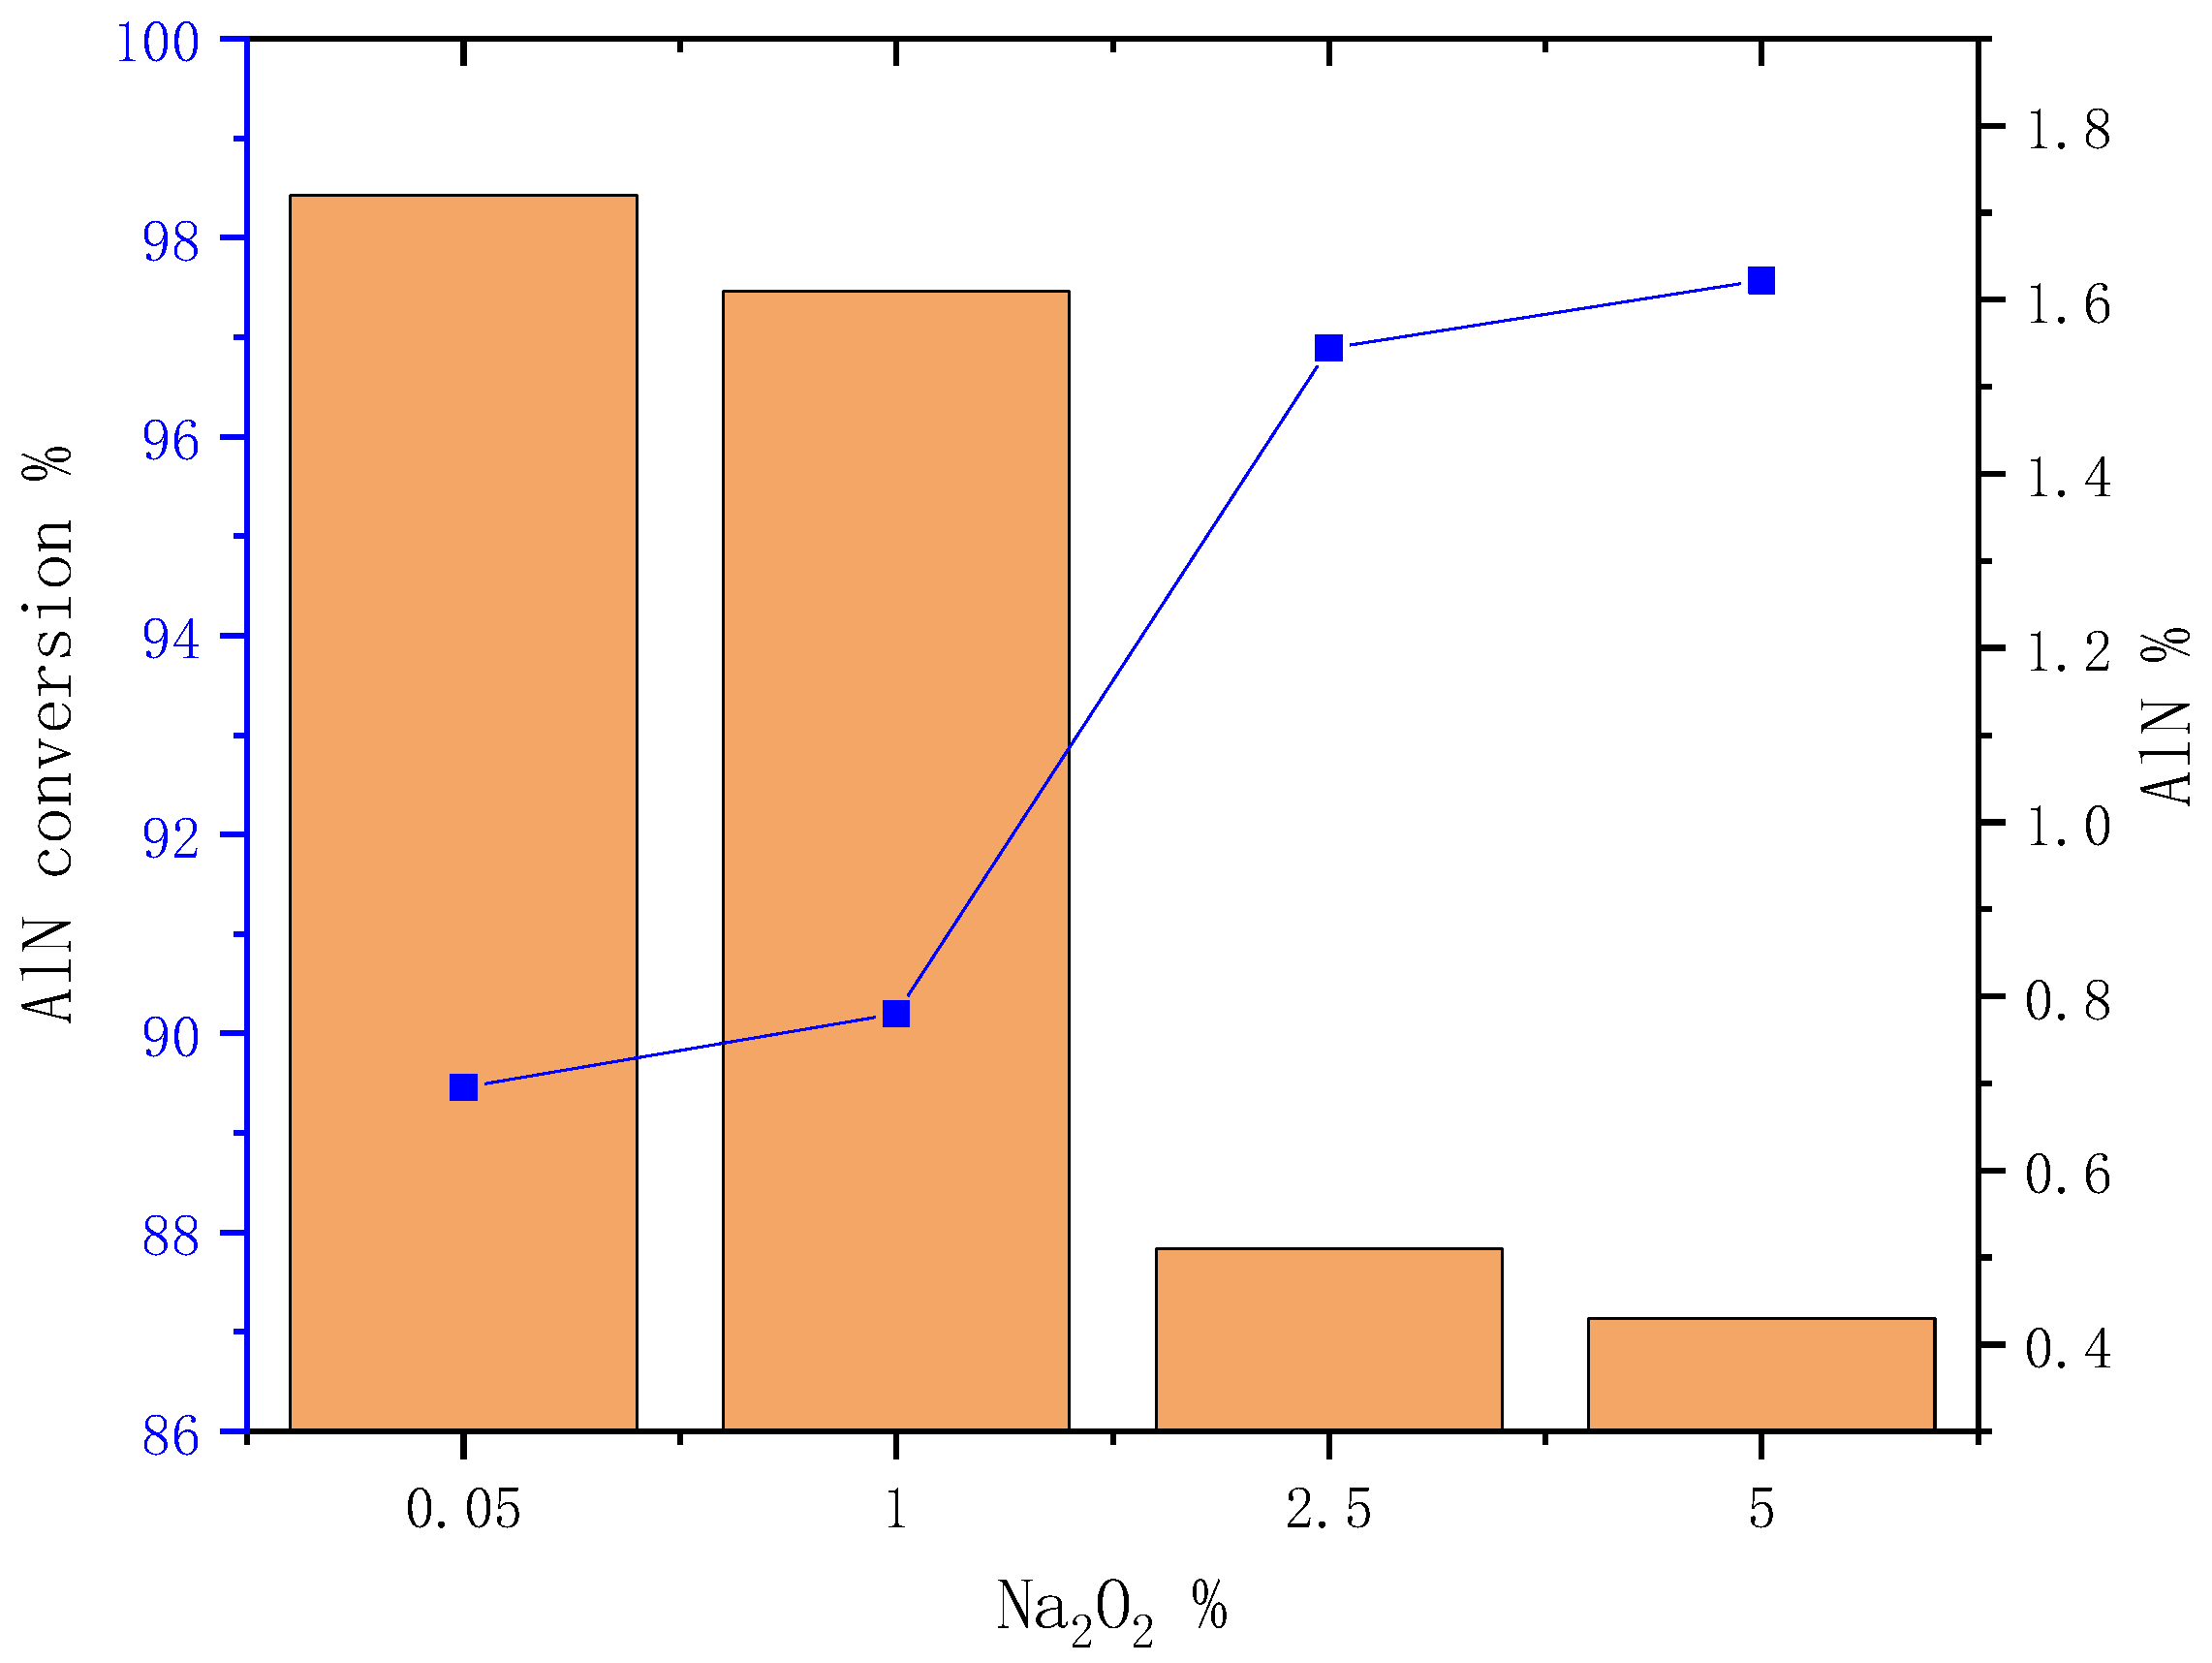
Na2O2 is a sodium-bearing oxidant. Its decomposition supplies O2 in situ, which promotes the oxidation of AlN and Al during roasting. The effect of Na2O2 dosage on AlN conversion is shown in Figure 9.
Figure 9.
Effect of Na2O2 dosage on AlN conversion in SAD. Experimental conditions: SAD + 5% NaF + 2.5% Na2O2; T = 750 °C; t = 3 h.
From Figure 9, adding Na2O2 raised AlN conversion efficiency, which is in good agreement with the results in Figure 5. Meanwhile, the 96.89% AlN conversion efficiency was more than the 91.65% at 750 °C in Figure 6. However, adding 5% Na2O2 slightly increased AlN conversion compared with the results from adding 2.5% Na2O2. Therefore, 2.5% Na2O2 was adopted in the following experiments. In addition, the masses of chlorine and fluorine in the roasted SAD were nearly equal to those in SAD, proving the stability of halides at low roasting temperature (NaCl melting point 801 °C, NaF melting point 996 °C).
3.2.2. Effect of Roasting Temperature
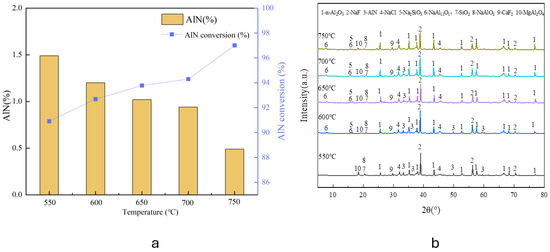
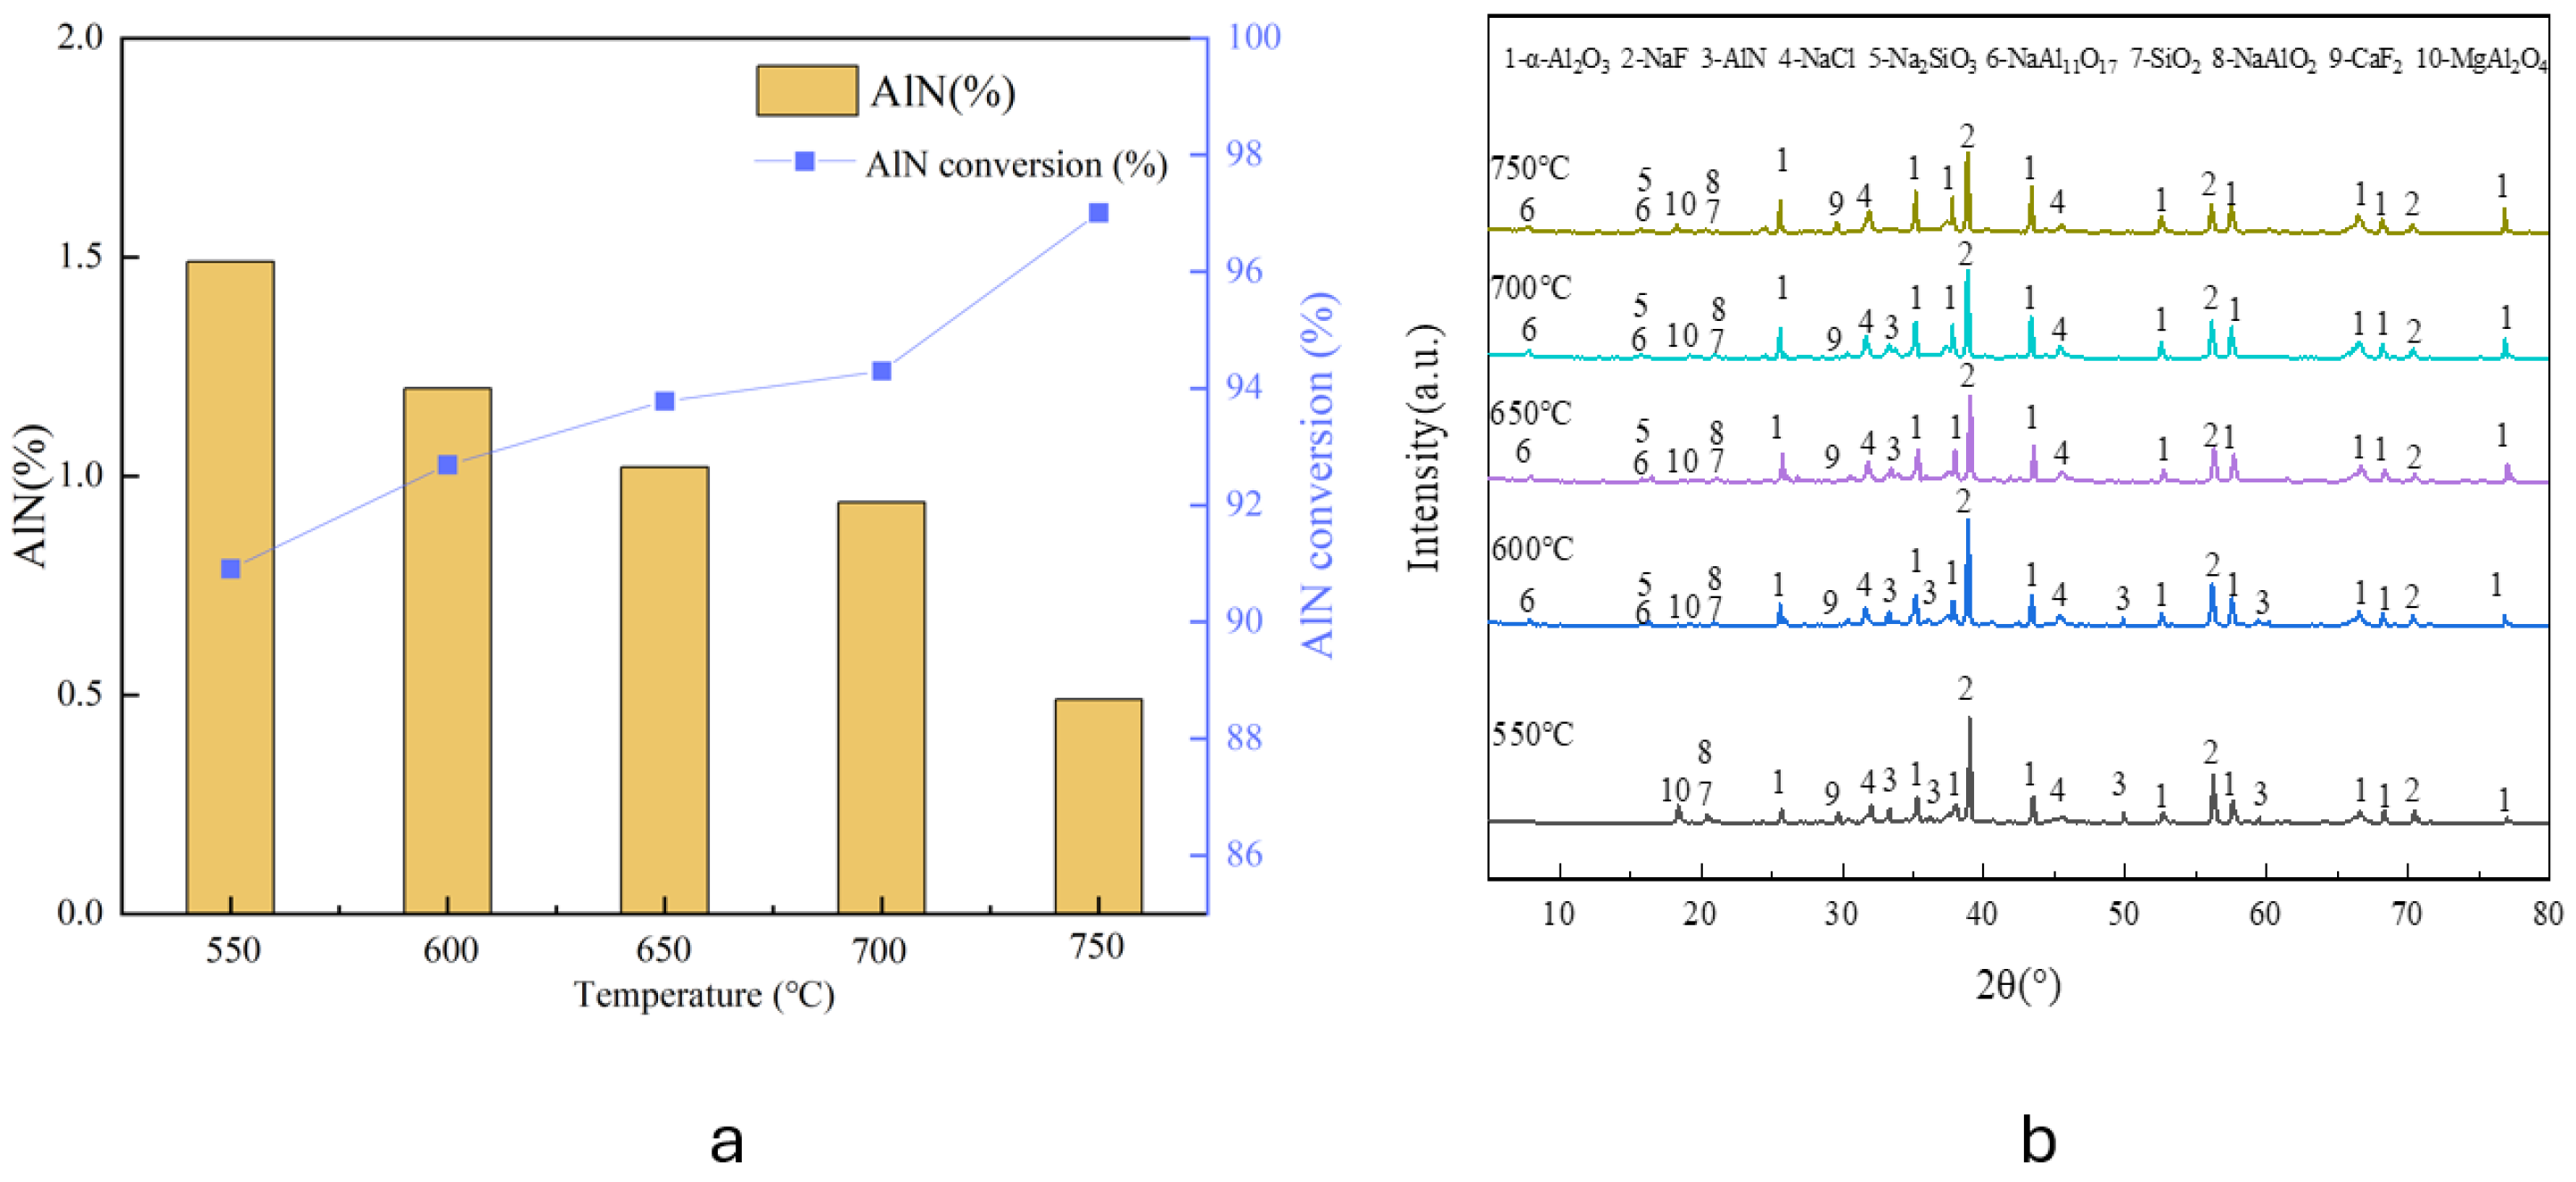
The variation in AlN conversion efficiency as a function of roasting temperature is shown in Figure 10a. As the roasting temperature increased, the AlN conversion efficiency increased continuously. At the same temperature, the additive-assisted roasting shown in Figure 10a was more effective than the direct roasting shown in Figure 6 because Na2O2 supplied active oxygen in situ, and sodium-bearing phases promoted the formation of soluble NaAlO2/Na2SiO3, which weakened the encapsulating alumina layer. The conversion efficiency reached 97.01% at 750 °C, which was higher than the 91.65% obtained by direct roasting (Figure 6). The higher AlN conversion is expected to reduce the risk of NH3 release during subsequent aqueous treatment.
Figure 10.
(a) Effect of roasting temperature on the AlN conversion in SAD; (b) XRD patterns of roasted products at different temperatures. Experimental conditions: SAD + 5% NaF + 2.5% Na2O2; t = 3 h.
The XRD patterns of the roasted products are presented in Figure 10b. In addition to α-Al2O3, NaAl11O17, CaF2, and MgAl2O4, new compounds such as NaF, Na2SiO3, NaAlO2, and SiO2 were all observed, while the characteristic peaks of Al and Si both disappeared. The following reactions are proposed to interpret the observed phase evolution during roasting:
2Na2O2 = 2Na2O + O2
Si + O2 = SiO2
2Al + 3O2 = 2Al2O3
SiO2 + Na2O = Na2SiO3
Al2O3 + Na2O = 2NaAlO2
CaF2 + Na2O = 2NaF + CaO
Furthermore, both the number and intensity of AlN diffraction peaks decreased significantly. When the roasting temperature exceeded 650 °C, no obvious AlN diffraction peaks were detected. Meanwhile, the diffraction peaks of Al2O3 were intensified with increasing temperature, suggesting that more conversion of Al and AlN to Al2O3 occurred. This behavior is consistent with the high oxygen availability generated by Na2O2 decomposition. The results in Figure 6 and Figure 7 suggest that additives remarkably raised the oxidation of AlN in Figure 10. Formation of the soluble NaF, Na2SiO3 and NaAlO2 at low roasting temperature then benefits the destruction of the alumina layer enveloping AlN and fluorides, and accordingly raises the removal efficiency of fluorides in the leaching process compared to the uncovered fluorides from the dissolution mentioned above in Figure 8 and reactions. However, minor AlN still remained because some particles were tightly enveloped within the SAD matrix [16].
3.2.3. Effect of Roasting Duration
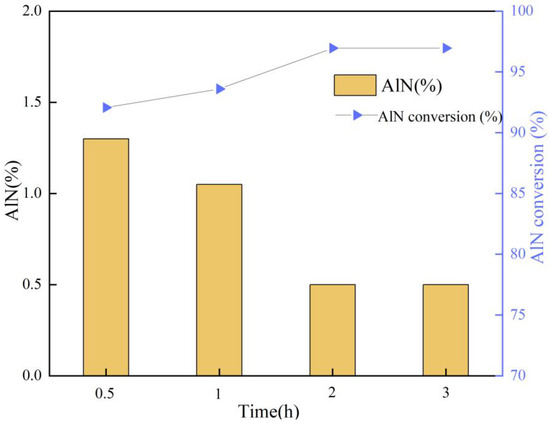
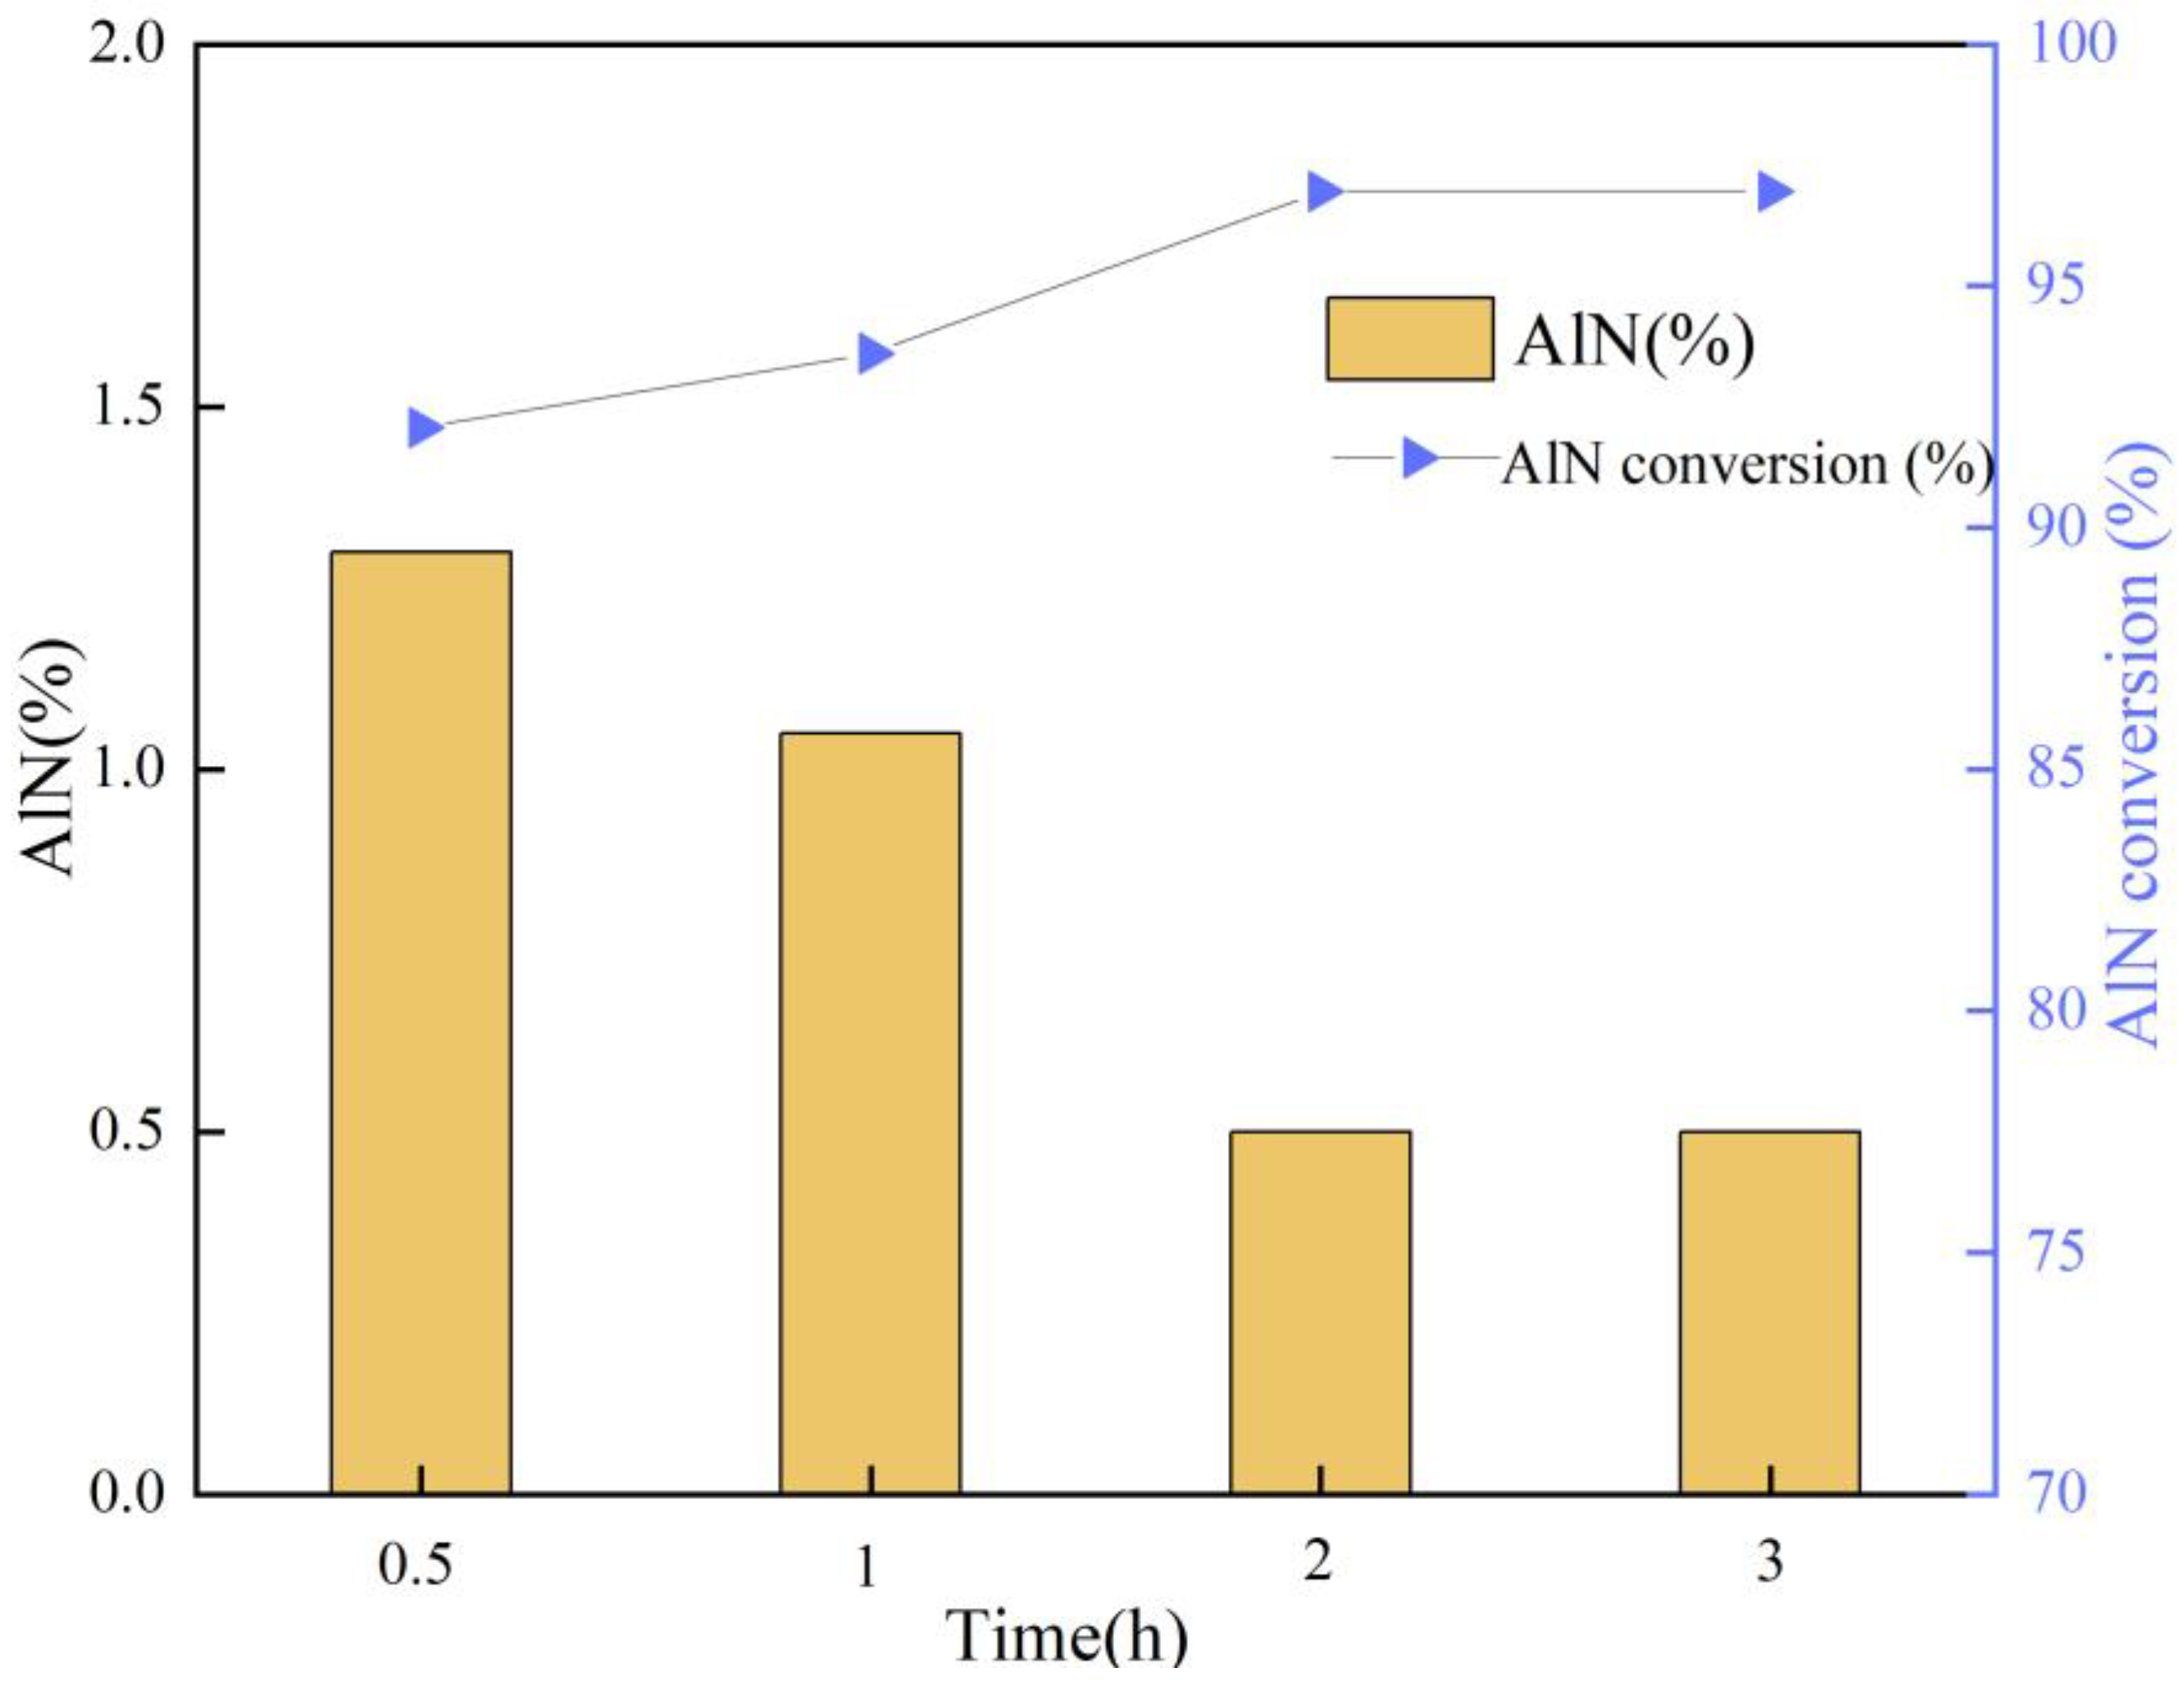
The variation in the AlN conversion efficiency as a function of roasting duration is shown in Figure 11. The AlN conversion efficiency in the SAD reached approximately 90% at 750 °C for 0.5 h, while the conversion efficiency reached up to 96.95% for 2 h. Further extension of the roasting time slightly raised the conversion efficiency at 3 h. This fact is mainly due to the minor residual AlN encapsulated by α-Al2O3 rather than NaAlO2, without enough Na-bearing species.
Figure 11.
Effect of roasting duration on the AlN conversion in SAD. Experimental conditions: SAD + 5% NaF + 2.5% Na2O2; T = 750 °C.
Therefore, 100% AlN in SAD was difficult to convert in the traditional roasting process without additives. Adding Na2O2 and NaF remarkedly increased AlN conversion and eliminated detectable Al and Si through enriched O2 in situ from Na2O2 and the formation of NaAlO2 and Na2SiO3. These soluble Na-bearing phases (NaAlO2, Na2SiO3 and NaF) may also contribute to subsequent fluoride leaching.
3.3. Enhanced Removal of Fluorine and Chlorine from SAD via Intensified Roasting
Although AlN was efficient with additives at 750 °C with approximately 97% of AlN conversion, high removal efficiency of the fluorides is urgently required. In the presence of NaAlO2, Na2SiO2 and NaF, salts containing chlorine and fluorine were then efficiently removed. To further investigate the effect of intensified roasting on chlorine and fluorine removal, the SAD and SAD roasted at 750 °C were then utilized for dechlorination and defluorination in an alkaline solution. The results are displayed in Table 4.
Table 4.
Dechlorination and defluorination of SAD in alkaline solution after roasting at 750 °C without additives.
Removal efficiencies of chlorine and fluorine in the dilute sodium aluminate solution were 85.40% and 54.42%, respectively. Meanwhile, the fluorine removal efficiency increased to 72% and the chlorine removal efficiency reached nearly 100% in an alkaline solution at 100 °C after roasting at 750 °C. The circumstances suggest the roasting process remarkably raises the removal of salt in SAD. However, owing to the insoluble fluorides and enveloped fluorides in SAD, the fluorine content in the residue remained above 0.5%, still classifying it as high-fluorine residue with high environmental risks. Therefore, intensified roasting processes to raise the conversion efficiency of AlN and the soluble NaAlO2 covering AlN and fluorides is required.
In addition, as the removal efficiency of chlorine was nearly 100%, the effect of the intensified roasting process on the removal efficiency of fluorine was then investigated in detail.
3.3.1. Effect of Leaching Temperature
The roasted SAD produced at 750 °C for 3 h with Na2O2 and NaF was used to investigate fluorine removal and the phase evolution of the high-alumina residue after leaching.
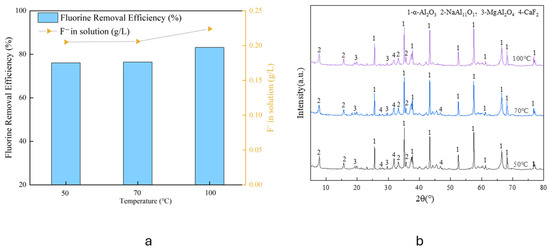
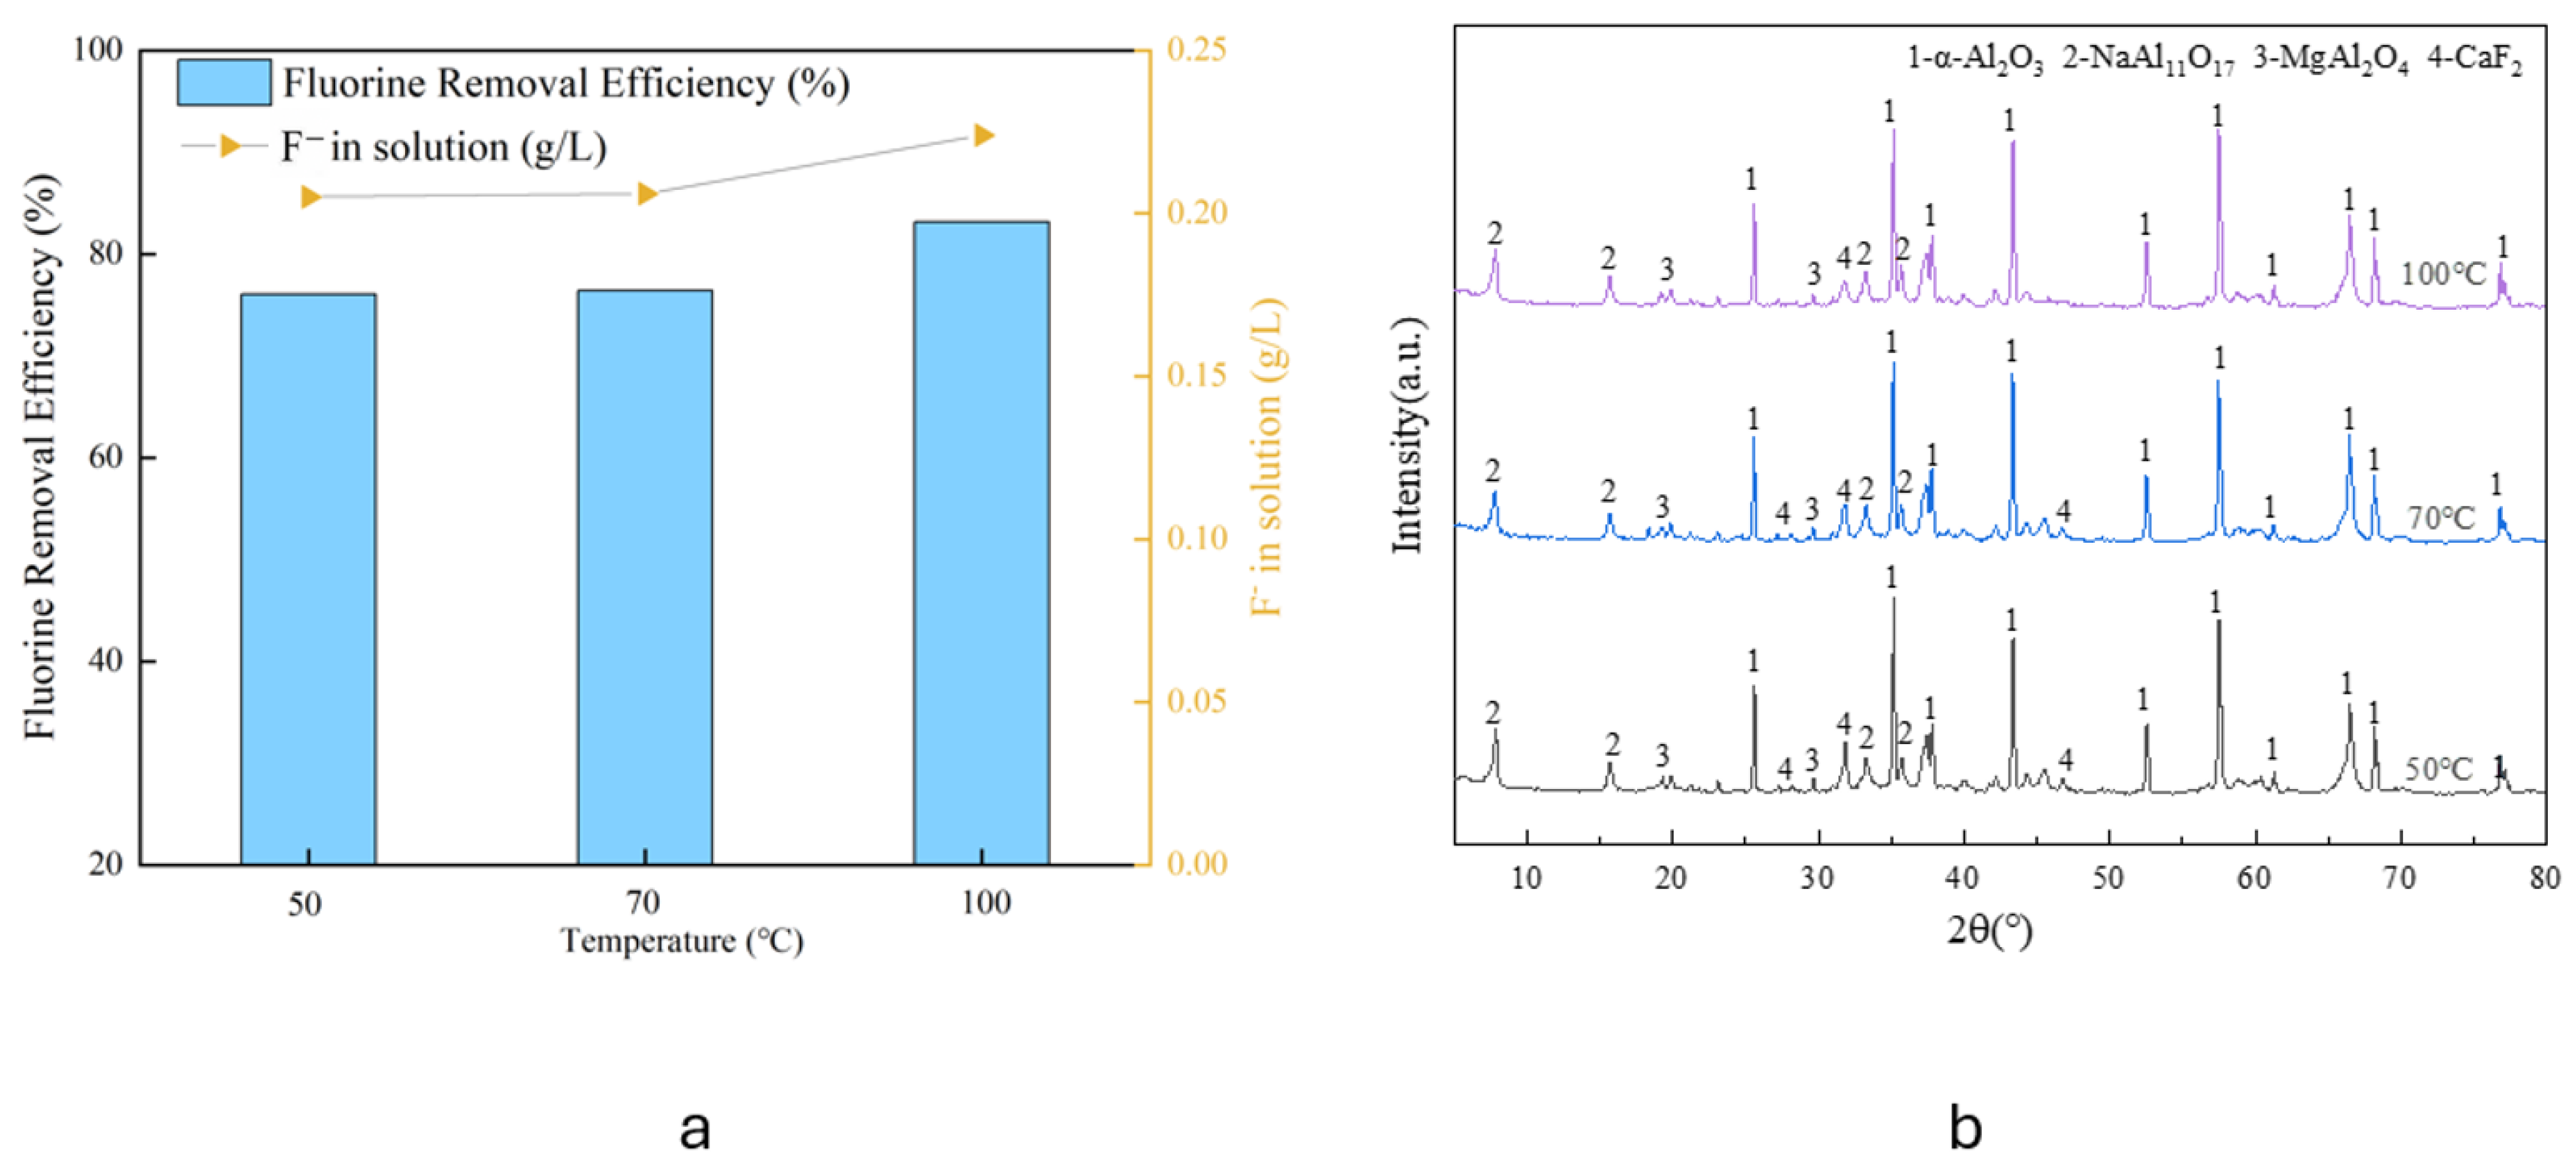
The effect of leaching temperature on fluorine removal from the roasted SAD is shown in Figure 12a. The fluorine removal efficiency increased from 76.06% at 50 °C to 83.16% at 100 °C. Compared with the results in Table 4, intensified roasting markedly enhanced fluorine removal. This improvement is attributed to the disruption of enveloped AlN/fluoride associations, dissolution of soluble NaAlO2 and Na2SiO3, and partial conversion or exposure of fluoride-bearing phases during roasting (Figure 8).
Figure 12.
(a) Effect of leaching temperature on the fluorine removal from the roasted SAD; (b) XRD patterns of the leaching residues at different temperatures. Experimental conditions: sodium aluminate solution with Na2O = 30 g/L, αk = 3.0; t = 3 h; S/L = 20 g/L.
XRD patterns at different leaching temperatures are shown in Figure 12b. The inert α-Al2O3, NaAl11O17 and MgAl2O4 remained in the residue, whereas NaAlO2, Na2SiO3 and NaF all disappeared because of their ready dissolution in the dilute sodium aluminate solution, as shown in the following equations.
where s represents solid, and l stands for liquid.
NaAlO2 + 2H2O = NaAl(OH)4
Na2SiO3 + H2O → Na2SiO3
NaF + H2O → NaF
Furthermore, the characteristic peaks of CaF2 weakened significantly. This phase evolution suggests that intensified roasting partially altered the occurrence of fluoride-bearing phases and exposed part of the previously less accessible fluorides to alkaline leaching, as shown in Figure 8. Increasing temperature also accelerated mass transfer between the solid and liquid phases, thereby facilitating the dissolution of fluorine. Therefore, elevating temperatures were favorable for fluorine removal from the roasted SAD.
3.3.2. Effect of Leaching Duration
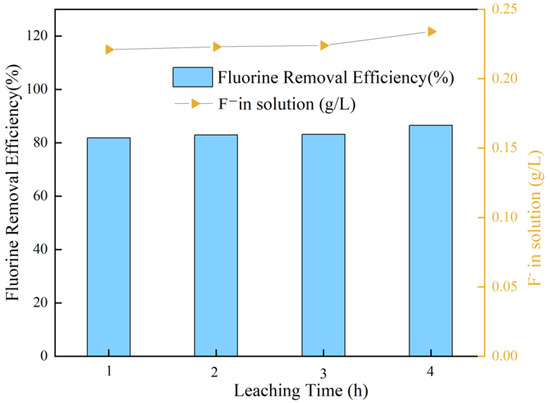
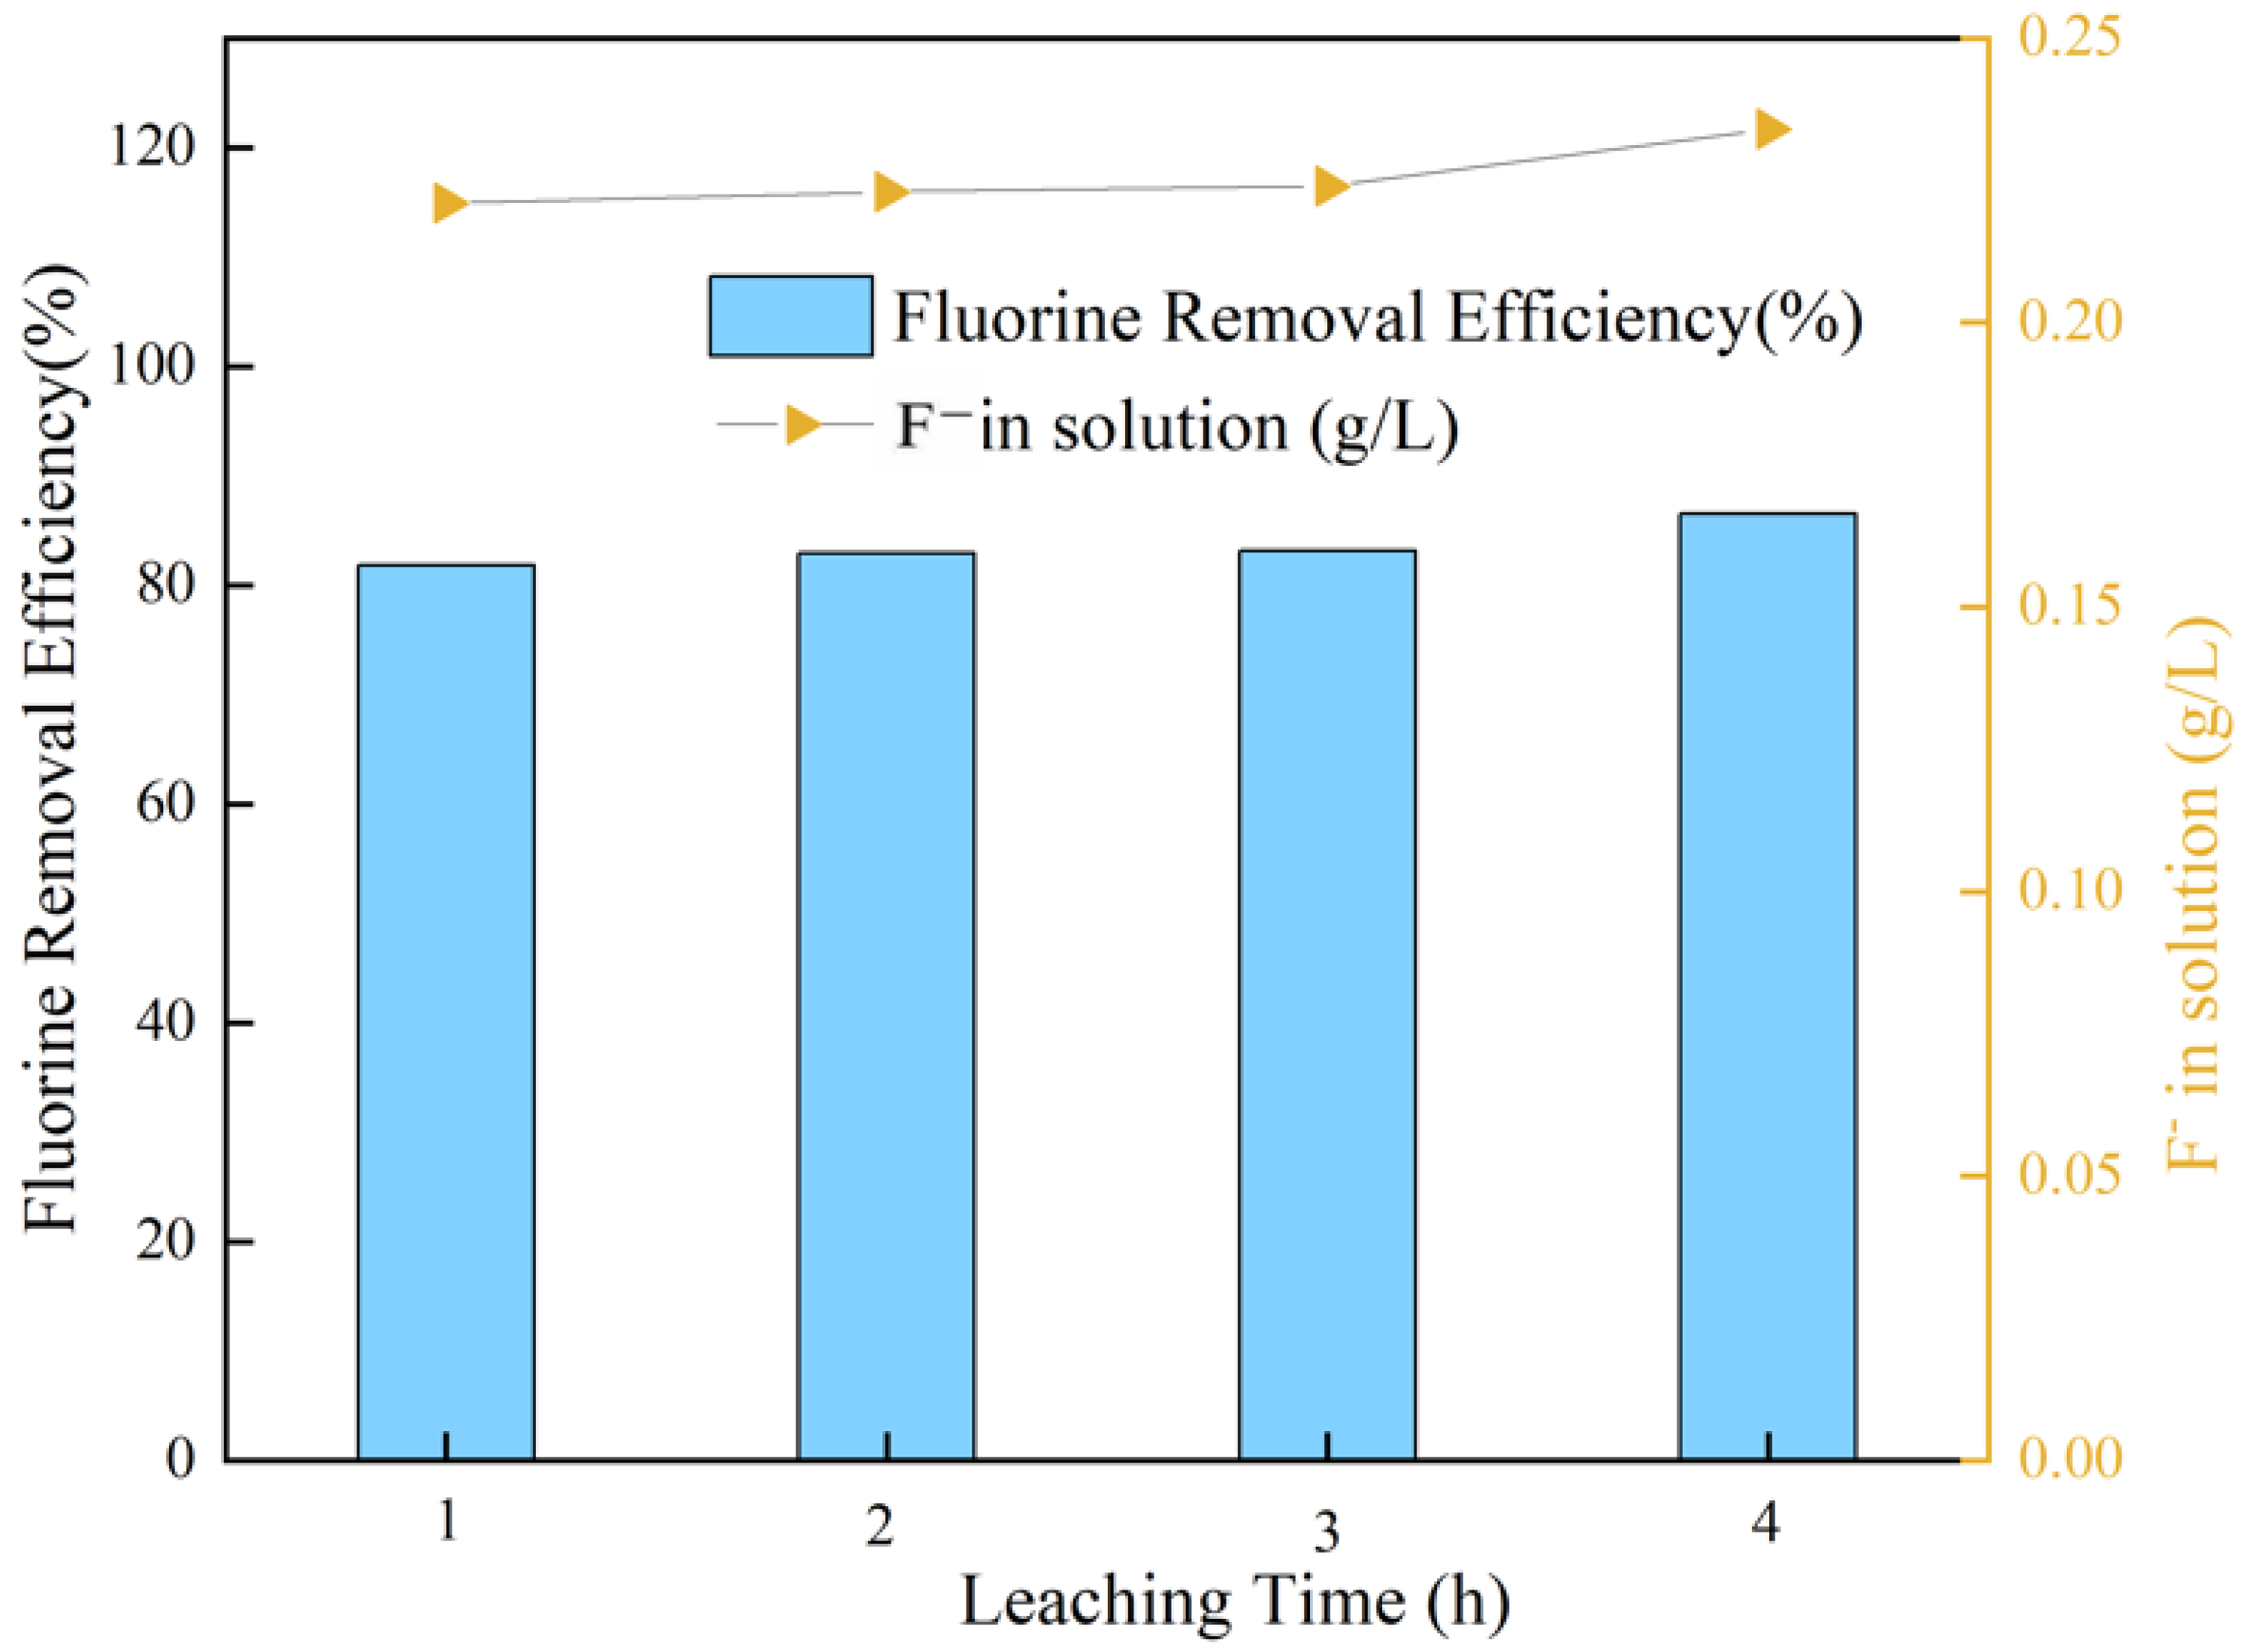
Leaching duration is related to production cost. The effect of duration on fluorine removal is shown in Figure 13. Because soluble Na-bearing compounds dissolved rapidly, extending the leaching duration had only a minor effect on fluorine removal efficiency. The fluorine removal efficiency was 81.8% after 1 h and increased by only approximately 2% after 4 h, with the fluorine ion concentration in solution reaching 0.234 g/L.
Figure 13.
Effect of leaching duration on the fluorine removal from the roasted SAD. Experimental conditions: sodium aluminate solution with Na2O = 30 g/L, αk = 3.0; T = 100 °C; S/L = 20 g/L.
3.3.3. Effect of Liquid-to-Solid Ratio
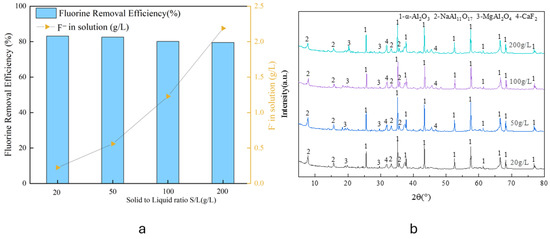
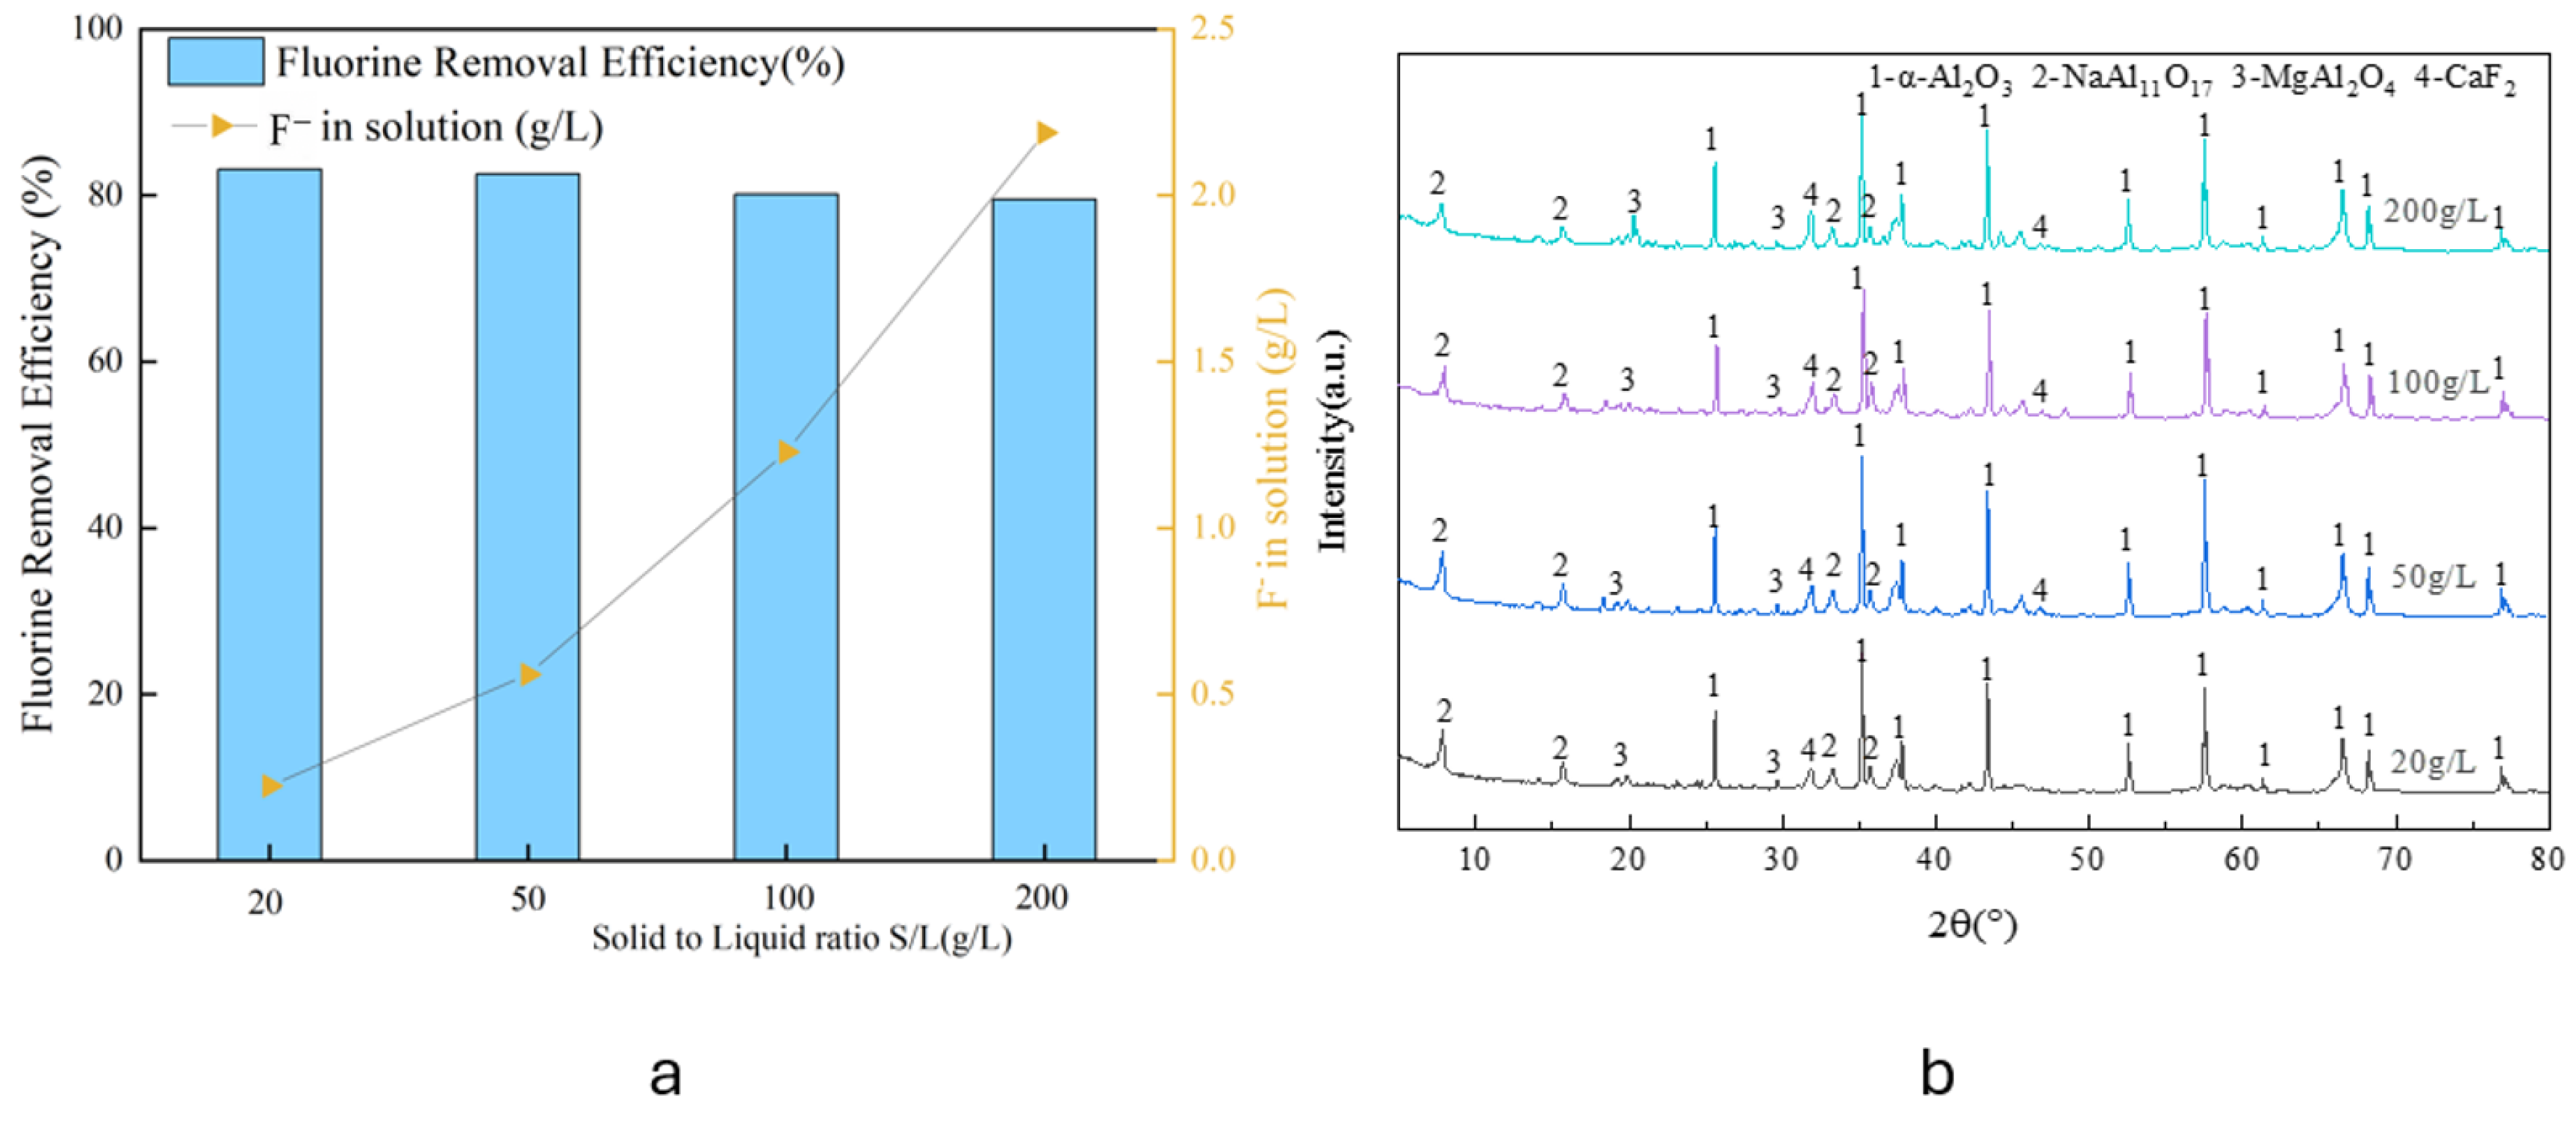
The liquid-to-solid ratio determines the fluorine concentration of leachate and fluorine removal efficiency. From Figure 14a, increasing the dosage of the roasted SAD slightly reduced the removal efficiency of fluorine. The fluorine removal efficiency decreased from 83.15% at 20 g/L to 79.53% at 200 g/L, respectively. In contrast, raising the dosage of the roasted SAD notably raised fluorine concentration. Fluorine concentration was 2.2 g/L with the addition of 200g/L roasted SAD. Concentrated fluorine-bearing solutions will benefit the recovery of value-added fluorides.
Figure 14.
(a) Effect of liquid-to-solid ratio on the fluorine removal from the roasted SAD; (b) XRD patterns of the leaching residues at different liquid-to-solid ratios. Experimental conditions: sodium aluminate solution with Na2O = 30 g/L, αk = 3.0; T = 100 °C; t = 3 h.
The corresponding XRD patterns of the residues in Figure 14b show progressively strengthened CaF2 diffraction peaks with increasing roasted SAD, consistent with a large fraction of fluoride remaining in the residue. This inhibition is attributed to the increased viscosity of the sodium aluminate solution from high alumina concentration and fluorine concentration, thereby reducing fluoride solubility, and limiting the transfer of fluorine into the sodium aluminate solution.
3.3.4. Effect of Caustic Soda Concentration
Caustic soda concentration affects the dissolution equilibrium of fluoride-bearing phases, as rewritten by the following reactions:
CaF2 ⇄ Ca2+ + 2F−
Ca2+ + 2OH− = Ca(OH)2
Furthermore, raising caustic solution also improves the stability of the sodium aluminate solution with high molar ratio of αk, benefiting the removal of fluorides.
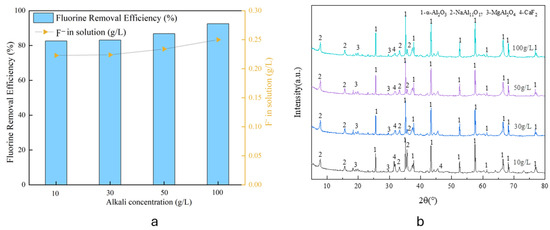
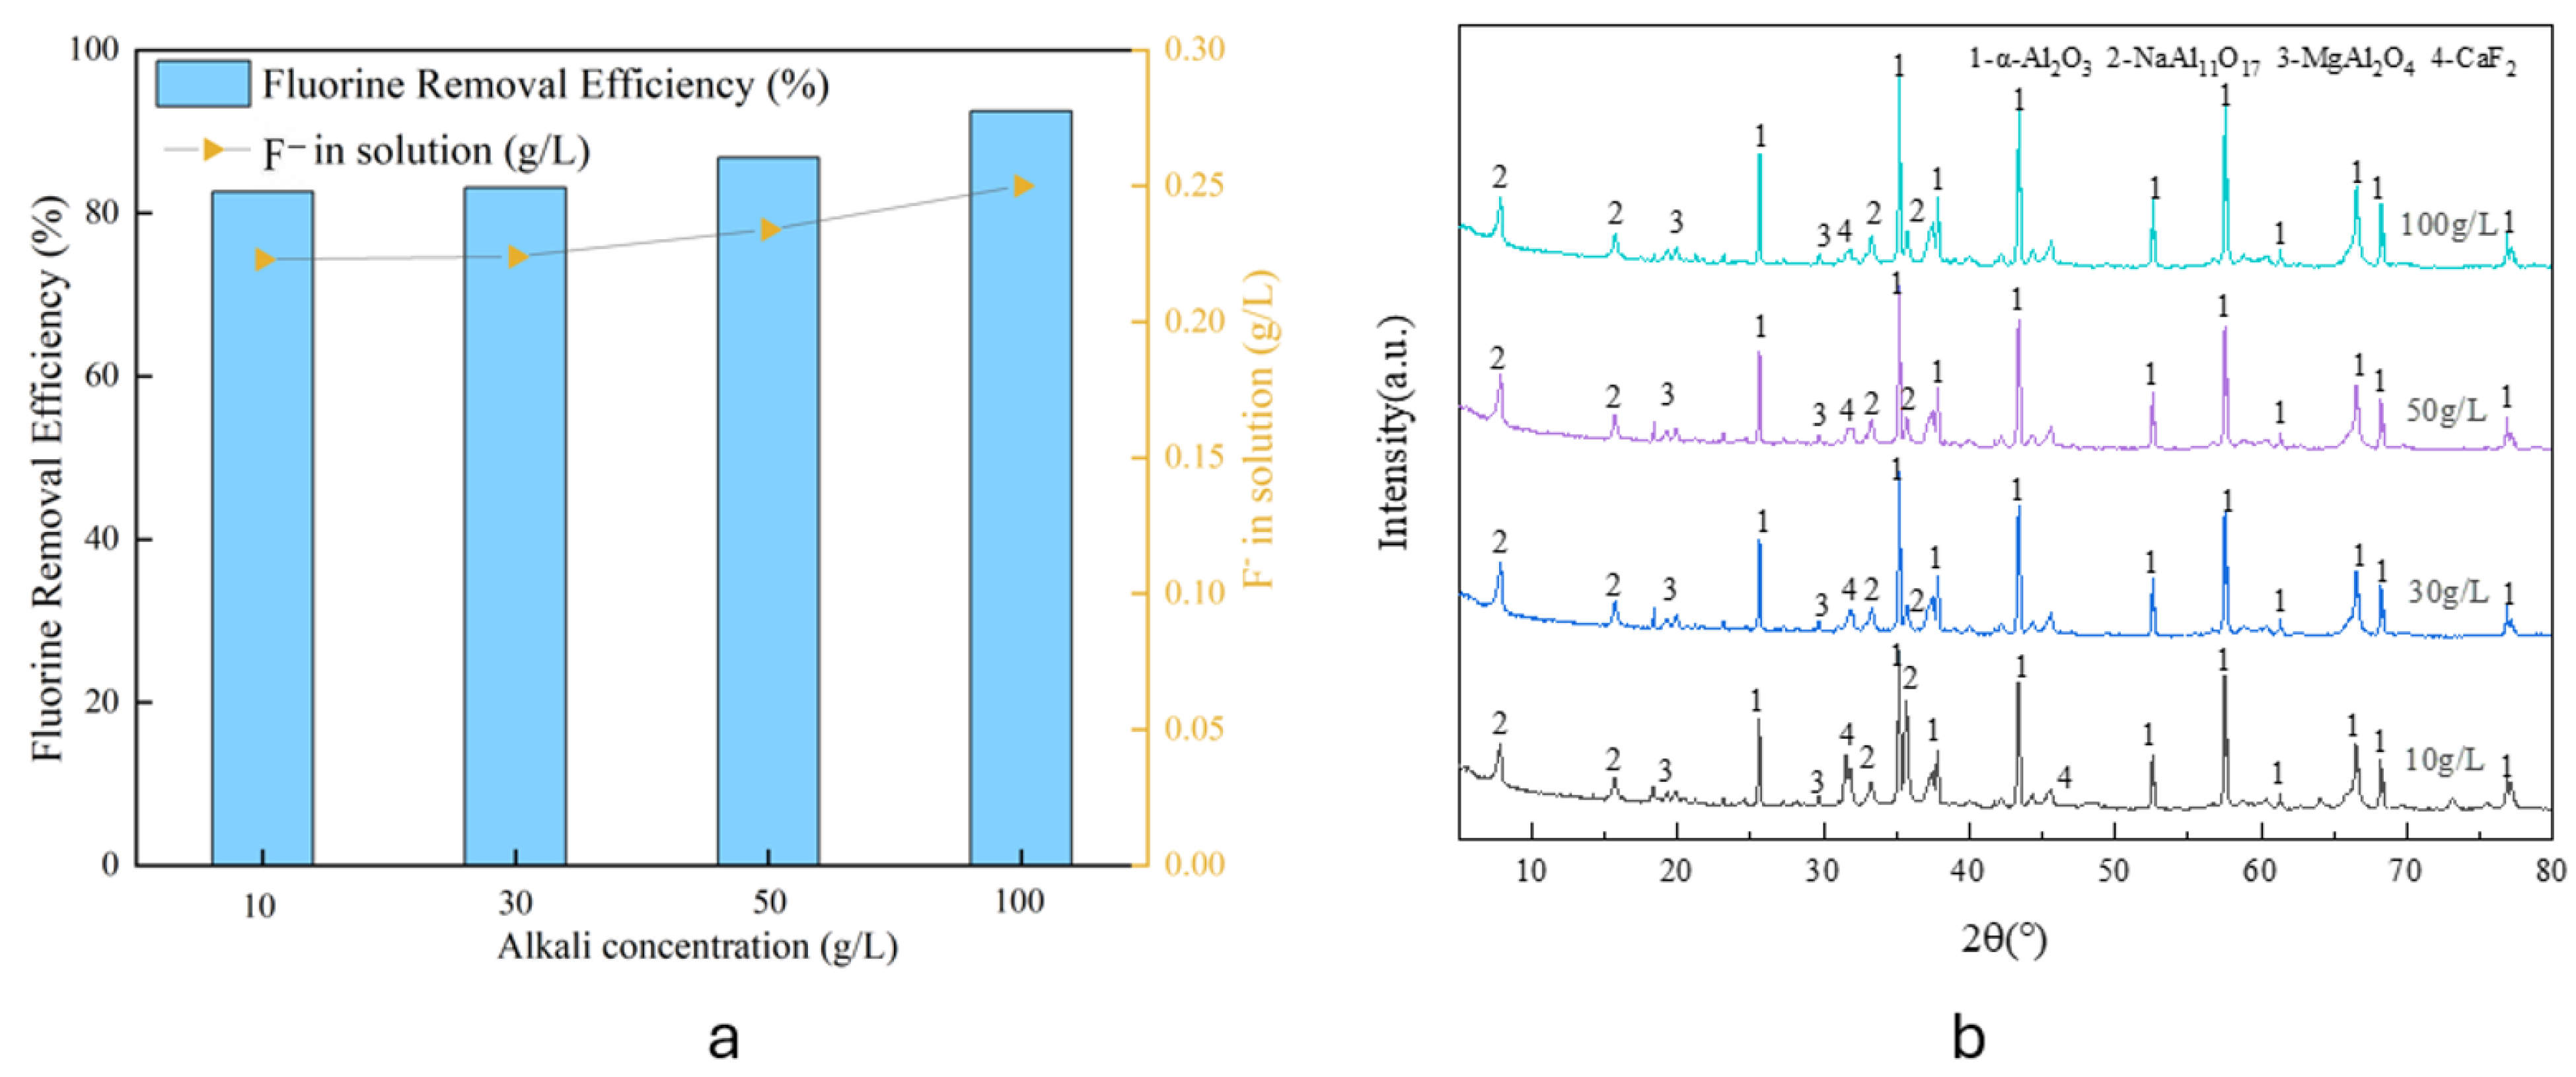
Figure 15a shows that increasing the Na2O concentration from 10 to 100 g/L raised the fluorine removal efficiency from 82.64% to 92.52%, while the fluoride concentration in solution increased from 0.223 to 0.25 g/L. These results indicate that intensified roasting increased the fraction of fluorine that could be transferred into the dilute sodium aluminate solution, although the present data do not directly prove a specific CaF2-to-NaF pathway.
Figure 15.
(a) Effect of alkali concentration (Na2O) on the fluorine removal from the roasted SAD; (b) XRD patterns of the leaching residues at different alkali concentrations. Experimental conditions: T = 100 °C; t = 3 h; S/L = 20 g/L.
XRD patterns of the residues in Figure 15b confirm that the inert α-Al2O3, NaAl11O17 and MgAl2O4 remained in the residue. The residual CaF2 peak intensities weakened systematically with increasing Na2O concentration, indicating improved dissolution and/or liberation of fluoride-bearing phases in the sodium aluminate solution.
Therefore, different from NaOH leaching and roasted SAD at high temperature without additives, 83.16% and 92.52% removal efficiency of fluorine was achieved in the dilute sodium aluminate solution and concentrated solution at 100 °C, leading to minor fluorine in the residue without reactive species. Harmful elements were all efficiently removed. Moreover, a high concentration of fluorine was enriched in the sodium aluminate solution.
3.4. High-Alumina Residue After Intensified Roasting–Leaching Process
The chemical composition of the high-alumina residue after the leaching process is presented in Table 5. The chlorine content in the residue was 0.03%, representing a removal efficiency of 99.47%, while the fluorine content remained at 0.19%. A total of 74% Al2O3 remained in residue with 12.3 mass ratio of alumina to silica, characterized by a high grade of alumina-bearing materials to produce alumina. In addition, 0.27% of sodium was detected in the residue, which is mainly attributed to the formation of desilication products.
Table 5.
Composition and contents of the leaching residue (wt%).
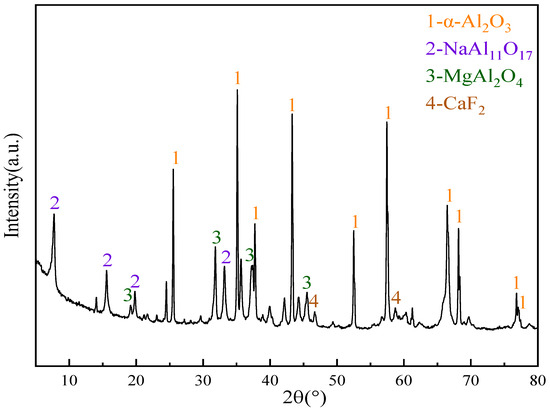
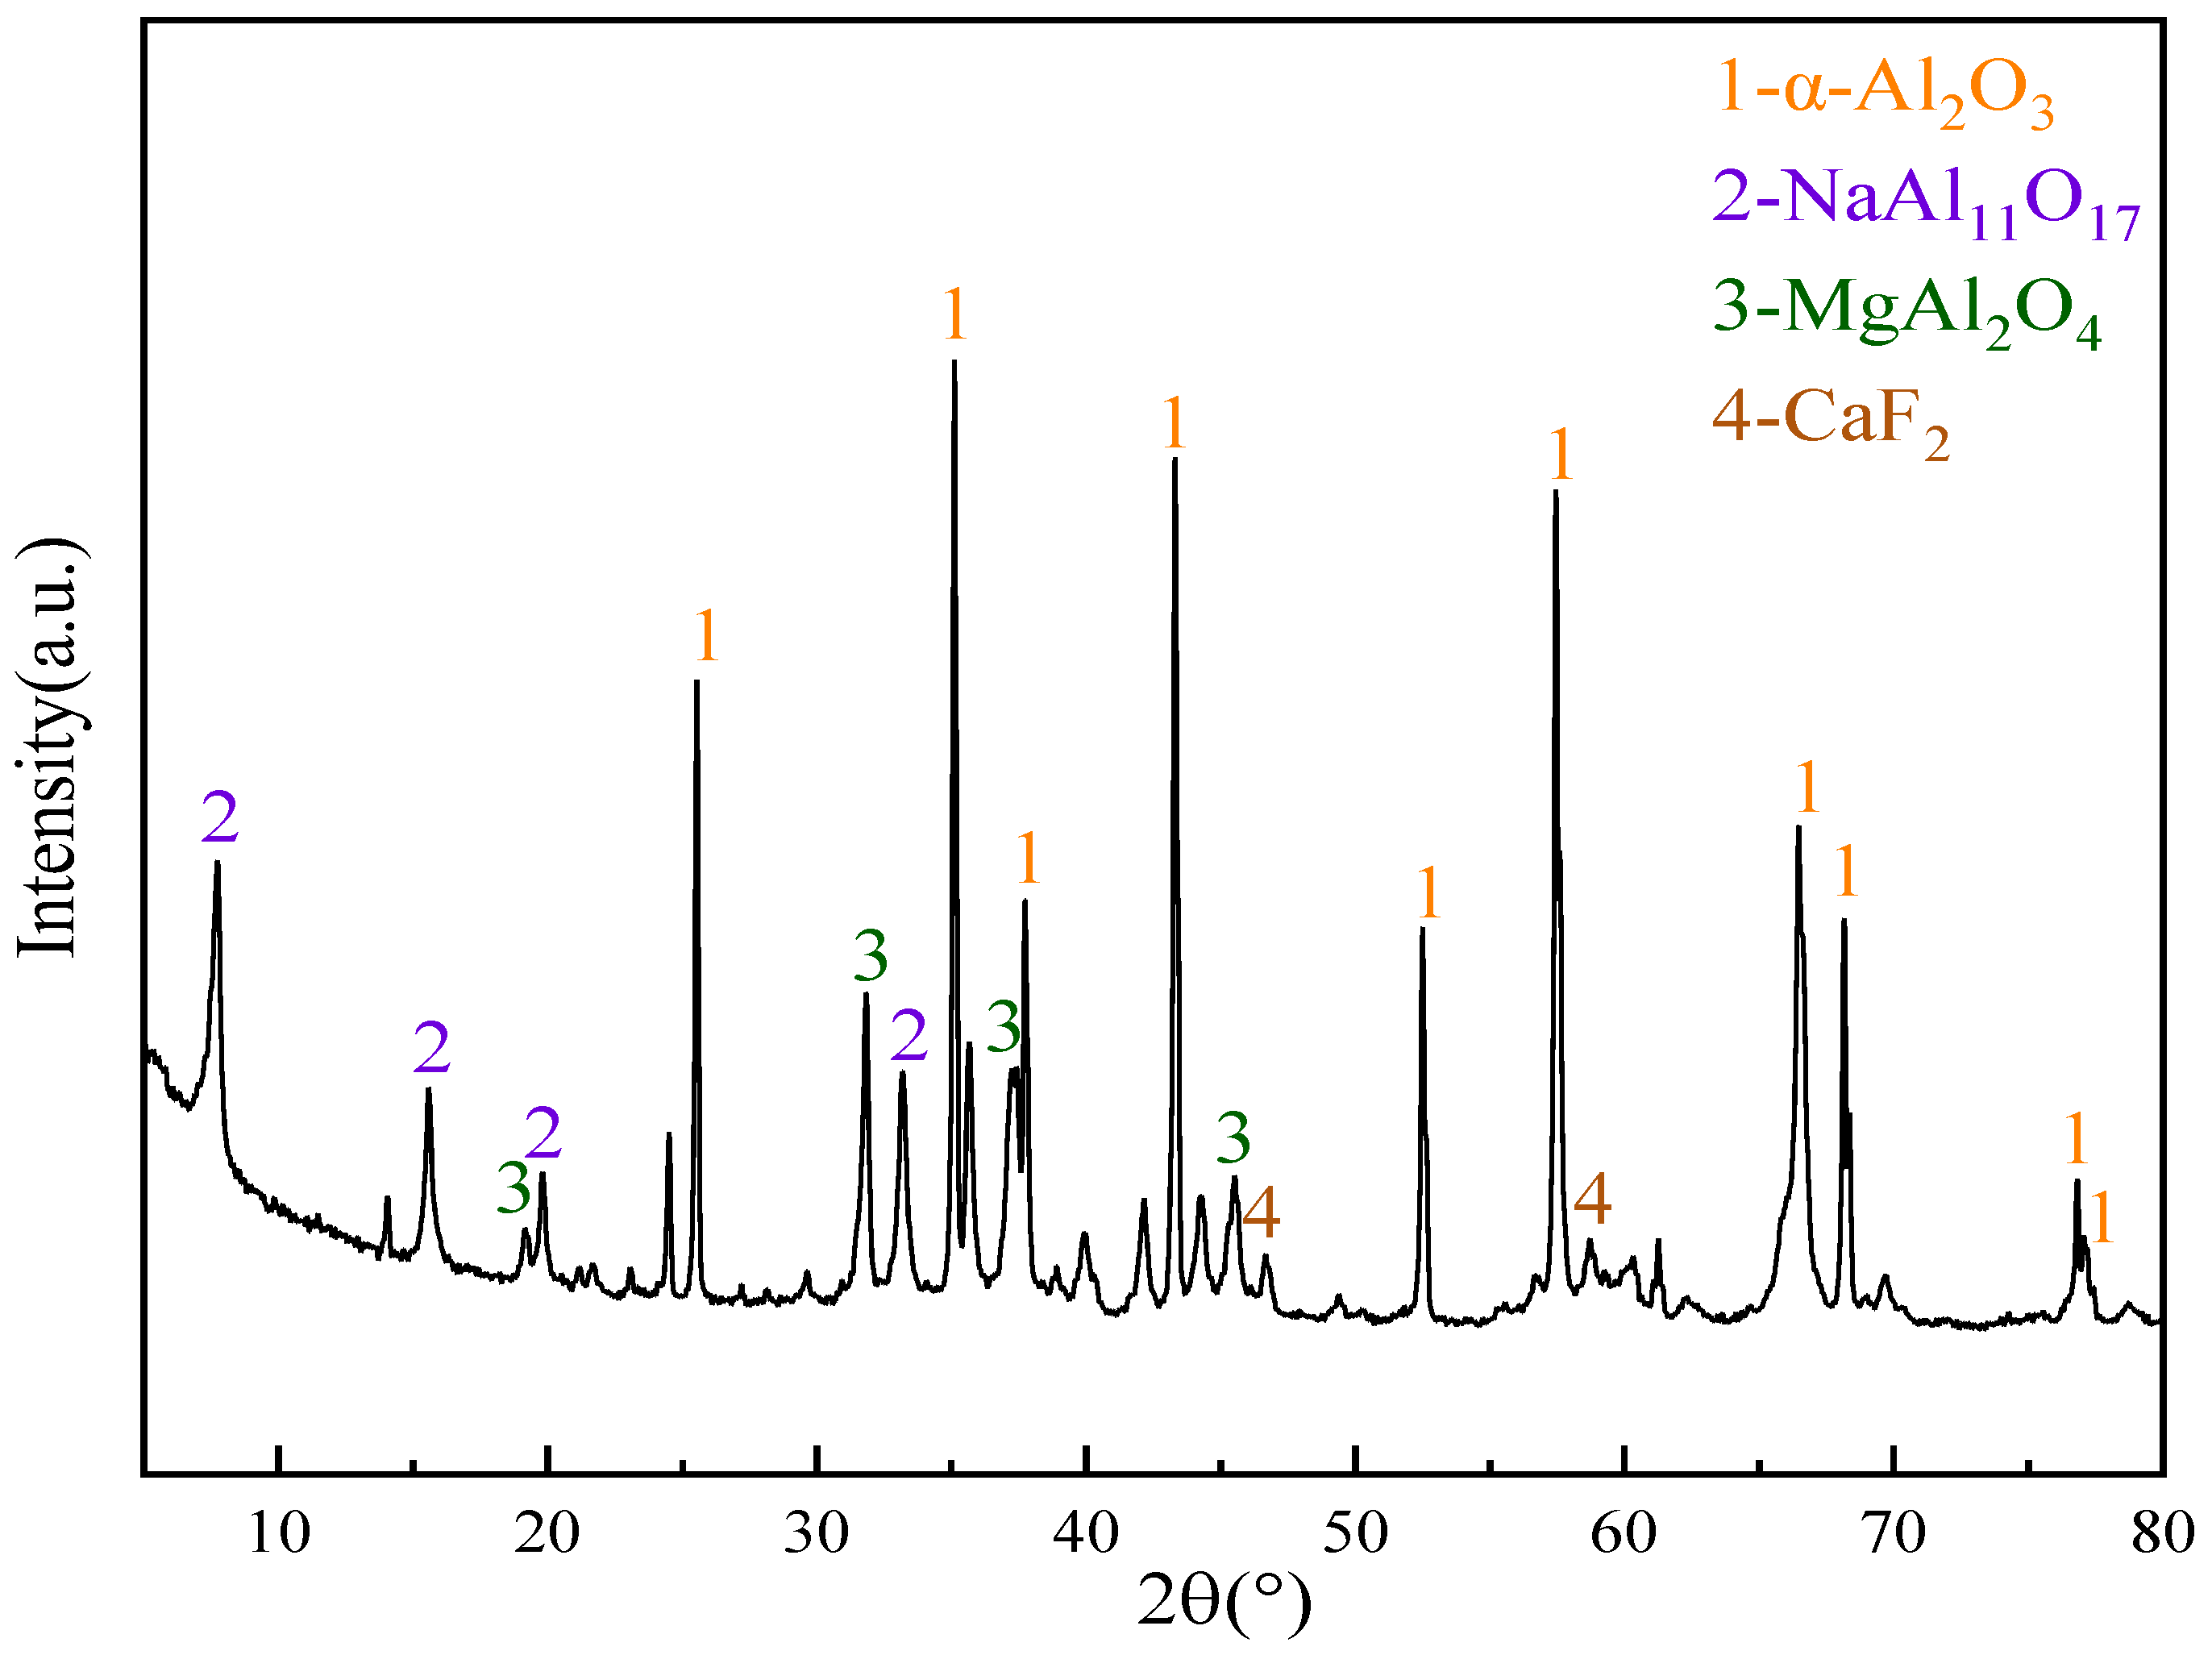
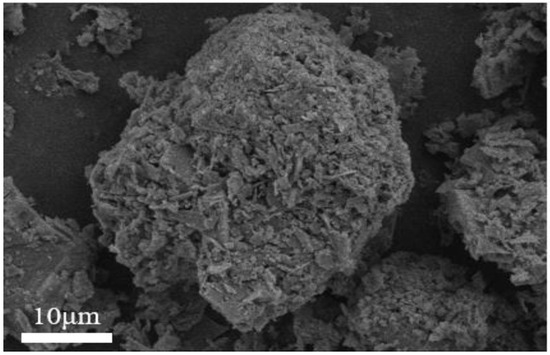
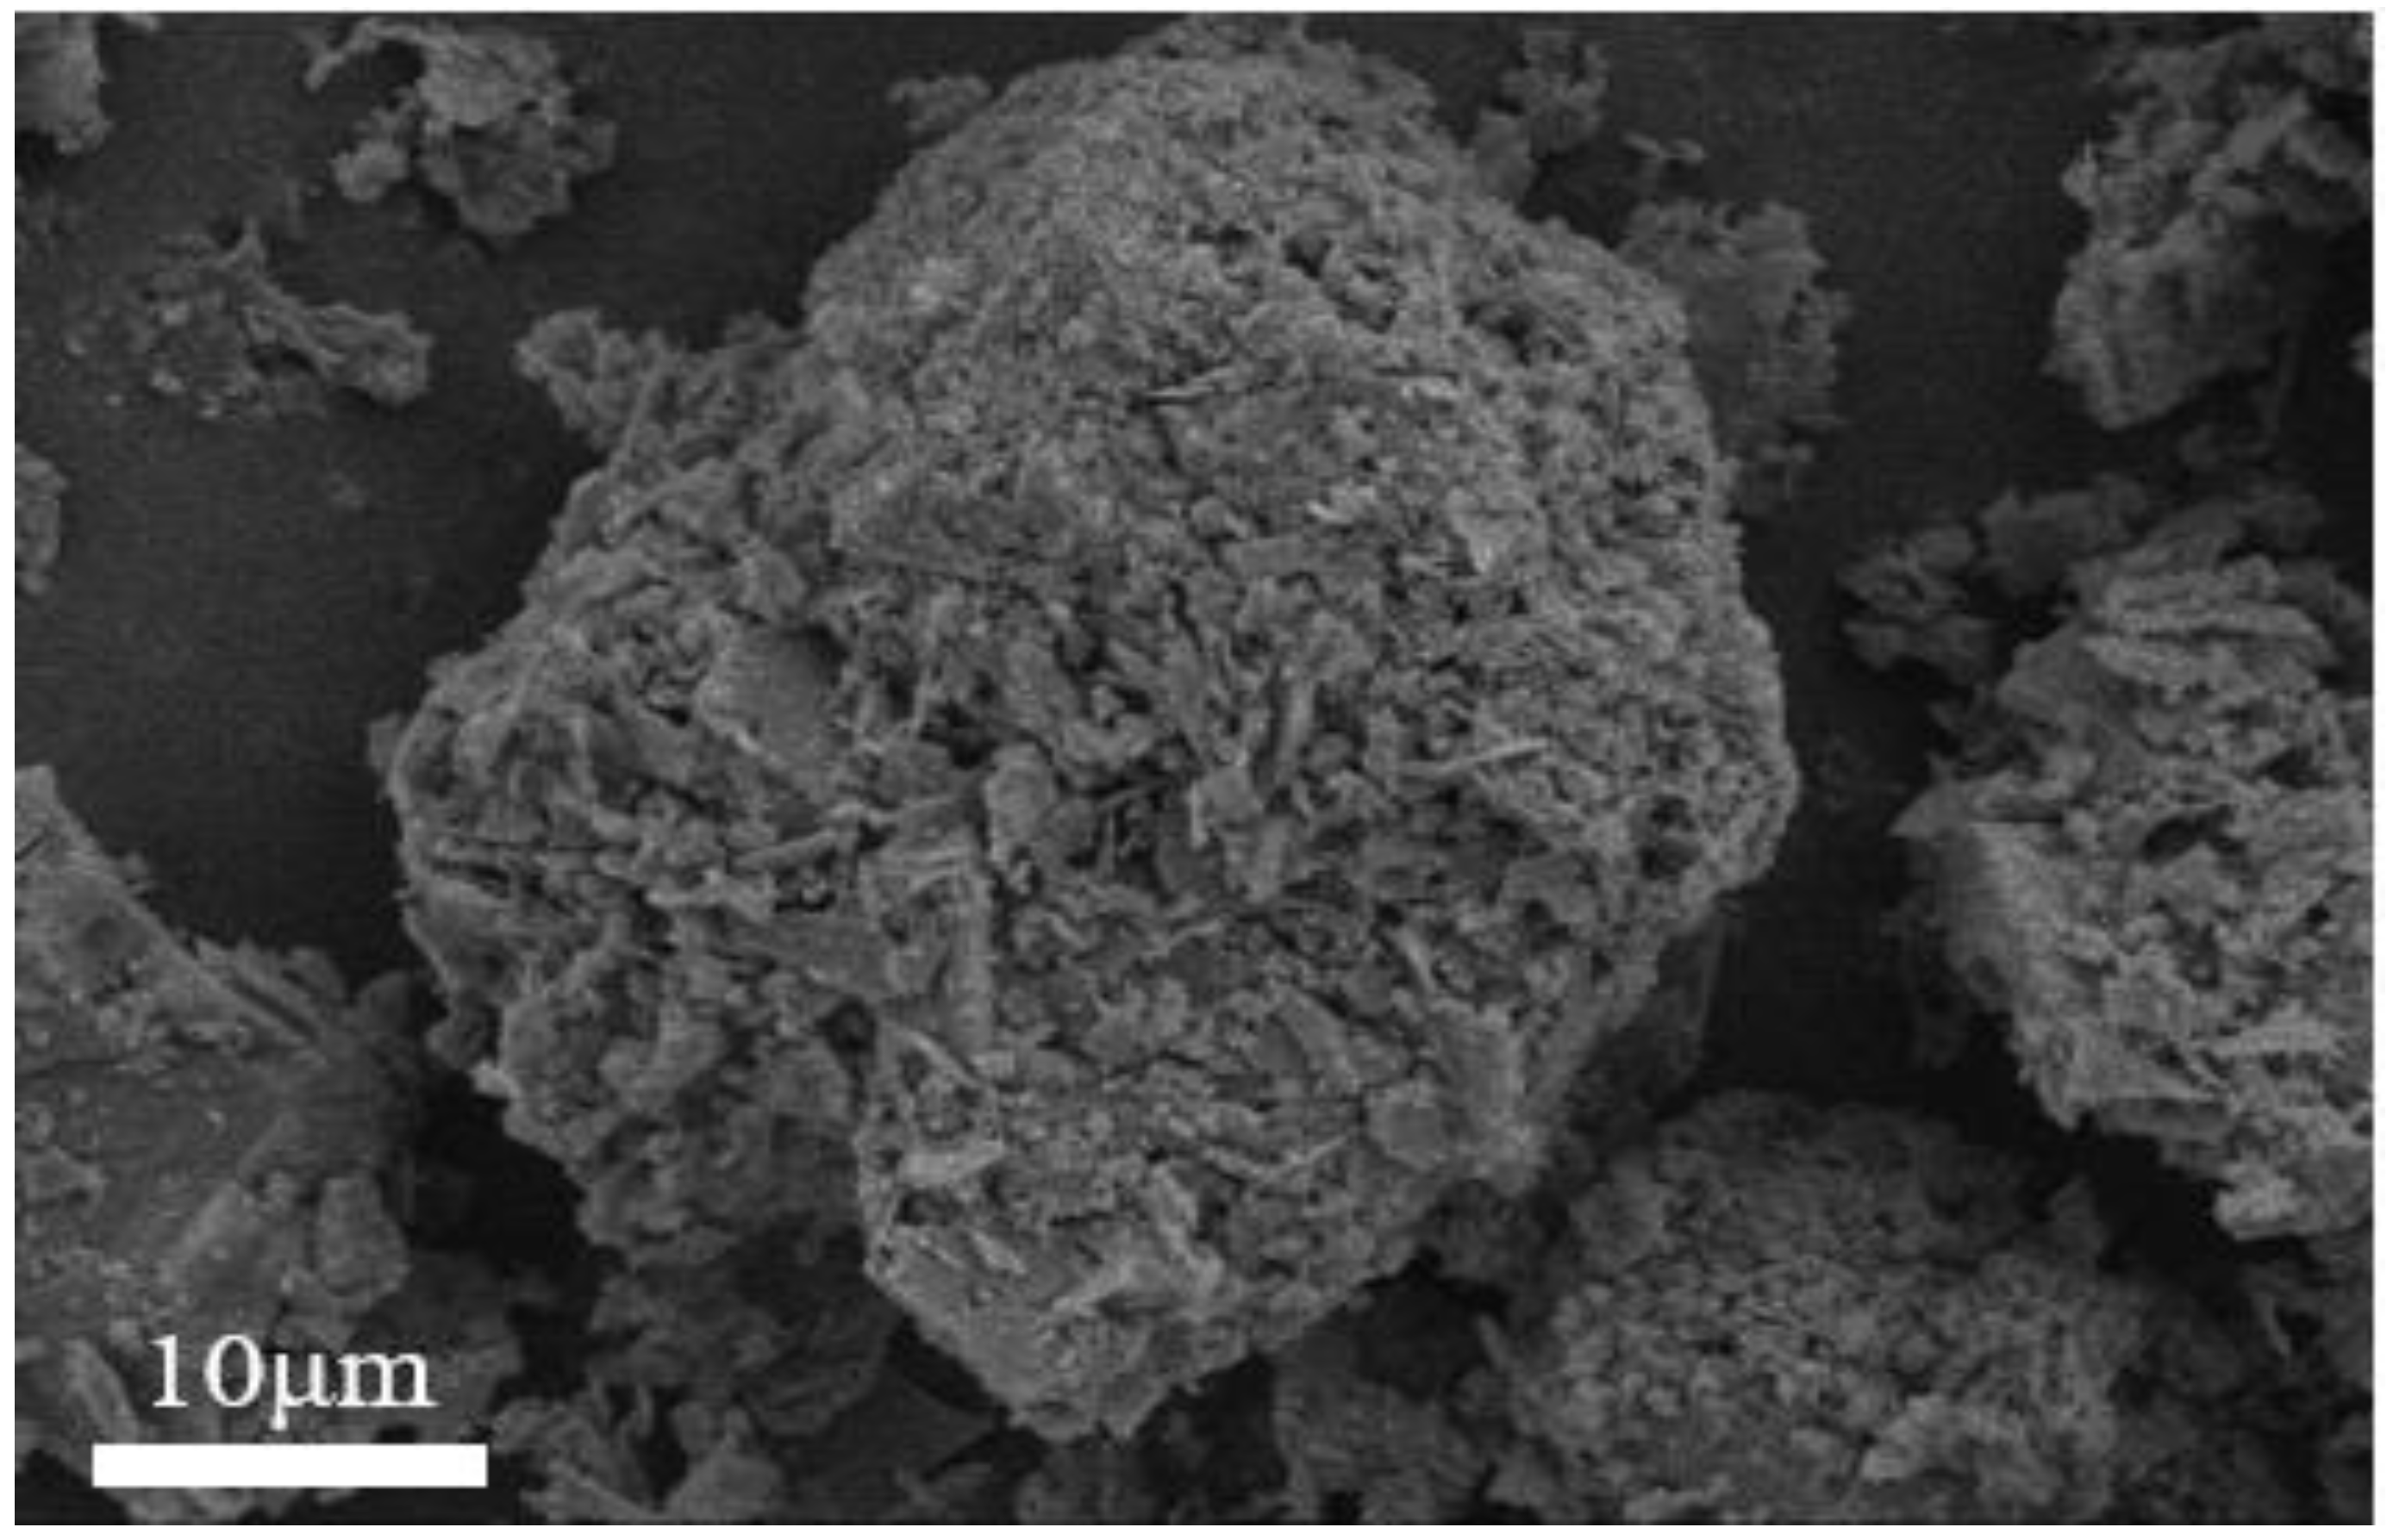
Figure 16 and Figure 17 present the XRD pattern and SEM images of the low fluorine in the high-alumina residue, respectively. The high-alumina residue consisted of the inert α-Al2O3, NaAl11O17 and MgAl2O4. The weak peaks assigned to CaF2 were also found, and its intensity was much less than that in SAD in Figure 1. The high-alumina residue then acts as raw material in alumina production, with more than 14.4 million tons in 2025 [36]. Furthermore, the residue is also used as raw material for producing refractories [37], cements [38], ceramics [39] and water purifiers [27] without halide volatilization.
Figure 16.
XRD pattern of the residue after roasting–leaching process.
Figure 17.
SEM image of high-alumina residue.
SEM analysis reveals that the residue possesses an irregular morphology, primarily characterized by large, coarse particles. The observed high specific surface area suggests significant potential for adsorbent applications [28,29]. Detailed investigations into the further high-value utilization of this alumina-rich residue will be carried out in the future.
3.5. Safe Utilization of SAD Through Efficient Removal of Harmful Elements
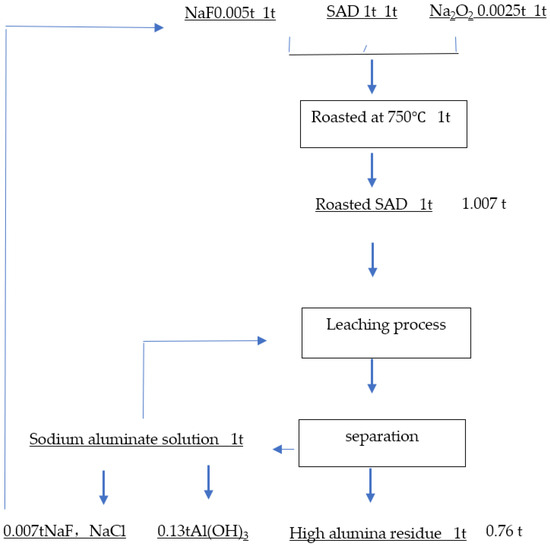
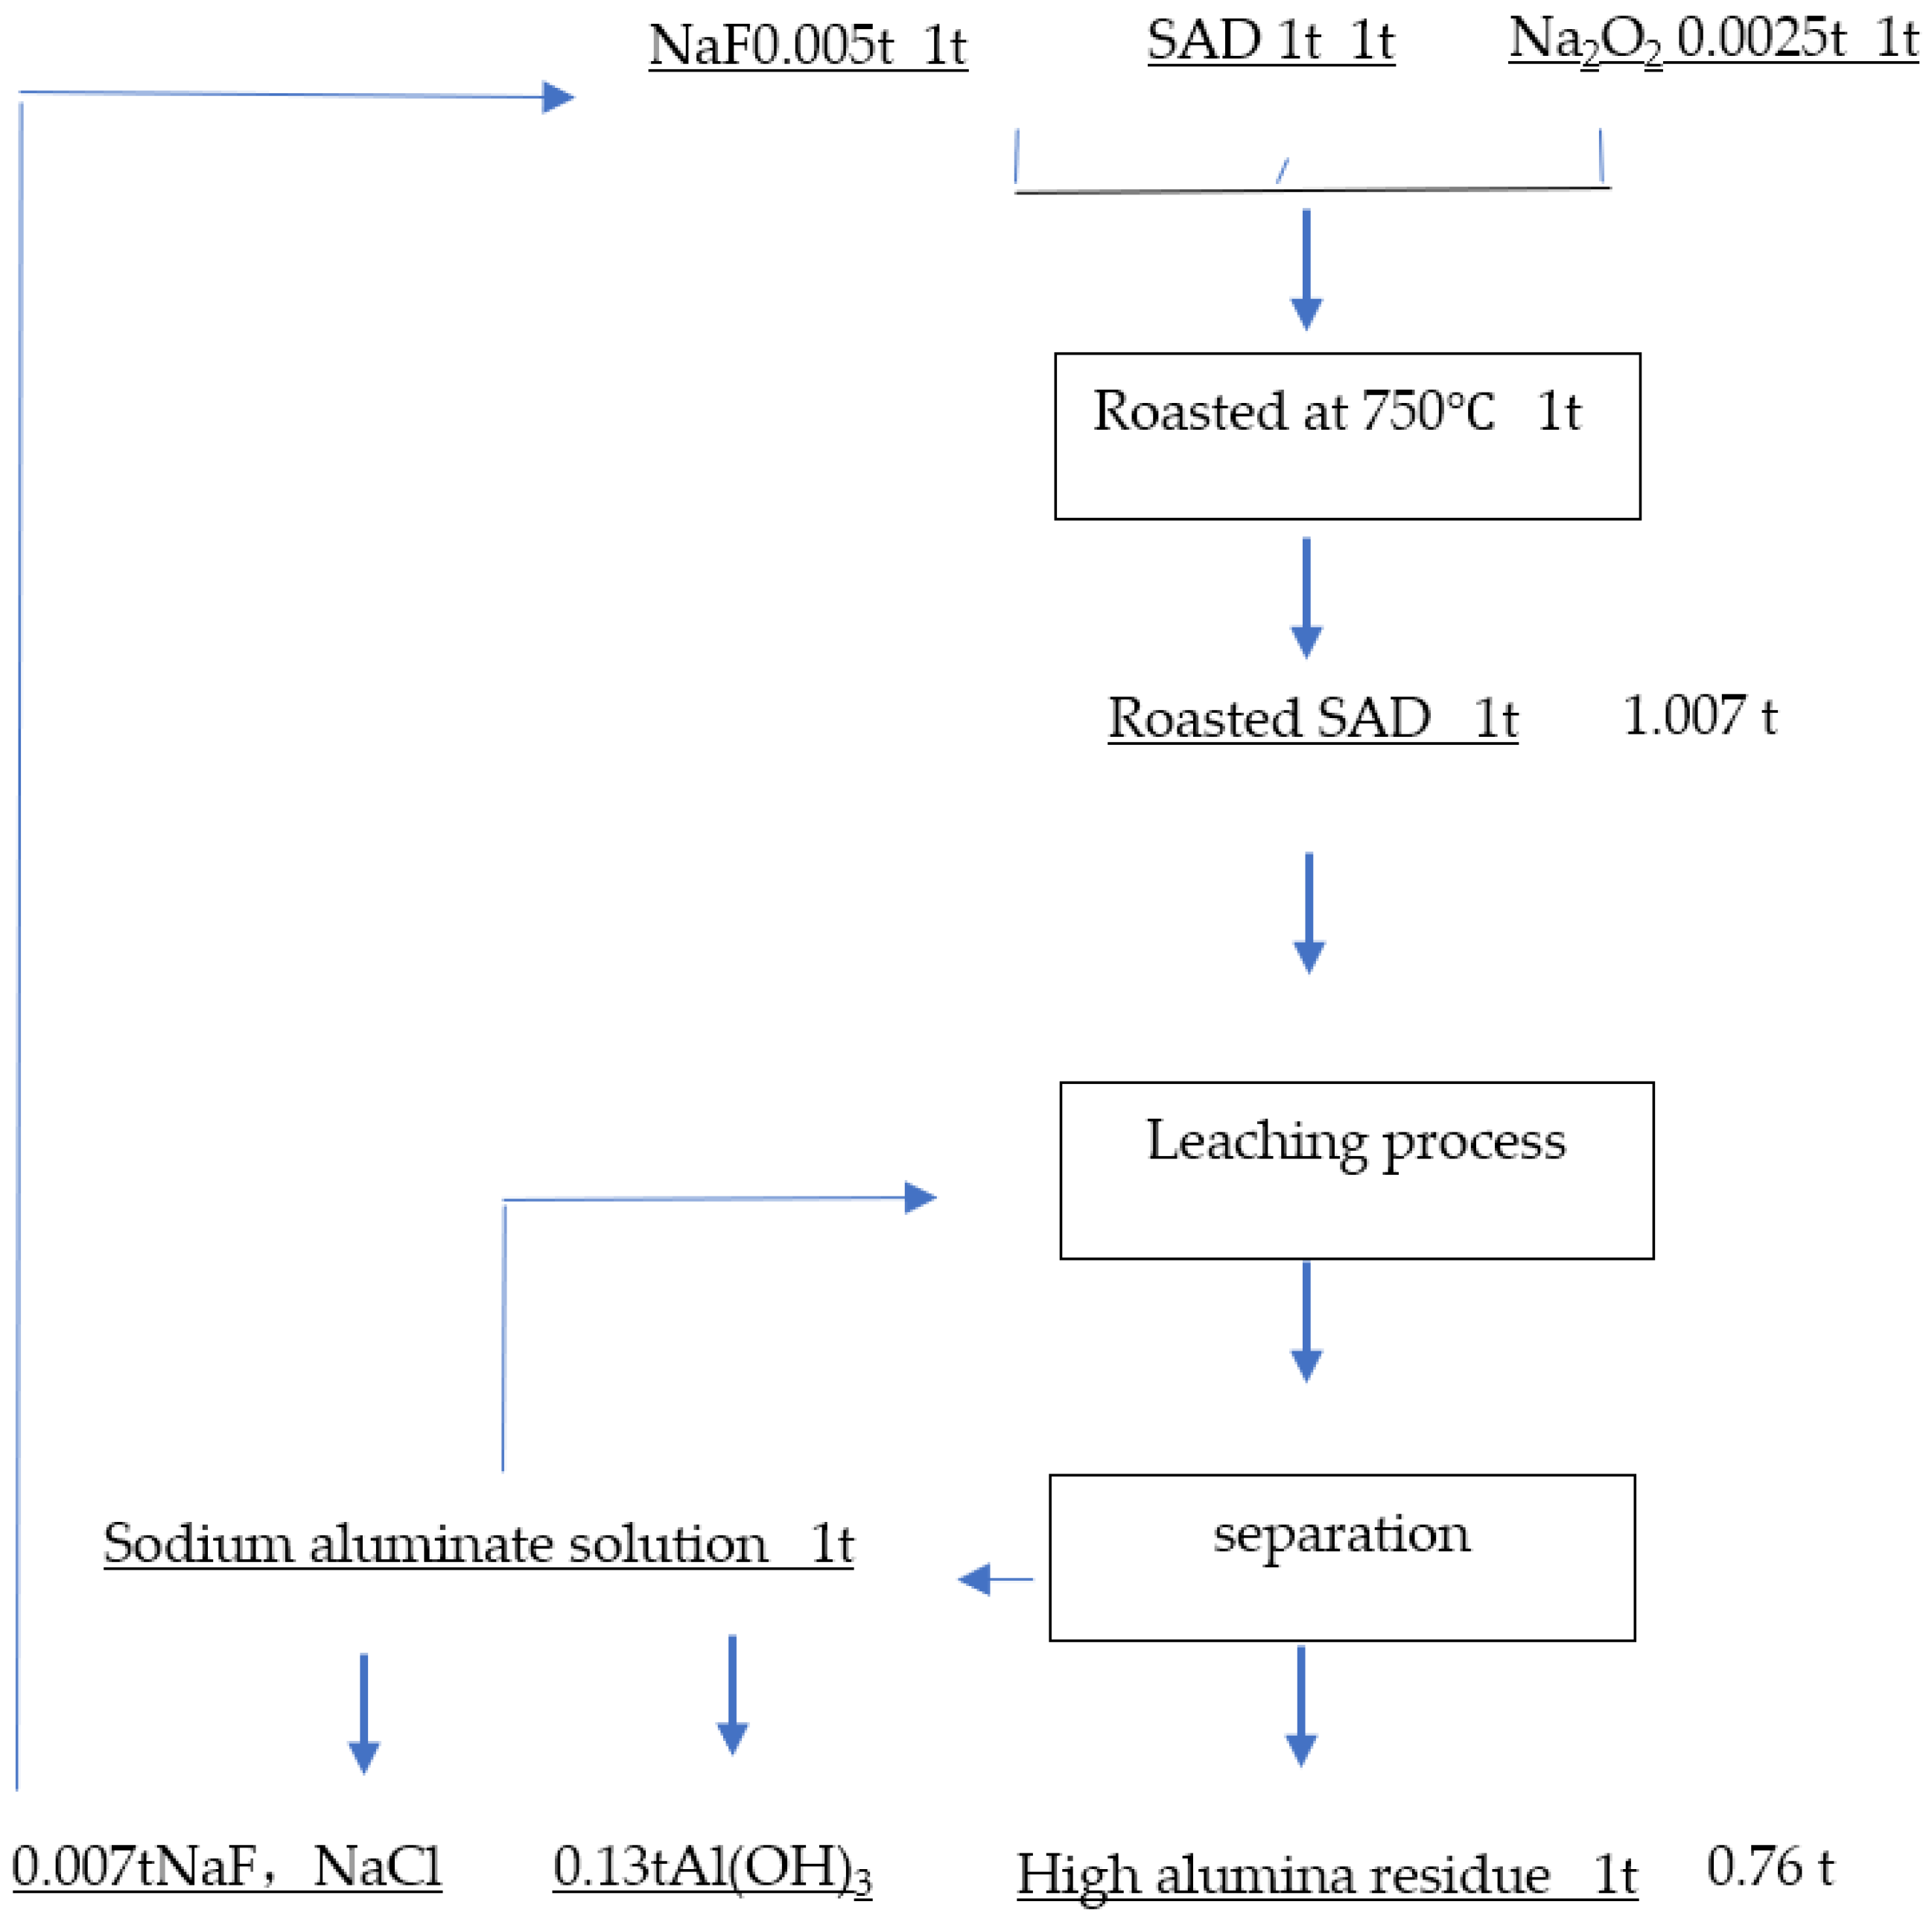
Different from the preparation of notable value-added alumina-bearing products (nano-alumina, water purifier, absorbent, ceramics etc.) through the complex long pyrometallurgy–hydrometallurgy process, value-added high-alumina residue was produced by the following intensified roasting–leaching in the sodium aluminate solution without halide volatilization, residual AlN and NH3, high content of fluorine in products and expensive utilization of irritant and explosive gases (Figure 18).
Figure 18.
Intensified roasting–leaching process to utilize SAD.
Partial NaF was used as additives, while spent sodium aluminate solution returned to the leaching process, both contributing to the green process.
Compared with the traditional route to remove harmful elements, the novel approach provides promising application due to diverse advantages, as shown in Table 6. Without the adverse effects of chlorine, fluorine and AlN, the high-alumina residue can be used as a raw material for alumina production, and its potential applications in refractories, cement, ceramics, and water-purification materials are retained. Ultrafine alumina trihydrate (gibbsite) can be precipitated from dilute sodium aluminate solution, while NaCl and NaF can be recovered from concentrated sodium aluminate solution. The sodium aluminate solution can then be recycled, reducing wastewater generation.
Table 6.
Comparison between Na2O2-NaF roasting–leaching process and representative conventional SAD treatment routes.
In addition, the high-alumina residue has economic potential because of its high alumina content and high alumina-to-silica mass ratio. It may be used as a raw material for alumina, refractories, cement, ceramics, calcium aluminate, and sodium aluminate production, provided that product-specific quality requirements are satisfied.
The recovery of Al(OH)3, NaCl, and NaF would further improve process economics. However, the product-recovery route and cost–benefit balance should be verified in pilot-scale tests.
Pilot-scale experiments and a detailed techno-economic analysis will be carried out in future work to evaluate industrial applicability.
Because the process operated at 750 °C, below the melting points of NaCl (801 °C) and NaF (996 °C), halide volatilization is efficiently restrained. Meanwhile, the high conversion of AlN significantly benefited the leaching process. Waste heat, reaction heat and low-temperature roasting all contributed to the green process. Overall, the proposed process shows promise as a safe, cleaner, and potentially economical route for the comprehensive utilization of SAD, although pilot-scale validation and techno-economic analysis are still required.
4. Conclusions
Increasing the roasting temperature promoted AlN conversion, reaching 91.65% conversion at 750 °C for 3 h without additives. With Na2O2 supplying O2 in situ and NaF acting as a mineralizer, 5% NaF and 2.5% Na2O2 increased the AlN conversion efficiency to 97.01% at 750 °C for 3 h. The formation of NaF, Na2SiO3, and NaAlO2 then contributed to the conversion of AlN and Al and improved the subsequent leaching behavior by uncovering the enveloped AlN and fluorides.
Roasting markedly enhanced chlorine and fluorine removal. Higher leaching temperature, longer duration, lower roasted SAD dosage, and higher caustic soda concentration all improved fluorine removal. Under 100 g/L Na2O, 20 g/L roasted SAD, and 100 °C, fluorine and chlorine removal efficiencies reached 92.52% and 99.47%, respectively.
The efficient removal of harmful elements was attributed to intensified oxidation, the disruption of enveloped AlN/fluoride associations, and the integration of low-temperature roasting with alkaline leaching. The final residue contained 74% Al2O3 mainly as α-Al2O3, NaAl11O17, and MgAl2O4, with only 0.19% F and 0.03% Cl. The residue, Al(OH)3, NaCl, and NaF may be recovered as value-added products, while NaF and the sodium aluminate solution can be recycled to reduce halide volatilization and wastewater discharge.
The proposed low-temperature intensified roasting process detoxifies SAD and enables efficient fluorine/chlorine separation through a relatively simple recycling-oriented route. This provides a feasible approach for the safe and high-value utilization of SAD.
Author Contributions
Methodology, N.L., Y.W., A.L. and G.L.; Formal analysis, N.L. and G.L.; Investigation, N.L. and A.L.; Resources, Y.W., Q.L., G.L., T.Q., Q.Z., L.S. and J.G.; Data curation, N.L., Q.L. and A.L.; Writing—original draft, N.L.; Writing—review & editing, N.L. and G.L.; Visualization, N.L., Q.L. and A.L.; Supervision, Y.W., G.L., T.Q., Q.Z., L.S. and J.G.; Project administration, G.L.; Funding acquisition, Y.W., G.L., T.Q., Q.Z., L.S. and J.G. All authors have read and agreed to the published version of the manuscript.
Funding
This research was funded by the Yunnan Provincial Science and Technology Plan Project—Major Science and Technology Special Plan, New Materials Special Project, grant number 202102AB080006.
Data Availability Statement
The original contributions presented in this study are included in the article. Further inquiries can be directed to the corresponding author.
Conflicts of Interest
The authors declare no conflict of interest.
References
- Tsakiridis, P.E. Aluminium Salt Slag Characterization and Utilization—A Review. J. Hazard. Mater. 2012, 217–218, 1–10. [Google Scholar] [CrossRef] [Scilit] [PubMed]
- Mahinroosta, M.; Allahverdi, A. Hazardous Aluminum Dross Characterization and Recycling Strategies: A Critical Review. J. Environ. Manag. 2018, 223, 452–468. [Google Scholar] [CrossRef] [Scilit] [PubMed]
- Power, G.; Loh, J. Organic Compounds in the Processing of Lateritic Bauxites to Alumina. Hydrometallurgy 2010, 105, 1–29. [Google Scholar] [CrossRef] [Scilit]
- Gil, A. Management of the Salt Cake from Secondary Aluminum Fusion Processes. Ind. Eng. Chem. Res. 2005, 44, 8852–8857. [Google Scholar] [CrossRef] [Scilit]
- Manfredi, O.; Wuth, W.; Bohlinger, I. Characterizing the Physical and Chemical Properties of Aluminum Dross. J. Miner. Met. Mater. Soc. 1997, 49, 48–51. [Google Scholar] [CrossRef] [Scilit]
- David, E.; Kopac, J. Hydrolysis of Aluminum Dross Material to Achieve Zero Hazardous Waste. J. Hazard. Mater. 2012, 209–210, 501–509. [Google Scholar] [CrossRef] [Scilit] [PubMed]
- Gil, A.; Korili, S.A. Management and Valorization of Aluminum Saline Slags: Current Status and Future Trends. Chem. Eng. J. 2016, 289, 74–84. [Google Scholar] [CrossRef] [Scilit]
- Li, Q.; Yang, Q.; Zhang, G.; Shi, Q. Investigations on the Hydrolysis Behavior of AlN in the Leaching Process of Secondary Aluminum Dross. Hydrometallurgy 2018, 182, 121–127. [Google Scholar] [CrossRef] [Scilit]
- Li, Y.; Qin, Z.; Li, C.; Qu, Y.; Wang, H.; Peng, L.; Wang, Y. Hazardous Characteristics and Transformation Mechanism in Hydrometallurgical Disposing Strategy of Secondary Aluminum Dross. J. Environ. Chem. Eng. 2021, 9, 106470. [Google Scholar] [CrossRef] [Scilit]
- Yang, J.; Tian, L.; Meng, L.; Wang, F.; Die, Q.; Yu, H.; Yang, Y.; Huang, Q. Thermal Utilization Techniques and Strategies for Secondary Aluminum Dross: A Review. J. Environ. Manag. 2024, 351, 119939. [Google Scholar] [CrossRef] [Scilit] [PubMed]
- Lv, H.; Zhao, H.; Zuo, Z.; Li, R.; Liu, F. A Thermodynamic and Kinetic Study of Catalyzed Hydrolysis of Aluminum Nitride in Secondary Aluminum Dross. J. Mater. Res. Technol. 2020, 9, 9735–9745. [Google Scholar] [CrossRef] [Scilit]
- Wang, C.; Guo, Y.; He, Y.; Li, S.; Liu, J.; Liu, H. Mechanism of the Denitrification of Secondary Aluminum Dross (SAD) During Water Leaching with Delayed Addition of a Low Dosage of Sodium Hydroxide. Hydrometallurgy 2024, 226, 106318. [Google Scholar] [CrossRef] [Scilit]
- Wen, J.; Liu, G.; Qi, T.; Zhou, Q.; Peng, Z.; Shen, L.; Wang, Y.; Shi, Z.; Zhao, J. Safe Comprehensive Utilization of the Hazardous Secondary Aluminum Dross: Mechanism and Technology. J. Environ. Chem. Eng. 2025, 13, 115939. [Google Scholar] [CrossRef] [Scilit]
- Meshram, A.; Singh, K.K. Recovery of Valuable Products from Hazardous Aluminum Dross: A Review. Resour. Conserv. Recycl. 2018, 130, 95–108. [Google Scholar] [CrossRef] [Scilit]
- Zhu, X.; Yang, J.; Yang, Y.; Huang, Q.; Liu, T. Pyrometallurgical Process and Multipollutant Co-Conversion for Secondary Aluminum Dross: A Review. J. Mater. Res. Technol. 2022, 21, 1196–1211. [Google Scholar] [CrossRef] [Scilit]
- Zhang, J.; Liu, B.; Shen, H.; Wen, Q.; Liu, Y.; Liu, J.; Zhang, S. Theoretical and Experimental on the Thermodynamic, Kinetic and Phase Evolution Characteristics of Secondary Aluminum Ash. J. Mater. Res. Technol. 2022, 19, 3857–3866. [Google Scholar] [CrossRef] [Scilit]
- Wu, L.; Liu, K.; Zhou, Y.; Wang, J.; Wang, H. Predicting the Thermodynamics of Aluminum Dross Denitrification of Flue Gas. Calphad 2021, 74, 102315. [Google Scholar] [CrossRef] [Scilit]
- Li, S.; Liu, W.; Liu, Z.; He, X. Experimental Study on Oxidizing Roasting Process of Black Dross. Trans. Indian Inst. Met. 2019, 72, 2293–2298. [Google Scholar] [CrossRef] [Scilit]
- Su, Z.; Liu, K.; Lin, K.; Liu, S.; Zhang, Y.; Jiang, T. A Novel Route to Denitrify, Recover Chlorines and Prepare Pre-Melted Refine Slag of 12CaO·7Al2O3 (C12A7) from Secondary Aluminum Dross (SAD). J. Mater. Res. Technol. 2022, 19, 1203–1216. [Google Scholar] [CrossRef] [Scilit]
- Xie, H.; Guo, Z.; Xu, R.; Zhang, Y.; Xu, Z. Synergistic Effect of Inorganic Salt and AlN Removal in the Secondary Aluminum Dross During the Roasting Process. J. Alloys Compd. 2023, 966, 171518. [Google Scholar] [CrossRef] [Scilit]
- Feng, H.; Wang, L.; Li, G.; Jin, Q. Removal of Impurities for the Synthesis of High-Property Alumina-Spinel Ceramic from Secondary Aluminum Dross. Ceram. Int. 2023, 49, 34616–34626. [Google Scholar] [CrossRef] [Scilit]
- Lin, K.; Su, Z.; Xu, J.; Jiang, T.; Zhang, Y. Double-Edged Effects of Aluminosilicates Formation on Denitrification and Desalination during the Leaching Process of Secondary Aluminum Dross (SAD). Sep. Purif. Technol. 2025, 353, 128383. [Google Scholar] [CrossRef] [Scilit]
- Zhao, Y.; Zuo, Z.; Li, Z.; Zhang, J.; Wu, W.F.; Ma, W.P.; Zhu, G.; Li, S.; Wang, F. Preparation of Calcium Aluminate and Spinel by Hydrolysis and Calcination from Secondary Aluminum Dross. Asia-Pac. J. Chem. Eng. 2024, 19, e3117. [Google Scholar] [CrossRef] [Scilit]
- Mahinroosta, M.; Allahverdi, A. A Promising Green Process for Synthesis of High Purity Activated-Alumina Nanopowder from Secondary Aluminum Dross. J. Clean. Prod. 2018, 179, 93–102. [Google Scholar] [CrossRef] [Scilit]
- Gao, Q.; Guo, Q.; Li, Y.; Ren, B.; Fu, M.; Li, H.; Tian, D.; Ding, M. Innovative Technology for Defluorination of Secondary Aluminum Dross by Alkali Leaching. Miner. Eng. 2021, 172, 107134. [Google Scholar] [CrossRef] [Scilit]
- Huang, X.; Wu, W.; Li, Z.; Li, H.; Liu, Q.; Li, S. Spectral Analysis of Fluoride and Nitride Phase in Secondary Aluminum Dross. Spectrosc. Spectr. Anal. 2022, 42, 3588. [Google Scholar]
- Li, L.; Dong, X.; Cheng, Y.; Xue, L.; Yang, J.; Huang, X. Preparation of Polymeric Aluminum Chloride from Secondary Aluminum Dross and Its Water Purification Effect. Can. J. Metall. Mater. Sci. 2025, 64, 1510–1520. [Google Scholar] [CrossRef] [Scilit]
- Azeez, M.A.; Kareem, S.H. Mesoporous γ-Alumina Nanoparticles Synthesis Using Anionic Surfactants as Soft Template and Utilization as Adsorbent for Levofloxacin and Moxifloxacin Drugs. J. Nanotechnol. 2025, 2025, 8637079. [Google Scholar] [CrossRef] [Scilit]
- Vasile, B.S.; Dobra, G.; Iliev, S.; Cotet, L.; Neacsu, I.A.; Nicoara, A.I.; Surdu, V.A.; Boiangiu, A.; Filipescu, L. Thermally Activated Al(OH)3: Part I—Morphology and Porosity Evaluation. Ceramics 2021, 4, 265–277. [Google Scholar] [CrossRef] [Scilit]
- Tang, J.; Liu, G.; Qi, T.; Zhou, Q.; Peng, Z.; Li, X.; Yan, H.; Hao, H. Two-Stage Process for the Safe Utilization of Secondary Aluminum Dross in Combination with the Bayer Process. Hydrometallurgy 2022, 209, 105836. [Google Scholar] [CrossRef] [Scilit]
- Tang, J.; Liu, G.; Qi, T.; Zhou, Q.; Peng, Z.; Li, X.; Wang, Y.; Shen, L.; Zhao, J.; Hao, H. Rich Microbubbles Modifying the Leaching Mechanism of Aluminum and Aluminum Nitride of Secondary Aluminum Dross in Sodium Aluminate Solution. Hydrometallurgy 2022, 214, 105962. [Google Scholar] [CrossRef] [Scilit]
- Zhu, B.; Feng, H.; Zhu, X.; Jin, Q. Preparation of Adsorbent from Secondary Aluminum Dross by Deep Hydrolysis of Active Aluminum Components. J. Environ. Chem. Eng. 2024, 12, 112501. [Google Scholar] [CrossRef] [Scilit]
- Liu, J.; Yin, Z.; Liu, W.; Li, X.; Hu, Q. Treatment of Aluminum and Fluoride during Hydrochloric Acid Leaching of Lepidolite. Hydrometallurgy 2020, 191, 105222. [Google Scholar] [CrossRef] [Scilit]
- Morita, M.; Granata, G.; Tokoro, C. Recovery of Calcium Fluoride from Highly Contaminated Fluoric/Hexafluorosilicic Acid Wastewater. Mater. Trans. 2018, 59, 290–296. [Google Scholar] [CrossRef] [Scilit]
- Zuo, Z.; Lv, H.; Li, R.; Liu, F.; Zhao, H. A New Approach to Recover the Valuable Elements in Black Aluminum Dross. Resour. Conserv. Recycl. 2021, 174, 105768. [Google Scholar] [CrossRef] [Scilit]
- International Aluminium Institute. Alumina Production. Available online: https://international-aluminium.org/statistics/alumina-production/ (accessed on 27 February 2026).
- Wang, C.; Wang, R.; Yang, T.; Xin, Y.; Yao, Z.; Li, P.; Wang, F.; Huang, Y.; Qi, X.; Zhao, J.; et al. The Application of Secondary Aluminum Dross in Refractories: A Review. J. Sustain. Metall. 2026, 12, 64–81. [Google Scholar] [CrossRef] [Scilit]
- Prihartanto, P.; Yuliani, M.; Purwanta, W.; Wiharja, W.; Hanif, M.; Yusuf, N.R.; Sopiah, N.; Hendrayanto, P.A.; Meilani, S.S. Optimizing Ammonia Removal from Secondary Aluminum Dross as a Potential Raw Material Substitution in the Cement Industry. Int. J. Eng. Technol. Innov. 2025, 15, 439–455. [Google Scholar] [CrossRef] [Scilit]
- Cinarli, U.; Turan, A. Investigation of Alumina-Based Ceramic Production from Aluminum Black Dross. Min. Metall. Explor. 2021, 38, 257–267. [Google Scholar] [CrossRef] [Scilit]

Disclaimer/Publisher’s Note: The statements, opinions and data contained in all publications are solely those of the individual author(s) and contributor(s) and not of MDPI and/or the editor(s). MDPI and/or the editor(s) disclaim responsibility for any injury to people or property resulting from any ideas, methods, instructions or products referred to in the content. |
© 2026 by the authors. Licensee MDPI, Basel, Switzerland. This article is an open access article distributed under the terms and conditions of the Creative Commons Attribution (CC BY) license.