Article

Experimental Evaluation of Hydrocarbon Class-Based Evaporative Emissions from Ethanol-Blended Gasoline Using HS-SPME–GC–MS


by
A K M Ahsan Ahmed
and
Douglas E. Raynie
*
Department of Chemistry and Biochemistry, South Dakota State University, Brookings, SD 57007, USA
*
Author to whom correspondence should be addressed.
Separations 2026, 13(7), 187; https://doi.org/10.3390/separations13070187
Submission received: 20 May 2026 / Revised: 20 June 2026 / Accepted: 23 June 2026 / Published: 26 June 2026
(This article belongs to the Section Separation Science in Energies)

Abstract

This study investigated the effect of ethanol on the relative headspace percent composition of evaporative emissions from gasoline at different temperatures using HS-SPME-GC-MS. The results showed that the relative abundance of monoaromatics in the headspace decreased with increasing ethanol content in all tested fuels at all temperatures examined. The paraffins and i-paraffins exhibited a similar decreasing trend in most samples, with reductions more pronounced in E20 (20% ethanol content) than in E10 (10% ethanol content) fuels. The experimental results for the temperature effect on headspace composition were variable: monoaromatics showed slight increases at higher temperatures, whereas paraffins, iso-paraffins, and mononaphthenes generally decreased. However, ethanol addition did not significantly alter these temperature-dependent trends, as similar patterns were observed in both ethanol-blended and ethanol-free fuels. The magnitude of the ethanol effect depended on fuel composition, with the largest reductions in monoaromatic hydrocarbons observed for the high-density gasoline samples. These findings demonstrate that ethanol modifies the relative distribution of hydrocarbon classes in gasoline headspace, with the most pronounced effect being a reduction in monoaromatic hydrocarbons, and highlight the value of class-resolved analysis for understanding fuel evaporation behavior.

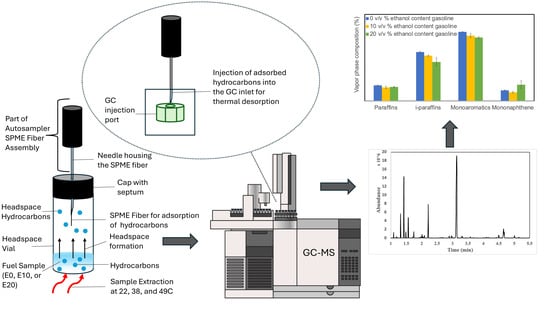
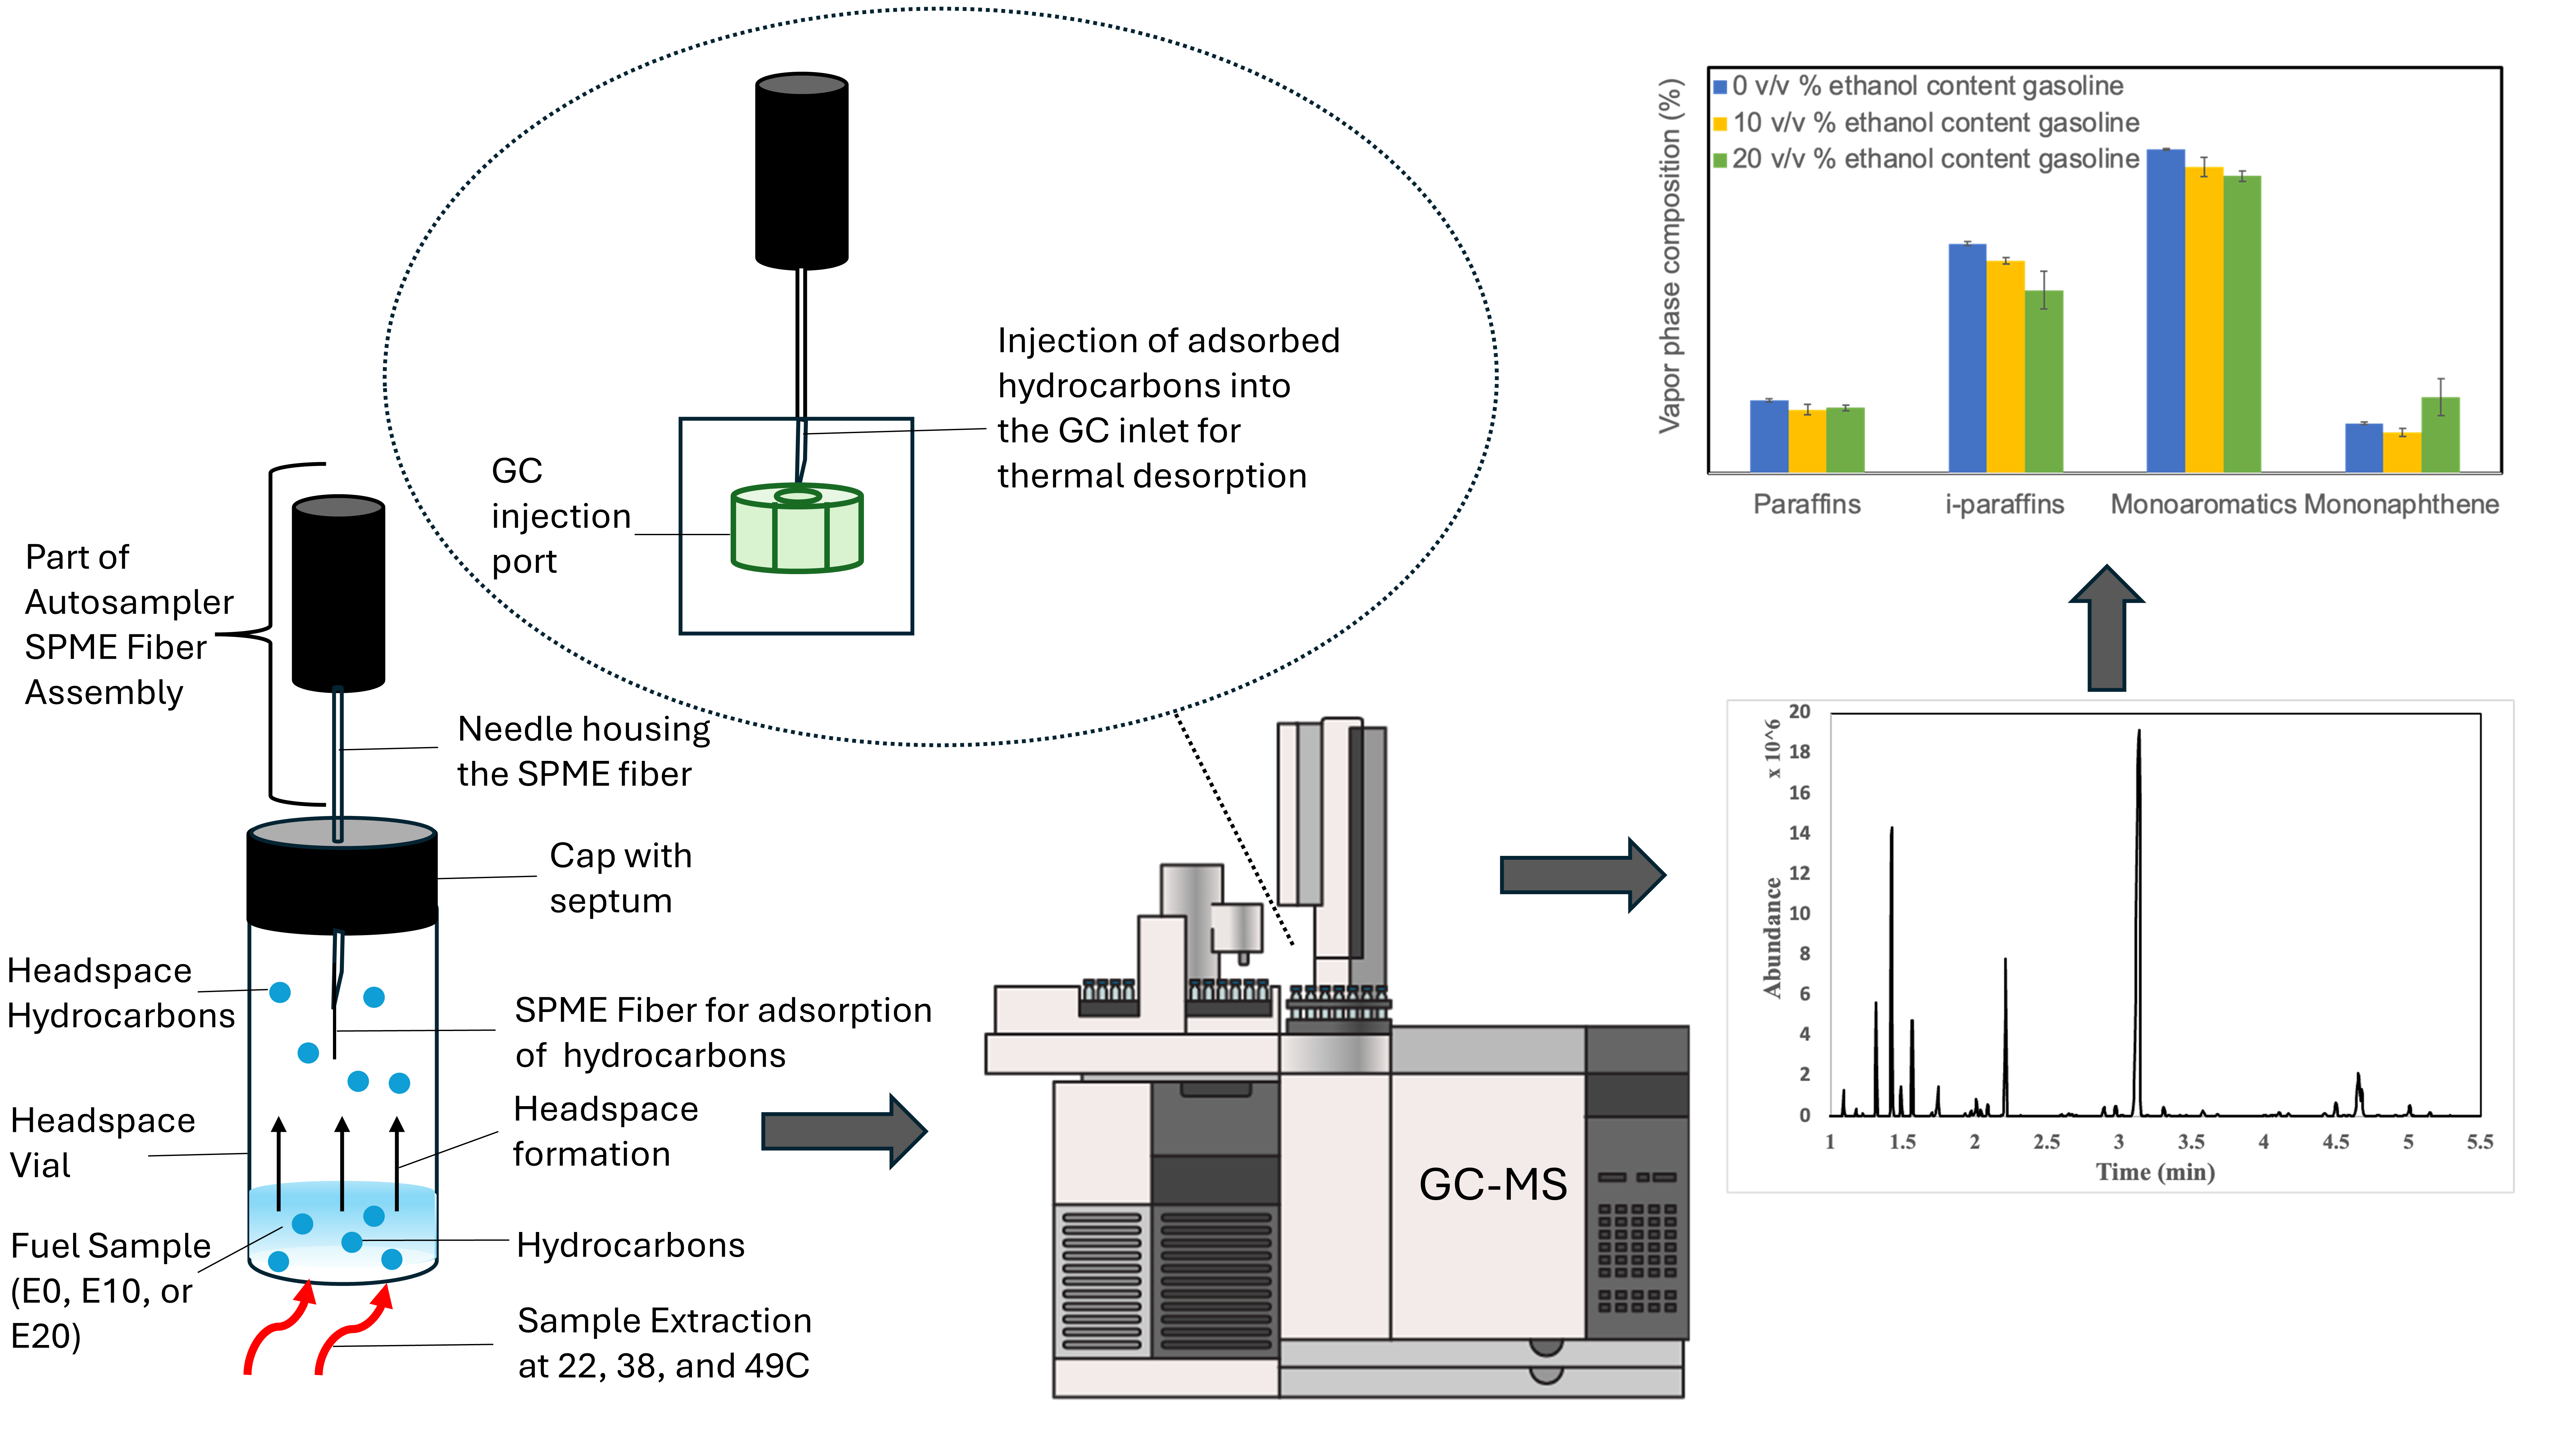
Graphical Abstract

1. Introduction

Gasoline plays a crucial role in the energy sector as a primary fuel for internal combustion engines in vehicles. It provides a convenient and portable source of energy, powering a significant portion of the world’s transportation. The widespread use of gasoline contributes to economic activities, mobility, and the functioning of various industries, making it a key component in the energy landscape.
Gasoline comprises hundreds of hydrocarbons, many of which are highly volatile. The chemical makeup of commercial gasoline is heterogeneous, typically comprising approximately 35% aromatic hydrocarbons, 30% iso-paraffins, 15% n-paraffins, and 12% cycloparaffins, with the remaining fraction consisting of olefins and oxygenated compounds [1]. Among these hydrocarbon classes, aromatics, particularly monoaromatic species such as benzene, toluene, ethylbenzene, and xylenes (BTEX), are of special concern because of their high volatility, toxicological significance, and reactivity in the atmosphere. Benzene is a known carcinogen linked to the development of leukemia and lymphoma [2]. Therefore, comprehensive analysis of hydrocarbon class composition in gasoline vapors is necessary to support environmental assessments and to better understand fuel performance and vapor-phase behavior.
Volatile organic compounds (VOCs) present in gasoline play a significant role in air pollution chemistry at the local, regional, and global levels. There are many ways in which these VOCs can enter the environment and cause air pollution. However, the main anthropogenic sources of VOCs in urban areas originate from automobiles [3]. The most common and discussed pathway for air pollution caused by automobiles is through tailpipe emissions, where they produce many harmful substances such as carbon dioxide, carbon monoxide, nitrogen oxides, particulate matter, and unburned hydrocarbons when gasoline is burned. There is another type of emission, known as evaporative emission, which is mostly affected by ambient temperatures [4]. Evaporative emission may occur from a car’s fuel tank or fuel lines while the car is resting in a parking lot as the temperature rises throughout the day (resting loss or diurnal loss) or from the hot engine and exhaust system when the car is running (running loss). Even when the car is parked and the engine is turned off, emission can still occur as the engine can stay hot for a while (hot soak). Last but not least, evaporative emissions can occur during refueling at gas stations. The resulting vapor-phase mixture reflects preferential evaporation of specific hydrocarbon classes based on volatility and intermolecular interactions, making class-resolved analysis particularly relevant for understanding evaporative emission behavior.
Gasoline sold at service stations commonly contains a certain proportion of ethanol to enhance combustion efficiency and engine performance [5]. Ethanol increases the octane number of gasoline and can partially substitute high-octane aromatic components in the fuel. Because combustion of aromatic hydrocarbons is associated with elevated emissions of carbon monoxide and unburned hydrocarbons, ethanol blending can contribute to reductions in these pollutants [1]. In addition to its combustion benefits, ethanol acts as an oxygenated additive that modifies gasoline volatility and vapor–liquid equilibrium behavior [6]. Although ethanol has a lower vapor pressure than gasoline, blending does not exhibit ideal solution behavior [6,7]; consequently, the overall vapor pressure of ethanol–gasoline mixtures cannot be predicted directly. Indeed, several studies have reported increases in vapor pressure upon ethanol addition [7,8], reflecting non-ideal interactions within the mixture. These volatility changes influence the distribution of hydrocarbon classes in the vapor phase, where ethanol–hydrocarbon interactions may preferentially enhance the evaporation of lighter paraffinic and monoaromatic fractions, highlighting the need for analytical approaches capable of resolving hydrocarbon groups in complex gasoline vapor matrices.
Evaporative emissions are commonly evaluated using the scaled housing for evaporative determination (SHED) method, which yields bulk measurements of total hydrocarbons but offers limited information on the compositional distribution of hydrocarbon classes in vapor emissions. From an analytical perspective, this limitation highlights the need for sample preparation methods that enable class-based separation and characterization of evaporative emissions. Such approaches are important for improving the understanding of gasoline vapor composition and emission behavior.
Headspace solid-phase microextraction (HS-SPME) has emerged as an effective sample preparation technique for extraction and preconcentration of volatile organic compounds from complex matrices [9,10]. By integrating sampling, extraction, and enrichment into a single solvent-free step, HS-SPME offers high sensitivity, minimal matrix interference, and strong compatibility with gas chromatography [10]. Gas chromatography–mass spectrometry (GC-MS) is an established technique for the analysis of volatile and semivolatile compounds in crude oil [11], and when combined, HS-SPME-GC-MS can become a powerful technique for efficient separation and semi-quantitative characterization of hydrocarbon classes in gasoline vapor based on structural and chromatographic behavior.
This study used HS-SPME–GC–MS to investigate the effect of ethanol on the relative headspace composition of gasoline emissions, focusing on hydrocarbon class distributions in the headspace. Headspace composition serves as a surrogate for evaporative emissions from gasoline [12]. Gasoline samples with varying ethanol contents were analyzed under controlled conditions representative of resting, refueling, and hot-soak scenarios. The results evaluate how ethanol blending influences paraffinic, naphthenic, and aromatic fractions, with monoaromatics (including BTEX) considered as a key subset of the aromatic fraction. This class-resolved analytical approach provides insight into fuel evaporation behavior and complements conventional total hydrocarbon emission measurements.

2. Materials and Methods

2.1. Test Fuels and Standards

Two gasoline fuels with different densities (medium and high) (supplied by ICM, Inc., Colwich, KS, USA) were used. These fuels were base fuels for E0 (gasoline containing 0% ethanol by volume), E10 (gasoline containing 10% ethanol by volume), and E20 (gasoline containing 20% ethanol by volume). A standard mixture of gasoline fuel was also prepared according to the volume percentage (v/v %) given in Table 1. The composition of the standard mixture was based on the detailed hydrocarbon analysis (DHA) provided by ICM, Inc. Commercially available reference compounds corresponding to the major fuel constituents and hydrocarbon classes of interest were selected for preparation of the mixture. Collectively, the compounds listed in Table 1 represented more than 50 vol% of the high-density gasoline composition reported in the DHA. These compounds are indicative of those contributing to gasoline VOC emissions [13]. Although gasoline contains numerous additional hydrocarbons, these were not included in the standard mixture because they were outside the scope of the present investigation. The chemical purity of the standards used is also given in Table 1. This standard mixture will also be a standard test fuel for E0, E10, and E20. The classification of standard mixture components by hydrocarbon class and chemical structure is provided in Table 2.

2.2. Evaporative Emission Characterization

The purpose of this study was to characterize the headspace composition as a measure of evaporative emissions from ethanol-blended gasoline [12] and to assess the effect of ethanol content and temperature on the distribution of volatile components in the headspace. Samples were analyzed by HS-SPME-GC-MS at room temperature (22 °C), 38 °C, and 49 °C in triplicate. The relative composition of headspace constituents was determined from GC-MS peak area data and expressed as normalized percent peak area.

2.3. Headspace Solid-Phase (HS-SPME) Analysis

One-milliliter samples of gasoline were transferred to 20 mL screw-top headspace vials for analysis. The extraction procedure began with incubating the samples in the SPME agitator at the desired temperature (room temperature, 38 °C, or 49 °C) for five minutes. Then, the components of gasoline were extracted from the headspace of the vial using SPME fiber. The extracted or adsorbed components in the fiber were thermally desorbed at the GC injection port for GC-MS analysis.
The SPME extractor and the fiber used for this experiment were purchased from Supelco (Bellefonte, PA, USA). Three SPME fibers were tested—carboxen/polydimethylsiloxane (CAR/PDMS) (StableflexTM/SS, thickness: 85 μm); divinylbenzene/carboxen/polydimethylsiloxane (DVB/CAR/PDMS) (StableflexTM/SS, thickness: 50/30 μm); and polydimethylsiloxane/divinylbenzene (PDMS/DVB) (StableflexTM/SS, thickness: 65 μm)—and four extraction times—10, 20, 30, and 40 min—were selected for optimization of fibers and extraction time. Before the extraction, all samples were incubated at three different temperatures for 5 min: room temperature, 38 °C, and 49 °C. Each fiber was conditioned for 30 min before the extraction, which was followed by 20 min of post-extraction conditioning, at the manufactured recommended maximum operating temperatures. The liquid sample was under constant agitation at 250 rpm during the incubation and extraction. The extracted sample was desorbed in the injection port of the GC with a temperature of 250 °C for 5 min.

2.4. Gas Chromatography–Mass Spectrometry (GC-MS) Analysis

The extracted components of the gasoline samples were analyzed using an Agilent 7890B gas chromatograph (Agilent Technologies, Little Falls, DE, USA) coupled to an Agilent Technologies 5977B mass spectrometer and fitted with a 30 m × 0.25 mm, 0.25 μm DB-5MS column (Agilent Technologies, Little Falls, DE, USA). The GC method began with an initial oven temperature of 35 °C for 1 min; then, the temperature was ramped at 10 °C/minute to 220 °C and held for 1 min, followed by a final ramp at 50 °C/minute to 250 °C and held for 5 min for a total run time of 26.10 min. The hydrogen carrier flow was kept constant at 1.2 mL/min. Split injection (50:1) was performed with a PAL RSI 120 automatic sampler with an injection port at 250 °C. The mass spectrometer was operated in the electron ionization mode. The transfer line temperature was kept at 250 °C. The MS temperatures were 250 °C for the ion source and 150 °C for the quadrupole. The scan range was 30–400 U (3.9 scans/s). Mass spectrometric analysis was done in full scan mode, and the data were processed using MSD ChemStation software (E.02 Series, Agilent Technologies, Santa Clara, CA, USA).

2.5. Data Analysis

The headspace composition of ethanol and ethanol-blended gasoline samples was evaluated using HS-SPME-GC-MS. The relative composition of individual compounds was determined from the normalized GC-MS peak areas and corrected for the mass spectral relative response ratios of each standard compound. The resulting values were reported as relative percent composition. To determine the composition of hydrocarbon classes, the relative percentages of compounds belonging to the same group were summed. Hydrocarbon classes evaluated included paraffins, iso-paraffins, monoaromatics, and mononaphthenes.
The results are reported as relative headspace abundances and were used to compare compositional differences among gasoline samples with varying ethanol contents and temperatures. All measurements were performed in triplicate, and results are presented as mean values with standard deviation error bars. The reported differences in composition were used to evaluate trends among samples and experimental conditions; no formal statistical significance testing was performed.

3. Results and Discussion

3.1. SPME Fiber and Extraction Time Optimization

The selection of the appropriate SPME fiber coating for any analysis is very important as the amount of analyte extracted depends on the physiochemical properties of the respective fiber coating (stationary phase) [14]. Extraction time is also an important parameter, which is the minimum time required to reach equilibrium and maximum extraction of an analyte.
Three different SPME fibers (Carboxen/Polydimethylsiloxane (CAR/PDMS), Divinylbenzene/Carboxen/Polydimethylsiloxane (DVB/CAR/PDMS), and Polydimethylsiloxane/Carboxen (PDMS/DVB)) were evaluated for the extraction of volatile components from the standard gasoline mixture. As shown in Figure 1a, the CAR/PDMS fiber provided the highest overall peak area response and was therefore selected for subsequent analyses.
The extraction time was then optimized using the CAR/PDMS fiber. As shown in Figure 1b, the total peak area increased from 10 to 30 min and showed no significant increase between 30 and 40 min, with the responses overlapping within the experimental error. This plateau in signal response indicates that near-equilibrium conditions were achieved by approximately 30 min under the selected experimental conditions. Therefore, an extraction time of 30 min was chosen for all subsequent analyses, as it provided the maximum response while minimizing analysis time.

3.2. Quantification of Headspace Vapor Composition Using HS-SPME-GC-MS

The relative headspace composition of standard, high-density gasoline, and medium-density gasoline samples (E0, E10, and E20) was determined at room temperature, 38 °C, and 49 °C using the HS-SPME-GC-MS method described above.
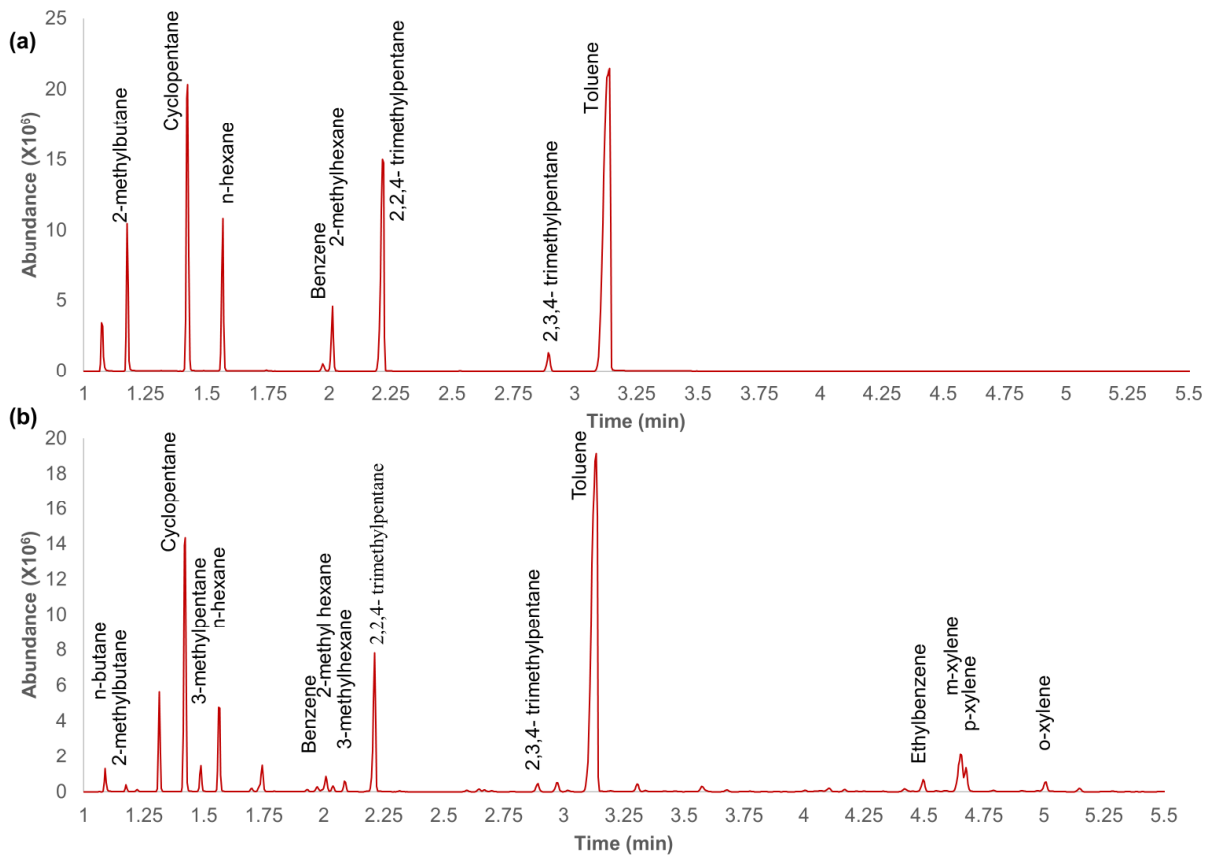
Sample chromatograms of a standard neat solution and a high-density gasoline neat sample are shown in Figure 2.
The retention times for the standard solution were recorded at 1.179 (2-methylbutane), 1.424 (cyclopentane), 1.568 (n-hexane), 1.976 (benzene), 2.015 (2-methylhexane), 2.220 (2,2,4-trimethylpentane), 2.896 (2,3,4-trimethylpentane) and 3.139 min (toluene) and for high-density gasoline were recorded at 1.091 (n-butane), 1.178 (2-methylbutane), 1.423 (cyclopentane), 1.489 (3-methylpentane), 1.566 (n-hexane), 1.975 (benzene), 2.011(2-methylhexane), 2.090 (3-methylhexane), 2.214 (2,2,4-trimethylpentane), 2.894 (2,3,4-trimethylpentane), 3.136 (toluene), 4.499 (ethylbenzene), 4.656 (m-xylene), 4.677 (p-xylene), and 5.009 min (o-xylene). Similar chromatograms were obtained for medium-density gasoline samples. Of the 16 compounds studied, 8 were detected and identified for the standard solution (butane, 2-methylpentane, 3-methylpentane, 3-methylhexane, ethylbenzene, and xylenes could not be detected), while 15 were detected and identified for high-density gasoline samples (2-methylpentane could not be detected). By comparing the retention times of the standard solution and using the database of the National Institute of Standards and Technology (NIST), 15 out of the 16 compounds were detected and identified for both high- and medium-density gasoline samples, while only 8 compounds were detected and identified in the case of the standard samples.
The additional compounds detected in the medium- and high-density gasoline samples but not in the prepared standard are likely attributable to differences between the simplified standard mixture and the more complex gasoline matrix, as well as preferential enrichment of certain volatile constituents in the headspace during HS-SPME extraction. Compound identifications were based on retention time matching and NIST library spectra and should therefore be considered tentative in the absence of confirmation with authentic reference standards.

3.3. Emission Characteristics of Ethanol-Blended Fuel

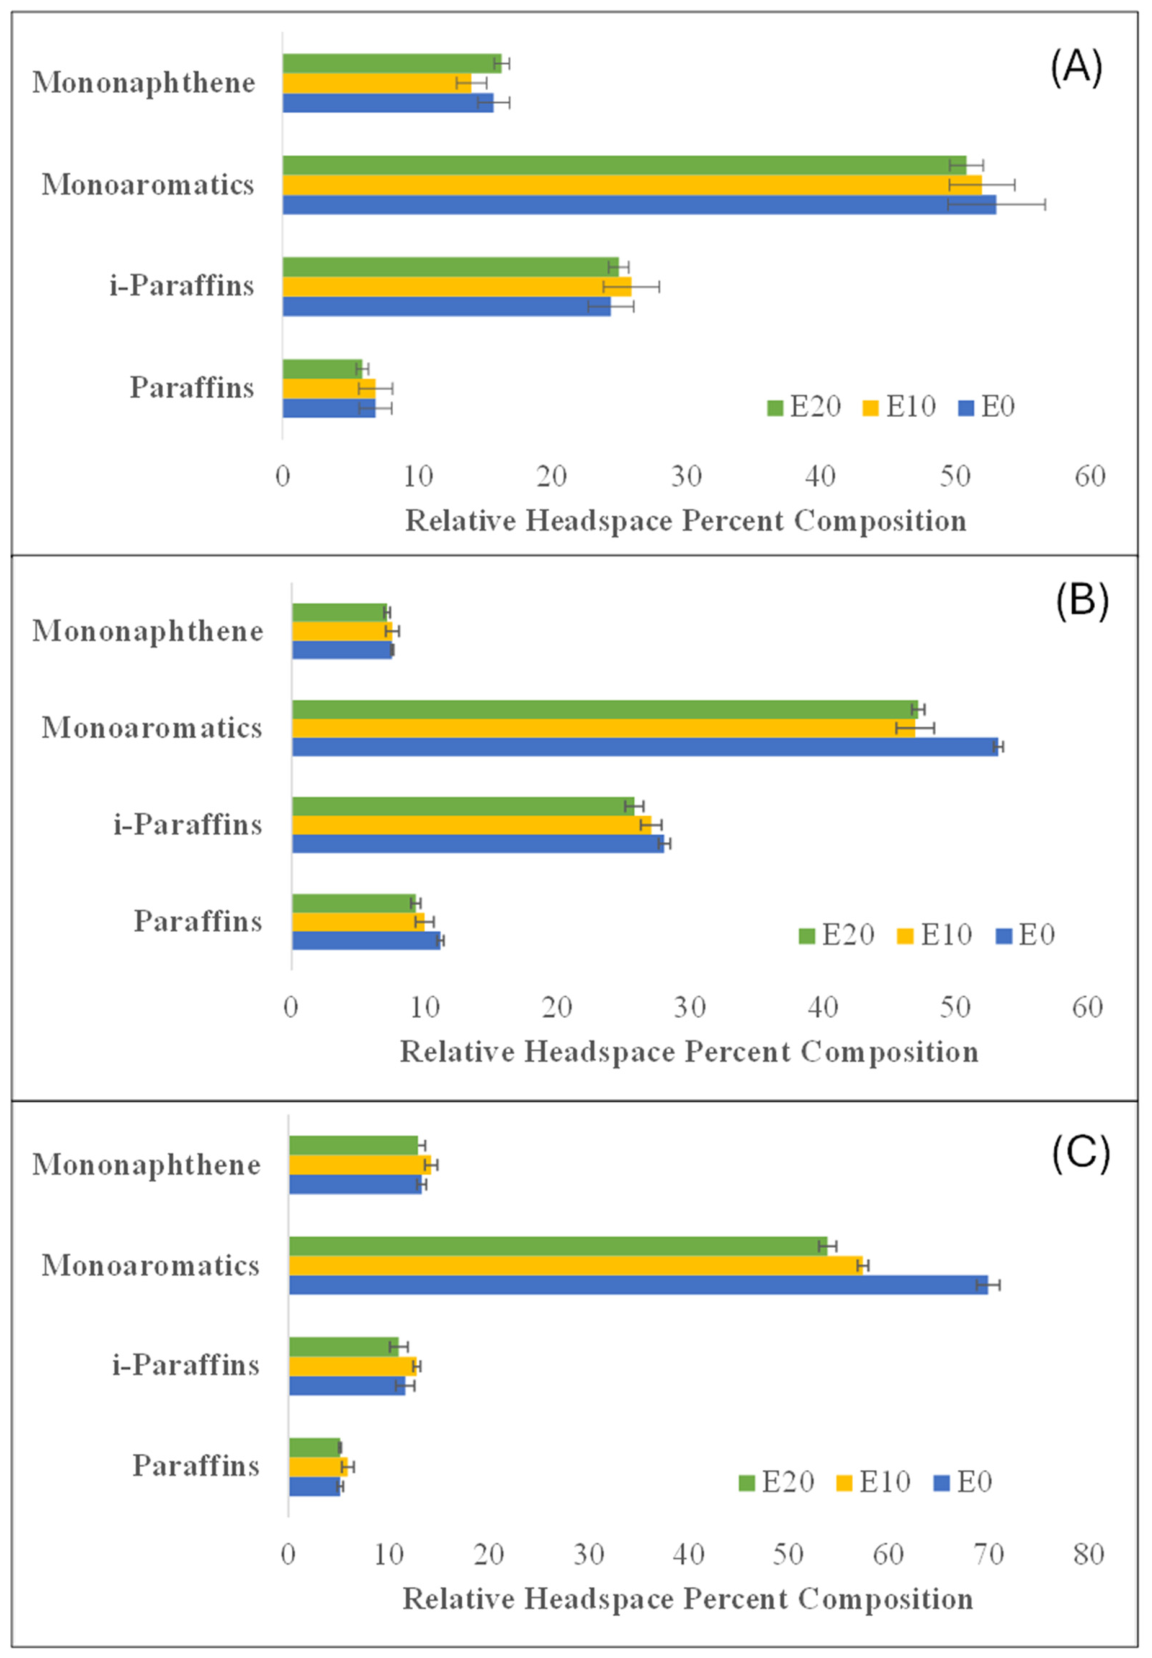
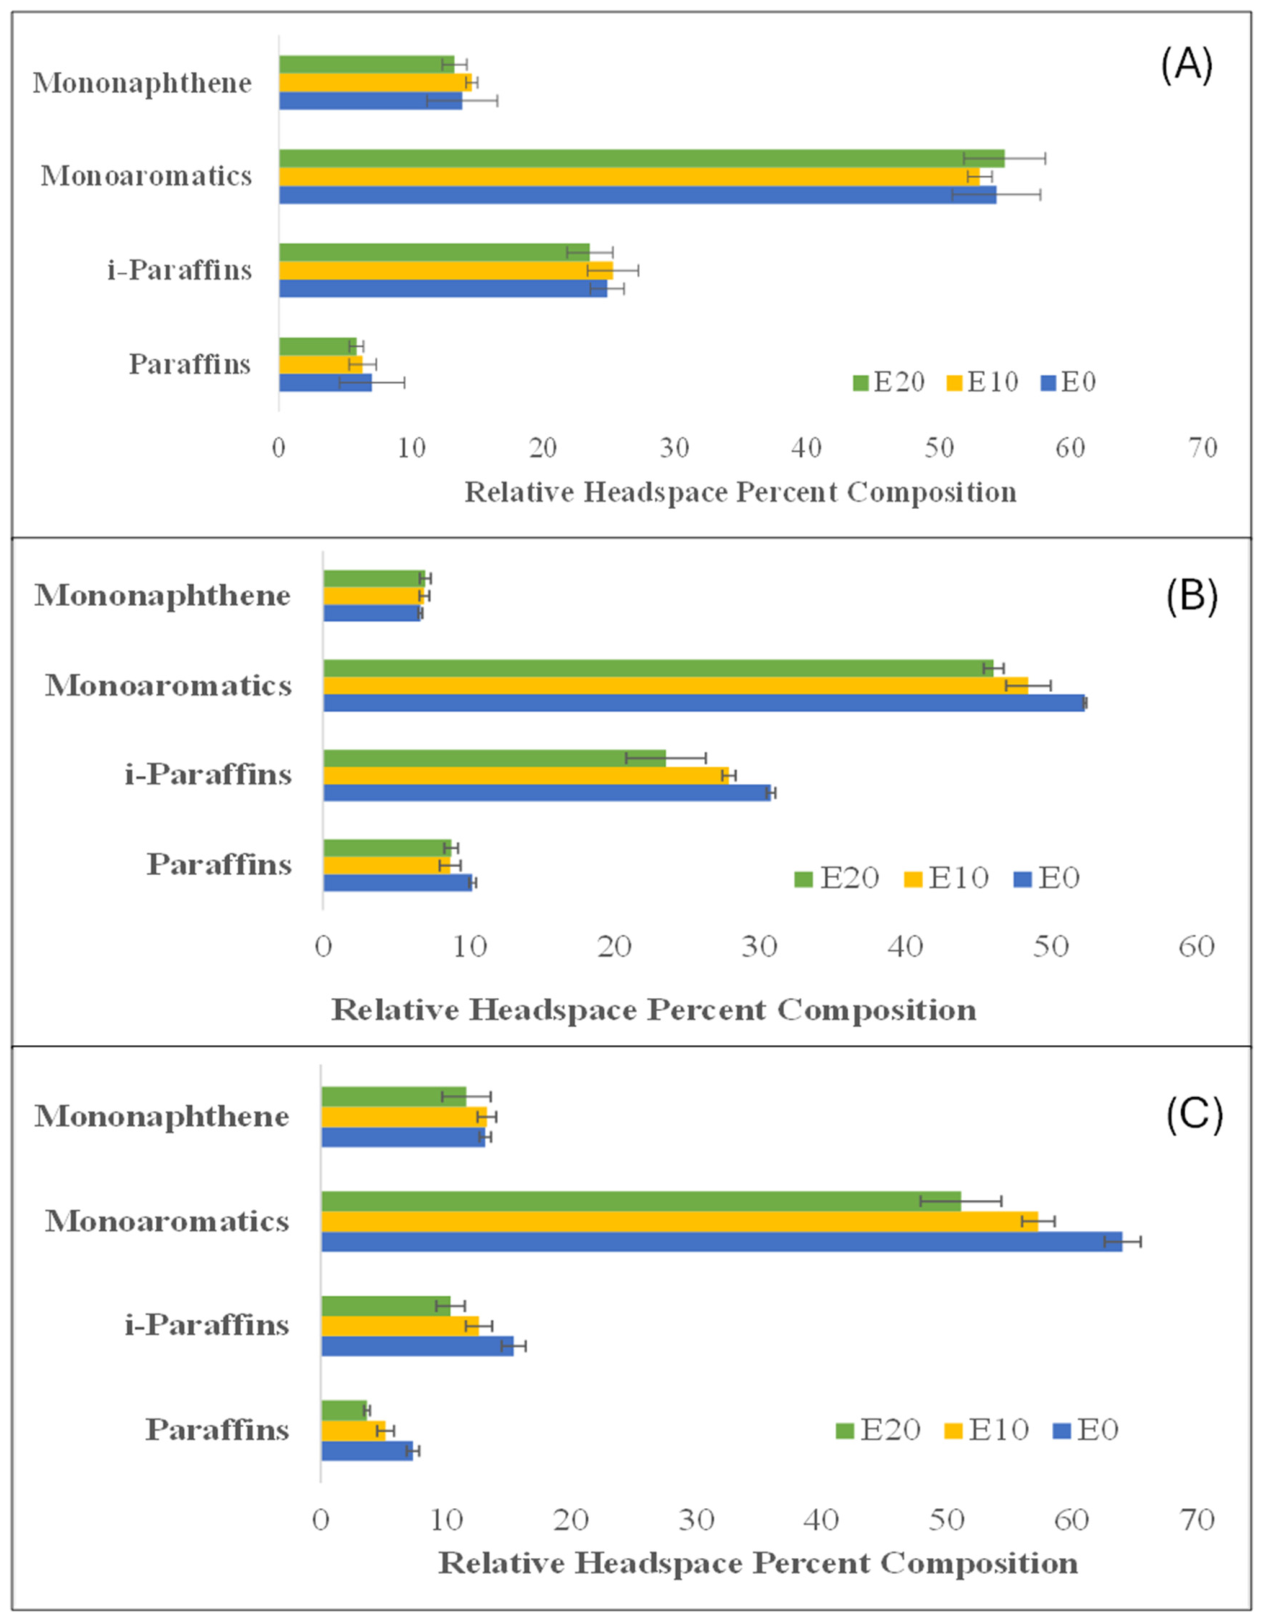
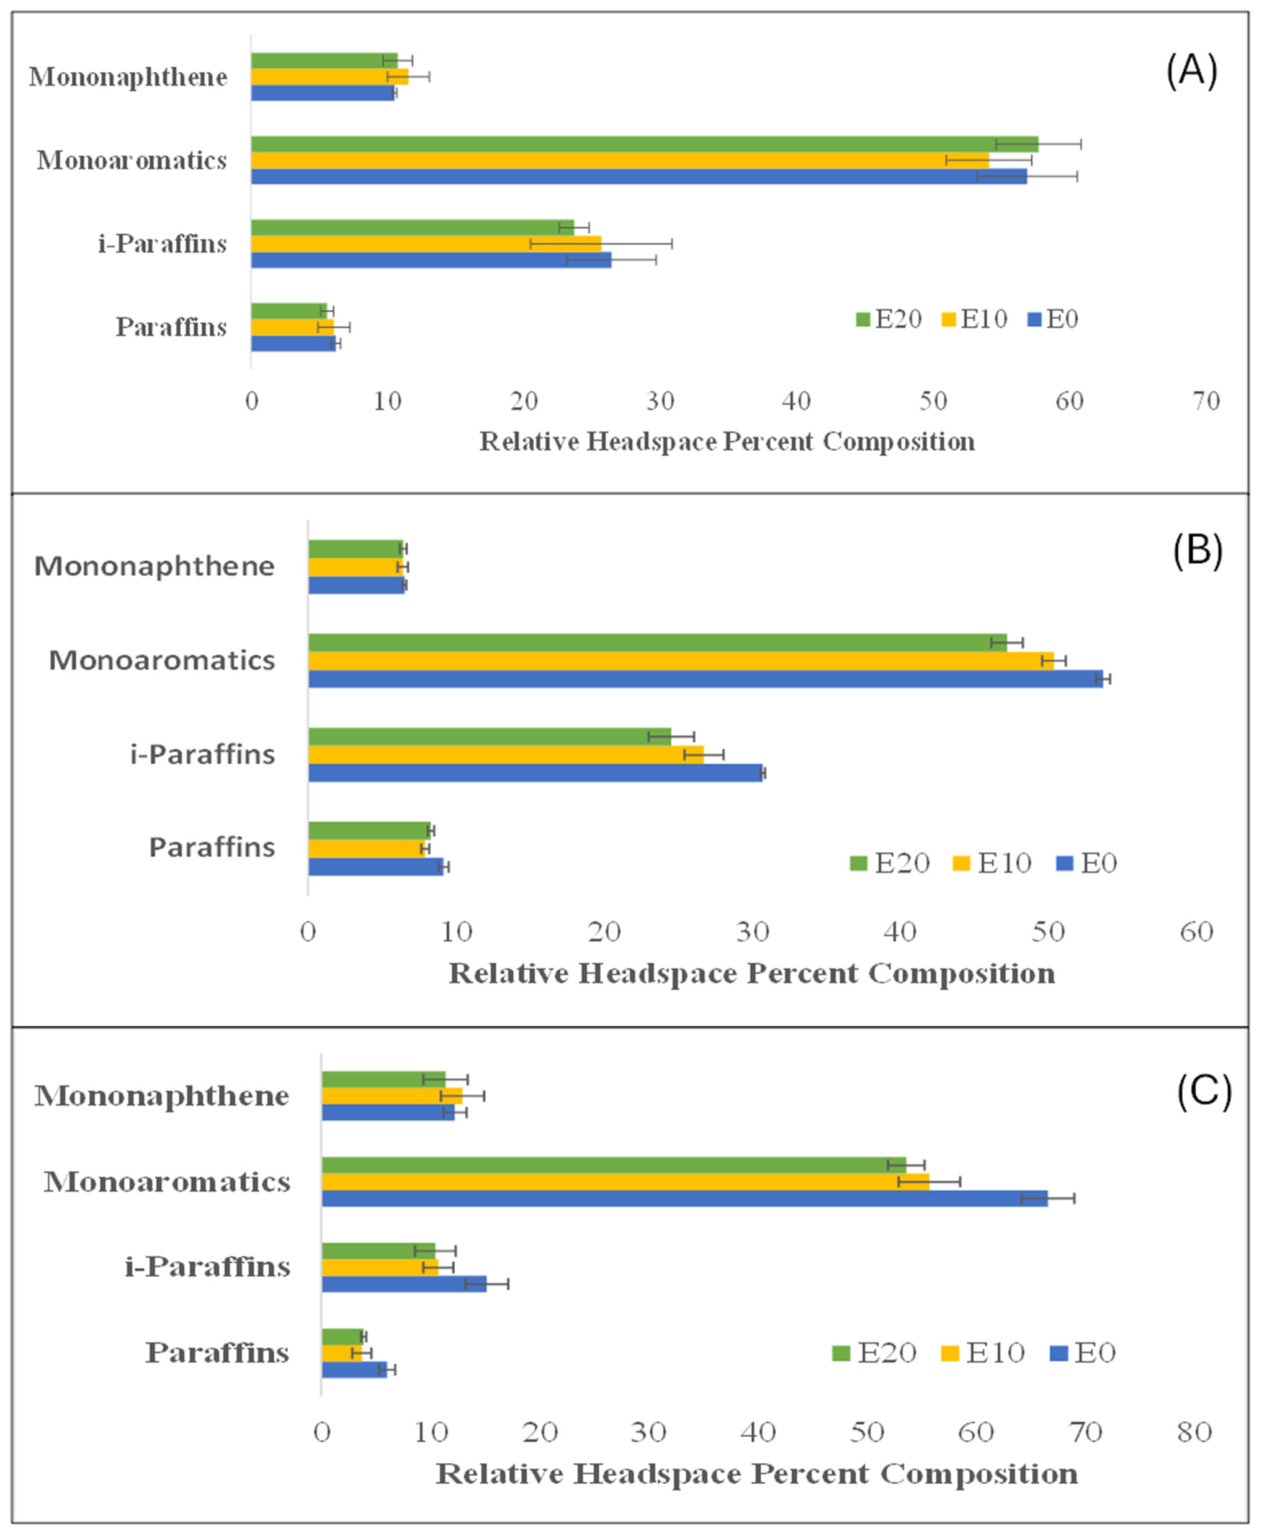
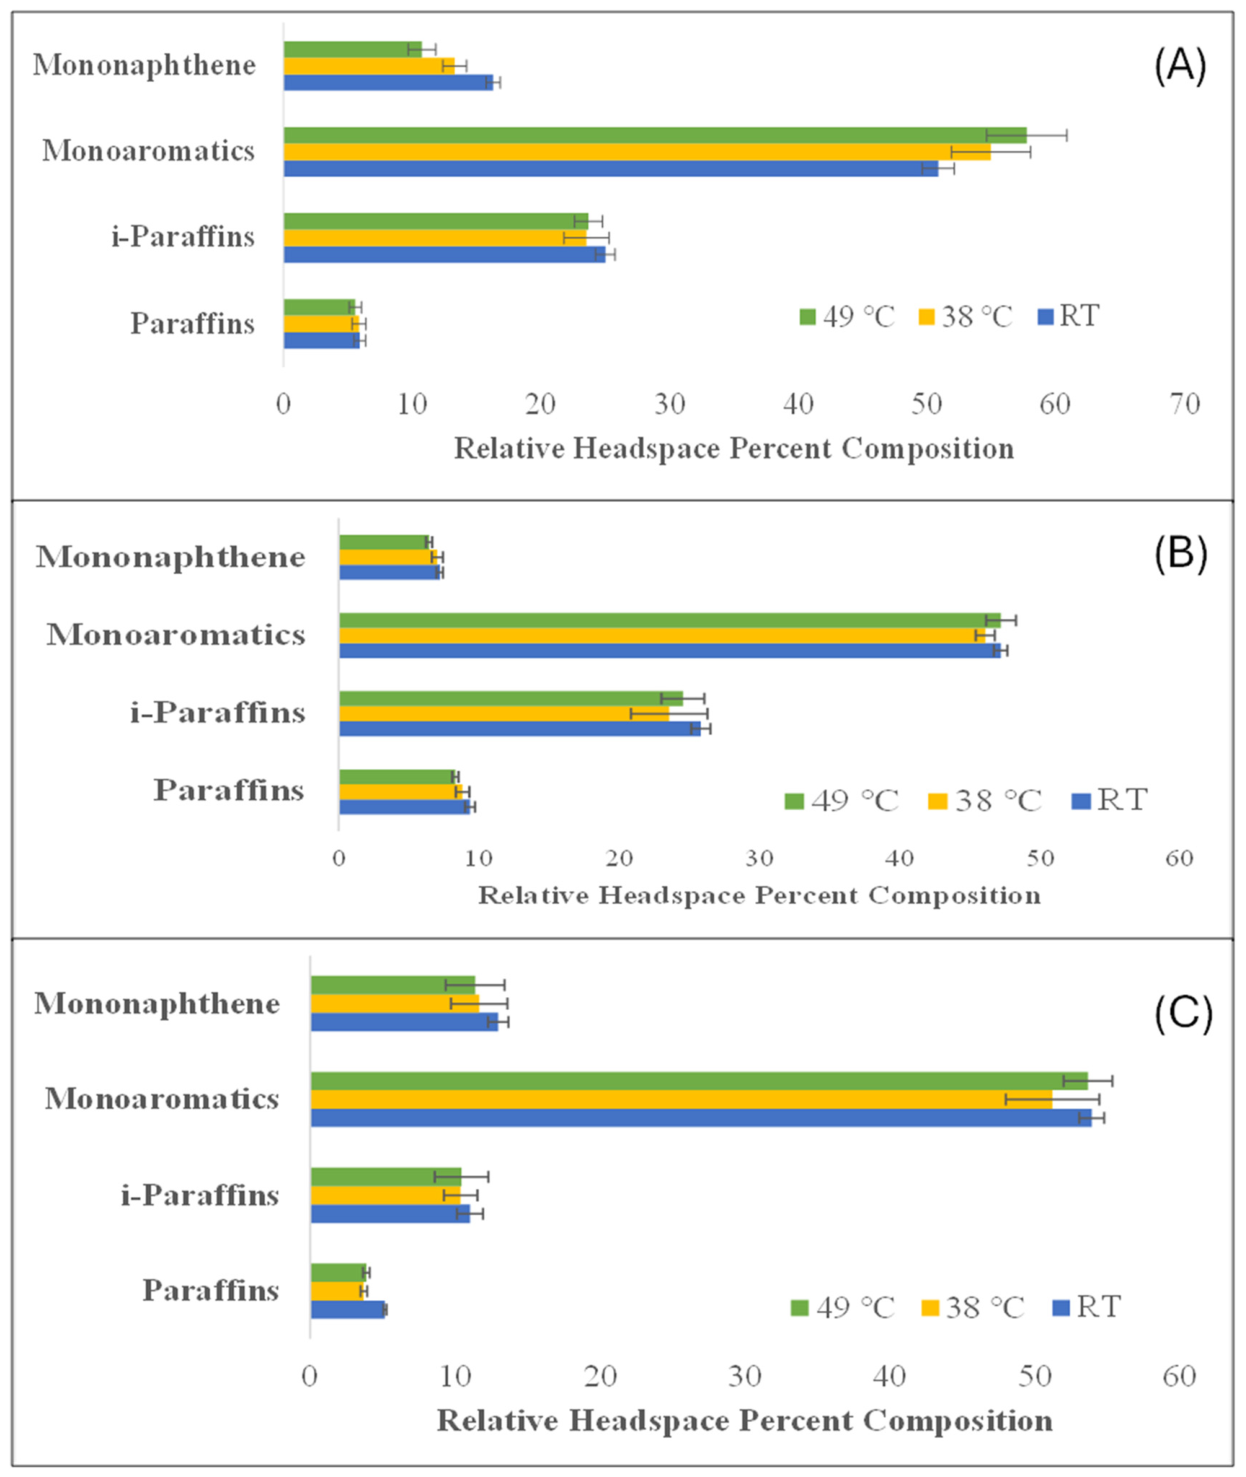
The effect of ethanol on the relative headspace composition of ethanol-blended fuels is illustrated in Figure 3, Figure 4 and Figure 5. The figures present the distribution of the studied hydrocarbon classes in the headspace, expressed as relative percent composition at room temperature, 38 °C, and 49 °C. Across all fuel types, monoaromatics constituted the dominant hydrocarbon class in the headspace. The addition of ethanol generally reduced the relative abundance of monoaromatic hydrocarbons compared with ethanol-free fuel (E0), with the magnitude of the reduction generally increasing with ethanol content. In most cases, the decrease was greater for E20 than for E10. The largest reductions were observed for the high-density gasoline samples, where decreases of approximately 20–23% were observed across the investigated temperatures. At room temperature, the observed reduction in monoaromatic content ranged from approximately 6 to 23%, depending on fuel type. Similar effects of ethanol on aromatic hydrocarbon behavior have been reported previously; however, the reported trends are not always consistent. Cagliari et al. reported reduced benzene concentrations but increased toluene and xylene concentrations in the vapor phase following ethanol addition and attributed these changes to cosolvency effects and altered partitioning behavior [15]. These observations suggest that ethanol preferentially suppresses the relative contribution of monoaromatic hydrocarbons in the headspace, with the magnitude of the effect depending on both ethanol concentration and fuel composition.
The influence of ethanol on paraffins, i-paraffins, and mononaphthenes was less uniform than that observed for monoaromatics. Paraffin and i-paraffin fractions generally decreased with increasing ethanol content; however, the magnitude and direction of these changes depended on both fuel type and temperature. For example, the i-paraffin fraction increased with ethanol addition at room temperature, while paraffin and i-paraffin compositions remained relatively unchanged for medium-density and high-density gasoline samples, respectively, under certain conditions. Mononaphthenes exhibited mixed behavior, showing both increases and decreases depending on fuel type, ethanol concentration, and temperature. The variability observed among the standard mixture, medium-density gasoline, and high-density gasoline indicates that the response of individual hydrocarbon classes to ethanol addition is influenced by the composition of the base fuel. Nevertheless, the reduction in monoaromatics was the most consistent trend observed across all fuels and temperatures.
The observed changes in headspace composition may be attributed to the influence of ethanol on vapor–liquid equilibrium and intermolecular interactions within the fuel matrix [6,16,17,18,19]. Ethanol can alter the partitioning behavior of individual hydrocarbon classes, thereby changing their relative contributions to the headspace [6,19]. The observed reduction in monoaromatic hydrocarbons indicates that ethanol alters the partitioning behavior of aromatic compounds within the fuel matrix [6,15,20], with the magnitude of the effect depending on both fuel composition and ethanol concentration. Because aromatic hydrocarbons represent an important fraction of gasoline evaporative emissions, the reduction in their relative abundance with ethanol addition may have implications for the composition of evaporative emissions generated from ethanol-blended fuels [4,20].
It should be noted that the reported values represent relative abundances rather than absolute vapor-phase concentrations. Consequently, the observed changes should be interpreted as shifts in relative headspace composition associated with ethanol addition rather than absolute changes in evaporative emission rates or hydrocarbon concentrations.
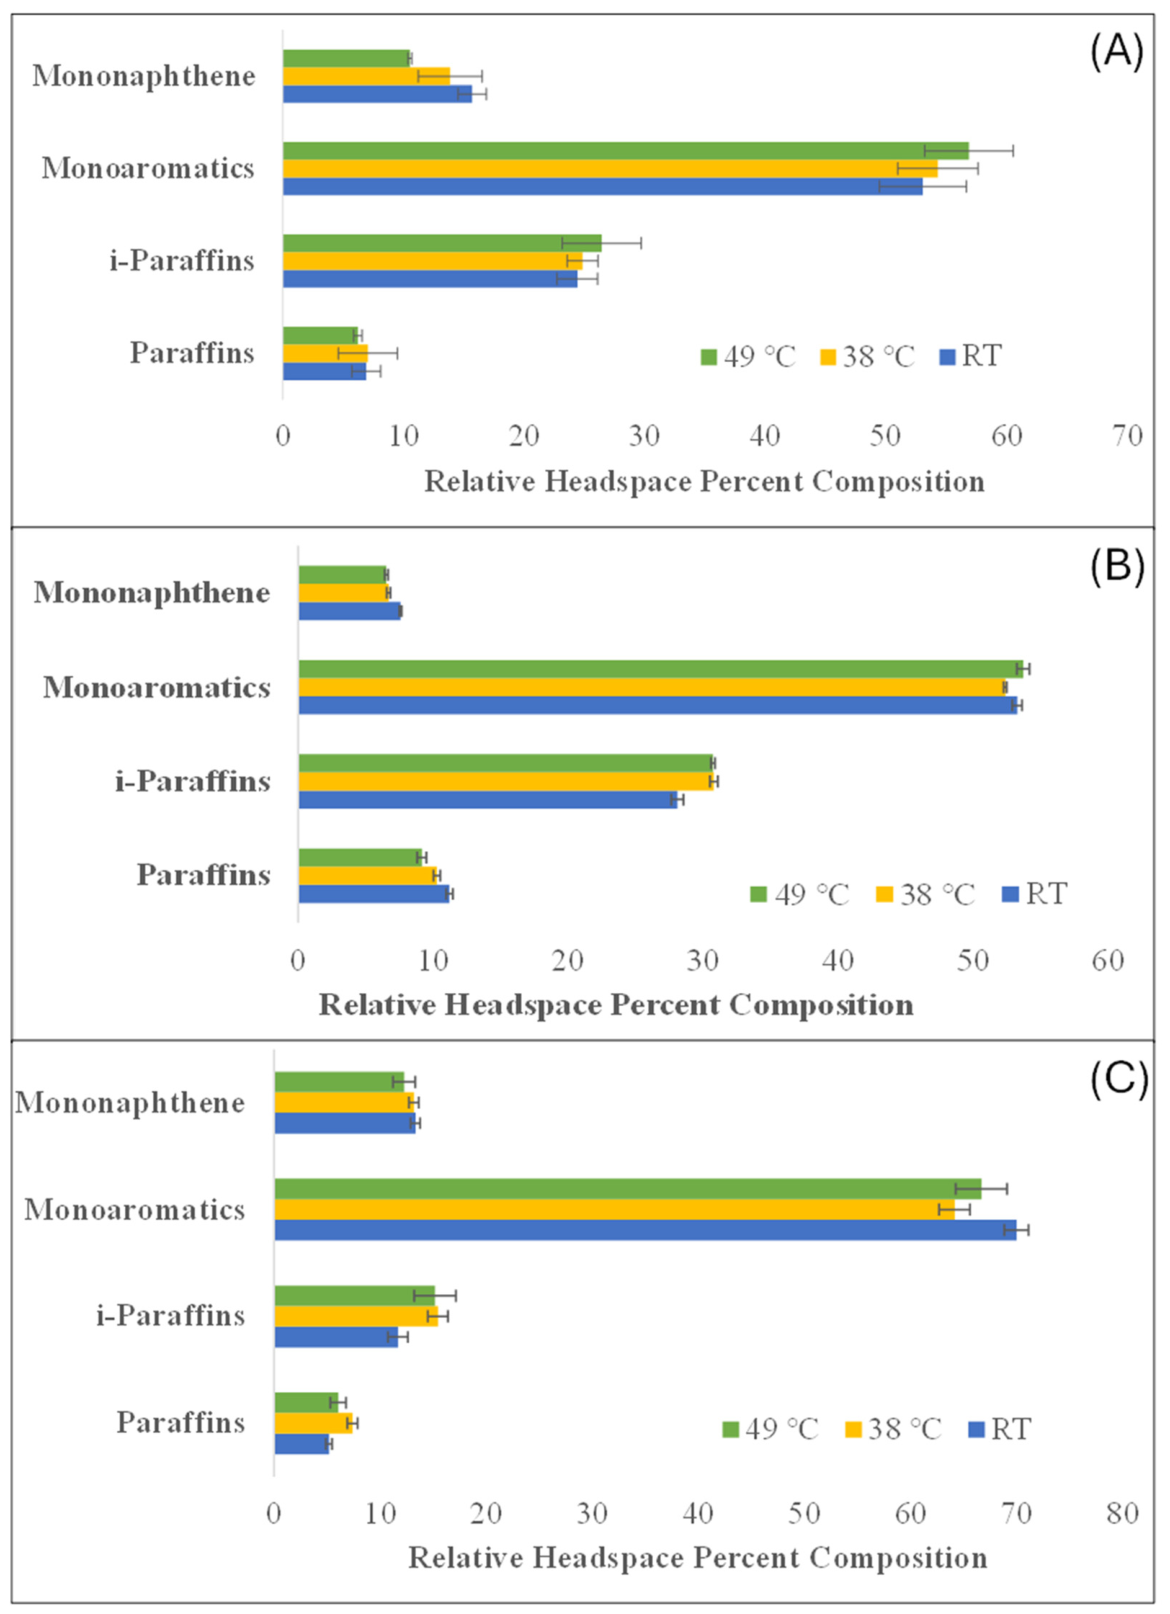
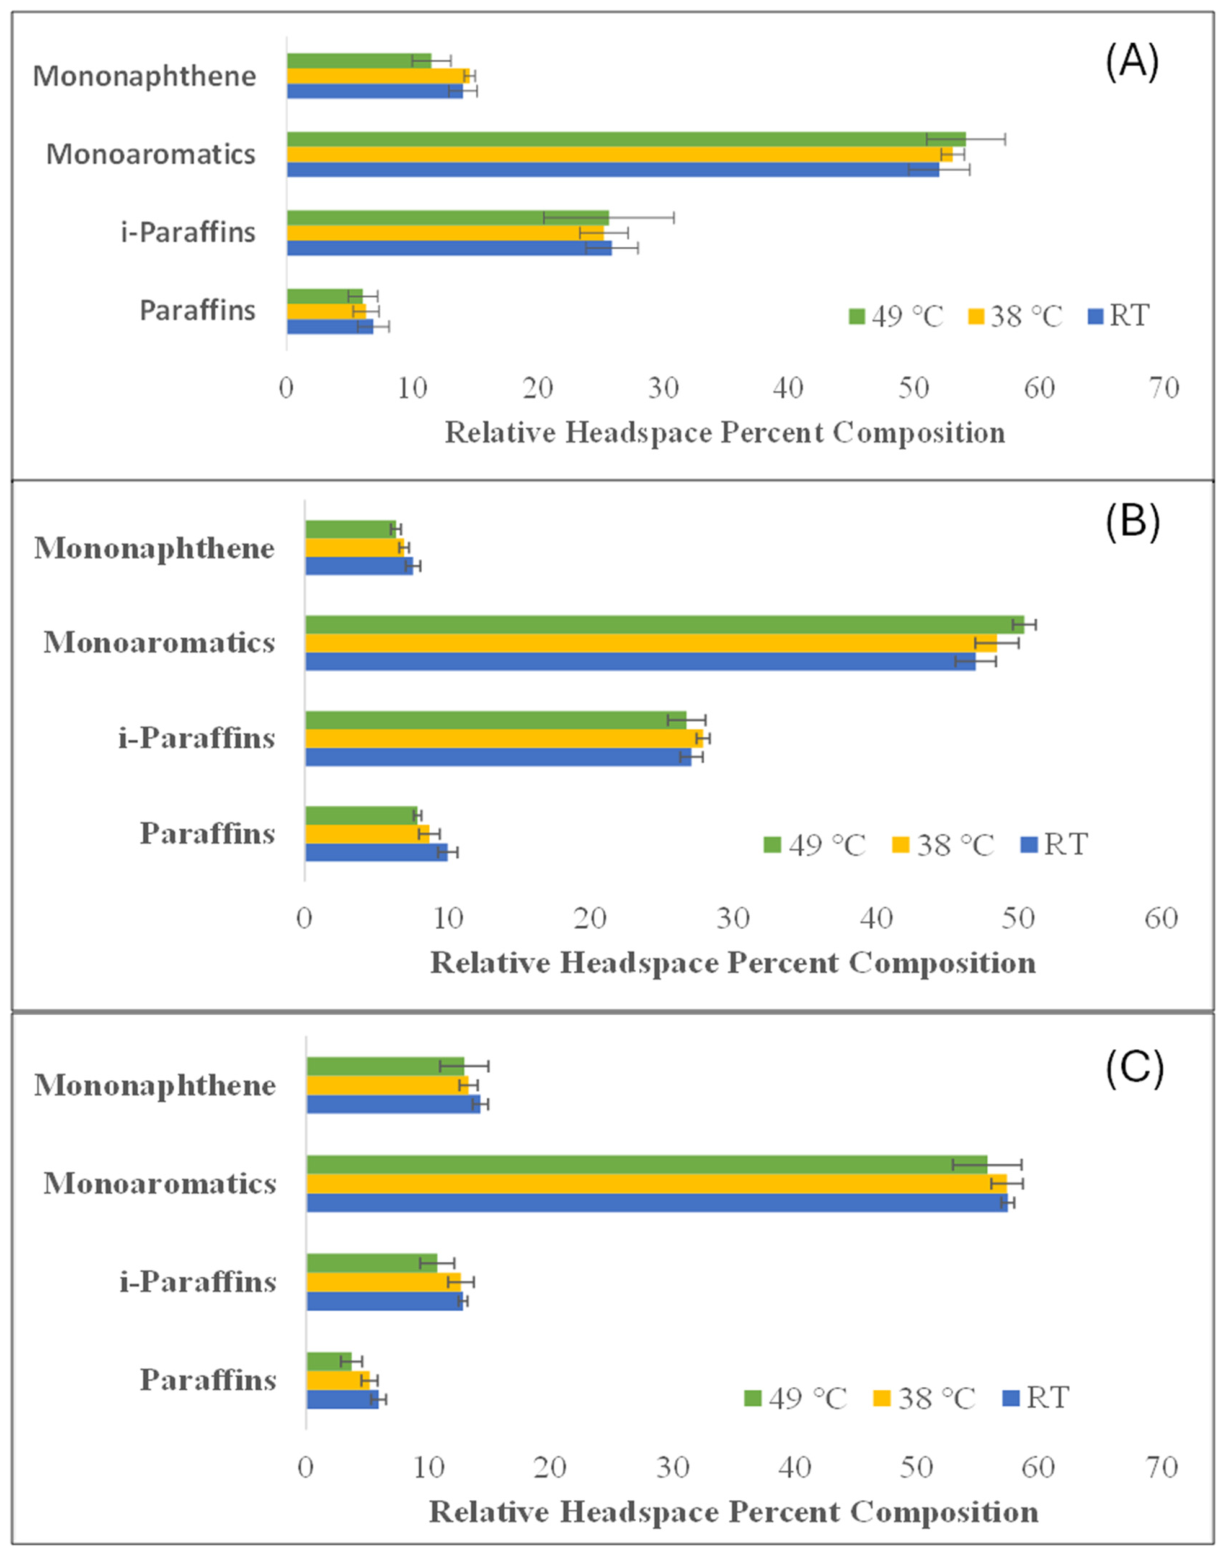
The effect of temperature on the relative headspace composition of paraffins, i-paraffins, monoaromatics, and mononaphthenes in E0, E10, and E20 fuels is shown in Figure 6, Figure 7 and Figure 8.
Temperature influenced the relative composition of the headspace; however, the magnitude and direction of the changes depended on fuel type and hydrocarbon class. Similar temperature-dependent changes in gasoline vapor composition have been reported previously and have been attributed to temperature-driven shifts in vapor–liquid equilibrium and hydrocarbon volatility [21,22]. In the standard fuel mixture, increasing temperature generally resulted in an increase in the relative abundance of monoaromatic hydrocarbons for E0 and E10 fuels. Corresponding decreases in paraffins and mononaphthenes were also observed in most standard fuel samples. The i-paraffin fraction increased slightly with temperature for E0 and E10 but decreased for E20.
The commercial gasoline samples exhibited comparatively smaller temperature-induced compositional changes. For the high-density gasoline, monoaromatic hydrocarbons showed either slight decreases or minimal variation with increasing temperature, while i-paraffins generally increased for E0 and remained relatively stable or decreased slightly for ethanol-containing fuels. Similarly, the medium-density gasoline samples showed only modest changes in monoaromatic composition across the investigated temperature range, with small increases or decreases observed depending on ethanol concentration. Paraffins and mononaphthenes generally exhibited minor variations with temperature for both commercial fuels.
The differing responses among hydrocarbon classes are attributed to differences in volatility and vapor–liquid partitioning behavior [19,21]. As temperature increases, the volatility of all fuel components increases; however, the relative abundance of a given hydrocarbon class depends on how its volatility changes relative to that of other compounds present in the fuel [19,21]. Consequently, a decrease in the relative percentage of a hydrocarbon class does not necessarily indicate a decrease in its absolute vapor-phase concentration, but rather a smaller increase relative to other components present in the headspace.
Comparison of E0, E10, and E20 fuels indicates that ethanol addition did not substantially alter the overall effect of temperature on hydrocarbon class distributions. Similar temperature-dependent patterns were observed for both ethanol-free and ethanol-containing fuels, suggesting that fuel composition had a greater influence on temperature-induced compositional changes than ethanol concentration. The primary effect of ethanol was therefore not to modify the temperature response itself, but rather to shift the overall headspace composition, particularly through reductions in the relative abundance of monoaromatic hydrocarbons.
Overall, the results indicate that temperature and ethanol influence headspace composition through different mechanisms. Temperature primarily affects the partitioning of hydrocarbons between the liquid and vapor phases, whereas ethanol predominantly alters the relative distribution of hydrocarbon classes within the headspace [22]. Among the hydrocarbon classes studied, monoaromatic hydrocarbons exhibited the most pronounced response to ethanol addition, while temperature-induced changes were generally smaller and more dependent on the composition of the base fuel.

4. Conclusions

This study investigated the influence of ethanol addition and temperature on the headspace composition of gasoline using HS-SPME-GC-MS. Analysis of the headspace composition showed that ethanol altered the relative distribution of hydrocarbon classes in the headspace, with the most consistent effect being a reduction in the relative abundance of monoaromatic hydrocarbons. The magnitude of this reduction generally increased with ethanol concentration, with E20 exhibiting a greater effect than E10 across most fuel types and temperatures.
The influence of ethanol on paraffins, i-paraffins, and mononaphthenes was less consistent and depended on fuel composition and temperature. In contrast, temperature produced comparatively modest changes in hydrocarbon class distributions, and similar temperature-dependent patterns were observed for both ethanol-free and ethanol-containing fuels. These results indicate that ethanol primarily affects headspace composition by modifying the partitioning behavior of hydrocarbons, whereas temperature mainly influences vapor–liquid equilibrium without substantially changing the overall compositional trends.
Collectively, the results demonstrate that ethanol blending modifies the relative distribution of hydrocarbon classes in the headspace, with the most pronounced effect being a reduction in monoaromatic hydrocarbons. The magnitude of this effect was influenced by fuel composition, with the largest reductions observed for the high-density gasoline samples. These findings contribute to a better understanding of the influence of ethanol on gasoline evaporative emissions and may assist in the evaluation of fuel formulations intended to reduce the release of volatile aromatic compounds.

Author Contributions

A.K.M.A.A.: Writing—original draft, Methodology, Investigation, Formal analysis. D.E.R.: Writing—review & editing, Supervision, Resources, Conceptualization. All authors have read and agreed to the published version of the manuscript.

Funding

This work was funded by ICM, Inc. (310 North First Street, Colwich, KS 67030).

Data Availability Statement

The original contributions presented in this study are included in the article. Further inquiries can be directed to the corresponding author.

Conflicts of Interest

The authors declare that this study received funding from ICM, Inc. The funder was not involved in the study design, collection, analysis, interpretation of data, the writing of this article or the decision to submit it for publication.

References

  1. Simanzhenkov, V.; Idem, R. Crude Oil Chemistry; CRC Press: Boca Raton, FL, USA, 2003. [Google Scholar]
  2. Gérin, M.; Siemiatycki, J.; Désy, M.; Krewski, D. Associations between several sites of cancer and occupational exposure to benzene, toluene, xylene, and styrene: Results of a case-control study in Montreal. Am. J. Ind. Med. 1998, 34, 144–156. [Google Scholar] [CrossRef]
  3. EPA. National Air Quality and Emissions Trends Report, 1997; Office of Air Quality Planning: Washington, DC, USA, 1988.
  4. Li, L.; Ge, Y.; Wang, M.; Peng, Z.; Song, Y.; Zhang, L.; Yuan, W. Exhaust and evaporative emissions from motorcycles fueled with ethanol gasoline blends. Sci. Total Environ. 2015, 502, 627–631. [Google Scholar] [CrossRef] [PubMed]
  5. Wallington, T.J.; Andino, J.M.; Potts, A.R.; Rudy, S.J.; Siegl, W.O.; Zhang, Z.; Kurylo, M.J.; Huie, R.E. Atmospheric chemistry of automotive fuel additives: Diisopropyl ether. Environ. Sci. Technol. 1993, 27, 98–104. [Google Scholar] [CrossRef]
  6. Andersen, V.F.; Anderson, J.; Wallington, T.; Mueller, S.; Nielsen, O.J. Vapor pressures of alcohol—Gasoline blends. Energy Fuels 2010, 24, 3647–3654. [Google Scholar] [CrossRef]
  7. Yanowitz, J.; Christensen, E.; McCormick, R.L. Utilization of Renewable Oxygenates as Gasoline Blending Components; National Renewable Energy Lab. (NREL): Golden, CO, USA, 2011.
  8. Furey, R.L. Volatility Characteristics of Gasoline-Alcohol and Gasoline-Ether Fuel Blends; SAE Technical Paper: Warrendale, PA, USA, 1985. [Google Scholar]
  9. Wang, H.; Geppert, H.; Fischer, T.; Wieprecht, W.; Moller, D. Determination of volatile organic and polycyclic aromatic hydrocarbons in crude oil with efficient gas-chromatographic methods. J. Chromatogr. Sci. 2015, 53, 647–654. [Google Scholar] [CrossRef] [PubMed][Green Version]
  10. Liu, Y.; Shen, J.; Zhu, X.D. Headspace Solid-phase Microextraction for the Determination of Volatile Organic Compounds in Larix Gmelini Particles. Phys. Procedia 2012, 32, 605–613. [Google Scholar] [CrossRef]
  11. Kondyli, A.; Schrader, W. High-resolution GC/MS studies of a light crude oil fraction. J. Mass Spectrom. 2019, 54, 47–54. [Google Scholar] [CrossRef] [PubMed]
  12. Romagnuolo, L.; Yang, R.; Frosina, E.; Rizzoni, G.; Andreozzi, A.; Senatore, A. Physical modeling of evaporative emission control system in gasoline fueled automobiles: A review. Renew. Sustain. Energy Rev. 2019, 116, 109462. [Google Scholar] [CrossRef]
  13. Berglund, P.M.; Petersson, G. Hazardous petrol hydrocarbons from refuelling with and without vapour recovery. Sci. Total Environ. 1990, 91, 49–57. [Google Scholar] [CrossRef] [PubMed]
  14. Frena, M.; Tonietto, A.E.; Madureira, L.A.S. Application of solid phase microextraction and gas chromatography for the determination of BTEX in solid petroleum residues. J. Braz. Chem. Soc. 2013, 24, 1530–1536. [Google Scholar]
  15. Cagliari, J.; Fedrizzi, F.; Rodrigues Finotti, A.; Echevenguá Teixeira, C.; do Nascimento Filho, I. Volatilization of monoaromatic compounds (benzene, toluene, and xylenes; BTX) from gasoline: Effect of the ethanol. Environ. Toxicol. Chem. 2010, 29, 808–812. [Google Scholar] [PubMed]
  16. Martini, G.; Manfredi, U.; Mellios, G.; Mahieu, V.; Larsen, B.; Farfaletti, C.A.; Krasenbrink, A.; De, S.G.; Mcarragher, S.; Thompson, N. Joint EUCAR/JRC/CONCAWE Study on: Effects of Gasoline Vapour Pressure and Ethanol Content on Evaporative Emissions from Modern Cars; European Commission: Brussels, Belgium, 2007. [Google Scholar]
  17. Shirazi, S.A.; Abdollahipoor, B.; Martinson, J.; Windom, B.; Foust, T.D.; Reardon, K.F. Effects of dual-alcohol gasoline blends on physiochemical properties and volatility behavior. Fuel 2019, 252, 542–552. [Google Scholar] [CrossRef]
  18. Pumphrey, J.; Brand, J.; Scheller, W. Vapour pressure measurements and predictions for alcohol–gasoline blends. Fuel 2000, 79, 1405–1411. [Google Scholar] [CrossRef]
  19. Burke, S.; Rhoads, R.; Ratcliff, M.; McCormick, R.; Windom, B. Measured and Predicted Vapor Liquid Equilibrium of Ethanol-Gasoline Fuels with Insight on the Influence of Azeotrope Interactions on Aromatic Species Enrichment and Particulate Matter Formation in Spark Ignition Engines; SAE Technical Paper: Warrendale, PA, USA, 2018. [Google Scholar]
  20. Ratcliff, M.A.; Windom, B.; Fioroni, G.M.; John, P.S.; Burke, S.; Burton, J.; Christensen, E.D.; Sindler, P.; McCormick, R.L. Impact of ethanol blending into gasoline on aromatic compound evaporation and particle emissions from a gasoline direct injection engine. Appl. Energy 2019, 250, 1618–1631. [Google Scholar] [CrossRef]
  21. Rubin, J.I.; Kean, A.J.; Harley, R.A.; Millet, D.B.; Goldstein, A.H. Temperature dependence of volatile organic compound evaporative emissions from motor vehicles. J. Geophys. Res. Atmos. 2006, 111, D03305. [Google Scholar] [CrossRef]
  22. Noumura, G.; Hata, H.; Yamada, H.; Tonokura, K. Improvement of the theoretical model for evaluating evaporative emissions in parking and refueling events of gasoline fleets based on thermodynamics. ACS Omega 2022, 7, 31888–31896. [Google Scholar] [CrossRef] [PubMed]
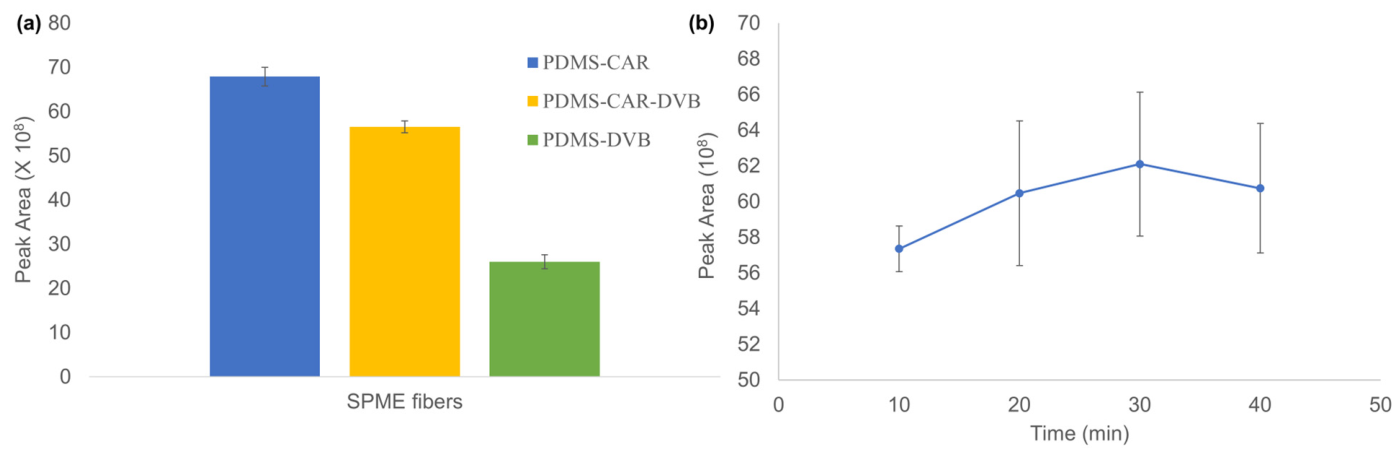
Figure 1. Optimization of SPME fibers and extraction time: (a) effect of fiber stationary phase and (b) effect of extraction time on analyte extraction using PDMS-CAR-coated fiber.
Separations 13 00187 g001
Figure 2. Total ion chromatogram of components of gasoline in (a) standard (E0) and (b) high-density gasoline (E0) fuels at room temperature. The abundance (×106) is plotted against retention times in min.
Separations 13 00187 g002
Figure 3. Effect of ethanol on the relative headspace composition of hydrocarbon classes in (A) standard, (B) medium-density, and (C) high-density gasoline samples at room temperature (RT).
Separations 13 00187 g003
Figure 4. Effect of ethanol on the relative headspace composition of hydrocarbon classes in (A) standard, (B) medium-density, and (C) high-density gasoline samples at 38 °C.
Separations 13 00187 g004
Figure 5. Effect of ethanol on the relative headspace composition of hydrocarbon classes in (A) standard, (B) medium-density, and (C) high-density gasoline samples at 49 °C.
Separations 13 00187 g005
Figure 6. Effect of temperature on the relative headspace composition of hydrocarbon classes in (A) standard, (B) medium-density, and (C) high-density gasoline E0 samples.
Separations 13 00187 g006
Figure 7. Effect of temperature on the relative headspace composition of hydrocarbon classes in (A) standard, (B) medium-density, and (C) high-density gasoline E10 samples.
Separations 13 00187 g007
Figure 8. Effect of temperature on the relative headspace composition of hydrocarbon classes in (A) standard, (B) medium-density, and (C) high-density gasoline E20 samples.
Separations 13 00187 g008
Table 1. Composition of the prepared standard mixture and purity of the constituent compounds.
GroupCompoundVol. (%)Mass %Purity/GradeSupplier
Paraffinsn-butane8.418.7899%SPEX CertiPrep, NJ, USA
n-hexane8.467.3395% OptimaFisher Chemical, MA, USA
i-paraffins2-methylpentane3.603.7699%SPEX CertiPrep, NJ, USA
3-methylpentane4.034.2199%
2-methylhexane4.283.8499%Acros Organics, NJ, USA
3-methylhexane2.242.3495%SPEX CertiPrep, NJ, USA
2,2,4-trimethylpentane11.7410.7199%Acros Organics, NJ, USA
2,3,4-trimethylpentane1.961.8698%Alfa Aesar, MA, USA
2-methylbutane10.228.3899.5%Sigma Aldrich, MA, USA
MonoaromaticsBenzene0.680.7999.9%Alfa Aesar, MA, USA
Toluene16.4718.86Certified ACSFisher Scientific, MA, USA
Ethylbenzene1.992.0899.8%SPEX CertiPrep, NJ, USA
m-xylene4.995.2199%
p-xylene2.522.6399%
o-Xylene1.942.0398%
Mononaphthenescyclopentane16.4717.2095%SPEX CertiPrep, NJ, USA
Note: Minimum purity values reported by the manufacturers are provided. The reference compounds were used for identification and preparation of representative standard mixtures rather than for absolute quantitative calibration.
Table 2. Hydrocarbon classes and compounds in the standard mixture.
Hydrocarbon ClassHydrocarbon Compounds
Paraffinsn-butane
n-hexane
i-paraffins2-methylpentane
3-methylpentane
2-methylhexane
3-methylhexane
2,2,4-trimethylpentane
2,3,4-trimethylpentane
2-methylbutane
MonoaromaticsBenzene
Toluene
Ethylbenzene
Ortho-xylene
Meta-xylene
Para-xylene
MononaphtheneCyclopentane
Disclaimer/Publisher’s Note: The statements, opinions and data contained in all publications are solely those of the individual author(s) and contributor(s) and not of MDPI and/or the editor(s). MDPI and/or the editor(s) disclaim responsibility for any injury to people or property resulting from any ideas, methods, instructions or products referred to in the content.