Article

Bar Adsorptive Microextraction for Trace Determination of Natural and Semi-Synthetic Cannabinoids in Saliva


by
Maria Beatriz Pereira
1,†,
Joana M. N. Sá
1,2,†,
Gonçalo C. Justino
3,
Alexandre Quintas
1,4,* and
Nuno R. Neng
1,2,4,*
1
Egas Moniz Laboratory of Forensic and Psychological Sciences, Egas Moniz School of Health and Science, Quinta da Granja, 2829-511 Caparica, Portugal
2
Centro de Química Estrutural, Institute of Molecular Sciences, Departamento de Química e Bioquímica, Faculdade de Ciências, Universidade de Lisboa, 1749-016 Lisboa, Portugal
3
Centro de Química Estrutural, Institute of Molecular Sciences, Departamento de Engenharia Química, Instituto Superior Técnico, Universidade de Lisboa, 1049-001 Lisboa, Portugal
4
Egas Moniz Interdisciplinary Research Center, Egas Moniz School of Health and Science, Quinta da Granja, 2829-511 Caparica, Portugal
*
Authors to whom correspondence should be addressed.
These authors contributed equally to this work.
Separations 2026, 13(5), 134; https://doi.org/10.3390/separations13050134
Submission received: 30 March 2026 / Revised: 23 April 2026 / Accepted: 28 April 2026 / Published: 30 April 2026
(This article belongs to the Section Forensic Science and Toxicology)

Abstract

Cannabis is the most widely consumed illicit substance worldwide, and the rise of synthetic and semi-synthetic cannabinoids poses growing public health concerns due to their high potency and unpredictable effects. This study presents a new analytical methodology for the simultaneous determination of natural and semi-synthetic cannabinoids (cannabidiol (CDB), Δ8-tetrahydrocannabinol (∆8-THC), Δ9-tetrahydrocannabinol (∆9-THC), and hexahydrocannabinol (HHC)) in saliva using gas chromatography coupled with mass spectrometry (GC-MS) in combination with bar adsorptive microextraction (BAμE) as a green sample preparation. The optimized method showed satisfactory recoveries (57.3–80.6%), low detection and quantification limits (1.25 and 4.13 ng/mL, respectively), excellent linearity (r2 ≥ 0.9963), and robust precision and accuracy. Application to authentic saliva samples demonstrated cannabinoid levels consistent with literature values. Overall, the proposed methodology offers a cost-effective, miniaturized, and environmentally sustainable platform for routine oral fluid cannabinoid analysis, highlighting its potential for forensic, clinical, and toxicological applications.

1. Introduction

The cannabis plant has been used by humans for thousands of years, and currently constitutes a substance of abuse, with the highest rate of consumption, with more than 244 million users worldwide in 2023 [1,2]. To contour drugs of abuse legislation control, synthetic and semi-synthetic cannabinoids emerged in the early 21st Century as legal alternatives to cannabis, capable of mimicking its effects. Despite efforts to legally control these substances, new molecules continue to appear on the market. The recent trend in human consumption of these compounds has raised toxicological concerns, as there are no toxicokinetic studies, adequate descriptions, or literature on their toxicity. Thus, monitoring the synthetic and semi-synthetic cannabinoids emerging on the market becomes imperative, both in public health and in a forensic context.
Cannabinoids can be classified into four main categories, based on their origin: endocannabinoids, phytocannabinoids, semi-synthetic cannabinoids, and synthetic cannabinoids [3,4,5]. Endocannabinoids are endogenous ligands that bind to cannabinoid receptors, modulating the endocannabinoid system endogenously. Phytocannabinoids are natural compounds in Cannabis sativa L., such as ∆9-tetrahydrocannabinol (∆9-THC), the main psychoactive compound, and cannabidiol (CBD), which has been displaying relevant therapeutic potential [6,7,8]. Since they have a structure similar to endocannabinoids, they interact and activate type 1 or type 2 cannabinoid receptors with a higher affinity compared to endogenous ligands [9]. Semi-synthetic cannabinoids are chemically modified cannabinoids derived from naturally occurring phytocannabinoids, most commonly CBD. These compounds generally display higher potency and unpredictable pharmacological profiles, and their consumption has been associated with significant adverse effects [10]. A synthetic cannabinoid is a fully artificial chemical compound that acts on cannabinoid receptors (mainly CB1 and CB2) but has no direct natural precursor from the Cannabis plant. These new molecules included not only compounds structurally similar to already known phytocannabinoids but also compounds with a different chemical structure [11].
In the mid-20th century, hexahydrocannabinol (HHC), a semi-synthetic cannabinoid analog of ∆9-THC, was synthesized for the first time. HHC occurs naturally in the cannabis plant in trace amounts and can exist as two diastereoisomers, 9R-HHC and 9S-HHC, which differ in their affinity for cannabinoid receptors and pharmacological potency, with 9R-HHC being substantially more active [12,13]. In May 2022, in Denmark, it was detected for the first time in a product marketed for insomnia and was reported by the rapid alert mechanism of the European Monitoring Centre for Drugs and Drug Addiction (today known as European Union Drugs Agency (EUDA)). From then on, its dissemination and consumption quickly became a matter of concern, as between May and December of the same year, it was identified in more than 70% of the Member States of the European Union [14,15]. HHC is a cannabinoid that has gained considerable popularity in the community, firstly as a legal alternative to ∆9-THC.
Generally, the most used methods to determine and quantify these compounds are liquid and gas chromatography coupled with mass spectrometry (LC-MS and GC-MS, respectively), or in tandem (MS/MS). Typically, as described in the literature, a prior sample preparation step is used [16,17,18]. Emphasis has been placed on environmentally advantageous microextraction techniques, notably solid-phase microextraction (SPME), dispersive liquid–liquid microextraction (DLLME), and bar adsorptive microextraction (BAμE) [19]. BAμE was introduced as an alternative microextraction technique for the determination of compounds in aqueous matrices [19,20]. Complying with Green Analytical Chemistry principles [21], due to low solvent and sample consumption, BAμE offers advantages such as simplicity, sorbent versatility, low cost, and good extraction efficiency and its applicability has been successfully demonstrated in forensic analyses [20,22].
Traditionally, the monitoring of cannabinoids is performed in blood or urine. However, alternative biological matrices, such as saliva, have gained increasing interest. The most common matrices can be quite invasive, with higher costs, require specialized personnel, and are susceptible to adulteration and dilution effects on urine samples. On the other hand, saliva offers several advantages, including simple, rapid, and non-invasive collection, which can be performed on-site by non-specialized personnel [21,23,24]. Moreover, the rapid decrease in THC concentrations favors the analysis in saliva compared to the other matrices, making this matrix particularly suitable for assessing recent cannabis use, especially in contexts of driving under the influence. The rapid emergence of semi-synthetic cannabinoids, for which there is limited toxicological and pharmacokinetic data, poses a major public health threat on individual and societal levels, especially due to the urban myths that these products make driving less risky [10,13]. As a result, the development of reliable analytical methods is essential.
In this work, a green analytical approach was developed for the determination of ∆8-THC, ∆9-THC, CBD, and HHC in saliva samples using BAμE followed by GC-MS analysis. To achieve the required sensitivity, chemical derivatization with N-methyl-N-trimethylsilyl-trifluoroacetamide (MSTFA) was optimized alongside the extraction parameters. A significant focus was placed on the structural confirmation and differentiation of HHC diastereoisomers. The methodology was fully validated according to international performance criteria and successfully applied to real positive saliva samples. Finally, the environmental impact and practical utility of the method were comprehensively assessed using the AGREEprep and BAGI metrics.

2. Materials and Methods

2.1. Chemicals and Reagents

All chemicals and solvents used in this study were of analytical grade or higher purity. Acetonitrile (ACN, 99.9%), n-hexane (97.0%), and ethanol (99.8%) were obtained from Honeywell (Charlotte, NC, USA), while methanol (MeOH, 99.9%) was purchased from Carlo Erba (Cornaredo, Italy). Formic acid (98%) was supplied by Sigma-Aldrich (St. Louis, MO, USA). Sodium chloride (99.5%) and sodium hydroxide were obtained from PanReac (Castellar del Vallès, Barcelona, Spain) and LabChem (Zelienople, PA, USA), respectively. Ultrapure water was produced using a Simplicity® UV purification system (Millipore, Burlington, MA, USA). Certified reference standards of CBD, cannabidiolic acid (CBDA), cannabinol (CBN), ∆8-THC, ∆9-THC and tetrahydrocannabinolic acid (THCA), 1 mg/mL in MeOH, were purchased from LGC Dr. Ehrenstorfer™ (Luckenwalde, Germany). These standard solutions were stored at −20 °C in accordance with the manufacturer’s recommendations. Herbal cannabis samples containing HHC were obtained from a commercial retailer and stored at room temperature under light and moisture-free conditions. Bromopentafluorobenzene (99%, Sigma-Aldrich, St. Louis, MO, USA) was used as the internal standard (IS), and MSTFA (95–100%, Machery-Nagel, Düren, Germany) was employed as the derivatization reagent; both were stored at 4 °C. Although the IS is not structurally analogous to the target cannabinoids, its stability, absence in the sample matrix, well-resolved chromatographic behavior, consistent detector response, and low cost allow it to fulfill the primary role of correcting for instrumental variability. Several sorbent materials, including activated carbons CA1 (surface area of 1400 m2/g and pHPZC 2.2); CN1 (surface area of 1400 m2/g and pHPZC 6.4) and SX Plus (surface area of 1100 m2/g and pHPZC 7.5), from Salmon & Cia (Lisboa, Portugal); R (surface area of 937 m2/g and pHPZC 6.5) from Riëdel-de-Haën (Seelze, Germany); and polymeric phases Oasis® HLB (surface area of 800 m2/g, particle size of 30 μm and pore size of 80 Å) from Waters (Milford, MA, USA), DVB (surface area of 1200 m2/g, particle size of 40 to 120 μm and pore size of 60 Å) from Merck (Darmstadt, Germany), Strata®-X (surface area of 800 m2/g, particle size of 33 μm and pore size of 85 Å) from Phenomenex (Torrance, CA, USA), and ENVITM-18 (surface area of 475 m2/g, particle size of 45 μm and pore size of 60 Å) from Sigma-Aldrich (St. Louis, MO, USA), were evaluated for BAμE devices.

2.2. Biological Samples

Saliva samples were collected from volunteer donors after being informed of consent and approval by the Ethics Committee of Egas Moniz, in compliance with the General Data Protection Regulation (GDPR). Drug-free saliva samples were used as blanks. Samples were collected directly into sterile Falcon tubes and stored at −80 °C until analysis.

2.3. Instrumentation

GC-MS Analysis

Qualitative and quantitative analyses were conducted using an Agilent 6890 gas chromatograph (Santa Clara, CA, USA) with an Agilent 5983N mass spectrometer. Separation was performed on a Mega-5MS capillary column (30 m × 0.25 mm, 0.25 μm) from MEGA S.r.l. (Legnano, Italy). Samples (2 μL) were injected in splitless mode at 280 °C. The oven was held at 50 °C for 2 min, increased to 60 °C at 2.5 °C/min, ramped to 240 °C at 60 °C/min, then to 300 °C at 30 °C/min, and held for 2 min, for a total run time of 16.33 min. Helium (99.9992%) served as the carrier gas at 1.5 mL/min. The MS transfer line, ion source, and quadrupole were set at 300 °C, 250 °C, and 200 °C, respectively, with a 4 min solvent delay. Mass spectra were acquired by electron impact ionization at 70 eV over a range of 35–400 Da. Data were processed using Agilent Data Analysis software (version E.02.00.493).

2.4. Experimental Set-Up

2.4.1. HHC Purification and Structural Confirmation

For the extraction of the herbal cannabis sample, it was necessary to purify the compound acquired from an herbal sample. To prepare the sample containing HHC for subsequent purification by liquid chromatography with an ultraviolet–visible detector (HPLC-UV/Vis), an ultrasound-assisted solid–liquid extraction was performed, based on the work of Correia et al. (2023) [25].
In an initial approach, an HPLC-UV/Vis method was optimized for the purification of HHC from herbal extracts. Structural confirmation and the differentiation of the two HHC diastereoisomers were subsequently performed by GC-MS, LC-MS, and nuclear magnetic resonance (NMR) spectroscopy. Detailed information regarding these procedures can be found in the Supplementary Materials [26,27,28,29,30,31].

2.4.2. Preparation of the BAμE

The preparation of the BAμE devices was conducted in-house following previously established protocols [32,33]. Each device consisted of a hollow cylindrical tube (∼7.5 mm in length and 3 mm in diameter), externally wrapped with a layer of adhesive tape coated with a sorbent phase. After preparation, the devices were cleaned in ultrapure water under constant agitation for 10 min.

2.4.3. Optimization Procedures

To optimize the instrumental parameters of the GC-MS, a mixture of solutions of the compounds under study and the IS was injected in SCAN mode. To optimize the derivatization time, 50 μL of a mixture solution of the cannabinoids under study at 5 μg/mL was added into a glass vial with glass inserts and dried by heating at 70 °C, followed by reconstitution with 50 μL of MSTFA. Subsequently, the compounds were derivatized in a microwave oven from Selectline (750 V, Croix, France) for 1, 2, 3, or 5 min.
From individual stock solutions (100 µg/mL) of each cannabinoid, a mixed working solution at 2.5 µg/mL in MeOH was freshly prepared daily and used for BAμE optimization experiments. BAμE devices were made in the laboratory using hollow cylindrical polypropylene tubes. The outer surface of each device was coated with an adhesive layer onto which the selected sorbent material (activated carbon or polymer) was immobilized. Before use, the devices were cleaned in ultrapure water under agitation for 10 min to remove excess sorbent, and subsequently dried with absorbent paper to eliminate residual water from both the interior and surface of the devices. To maximize the efficiency of the BAμE/GC-MS methodology, several experimental parameters were systematically optimized, including the sorbent phase (CA1, CN1, SX Plus, R, HLB, DVB, Strata-X, and ENVI-18), desorption time (30, 45, and 60 min), desorption solvent (MeOH, ACN, and MeOH:ACN, 50:50, v/v), matrix pH (2.0, 5.5, and 12.0), organic modifier content (5, 10 and 15% MeOH, v/v), ionic strength (5, 10 and 15% NaCl, w/v), equilibrium temperature (23 and 30 °C), extraction time (1, 2, 2.5, 3 and 16 h), and agitation speed (700, 1000 and 1300 rpm) [18,24,25]. Initially, baseline conditions were fixed, and extractions were performed using 1 mL of ultrapure water spiked with 50 µL of a mixed cannabinoid solution (2.5 µg/mL). A BAμE device coated with the selected sorbent was then introduced, and microextraction was carried out in a thermoshaker at 1000 rpm for 1 h. After extraction, the device was removed and dried, followed by liquid desorption in 100 µL of solvent under ultrasonication for 45 min. The extract was evaporated at 70 °C, derivatized with 50 µL of MSTFA using microwave irradiation for 2 min and supplemented with the internal standard before GC-MS analysis. All experiments were conducted in triplicate.

2.4.4. Validation Procedures

Method validation was performed under the previously optimized BAμE/GC-MS conditions using saliva samples from volunteers who confirmed the absence of illicit drug consumption. The validation followed the UNODC guidelines [34] for analytical methodology validation in biological specimens, and parameters including selectivity, sensitivity, linearity, precision, and accuracy were assessed. All validation assays were conducted in triplicate. Method selectivity was evaluated by analyzing blank saliva samples to verify the absence of interfering compounds at the retention times of the target analytes [35]. Sensitivity was assessed through the determination of limits of detection (LOD) and quantification (LOQ), based on signal-to-noise (S/N) ratios of 3:1 and 10:1, respectively. Linearity was evaluated over a working range of 5–300 ng/mL using determination coefficients, residual analysis, and statistical lack-of-fit (LoF) and goodness-of-fit (GoF) tests. Repeatability, intermediate precision, and accuracy were assessed by analyzing blank saliva samples spiked at low, medium, and high concentration levels (15, 150, and 240 ng/mL), with intra-day assays performed on a single day and inter-day assays over several days. The validated method was subsequently applied to real saliva samples collected from cannabis users 30 min after consumption. Analyses were performed using 1 mL of saliva containing 5% MeOH under the optimized conditions, with all samples analyzed in triplicate. All the samples were stored at −80 °C before analysis.

3. Results and Discussion

3.1. GC-MS(SIM) Calibration

A mixed solution containing the target cannabinoids and the IS was analyzed in full-scan (SCAN) mode. Chromatographic conditions were optimized for each cannabinoid to ensure peak resolution with a reduced run time, yielding retention times (tR) of 5.340 min for the IS to 12.920 for 9R-HHC. Subsequently, the mass spectrum of each compound was analyzed, and the molecular ions and main fragment ions were selected to improve selectivity and sensitivity. Table 1 summarizes the retention times and selected ions for each compound. While all analytes were detected as their trimethylsilyl (TMS) derivatives, they are referred to herein by their parent abbreviations for brevity.
By adjusting the oven temperature to achieve optimal resolution of the chromatographic peaks within a reasonable analysis time, an existing method for cannabinoids analysis was adapted, resulting in the chromatogram shown in Figure 1. The total run time was 16.33 min, providing good separation of the chromatographic peaks of the cannabinoids under study.
The LOD and LOQ for each analyte were determined individually based on S/N ratios of 3:1 and 10:1, respectively. These values were derived from a series of successive dilutions of the standard mixture. The values obtained were 16 to 39 ng/mL for LOD and 53 and 130 ng/mL for LOQ, as shown in Table 2. Calibration curves were constructed using mixed cannabinoid solutions over a concentration range of 160–5000 ng/mL (seven concentration levels), demonstrating excellent linearity, with coefficients of determination (r2) ≥ 0.9968.
Intra- and inter-day precision, as well as inter-day accuracy, were evaluated through replicate analyses at three concentration levels: low (480 ng/mL), medium (1250 ng/mL), and high (4000 ng/mL). According to UNODC guidelines, acceptable relative standard deviation (RSD%) values are ≤15%, or ≤20% at the lowest concentration level, while accuracy bias (%) should be within ±15%, or ±20% at the lowest level [34]. All evaluated parameters met these acceptance criteria, with intra-day precision showing RSD values ≤12.05%, and both inter-day precision and accuracy remaining within the limits established by the UNODC.

3.2. Optimization of Derivatization Time

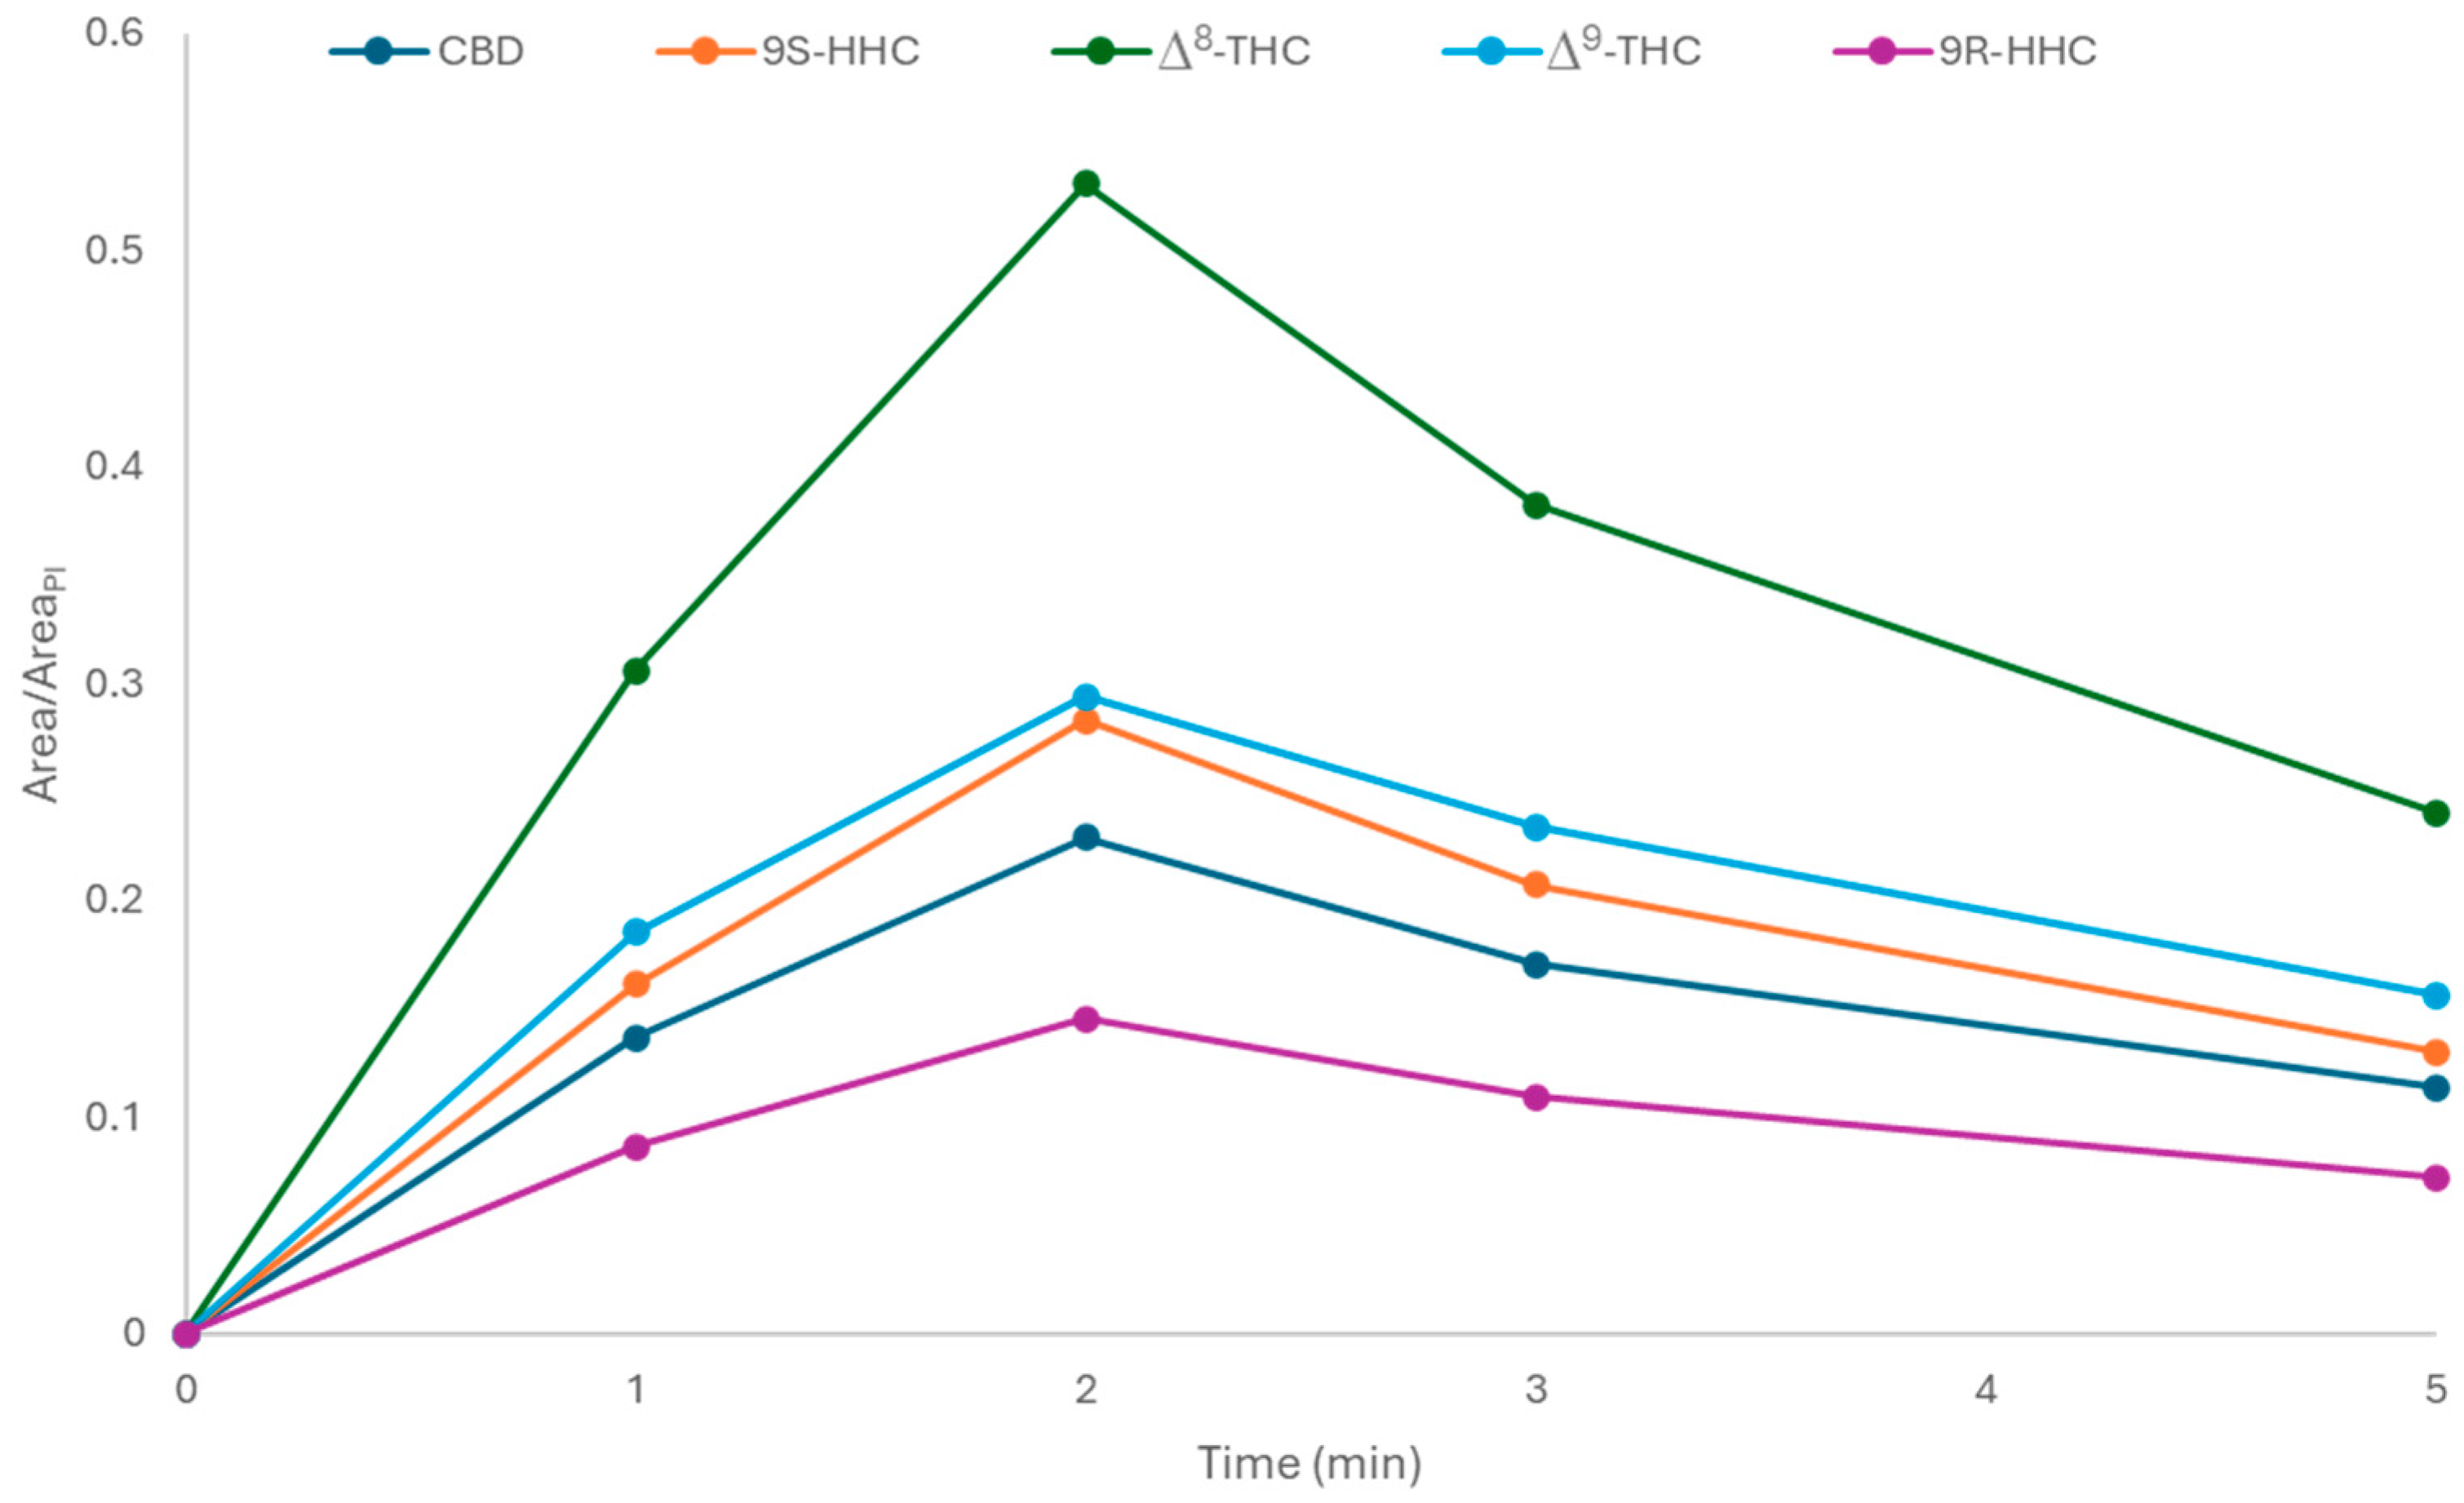
According to UNODC guidelines, MSTFA is one of the most widely used derivatizing agents for cannabinoid analysis, as it increases analyte volatility and preserves structural integrity under the high temperatures of GC analysis [36]. Microwave-assisted derivatization has been increasingly adopted in recent years due to its ability to significantly reduce derivatization time [37,38]. Derivatization times of 1, 2, 3, and 5 min were evaluated. As shown in Figure 2, the results demonstrated variation in compound response with different derivatization times. A derivatization time of 2 min under microwave irradiation produced the maximum reaction yield, presenting a significantly larger peak area. Beyond this time, the response declined, likely due to degradation or evaporation. Therefore, a 2 min derivatization time was selected as optimal.

3.3. BAμE Method Optimization

3.3.1. Sorbent Selection

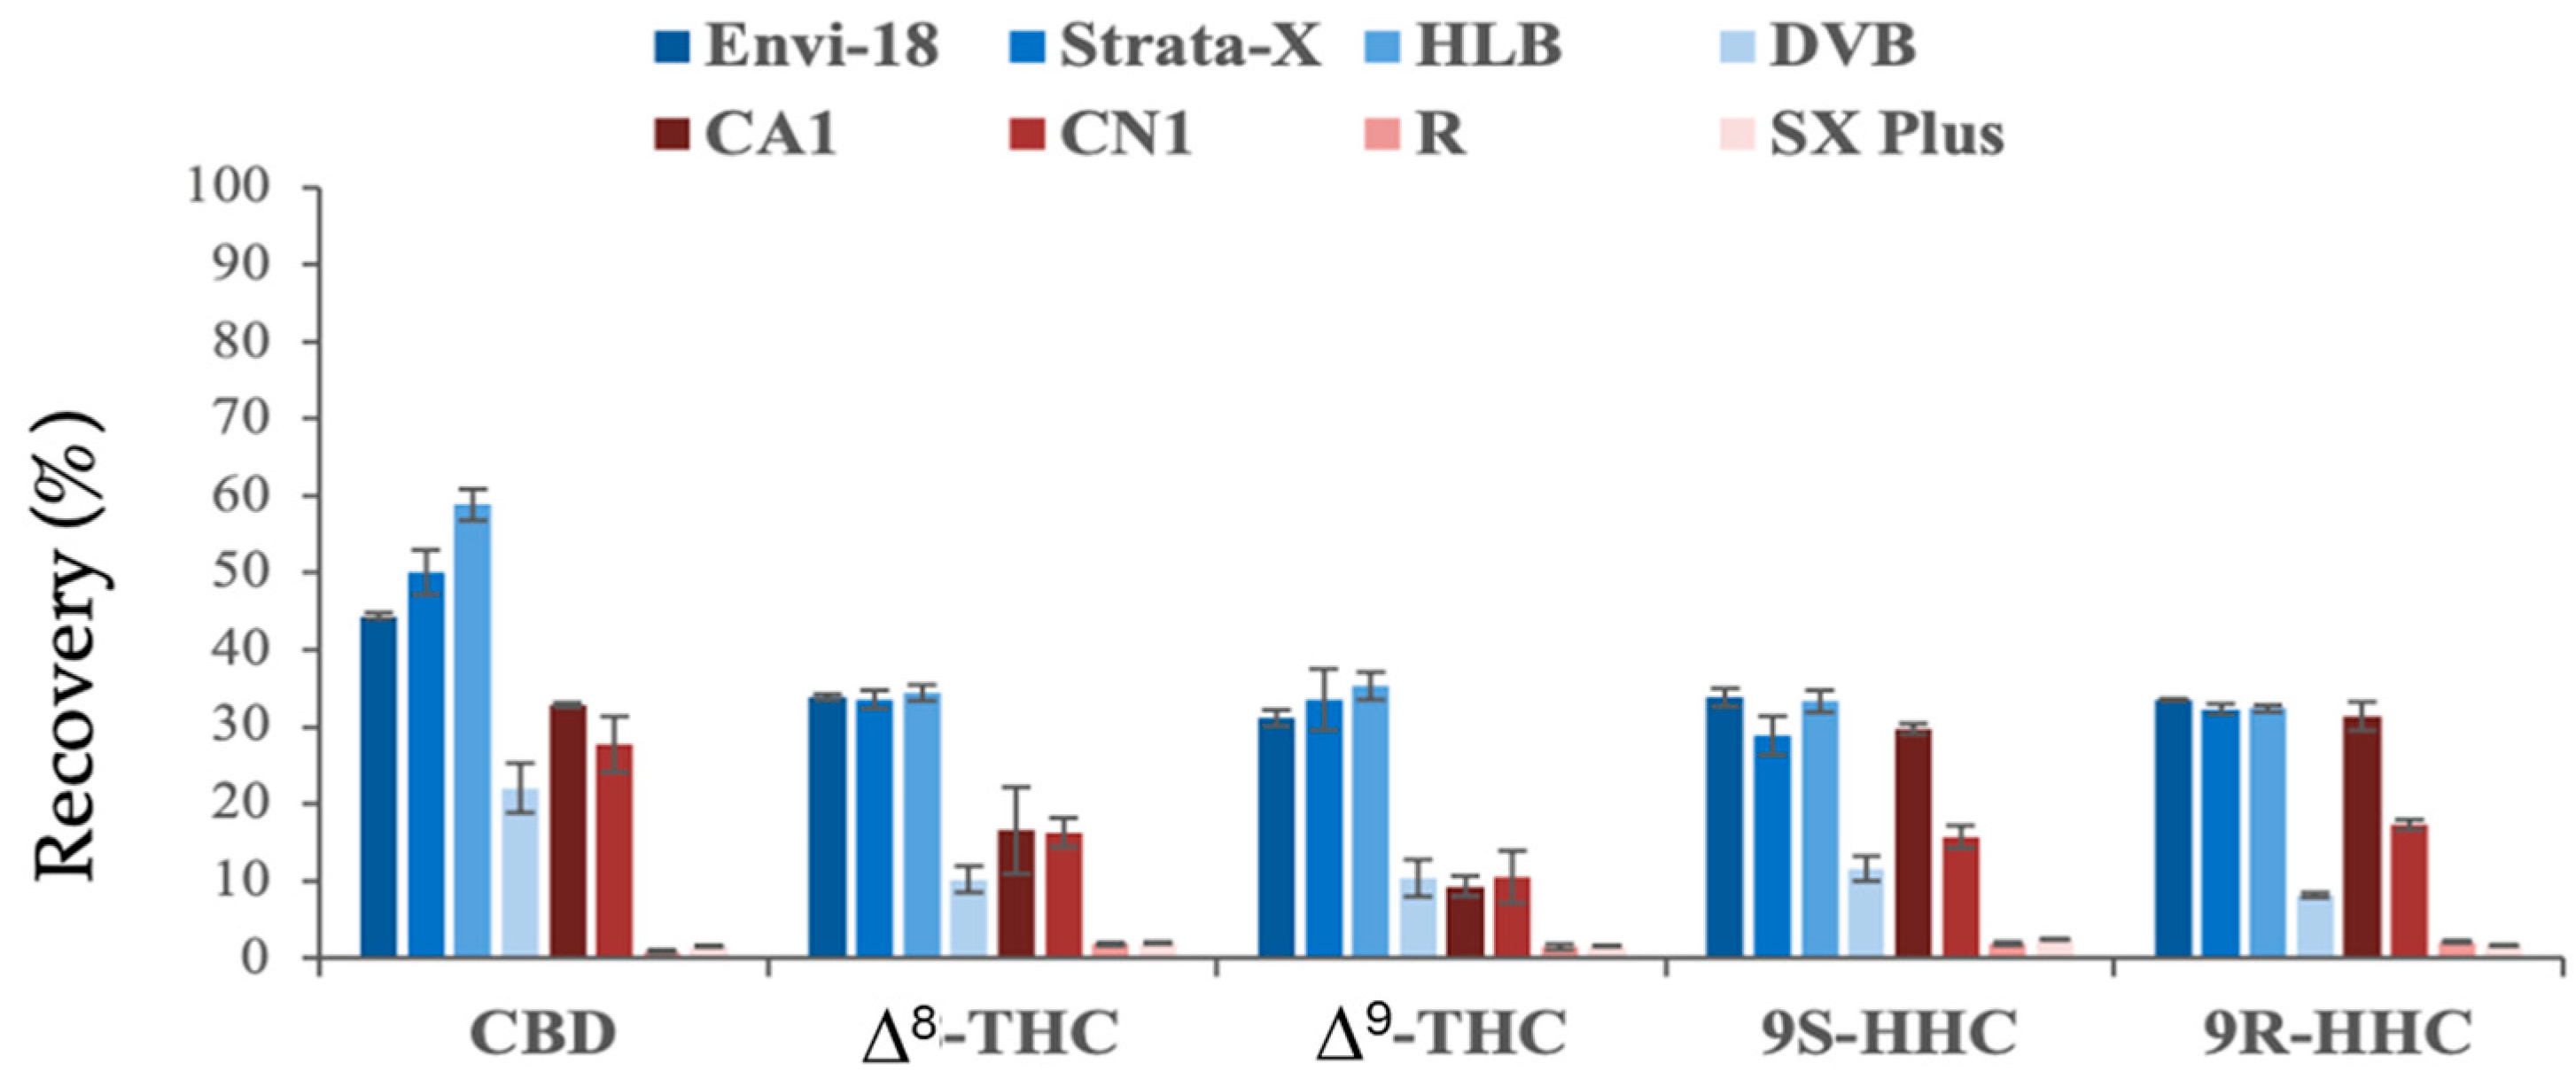
To select the most suitable sorbent phase, four ACs (SX plus, R, CN1, and CA1) and four polymers (HLB, Strata-X, ENVI 18, and DVB) were evaluated. Figure 3 shows the average recoveries obtained for the different sorbent materials tested. Initial observations indicated that the polymers provided a better analytical response, with significantly higher recoveries. The performance of the ACs varied according to their pHPZC, surface area, and pore size distribution, which influence the interactions based on the acidic or basic characteristics of the material surfaces. As the experiments were conducted at pH 5.5, the surface charge of the ACs ranged from negative to positive or nearly neutral, affecting their interaction with the analytes. The polymers, particularly HLB, exhibited higher recoveries for CBD, likely due to their larger surface areas and chemical structures that favor π–π and hydrophobic interactions with the semi-polar analytes. HLB was selected based on its superior precision and consistency for further optimization assays.

3.3.2. Optimization of the BAμE-μLD

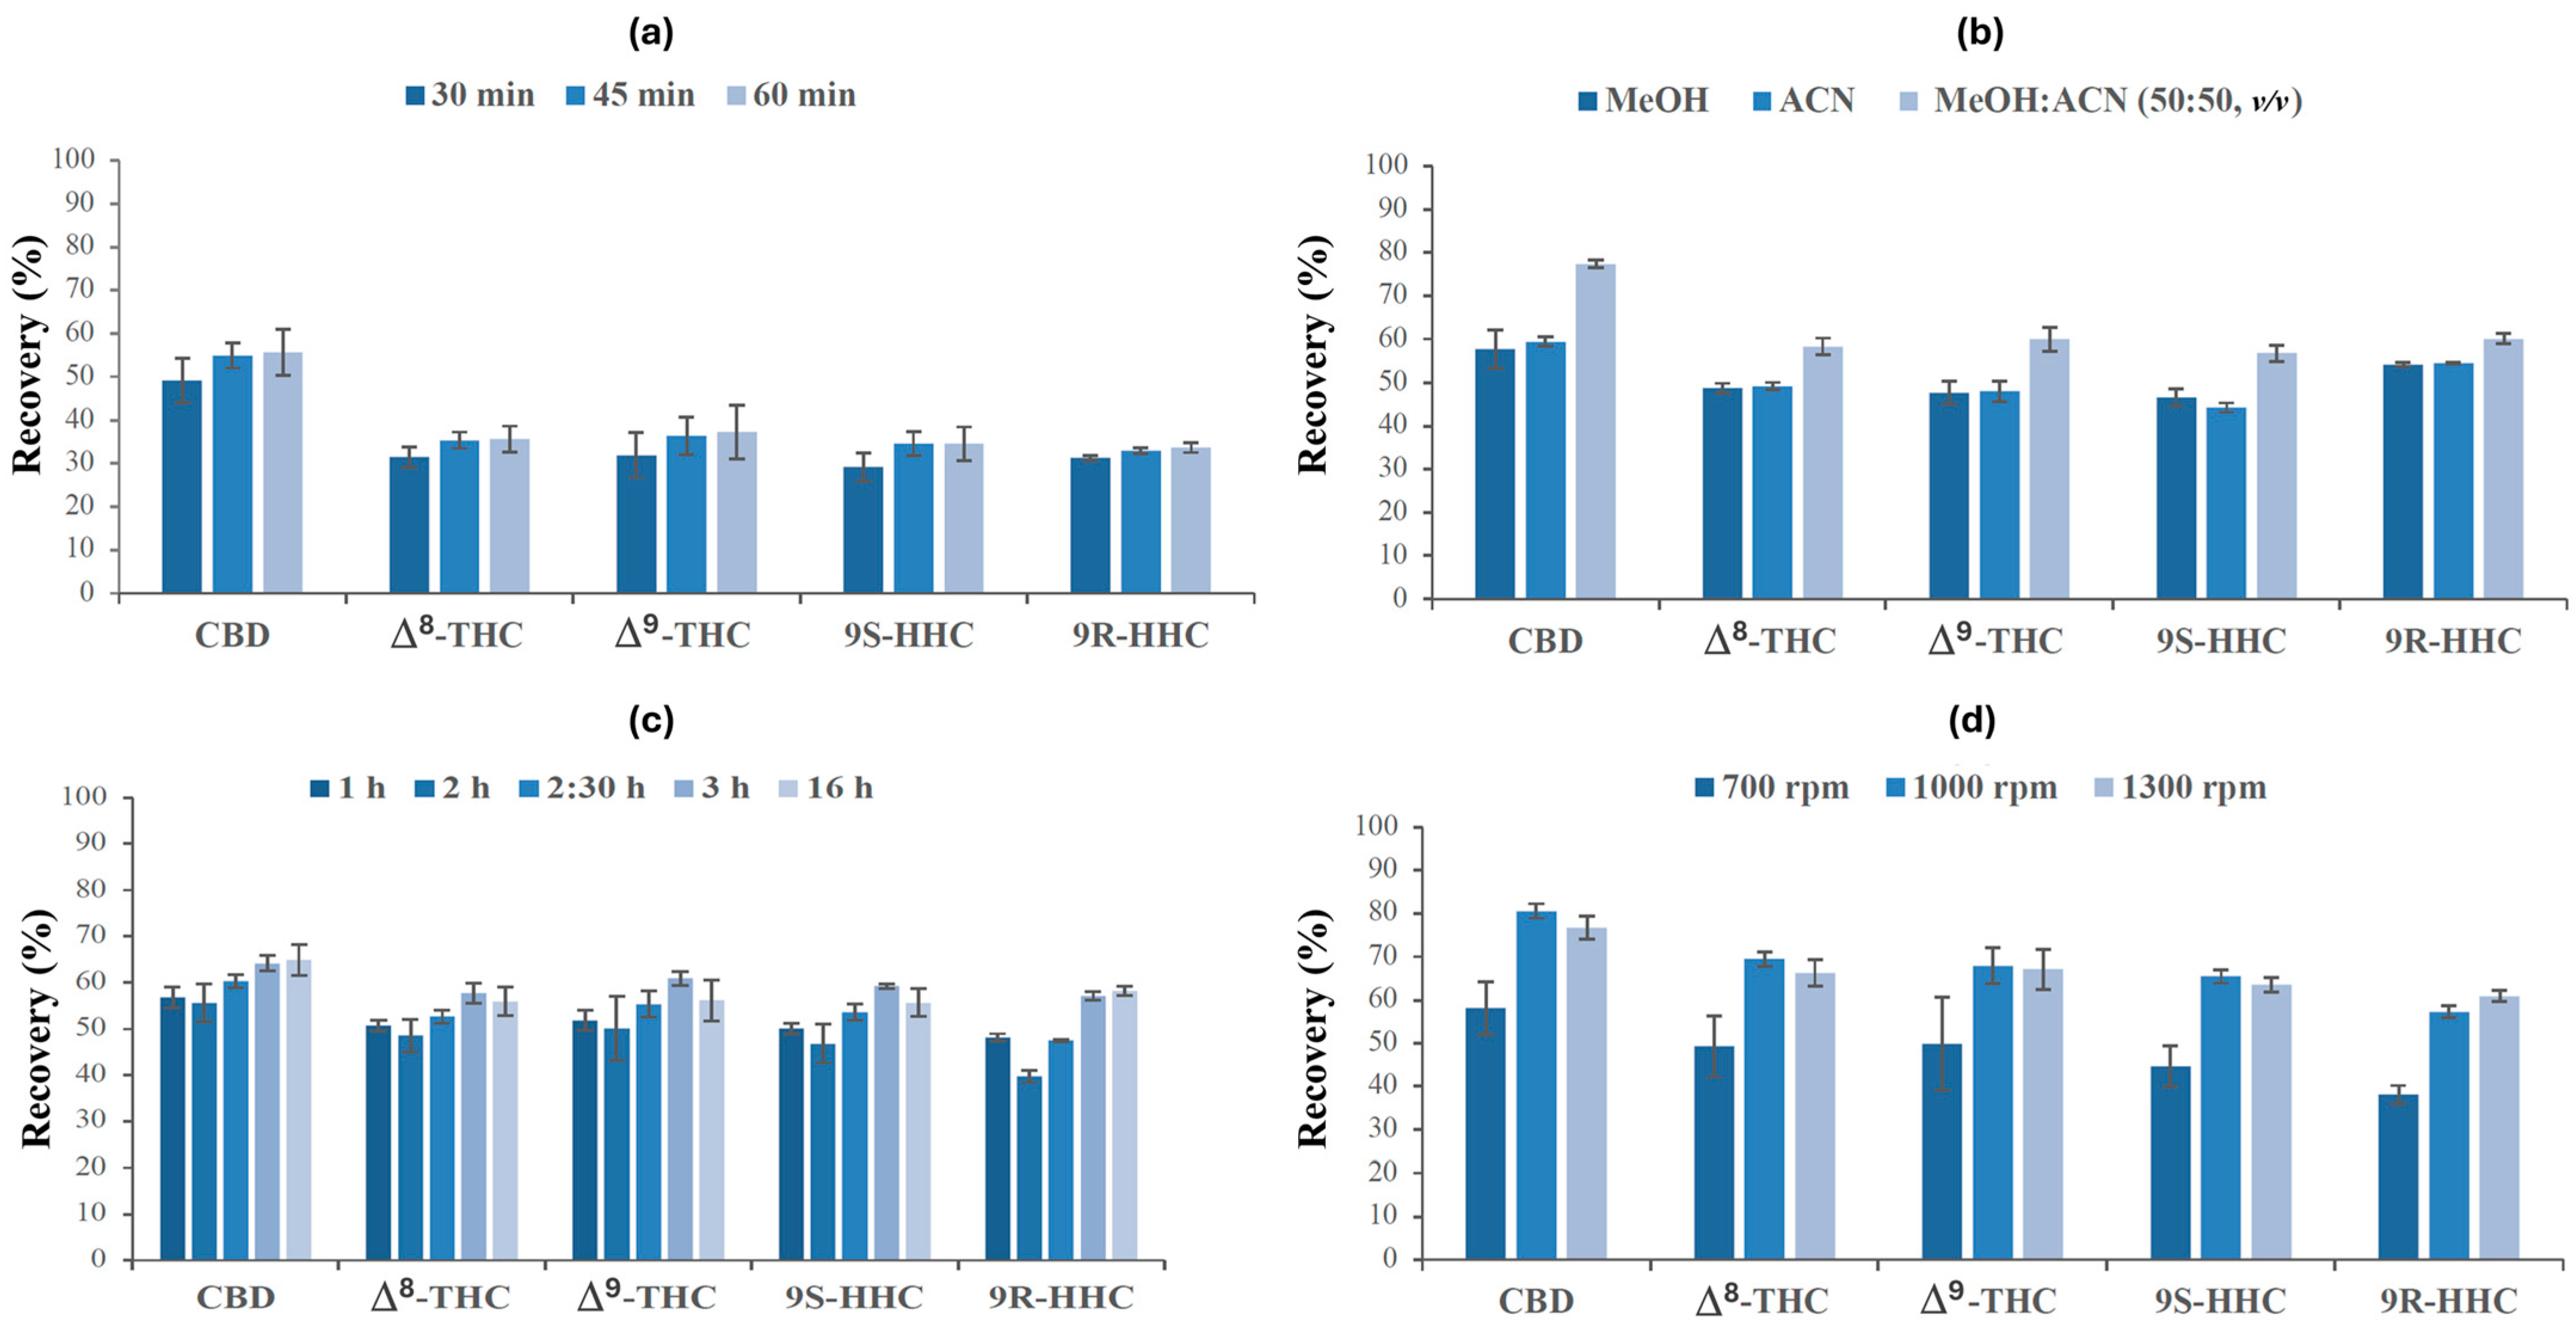
After selecting the best sorbent phase, several parameters that affect BAµE efficiency were optimized. The desorption solvent must possess sufficient elution strength to ensure complete analyte release from the sorbent, a process that can be enhanced by sonication. The back-extraction time under ultrasonic treatment was evaluated at 30, 45, and 60 min using the HLB polymer (Figure 4a). Similar recovery values were obtained at 45 and 60 min; however, 60 min of ultrasonic treatment increased the bath temperature, which could promote the BAµE device degradation. Moreover, the longer sonication time resulted in higher RSD% values. Therefore, a 45 min ultrasonic-assisted back-extraction was selected. The solvents tested were MeOH, ACN, and a MeOH/ACN mixture (50:50, v/v). The results demonstrated that the MeOH/ACN (50:50, v/v) mixture provided superior back-extraction efficiency for all analytes (Figure 4b). In this sense, a 45 min ultrasonic treatment using MeOH/ACN (50:50, v/v) was established as the optimized condition for the back-extraction step.
Following optimization of the back-extraction conditions, parameters affecting the microextraction process were studied, including equilibrium time, agitation speed, matrix pH, organic modifier, and ionic strength of the aqueous matrix. Extraction times of 1, 2, 2.5, 3, and 16 h were evaluated (Figure 4c). Except for the 2 h condition, likely influenced by experimental variability, recoveries generally increase up to 3 h for most cannabinoids. Maximum recovery was achieved at 3 h, with no significant improvements observed at longer extraction times. Additionally, this duration was more practical for routine laboratory application compared to the 16 h extraction.
The influence of agitation speed was subsequently evaluated (Figure 4d) at 700, 1000, and 1300 rpm. The highest recoveries were obtained at 1000 rpm. At 1300 rpm, the performance declined due to instability and equipment limitations. Therefore, 1000 rpm was selected for subsequent experiments.
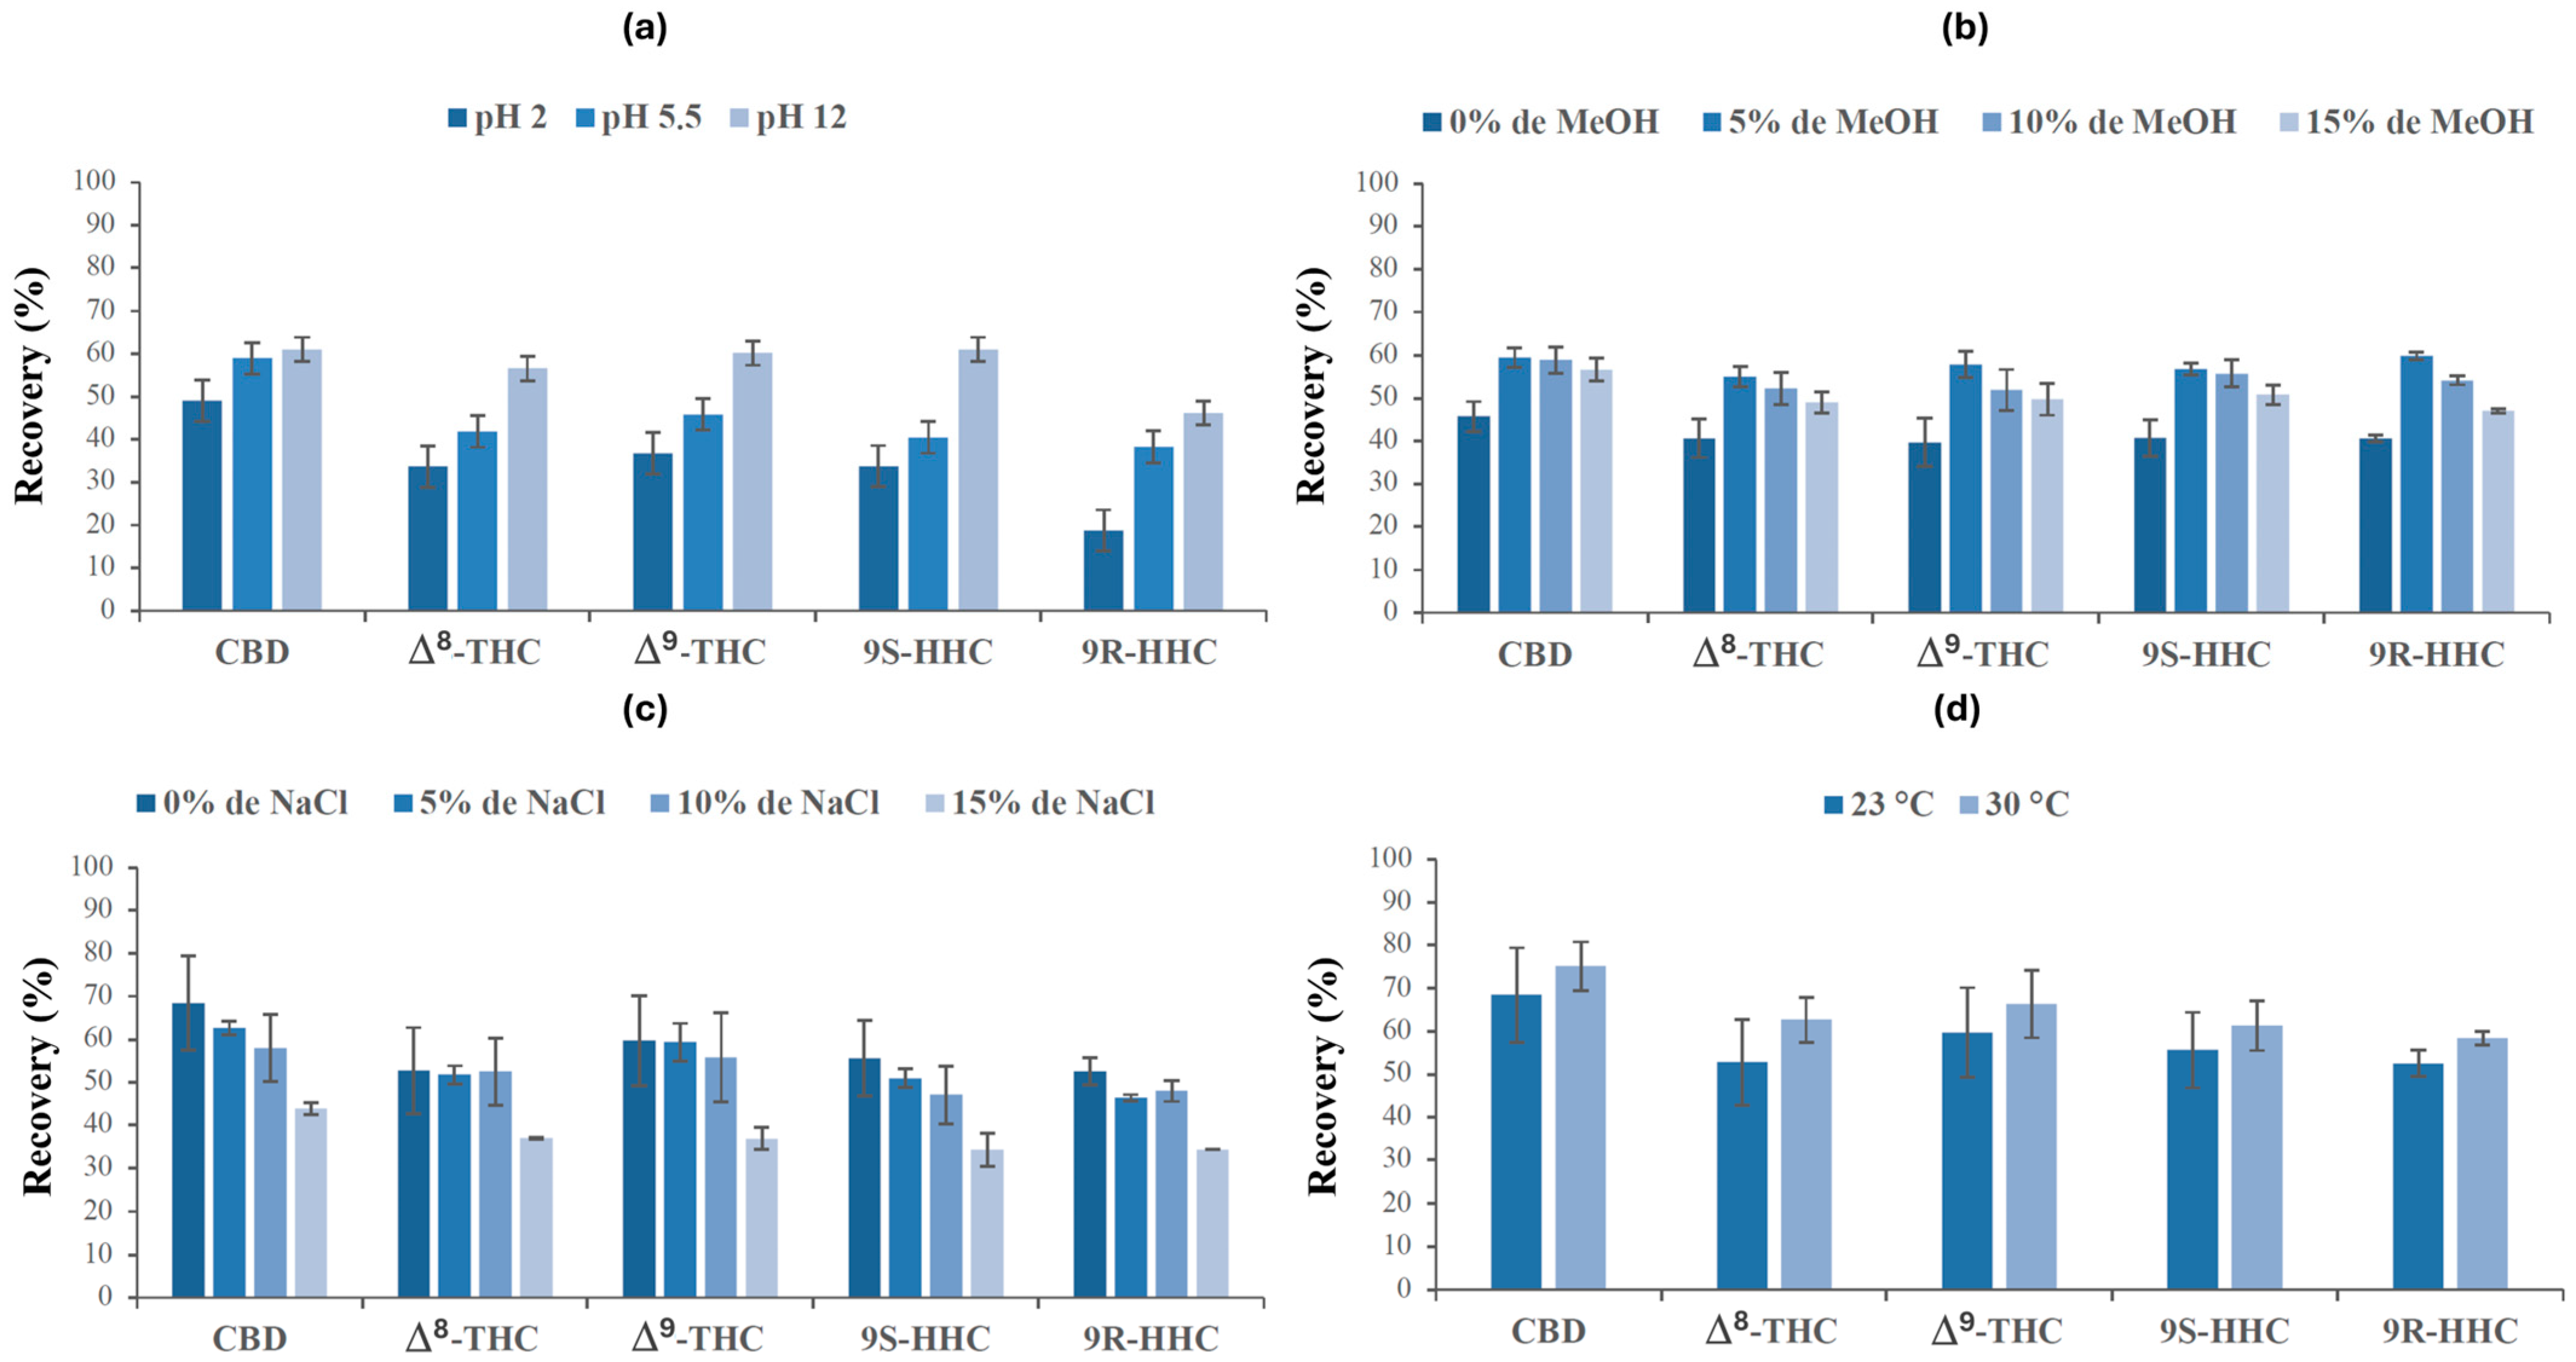
Subsequent experiments focused on matrix-related parameters, beginning with the evaluation of pH 2, 5.5 and 12 (Figure 5a). The results showed that recovery values increased as the pH became more alkaline for all cannabinoids under study, with pH 12 providing the highest recoveries. Higher pH values were not tested due to the potential degradation of the BAμE device.
The influence of matrix polarity and ionic strength was then assessed. The addition of an organic modifier (e.g., MeOH) to the sample can minimize the “wall-effect”, in which non-polar analytes adsorb onto the glass vials surfaces, reducing recovery [20,39,40]. MeOH addition was evaluated at 0, 5, 10, and 15% (v/v) (Figure 5b). The absence of MeOH resulted in lower recoveries, whereas the addition of 5% MeOH improved the extraction efficiency for all cannabinoids. However, further increases in MeOH content led to decreased recoveries. This behavior can be explained by the predominantly non-polar nature of the studied compounds, which exhibit high octanol/water partition coefficients (log KO/W > 5 for ∆8-THC, ∆9-THC, and CBD). Although no log KO/W data is available for HHC, it is expected to be similar to that of ∆9-THC [14]. Therefore, 5% of MeOH was selected for subsequent experiments.
The effect of ionic strength was investigated by adding NaCl (0, 5, 10, and 15%, w/v) to evaluate the “salting-out” effect (Figure 5c), which can promote analyte transfer from the aqueous matrix to the sorbent [33,41,42]. The results showed that increasing the percentage of NaCl reduced recovery for all analytes. This behavior may be attributed to partial blockage of the polymeric phase by salt ions, decreasing the effective surface area available for analyte interaction. Consequently, NaCl addition did not improve extraction performance and was not included in further experiments.
Finally, the effect of extraction temperature was evaluated at room temperature (23 °C) and 30 °C (Figure 5d). Increasing the temperature enhances analyte recovery by improving mass transfer kinetics and increasing analyte diffusion into the extraction phase, which facilitates the partitioning of the target compounds. Higher temperatures were not tested, to avoid potential degradation of the polypropylene device adhesive [32]. Therefore, 30 °C was selected as the optimal extraction temperature.

3.4. Method Validation

Following optimization of the experimental parameters, the developed BAμE(HLB)/GC-MS(SIM) methodology was validated under the optimized conditions. Method validation was performed using saliva matrices, assessing sensitivity, linearity, selectivity, specificity, trueness, accuracy, and precision, in accordance with the UNODC guidelines for quantitative analysis.

3.4.1. Linearity

For the linearity study, the following parameters were evaluated: coefficient of determination (r2), residual plots, and statistical tests, including the GoF and the LoF tests. The coefficients of determination obtained (r2 > 0.9963) indicated excellent linearity for all compounds (Table 3). The validity of the linear regression model was further confirmed by the GoF and LoF tests, as the calculated F values (Fcalc) were lower than the corresponding tabulated F values (Ftab) at a 95% confidence level (the F values are presented in the Supplementary Materials). These results demonstrate that the experimental data are consistent with a linear model, with no significant systematic deviation or lack of fit, confirming its adequacy for quantitative analysis.

3.4.2. Selectivity and Sensitivity (LOD and LOQ)

The selectivity and specificity of the method were evaluated by assessing potential interference from endogenous compounds in the biological matrix. Blank saliva samples were analyzed using the optimized methodology, and the resulting chromatograms were examined for any co-eluting peaks, particularly at the retention times of the target compounds. The acceptance criterion was the absence of interfering signals at these retention times. Method sensitivity was determined by estimating the LOD and LOQ, based on S/N ratios of 3:1 and 10:1, respectively, yielding LOD and LOQ values of 1.25 and 4.13 ng/mL for all cannabinoids studied. Calibration curves were constructed over the concentration range of 5–300 ng/mL and demonstrated excellent linearity, with r2 ≥ 0.9963 (Table 3).

3.4.3. Precision, Accuracy and Repeatability

Method precision and accuracy were evaluated using replicated samples at 15, 150, and 240 ng/mL. Repeatability was assessed within a single day (n = 3), while inter-day precision and accuracy were evaluated over three days (n = 9). All relative standard deviation (RSD%) and bias (%) values met the UNODC acceptance criteria and are summarized in Table 4. Optimization of these parameters all resulted in average recoveries for each cannabinoid ranging from 57.3% to 80.6% (Table 3).

3.5. Real Samples

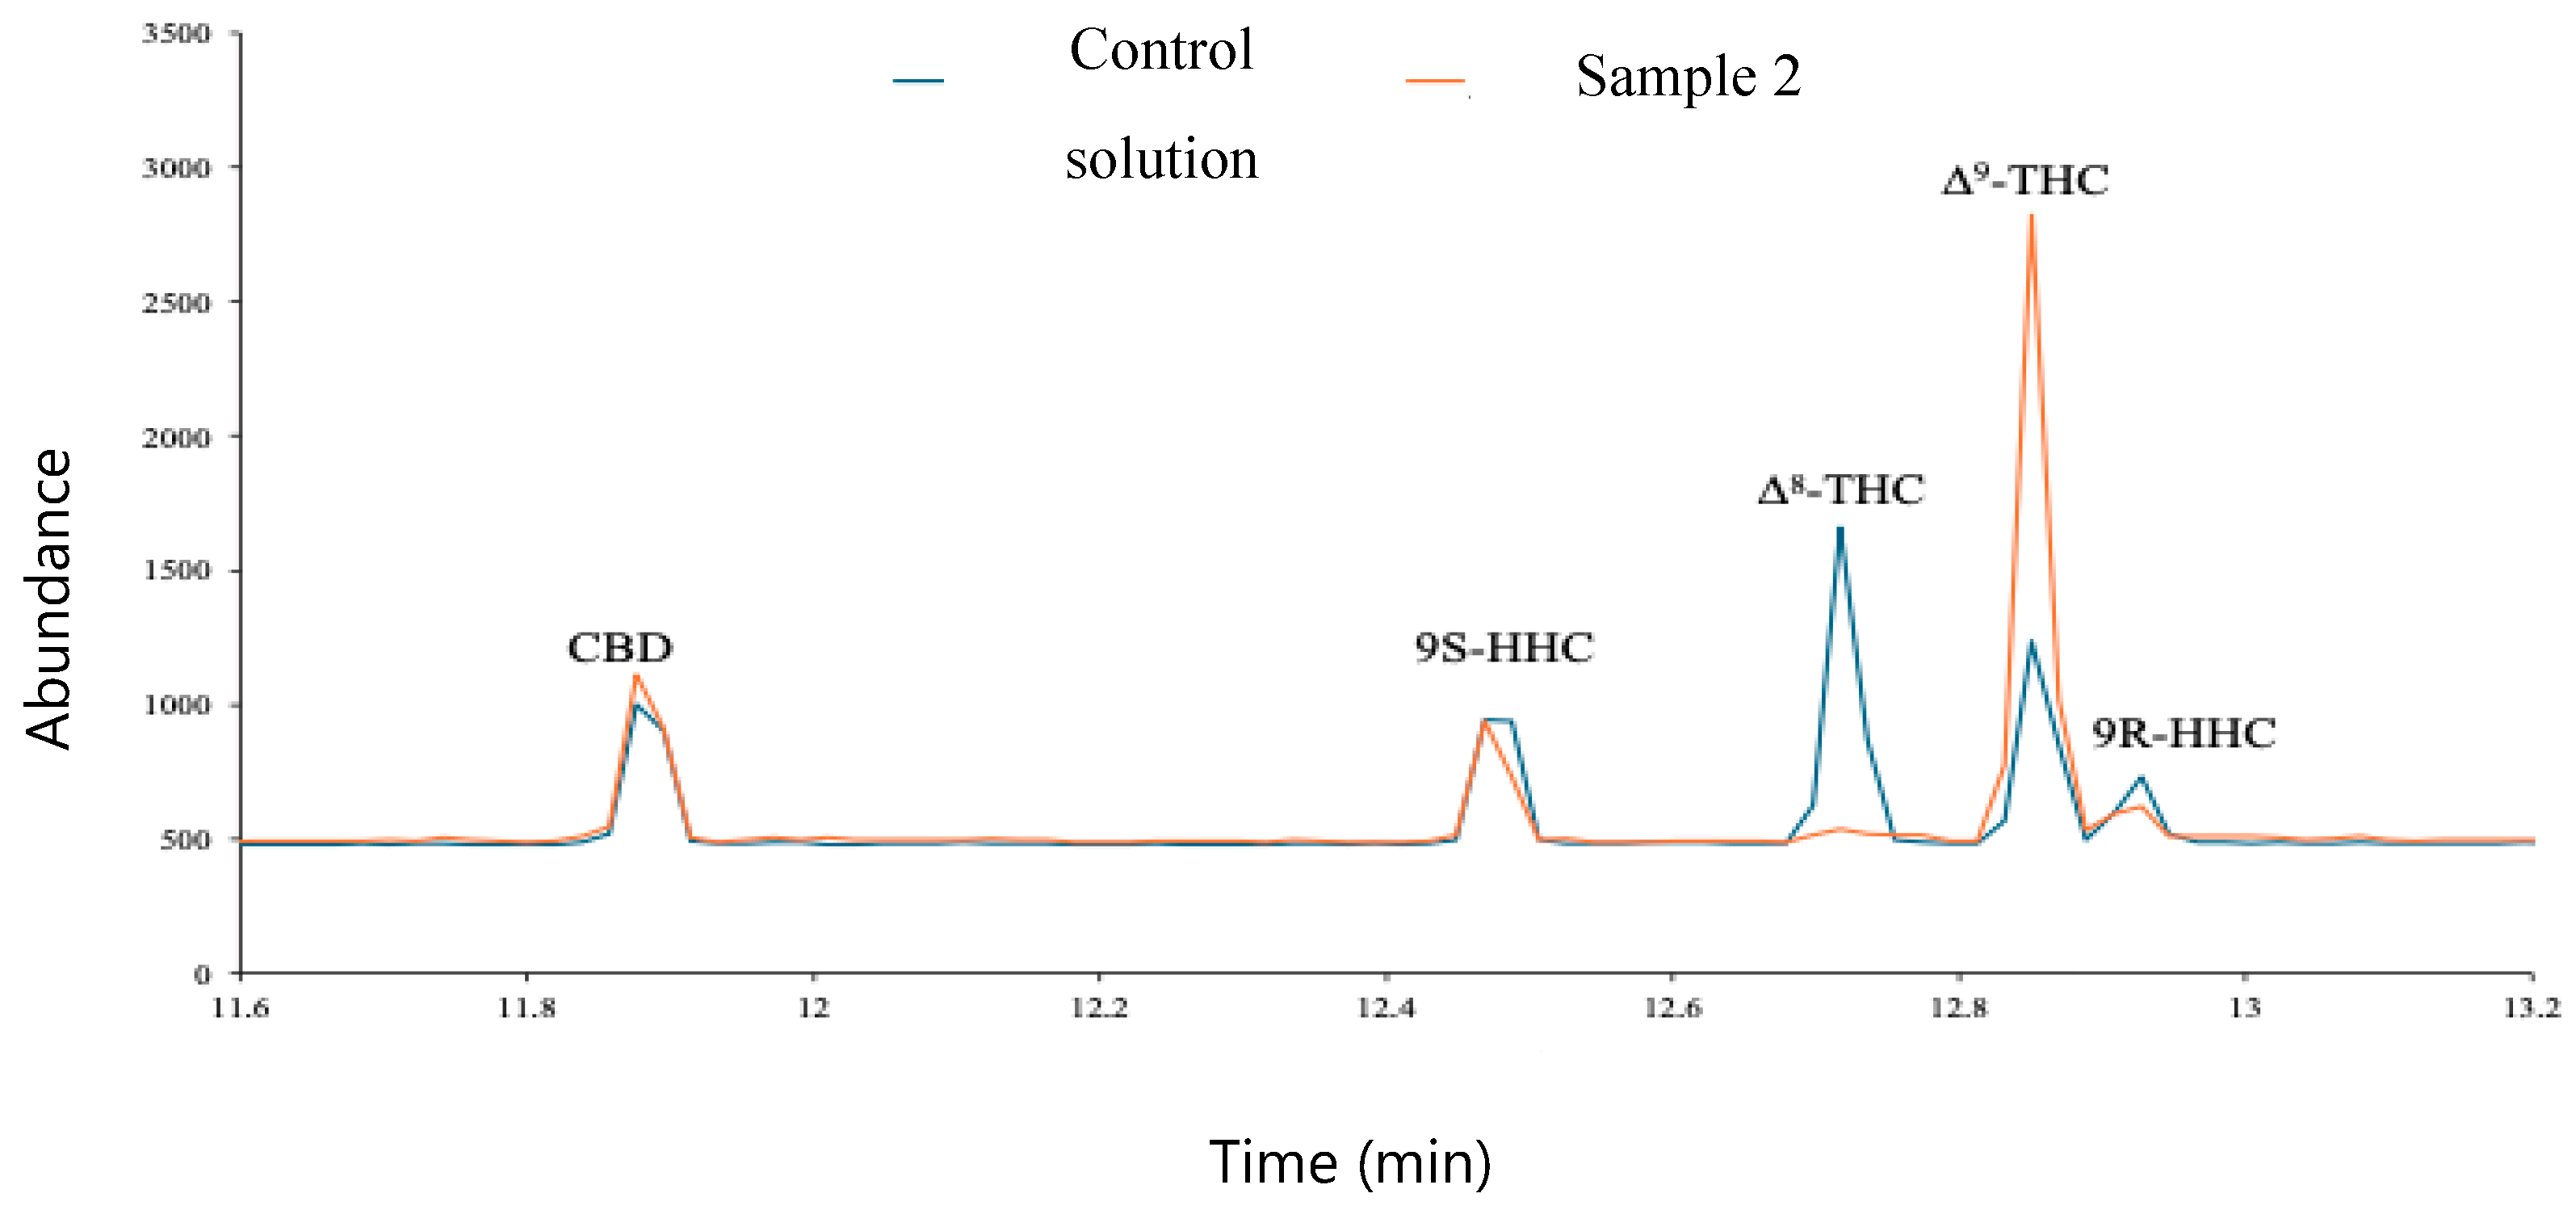
To assess the analytical performance of the developed BAμE/GC-MS(SIM) method, 3 saliva samples were analyzed. Samples were collected from HHC-consuming volunteers 30 min after cannabis use. Cannabinoids were identified by comparing retention times and mass spectra, and their concentrations were calculated using the validated calibration curves. In sample 1, CBD, ∆9-THC, and both HHC diastereoisomers were detected, whereas all target cannabinoids were identified in samples 2 and 3. Chromatograms of a control solution and sample 2 are shown in Figure 6.
Based on the linear equations for CBD, ∆8-THC, and the diastereomers of HHC, it was possible to determine the concentration of these compounds in the saliva of the volunteers. However, the concentrations of ∆9-THC were above the defined linear range, so to get an idea of its concentration, an extrapolation of the proposed linear range was carried out. Regarding CBD concentrations, these ranged from 19.2 to 191.2 ng/mL, while those of ∆9-THC were the highest, presenting results between 486.6 ng/mL and 672.9 ng/mL (values obtained by extrapolation). The cannabinoid ∆8-THC was the one that presented the lowest concentration values, being below the LOD in sample 1 and the LOQ in sample 3. It was possible to determine concentrations of 9S-HHC between 9.5 and 190.7 ng/mL and of 9R-HHC between 47.1 and 299.4 ng/mL. The determined concentrations are presented in Table 5.
Comparing the present results with the study by Anizan et al. (2013) [43], it is reported that CBD concentrations thirty minutes after consumption ranged from 4.5 to 255 ng/mL for frequent smokers and from 1.9 to 41.1 ng/mL for occasional smokers. However, the average concentrations were 21 ng/mL and 14.6 ng/mL, respectively. As for ∆9-THC, concentrations ranged from 189 to 6508 ng/mL for frequent smokers (with an average of 517 ng/mL) and from 84.5 to 1471 ng/mL (with an average of 533 ng/mL) for occasional smokers. The concentrations obtained for ∆9-THC and CBD are therefore in the same order as those described in the literature. The study developed by Lin et al. (2022) [44] for the quantification of various cannabinoids in saliva by LC-MS/MS demonstrated that the concentration of ∆8-THC can vary considerably (between 0.2 and 925.7 ng/mL). The low concentrations can be explained by the minimal levels of ∆8-THC naturally present in plants and, consequently, inadvertently consumed by individuals. On the other hand, when the concentrations of ∆8-THC are higher, it can be considered that the consumption was not involuntary. Thus, the concentration determined of 4.4 ng/mL in sample 2 is also in accordance with that described in the literature. The determined concentrations of 9S-HHC and 9R-HHC are in agreement with those described in the literature for the analysis of HHC in saliva by different analytical methods [45,46,47]. The difference between these concentrations may be related to the conditions of semi-synthesis. However, compared to the work of Höfert et al. (2023) [48], it is observed that the BAμE/GC-MS(SIM) methodology in saliva samples presents results approximately ten times higher than those obtained in blood by GC-MS.

3.6. Greenness and Practicality Assessment

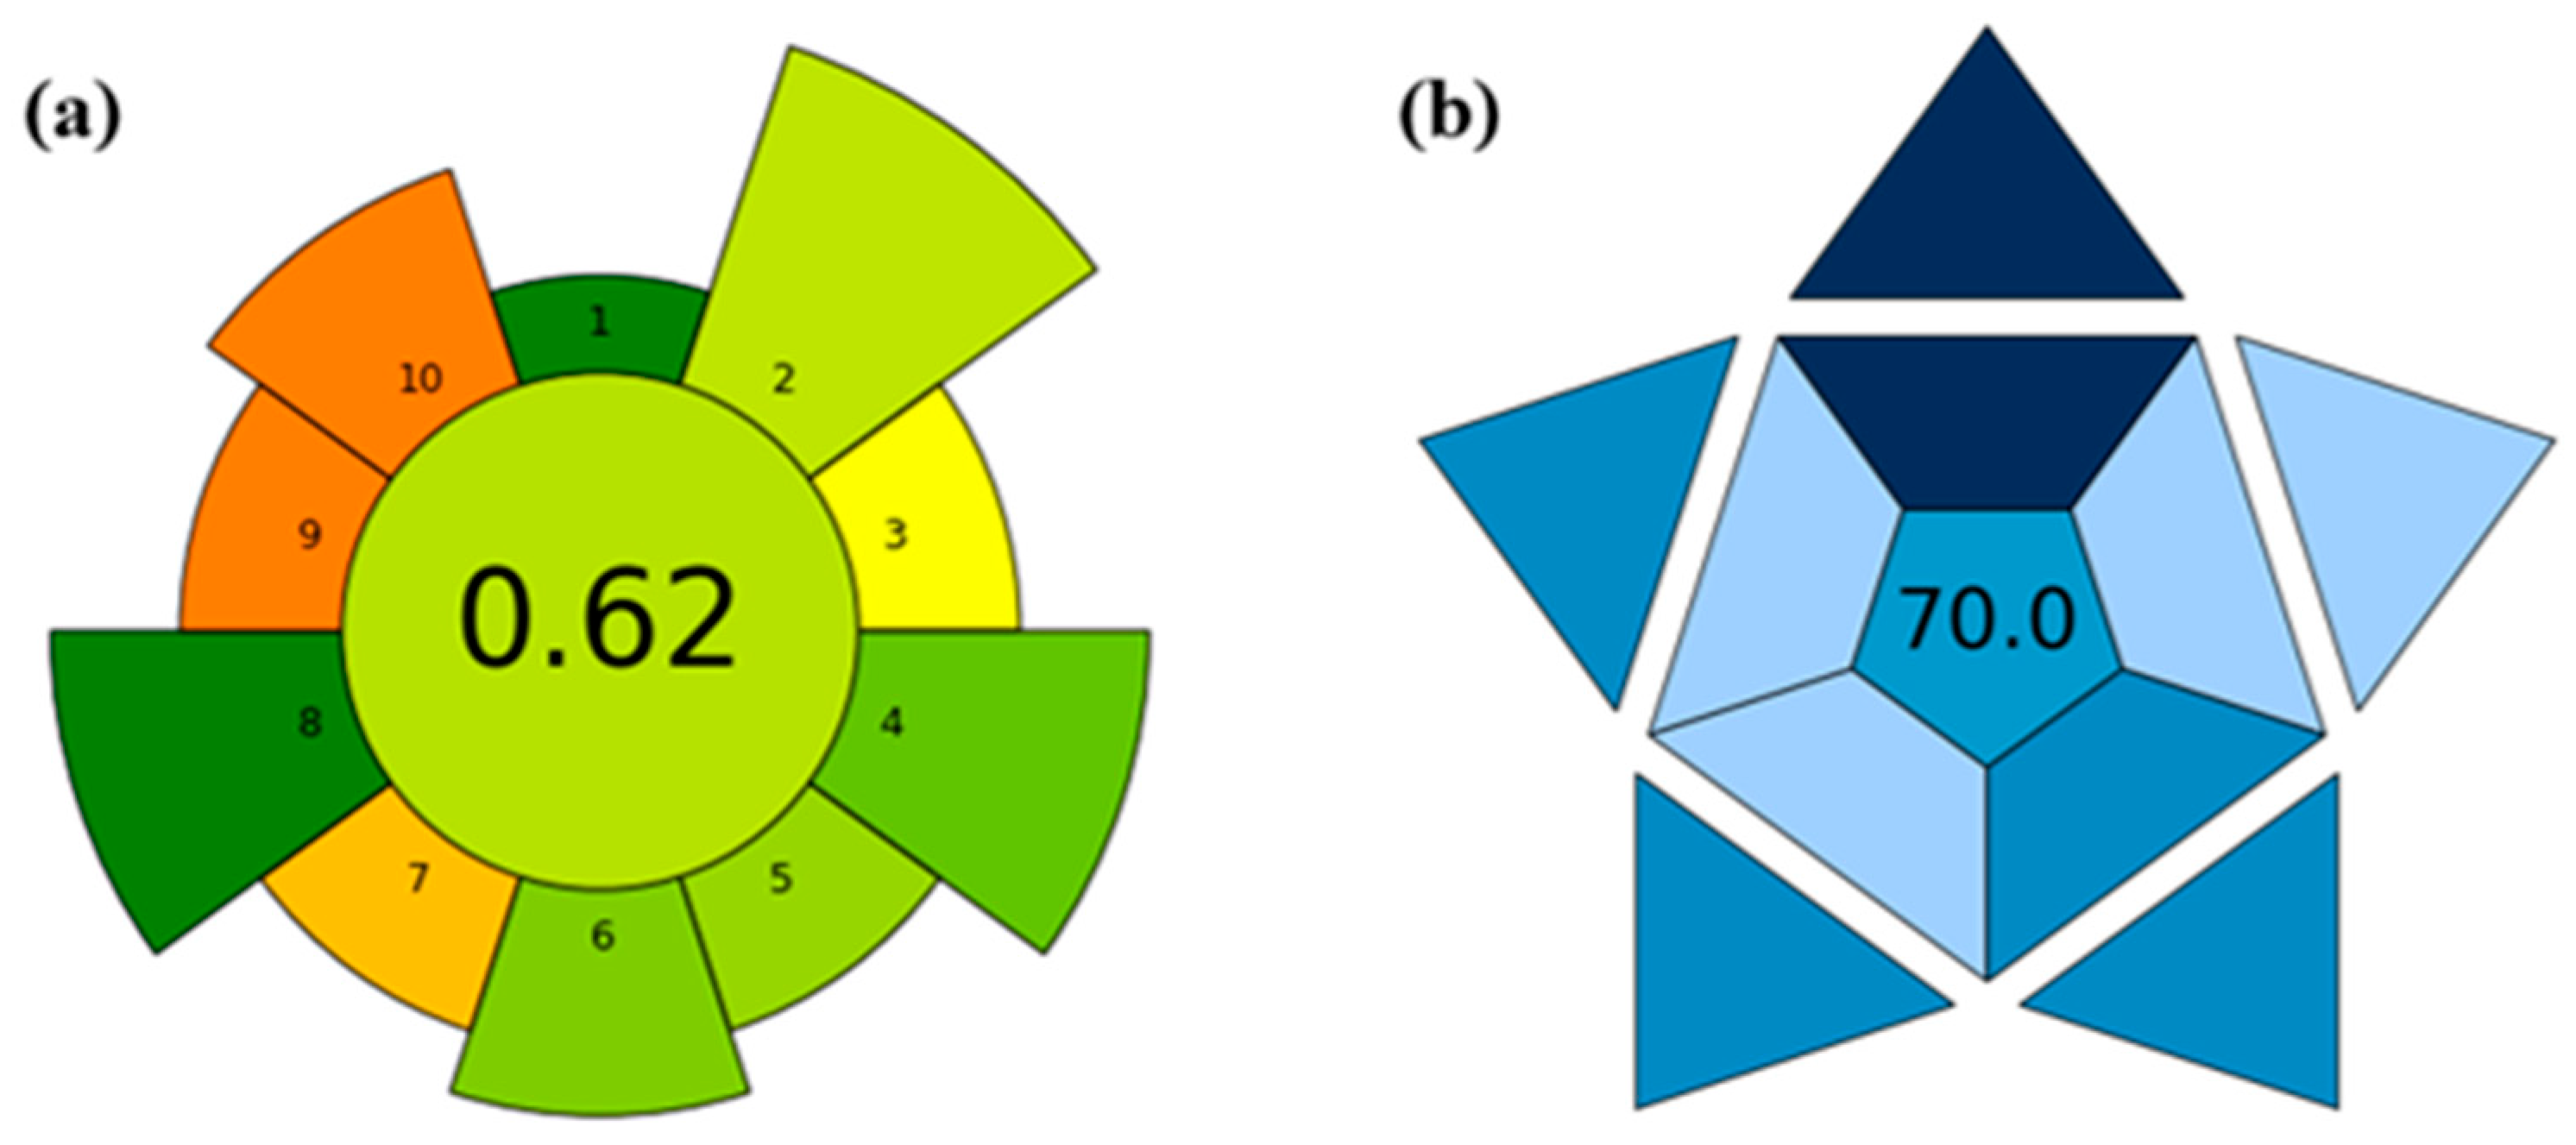
The environmental impact of the sample preparation procedure was evaluated using the AGREEprep metric [49]. The method achieved an overall score of 0.62 (Figure 7a), reflecting a favorable balance between analytical performance and ‘green’ chemistry principles. The high scores in categories 1 and 8 highlight the benefits of using a reduced sample scale and low-energy manual preparation. The moderate scores in categories 9 and 10 are typical for methods requiring mass detector and chemical derivatization, as these steps involve necessary solvent consumption and specialized reagents (MSTFA) to ensure the required sensitivity for cannabinoid detection.
To evaluate the practical applicability of the developed method, the Blue Applicability Grade Index (BAGI) was employed [50]. As shown in Figure 7b, the method achieved an overall score of 70.0. This score reflects a high degree of suitability for routine laboratory environments. The dark blue regions in the BAGI pictogram highlight the method’s strength in utilizing standard laboratory instrumentation and common reagents. While the sample preparation involving derivatization slightly lowers the scores in the ‘sample throughput’ categories, the overall result confirms that the method is a versatile and accessible tool for cannabinoid quantification in saliva matrices.
The AGREEprep coupled with the BAGI scores demonstrate that the method is both environmentally conscious and highly applicable for routine use.

4. Conclusions

This study proposed a green sample preparation methodology based on BAμE combined with GC-MS for the determination of CBD, ∆8-THC, ∆9-THC and HHC in saliva, a non-invasive biological matrix. The diastereoisomers were purified from herbal cannabis using HPLC–UV/Vis and structurally confirmed by GC-MS, LC-MS, and NMR, yielding purities of 72% for 9R-HHC and 91% for 9S-HHC. Instrumental optimization enabled chromatographic separation within 16 min, with good linearity, sensitivity, precision, and accuracy in accordance with UNODC guidelines. The optimized BAμE conditions provided satisfactory recoveries and low detection limits. Application of the validated method to real saliva samples produced results consistent with literature reports. The method demonstrated good environmental sustainability and practical applicability, with an AGREEprep score of 0.62 and a BAGI score of 70, supporting its suitability for routine analytical use. It should be noted that during the initial stages of this study, the commercial unavailability of HHC standards required an additional purification step from herbal cannabis. This necessity temporarily reduced the method’s cost-effectiveness and increased its complexity. However, as HHC standards have since become commercially accessible, the current methodology can now be implemented more efficiently. Future perspectives include the analysis of a broader range of emerging synthetic cannabinoids and the adaptation of the BAμE/GC-MS(SIM) approach to other non-invasive biological matrices, such as hair.
Overall, the methodology proved to be a simple, low-cost, miniaturized, and environmentally friendly alternative suitable for routine forensic, toxicological, and clinical applications.

Supplementary Materials

The following supporting information can be downloaded at https://www.mdpi.com/article/10.3390/separations13050134/s1. Figure S1. Chromatogram obtained through HPLC-UV/Vis analysis, under optimized instrumental conditions, of the herbal cannabis sample under study, at a concentration of 25 mg/mL (ACN/0.1% formic acid aqueous solution (70:30 v/v), 3.5 mL/min at 230 nm). Legend: A—CBDA; B—CBD; C and D—chromatographic peaks whose identity is unknown. Figure S2. LC-MS spectra of HHC. Figure S3. 1H NMR spectrum of HHC. Figure S4. 13C NMR spectrum of HHC. Figure S5. NOESY spectrum of 9R-HHC. Figure S6. NOESY spectrum of 9S-HHC. Table S1. FTab and FCalc values obtained for the lack-of-fit and goodness-of-fit statistical tests for the cannabinoids under study.

Author Contributions

Conceptualization, A.Q. and N.R.N.; methodology, M.B.P., A.Q. and N.R.N.; validation, M.B.P. and N.R.N.; formal analysis, M.B.P. and G.C.J.; investigation, M.B.P. and G.C.J.; resources, A.Q. and N.R.N.; data curation, M.B.P. and J.M.N.S.; writing—original draft preparation, J.M.N.S.; writing—review and editing, A.Q. and N.R.N.; visualization, M.B.P. and J.M.N.S.; supervision, A.Q. and N.R.N.; project administration, A.Q. and N.R.N.; funding acquisition, A.Q. and N.R.N. All authors have read and agreed to the published version of the manuscript.

Funding

Centro de Química Estrutural is a Research Unit funded by Fundação para a Ciência e a Tecnologia, I.P. (FCT) through projects UID/00100/2025 (https://doi.org/10.54499/UID/00100/2025), UID/PRR/00100/2025 (https://doi.org/10.54499/UID/PRR/00100/2025) and UID/PRR2/00100/2025 (https://doi.org/10.54499/UID/PRR2/00100/2025). The Institute of Molecular Sciences is an Associate Laboratory funded by FCT through project LA/P/0056/2020 (https://doi.org/10.54499/LA/P/0056/2020). CiiEM is supported by FCT by project reference UID/04585/2025 (https://doi.org/10.54499/UID/04585/2025). This work is supported by CiiEM Research Grant 2023 Non-Invasive Detection of Biomarkers in Saliva. This work is funded by national funds through FCT under project SENTINEL 2023.16046.ICDT (https://doi.org/10.54499/2023.16046.ICDT).

Institutional Review Board Statement

The study was conducted in accordance with the Decla-ration of Helsinki, and the protocol was approved by the Ethics Committee of Laboratório de Ciências Forenses e Psicológica Egas Moniz (Project identification code 0003) on 27 February 2024.

Informed Consent Statement

Informed consent was obtained from all subjects involved in the study.

Data Availability Statement

Data will be made available on request.

Conflicts of Interest

The authors declare no conflicts of interest.

References

  1. EMCDDA. European Drug Report 2025: Cannabis—The Current Situation in Europe; EMCDDA: Lisbon, Portugal, 2025. Available online: https://www.euda.europa.eu/sites/default/files/pdf/32295_en.pdf?581924 (accessed on 21 March 2026).
  2. UNODC. World Drug Report 2025; United Nations: New York, NY, USA, 2025. Available online: https://www.unodc.org/unodc/en/data-and-analysis/world-drug-report-2025.html (accessed on 21 March 2026).
  3. Gülck, T.; Møller, B. Phytocannabinoids: Origins and Biosynthesis. Trends Plant Sci. 2020, 25, 985–1004. [Google Scholar] [CrossRef]
  4. WHO. The Health and Social Effects of Nonmedical Cannabis Use; WHO: Geneva, Switzerland, 2016. Available online: https://iris.who.int/bitstream/handle/10665/251056/9789241510240-eng.pdf?sequence=1 (accessed on 21 March 2026).
  5. Jung, K.M.; Piomelli, D. Cannabinoids and Endocannabinoids. In Neuroscience in the 21st Century; Pfaff, D.W., Volkow, N.D., Rubenstein, J., Eds.; Springer: New York, NY, USA, 2022. [Google Scholar] [CrossRef]
  6. Brighenti, V.; Protti, M.; Anceschi, L.; Zanardi, C.; Mercolini, L.; Pellati, F. Emerging challenges in the extraction, analysis and bioanalysis of cannabidiol and related compounds. J. Pharm. Biomed. Anal. 2021, 192, 113633. [Google Scholar] [CrossRef]
  7. Filipiuc, L.E.; Ababei, D.C.; Alexa-Stratulat, T.; Pricope, C.V.; Bild, V.; Stefanescu, R.; Stanciu, G.D.; Tamba, B.I. Major Phytocannabinoids and Their Related Compounds: Should We Only Search for Drugs That Act on Cannabinoid Receptors? Pharmaceutics 2021, 13, 1823. [Google Scholar] [CrossRef]
  8. Kruger, J.S.; Kruger, D.J. Delta-8-THC: Delta-9-THC’s nicer younger sibling? J. Cannabis Res. 2022, 4, 4. [Google Scholar] [CrossRef]
  9. Alves, V.L.; Gonçalves, J.L.; Aguiar, J.; Teixeira, H.M.; Câmara, J.S. The synthetic cannabinoids phenomenon: From structure to toxicological properties. A review. Crit. Rev. Toxicol. 2020, 50, 359–382. [Google Scholar] [CrossRef]
  10. Correia, B.; Fernandes, J.; Botica, M.J.; Ferreira, C.; Quintas, A. Novel Psychoactive Substances: The Razor’s Edge between Therapeutical Potential and Psychoactive Recreational Misuse. Medicines 2022, 9, 19. [Google Scholar] [CrossRef] [PubMed]
  11. Wrzesien-Tokarczyk, W.; Masier, K.; Byrska, B.; Stanaszek, R.; Sekula, K. Semisynthetic Cannabinoids Detected in Cannabis-Derived Products in Poland: Statistical Overview, Analytical Challenges, and Legal Interpretative Considerations. Drug Test. Anal. 2025, 18, 287–302. [Google Scholar]
  12. Collins, A.; Ramirez, G.; Tesfatsion, T.; Ray, K.P.; Caudill, S.; Cruces, W. Synthesis and Characterization of the Diastereomers of HHC and H4CBD. Nat. Prod. Commun. 2023, 18, 1934578X231158910. [Google Scholar] [CrossRef]
  13. Janssens, L.K.; Van Uytfanghe, K.; Williams, J.B.; Hering, K.W.; Iula, D.M.; Stove, C.P. Investigation of the intrinsic cannabinoid activity of hemp-derived and semisynthetic cannabinoids with β-arrestin2 recruitment assays—And how this matters for the harm potential of seized drugs. Arch. Toxicol. 2024, 98, 2619–2630. [Google Scholar] [CrossRef] [PubMed]
  14. EMCDDA. Hexahydrocannabinol (HHC) and Related Substances; EMCDDA: Lisbon, Portugal, 2023. [CrossRef]
  15. Pitterl, F.; Pavlic, M.; Liu, J.; Oberacher, H. Insights Into the Human Metabolism of Hexahydrocannabinol by Non-Targeted Liquid Chromatography- High-Resolution Tandem Mass Spectrometry. J. Anal. Toxicol. 2024, 48, 350–358. [Google Scholar] [CrossRef]
  16. Gorziza, R.; Duarte, J.; González, M.; Arroyo-Mora, L.; Limberger, R. A systematic review of quantitative analysis of cannabinoids in oral fluid. J. Forensic Sci. 2021, 66, 2104–2112. [Google Scholar] [CrossRef]
  17. Lazarjani, M.; Torres, S.; Hooker, T.; Fowlie, C.; Young, O.; Seyfoddin, A. Methods for quantification of cannabinoids: A narrative review. J. Cannabis Res. 2020, 2, 35. [Google Scholar] [CrossRef] [PubMed]
  18. Shi, Y.; Liu, M.; Li, X.; Xu, N.; Yuan, S.; Yu, Z.; Xiang, P.; Wu, H. Simultaneous screening of 239 synthetic cannabinoids and metabolites in blood and urine samples using liquid chromatography–high resolution mass spectrometry. J. Chromatogr. A 2022, 1663, 462743. [Google Scholar] [CrossRef]
  19. Jain, R.; Singh, R. Microextraction techniques for analysis of cannabinoids. Trends Anal. Chem. 2016, 80, 156–166. [Google Scholar] [CrossRef]
  20. Ahmad, S.M.; Almeida, C.; Neng, N.R.; Nogueira, J.M.F. Application of bar adsorptive microextraction (BAμE) for anti-doping control screening of anabolic steroids in urine matrices. J. Chromatogr. B 2014, 969, 35–41. [Google Scholar] [CrossRef]
  21. Gałuszka, A.; Migaszewski, Z.; Namieśnik, J. The 12 principles of green analytical chemistry and the SIGNIFICANCE mnemonic of green analytical practices. TrAC Trends Anal. Chem. 2013, 50, 78–84. [Google Scholar] [CrossRef]
  22. Ide, A.H.; Nogueira, J.M.F. New-generation bar adsorptive microextraction (BAμE) devices for a better eco-user-friendly analytical approach–Application for the determination of antidepressant pharmaceuticals in biological fluids. J. Pharm. Biomed. Anal. 2018, 153, 126–134. [Google Scholar] [CrossRef]
  23. Antunes, M.; Barroso, M.; Gallardo, E. Analysis of Cannabinoids in Biological Specimens: An Update. Int. J. Environ. Res. Public Health 2023, 20, 2312. [Google Scholar] [CrossRef]
  24. Nicolaou, A.G.; Christodoulou, M.C.; Stavrou, I.J.; Kapnissi-Christodoulou, C.P. Analysis of cannabinoids in conventional and alternative biological matrices by liquid chromatography: Applications and challenges. J. Chromatogr. A 2021, 1651, 462277. [Google Scholar] [CrossRef]
  25. Correia, B.; Ahmad, S.; Quintas, A. Determination of phytocannabinoids in cannabis samples by ultrasound-assisted solid-liquid extraction and high- performance liquid chromatography with diode array detector analysis. J. Chromatogr. A 2023, 1705, 464191. [Google Scholar] [CrossRef]
  26. Micalizzi, G.; Vento, F.; Alibrando, F.; Donnarumma, D.; Dugo, P.; Mondello, L. Cannabis Sativa L.: A comprehensive review on the analytical methodologies for cannabinoids and terpenes characterization. J. Chromatogr. A 2021, 1637, 461864. [Google Scholar] [CrossRef]
  27. Casati, S.; Rota, P.; Bergamaschi, R.; Palmisano, E.; La Rocca, P.; Ravelli, A.; Angeli, I.; Minoli, M.; Roda, G.; Orioli, M. Hexahydrocannabinol on the Light Cannabis Market: The Latest “New” Entry. Cannabis Cannabinoid Res. 2022, 9, 622–628. [Google Scholar] [CrossRef]
  28. Russo, F.; Vandelli, M.; Biagini, G.; Schmid, M.; Luongo, L.; Perrone, M.; Ricciardi, F.; Maione, S.; Laganà, A.; Capriotti, A.; et al. Synthesis and pharmacological activity of the epimers of hexahydrocannabinol (HHC). Sci. Rep. 2023, 13, 11061. [Google Scholar] [CrossRef] [PubMed]
  29. Stothard, A.I.; Layle, N.K.; Martin, M.J.; Liu, J.; Bassman, J.R.; Williams, J.B.; Hering, K.W. Characterization of Hexahydrocannabinol Diastereomers by NMR, HPLC, GC-MS, and TLC. Cayman Chemical. 2023. Available online: https://cdn2.caymanchem.com/cdn/cms/caymanchem/LiteratureCMS/Characterization%20of%20HHC%20Diastereomers.pdf (accessed on 21 March 2026).
  30. Schirmer, W.; Auwärter, V.; Kaudewitz, J.; Schürch, S.; Weinmann, W. Identification of human hexahydrocannabinol metabolites in urine. Eur. J. Mass Spectrom. 2023, 29, 326–337. [Google Scholar] [CrossRef]
  31. Tanaka, R.; Kikura-Hanajiri, R. Identification of hexahydrocannabinol (HHC), dihydro-iso-tetrahydrocannabinol (dihydro-iso-THC) and hexahydrocannabiphorol (HHCP) in electronic cigarette cartridge products. Forensic Toxicol. 2024, 42, 71–81. [Google Scholar] [CrossRef]
  32. Neng, N.R.; Silva, A.R.M.; Nogueira, J.M.F. Adsorptive micro-extraction techniques—Novel analytical tools for trace levels of polar solutes in aqueous media. J. Chromatogr. A 2010, 1217, 7303–7310. [Google Scholar] [CrossRef] [PubMed]
  33. Ahmad, S.M.; Mestre, A.S.; Neng, N.R.; Ania, C.O.; Carvalho, A.P.; Nogueira, J.M.F. Carbon-Based Sorbent Coatings for the Determination of Pharmaceutical Compounds by Bar Adsorptive Microextraction. ACS Appl. Bio Mater. 2020, 3, 2078–2091. [Google Scholar] [CrossRef] [PubMed]
  34. UNODC. Guidance for the Validation of Analytical Methodology and Calibration of Equipment Used for Testing of Illicit Drugs in Seized Materials and Biological Specimens; United Nations: New York, NY, USA, 2009. Available online: https://www.unodc.org/documents/scientific/validation_E.pdf (accessed on 21 March 2026).
  35. ENFSI. Best Practice Manual (BPM) for Controlled Drug Analysis; ENFSI: Wiesbaden, Germany, 2020; Available online: https://enfsi.eu/wp-content/uploads/2017/06/BPM-Control-drug-Analysis-final-version.-21-02-2020.pdf (accessed on 21 March 2026).
  36. UNODC. Recommended Methods for the Identification and Analysis of Cannabis and Cannabis Products; UNODC: Lima, Peru, 2022. Available online: https://www.unodc.org/documents/scientific/Recommended_methods_for_the_Identification_and_Analysis_of_Cannabis_and_Cannabis_products.pdf (accessed on 21 March 2026).
  37. Margalho, C.; Castanheira, A.; Real, F.C.; Gallardo, E.; López-Rivadulla, M. Determination of «new psychoactive substances» in postmortem matrices using microwave derivatization and gas chromatography-mass spectrometry. J. Chromatogr. B 2016, 1020, 14–23. [Google Scholar] [CrossRef]
  38. Söderholm, S.L.; Damm, M.; Kappe, C.O. Microwave-assisted derivatization procedures for gas chromatography/mass spectrometry analysis. Mol. Divers. 2010, 14, 869–888. [Google Scholar] [CrossRef]
  39. Almeida, C.; Ahmad, S.M.; Nogueira, J.M.F. Bar adsorptive microextraction technique—Application for the determination of pharmaceuticals in real matrices. Anal. Bioanal. Chem. 2017, 409, 2093–2106. [Google Scholar]
  40. Almeida, C.; Strzelczyk, R.; Nogueira, J.M.F. Improvements on bar adsorptive microextraction (BAμE) technique—Application for the determination of insecticide repellents in environmental water matrices. Talanta 2014, 120, 126–134. [Google Scholar] [CrossRef] [PubMed]
  41. Kim, E.-M.; Lee, J.-S.; Park, M.-J.; Choi, S.-K.; Lim, M.-A.; Chung, H.-S. Standardization of method for the analysis of dextromethorphan in urine. Forensic Sci. Int. 2006, 161, 198–201. [Google Scholar] [CrossRef]
  42. Yasien, S.; Ali, E.; Javed, M.; Iqbal, M.M.; Iqbal, S.; Alrbyawi, H.; Aljazzar, S.O.; Elkaeed, E.B.; Dera, A.A.; Pashameah, R.A.; et al. Simultaneous Quantification of Opioids in Blood and Urine by Gas Chromatography-Mass Spectrometer with Modified Dispersive Solid-Phase Extraction Technique. Molecules 2022, 27, 6761. [Google Scholar] [CrossRef]
  43. Anizan, S.; Milman, G.; Desrosiers, N.; Barnes, A.J.; Gorelick, D.A.; Huestis, M.A. Oral fluid cannabinoid concentrations following controlled smoked cannabis in chronic frequent and occasional smokers. Anal. Bioanal. Chem. 2013, 405, 8451–8461. [Google Scholar] [CrossRef]
  44. Lin, L.; Amaratunga, P.; Reed, J.; Huang, P.; Lemberg, B.L.; Lemberg, D. Quantitation of Δ8-THC, Δ9-THC, Cannabidiol and 10 Other Cannabinoids and Metabolites in Oral Fluid by HPLC-MS-MS. J. Anal. Toxicol. 2022, 46, 76–88. [Google Scholar] [CrossRef]
  45. Bottinelli, C.; Baradian, P.; Poly, A.; Hoizey, G.; Chatenay, C. Identification and quantification of both isomers of hexahydrocannabinol, (9R)- hexahydrocannabinol and (9S)-hexahydrocannabinol, in three different matrices by mass spectrometry. Rapid Commun. Mass Spectrom. 2024, 38, e9711. [Google Scholar] [CrossRef] [PubMed]
  46. Di Trana, A.; Sprega, G.; Kobidze, G.; Taoussi, O.; Lo Faro, A.F.; Bambagiotti, G.; Montanari, E.; Fede, M.S.; Carlier, J.; Tini, A.; et al. QuEChERS Extraction and Simultaneous Quantification in GC- MS/MS of Hexahydrocannabinol Epimers and Their Metabolites in Whole Blood, Urine, and Oral Fluid. Molecules 2024, 29, 3440. [Google Scholar] [CrossRef]
  47. Kobidze, G.; Sprega, G.; Montanari, E.; Taoussi, O.; Bambagiotti, G.; Fede, M.S.; Di Trana, A.; Pichini, S.; Busardò, F.P.; Tini, A.; et al. The first LC-MS/MS stereoselective bioanalytical methods to quantitatively detect 9R- and 9S-hexahydrocannabinols and their metabolites in human blood, oral fluid and urine. J. Pharm. Biomed. Anal. 2024, 240, 115918. [Google Scholar] [CrossRef]
  48. Höfert, L.; Becker, S.; Dreßler, J.; Baumann, S. Quantification of (9R)- and (9S)-hexahydrocannabinol (HHC) via GC–MS in serum/plasma samples from drivers suspected of cannabis consumption and immunological detection of HHC and related substances in serum, urine, and saliva. Drug Test. Anal. 2023, 16, 489–497. [Google Scholar] [CrossRef] [PubMed]
  49. Wojnowski, W.; Tobiszewski, M.; Pena-Pereira, F.; Psillakis, E. AGREEprep–Analytical greenness metric for sample preparation. TrAC Trends Anal. Chem. 2022, 149, 116553. [Google Scholar] [CrossRef]
  50. Manousi, N.; Wojnowski, W.; Płotka-Wasylka, J.; Samanidou, V. Blue applicability grade index (BAGI) and software: A new tool for the evaluation of method practicality. Green Chem. 2023, 25, 7598–7604. [Google Scholar] [CrossRef]
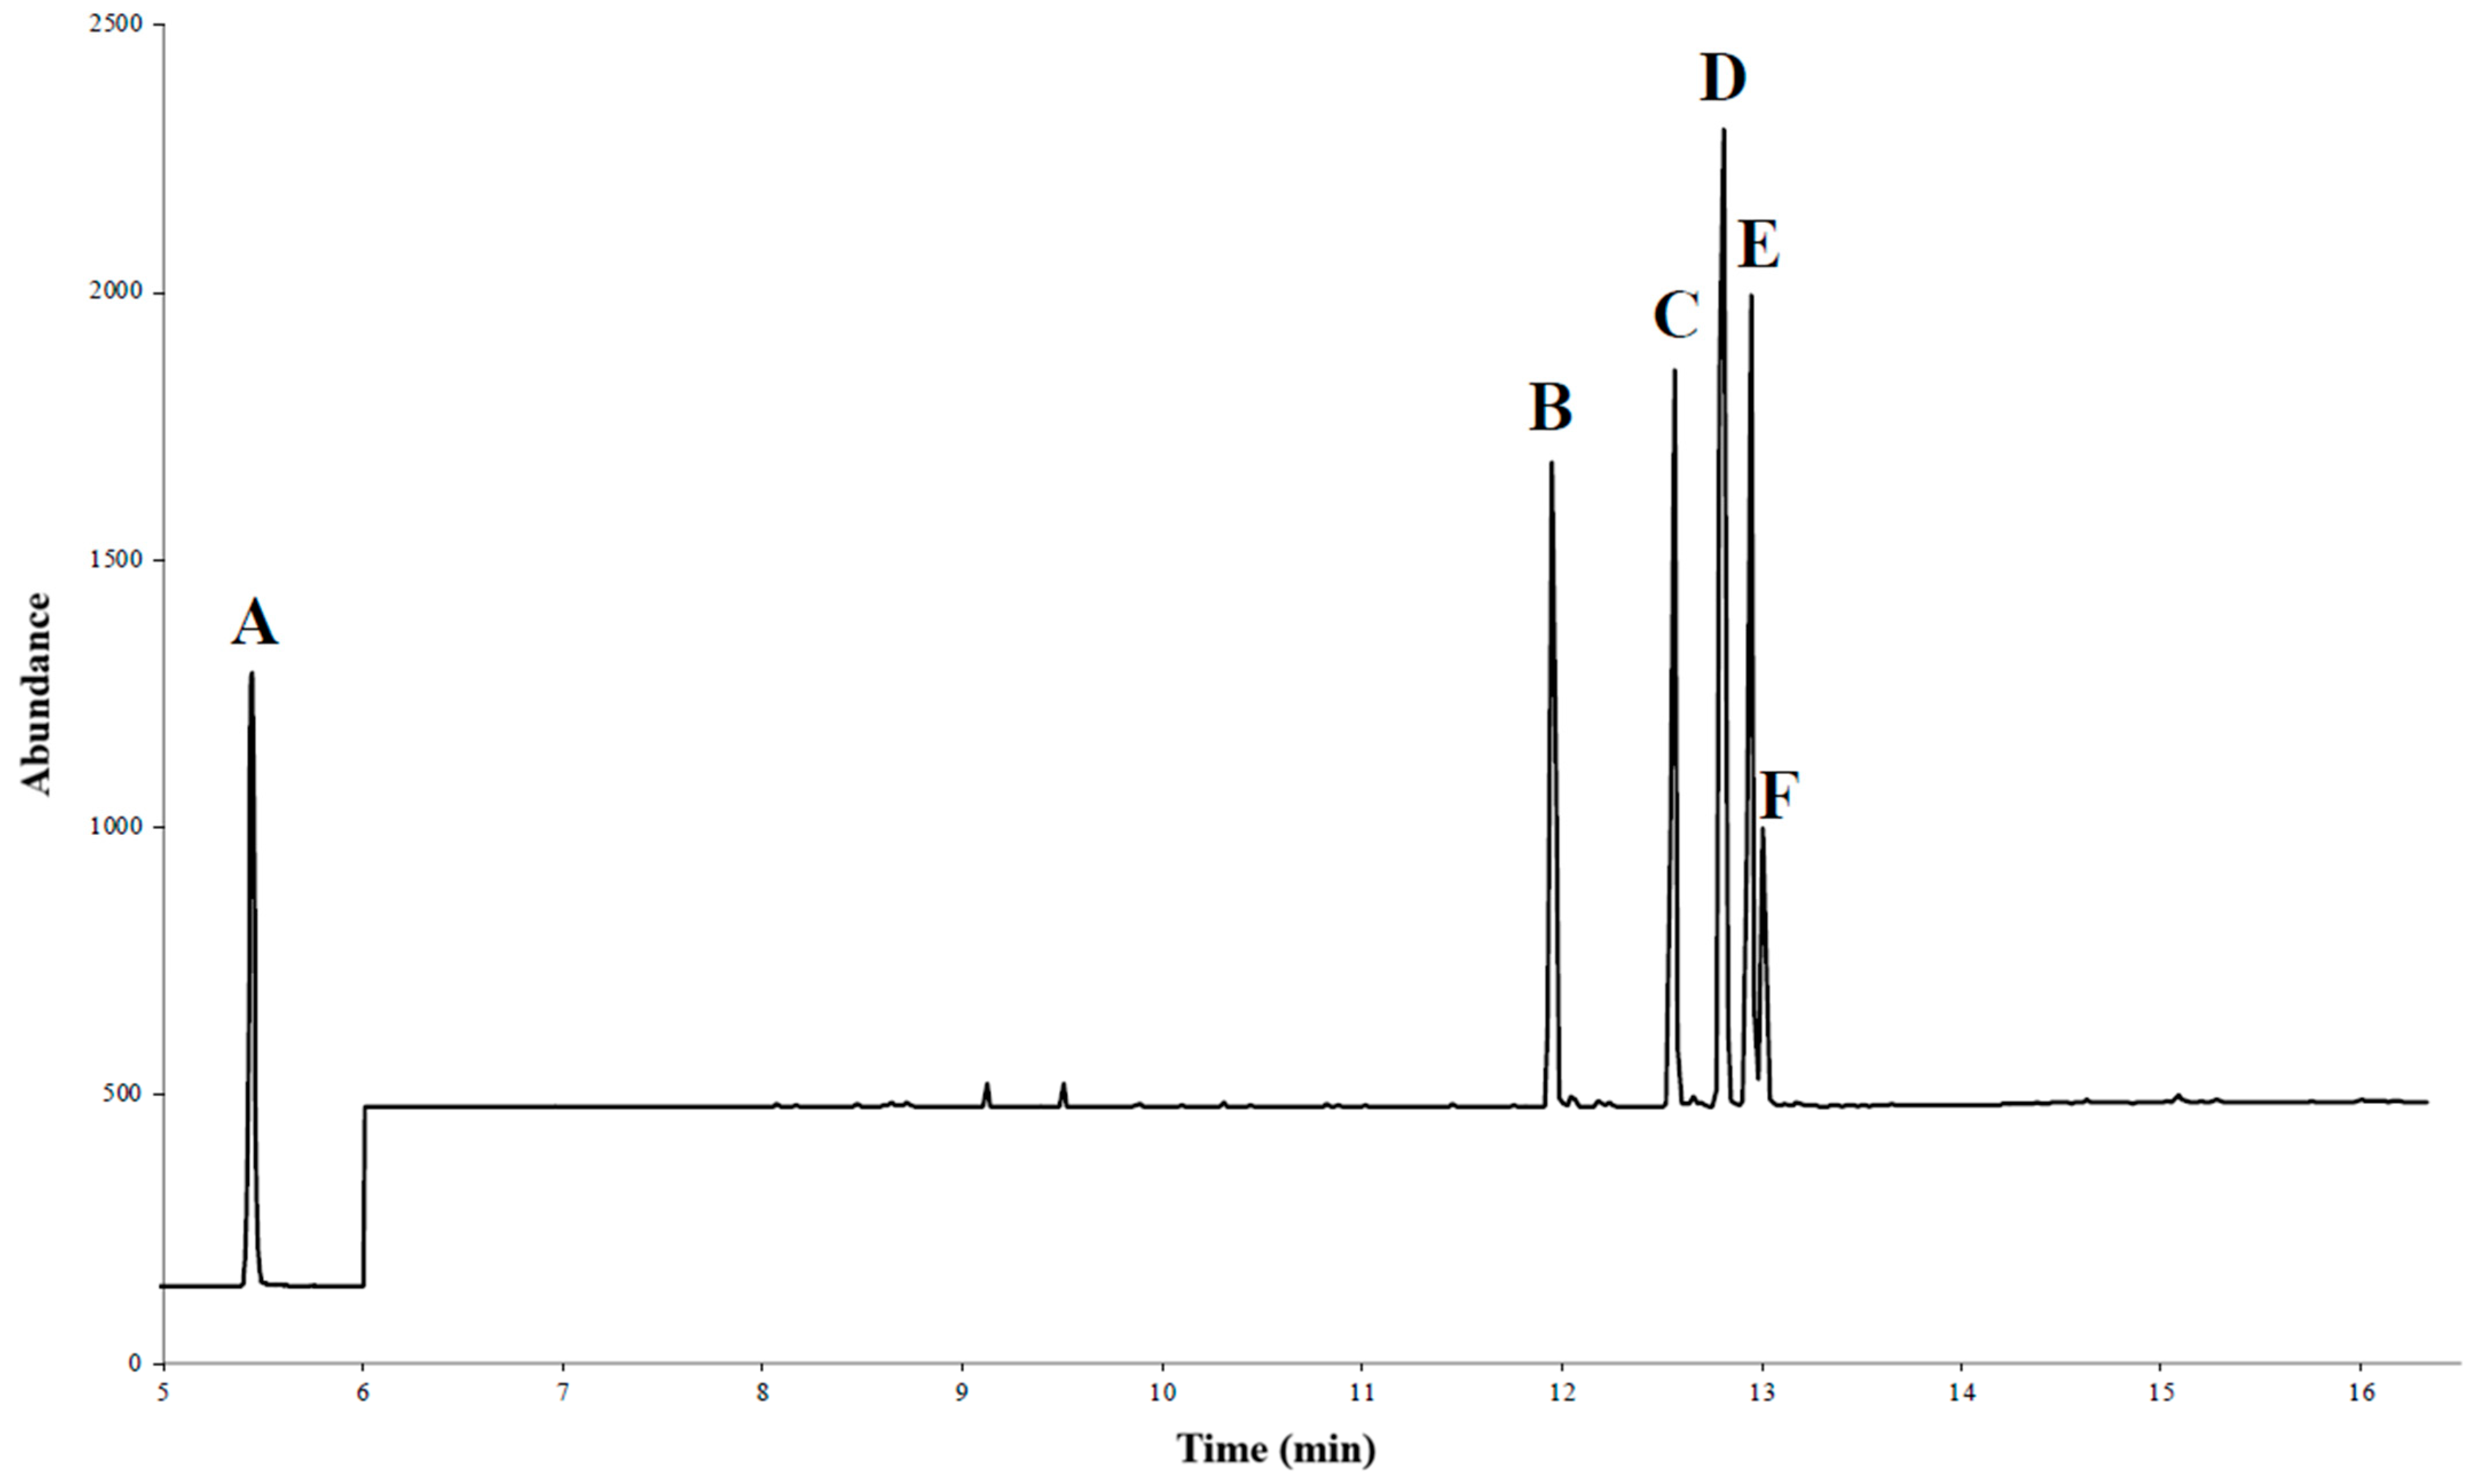
Figure 1. Chromatogram obtained by GC-MS(SIM) of cannabinoids under optimized instrumental conditions (splitless (280 °C), oven at 50 °C (2 min), 2.5 °C/min to 60 °C, 60 °C/min to 240 °C, then 30 °C/min to 300 °C (2 min)) (legend: A—IS; B—CBD; C—9S-HHC; D—∆8-THC; E—∆9-THC; F—9R-HHC).
Separations 13 00134 g001
Figure 2. Graphical representation of the derivatization process with analyte peak area/PI peak area vs. time.
Separations 13 00134 g002
Figure 3. Effect of the selectivity of polymers and ACs on the recovery of cannabinoids (CBD, Δ8-THC, Δ9-THC, 9S-HHC and 9R-HHC) by BAμE/GC-MS(SIM). Assay conditions: microextraction for 1 h at 1000 rpm, back-extraction with 100 μL of MeOH and subsequent ultrasonic treatment for 45 min.
Separations 13 00134 g003
Figure 4. Optimization of BAμE/GC-MS(SIM) parameters for cannabinoid analysis (CBD, ∆8-THC, ∆9-THC, 9S-HHC and 9R-HHC): effect of back-extraction time (a), back-extraction solvent (b), equilibration time (c) and agitation speed (d) on cannabinoid recovery.
Separations 13 00134 g004
Figure 5. Effect of matrix pH (a), organic modifier content (b), ionic strength (c) and temperature (d) on cannabinoid (CBD, ∆8-THC, ∆9-THC, 9S-HHC and 9R-HHC) recovery by BAμE/GC-MS(SIM).
Separations 13 00134 g005
Figure 6. Chromatogram obtained by BAμE/GC-MS(SIM) under optimized experimental conditions, relating to control solutions (2.5 μg/mL) and sample 2 (splitless (280 °C), oven at 50 °C (2 min), 2.5 °C/min to 60 °C, 60 °C/min to 240 °C, then 30 °C/min to 300 °C (2 min)).
Separations 13 00134 g006
Figure 7. Evaluation of the sample preparation using the AGREEprep metric (a) and the practical applicability using BAGI (b).
Separations 13 00134 g007
Table 1. Selected ions in SIM mode and retention time for each cannabinoid.
CompoundSelected Ions (m/z)tR (Min)
IS167, 246, 2485.340
CBD301, 337, 39011.880
9S-HHC332, 345, 38812.472
8-THC303, 330, 38612.717
9-THC303, 371, 38612.852
9R-HHC332, 345, 38812.920
Underline: molecular ions; italic: base peaks; bold: quantification ions.
Table 2. LOD and LOQ values, working range, and coefficients of determination (r2) obtained for each cannabinoid under study for instrumental calibration by GC-MS(SIM).
CompoundLOD (ng/mL)LOQ
(ng/mL)
Working Range (ng/mL)r2
CBD1653160–50000.9981
9S-HHC39130160–50000.9968
8-THC1653160–50000.9986
9-THC1653160–50000.9976
9R-HHC39130160–50000.9995
Table 3. LOD and LOQ values, working range and coefficients of determination (r2) obtained for each cannabinoid under study for validation of the BAμE/GC-MS(SIM) methodology.
CompoundLOD (ng/mL)LOQ (ng/mL)Working Range (ng/mL)r2Recovery ± RSD
(%)
CBD1.254.135–3000.997180.6 ± 1.7
9S-HHC1.254.135–3000.996565.5 ± 1.6
8-THC1.254.135–3000.997869.4 ± 4.1
9-THC1.254.135–3000.996867.9 ± 1.6
9R-HHC1.254.135–3000.996357.3 ± 1.3
Table 4. Repeatability, inter-day precision and inter-day accuracy.
RepeatabilityInter-Day PrecisionInter-Day Accuracy
CompoundLowMediumHighLowMediumHighLowMediumHigh
CBD17.511.312.713.29.58.519.2−3.4−2.2
9S-HHC19.013.614.2117.211.410.3−18.86.45.6
8-THC16.012.914.712.310.59.4−18.11.86.8
9-THC9.512.114.56.18.69.5−3.76.513.1
9R-HHC8.411.710.05.88.87.85.013.210.9
Low: 15 ng/mL; medium: 150 ng/mL; high: 240 ng/mL.
Table 5. Concentrations of cannabinoids under study in saliva samples from volunteers determined by BAμE/GC-MS(SIM).
CompoundConcentration (ng/mL)
Sample 1Sample 2Sample 3
CBD67.4191.219.2
9S-HHC68.7190.79.5
8-THC<LOD4.4<LOD
9-THC486.6672.9668.0
9R-HHC47.1143.1299.4
Disclaimer/Publisher’s Note: The statements, opinions and data contained in all publications are solely those of the individual author(s) and contributor(s) and not of MDPI and/or the editor(s). MDPI and/or the editor(s) disclaim responsibility for any injury to people or property resulting from any ideas, methods, instructions or products referred to in the content.